
- Research
- Open access
- Published:
- Sasha Yogiswara1,2,
- Jonas Rombout1,2,
- Giovanni Micharikopoulos1,
- Sam De Craemer3,4,
- Beatriz Herrera-Malaver1,2,
- Lotte van Landschoot1,2,
- Sofie Mannaerts1,2,
- Marcelo do Amaral5,
- Karin Voordeckers1,2,
- Stijn Spaepen1,2,
- Jan Steensels1,2,
- Quinten Deparis1,2,
- Bart Ghesquière3,4 &
- …
- Kevin J. Verstrepen1,2
Biotechnology for Biofuels and Bioproducts volume 18, Article number: 86 (2025) Cite this article
Abstract
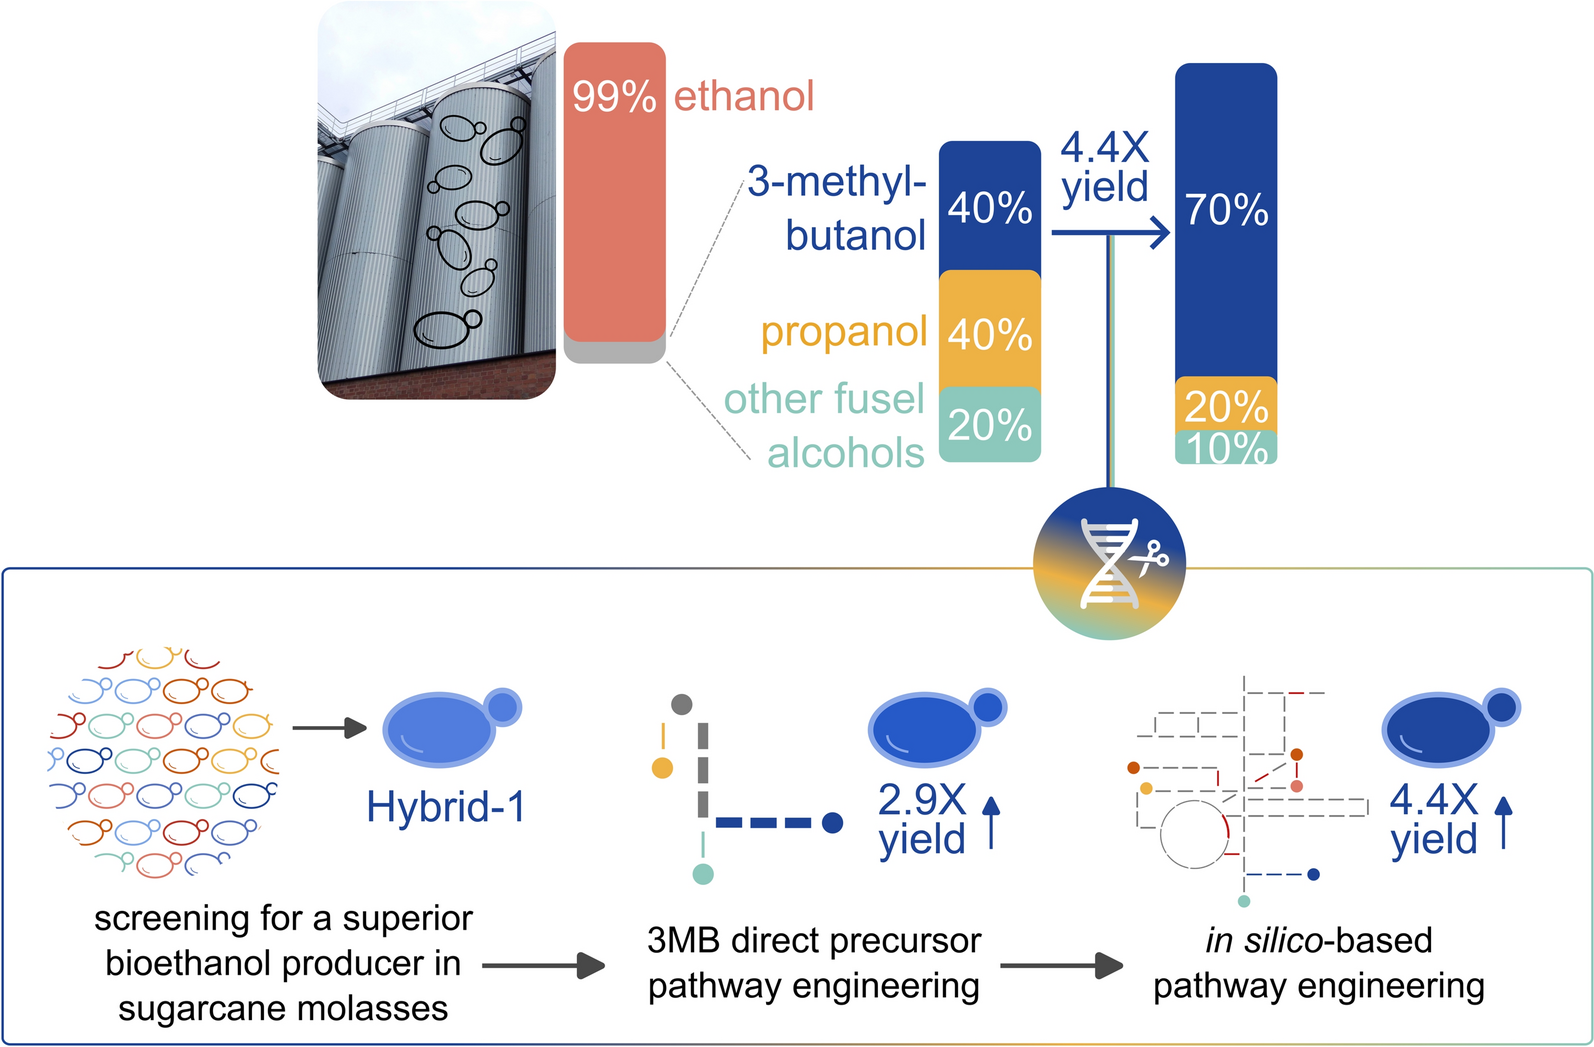
3-Methyl-1-butanol (3MB) is a promising renewable solvent, drop-in fuel, and precursor for various industrial products, including flavors, fragrances, and surfactants. Due to the myriad of intertwined biosynthetic pathways that share metabolic precursors, conventional metabolic engineering strategies to overproduce 3MB in yeast have typically resulted in yields that are far too low for economic viability. However, because 3MB is naturally produced by yeast, 100 million liter of 3MB are already produced annually as a byproduct of bioethanol fermentations. Despite its significant commercial value, this 3MB fraction is currently discarded due to its low relative concentration within the fusel alcohol mixture. Here, we present a novel strategy to produce 3MB along with the conventional bioethanol fermentation, leveraging the existing bioethanol industry by valorizing the discarded fusel alcohol byproduct stream. We first identified a robust industrially relevant chassis strain and explored different strategies to alleviate the valine and leucine feedback inhibition within the 3MB pathway, showing that mutating the leucine-inhibition site of Leu4p increased 3MB yield by 2.9-fold. Finally, we tested in silico-predicted gene deletion targets to reduce the byproduct acetate. Our final engineered strain achieved a 4.4-fold increase in 3MB yield compared to the wild type (1.5 mg/g sugars), average productivity of 5 mg/Lh, and a 3MB proportion increase from 42 to 71% within the fusel alcohol mix, while ethanol production remained comparable to the Ethanol Red® industrial reference. Our study thus opens a new route for co-producing 3MB and ethanol from sugarcane molasses in Saccharomyces cerevisiae, laying the groundwork toward an economically viable and sustainable approach for 3MB production alongside existing bioethanol production.
Graphical Abstract

Introduction
3-Methyl-1-butanol (3MB) is gaining interest as a renewable solvent and drop-in fuel [1], with its global market valued at over $90 million in 2022, and estimated to increase to over $290 million by the end of 2031 [2]. In addition, 3MB also serves as a platform chemical, for example, for conversion to esters or other high-density molecules, for applications in the flavor, fragrances, pharmaceutical, surfactant, or plasticizer industries [3,4,5]. Currently, industrial-scale 3MB production relies on petrochemical synthesis [6], which is inherently unsustainable due to its dependence on fossil resources and high carbon footprint. The increasing demand for 3MB and the cumbersome industrial production result in a market price that is about fourfold higher than that of ethanol ($2/L vs $0.5/L) [7]. The growing demand for sustainable chemicals and high intrinsic value thus make 3MB a valuable target for microbial-based production, offering economic opportunities and environmental benefits by reducing reliance on fossil-derived chemicals.
3MB can be naturally produced by the yeast Saccharomyces cerevisiae as a byproduct during bioethanol fermentation, along with other fusel alcohols, such as propanol, 2-methyl-1-butanol (2MB), and isobutanol. The fusel alcohols are synthesized as byproducts of the leucine and valine biosynthetic pathways. More specifically, 3MB is derived from α-ketoisocaproate (α-kic), an intermediate of the leucine biosynthetic pathway involving the Ilv and Leu enzymes. α-kic is further decarboxylated by α-ketoacid decarboxylases (Pdc) and finally reduced by alcohol dehydrogenases (Adh) to form 3MB (Fig. 1) [8, 9].

Fusel alcohol biosynthesis in Saccharomyces cerevisiae. Modified genes in this study are in bold with asterisks (*). Enzymatic steps performed by enzymes of the same genes are depicted in the same color. Dashed lines (—) depict simplified multi-step pathways, and dot-dashed lines (- – – –) depict regulation mechanisms
Efforts to increase microbial 3MB production through metabolic engineering face several challenges. The biosynthetic pathway competes for pyruvate with the primary metabolic route of ethanol formation. Moreover, promiscuous Ilv, Pdc, and Adh enzymes catalyze multiple reactions, leading to a mixture of metabolites, i.e., ethanol, 2MB, and isobutanol, simultaneously [8]. Another challenge lies in overcoming the tight regulation of the leucine and valine biosynthetic pathway. These pathways are subject to feedback inhibition, where pathway intermediates directly inhibit the activity of key enzymes [10]. For example, valine inhibits the activity of the Ilv2–Ilv6 protein complex [11], while leucine inhibits the activity of Leu4p [12]. Additionally, the transcriptional regulator Leu3p provides another layer of regulation, acting as an activator induced by the intermediate α-isopropylmalate. Leu3p regulates the transcription of at least five genes involved in leucine and valine biosynthesis [13]. The combination of these genetic modifications to alleviate regulatory inhibition has never been attempted before to enhance 3MB production.
Several studies have attempted to overproduce 3MB as a standalone product in S. cerevisiae. Common strategies include increasing the flux through the valine and leucine biosynthetic pathways by overexpressing the corresponding genes [14,15,16]. Innovative approaches have involved relocalizing the leucine biosynthetic enzymes to the mitochondria [16, 17] or relocalizing the valine biosynthetic enzymes to the cytosol and introducing protein scaffolds to bypass the native compartmentalized α-isopropylmalate biosynthesis [14]. Another study boosted 3MB production by overexpressing the mitochondrial α-isopropylmalate transporter (OAC1) [18]. Despite extensive engineering, the best 3MB titer, yield, and productivity remain low when 3MB is the sole fermentation product, at a titer of 1.24 g/L, yield of 12.4 mg/g glucose, and productivity of 0.026 g/Lh [16, 18].
Despite the relatively high market price of 3MB, the current microbial production yield of 12.4 mg/g glucose is far too low to be economically viable as a standalone fermentation product. Given that 3MB is already produced as a byproduct of bioethanol fermentation, this study explores the potential of co-producing 3MB alongside bioethanol. Bioethanol is produced on a massive scale, with an annual global production exceeding 110 billion liter and a market value of over 80 billion USD [19, 20]. During bioethanol fermentation, fusel alcohols—including 3MB—are naturally produced, typically reaching volumes of about 0.25% relative to ethanol [21]. Importantly, despite these low relative amounts, the vast scale of bioethanol production results in fermentation-based 3MB being generated at a hundred-million-liter scale annually.
However, since the fusel alcohol byproduct stream generated during bioethanol distillation contains a mixture of different fusel alcohols in similar relative amounts (3MB, propanol, isobutanol), further purification is needed to isolate 3MB of sufficient purity, while the absolute concentration would still be low [9]. Because of these extra costs, fusel alcohols are currently burned as waste to fuel bioethanol distillation columns [5]. This discarded fusel alcohol byproduct presents a unique economic opportunity. Increasing the yield and purity of 3MB in this byproduct stream may help create additional revenue for bioethanol producers and valorize the fusel alcohol side stream. Unlike conventional strategies where strains are engineered solely for 3MB production [14,15,16,17, 22], valorizing this waste stream does not require additional OPEX or CAPEX costs.
The key challenge is to increase the proportion of 3MB within the fusel alcohol stream, so that recovery and purification become more cost-effective, improving price competitiveness against fossil-based 3MB. Another challenge is to increase 3MB levels without affecting ethanol production, allowing bioethanol producers to generate an additional revenue stream (3MB) while maintaining their main revenue (bioethanol).
To address these challenges, we developed a superior bioethanol-producing strain that co-produces 3MB with higher yield, productivity, and greater purity in high-density sugarcane molasses. First, we screened for superior S. cerevisiae strains that grew robustly in sugarcane molasses, a prime substrate for the current biofuel industry, and produced superior levels of ethanol. We then engineered these strains to enhance 3MB production by modifying the regulation of the valine and leucine biosynthetic pathways, analyzing intermediate metabolites to identify pathway bottlenecks, and testing novel gene targets predicted via an in silico metabolic model. The best engineered strain produces 3MB at a yield of 1.5 mg/g sugars and an average productivity of 5 mg/Lh, representing a 4.4-fold yield increase over the original wild-type strain and higher than previously reported numbers. In addition, the proportion of 3 MB among all fusel alcohols increased from 42 to 71% without compromising ethanol yield.
Materials and methods
Strains
The screening experiment used 1020 Saccharomyces cerevisiae strains from an in-house collection isolated from different niches (Supplementary Table 1). The collection was expanded from the original study of 157 S. cerevisiae strains [23]. The strains used for metabolic engineering and their genotypes are listed (Supplementary Table 2).
Strains construction
CRISPR-Cas9 was used for genomic DNA modification and DNA materials were transformed into S. cerevisiae strains via the electroporation method (“Yeast transformation via electroporation” section).
DNA materials preparation
The pV1382 plasmid (Addgene #111436) was used to express the Cas9 enzyme and sgRNA [24]. To make the desired gRNA, two forward and reverse oligonucleotides (Supplementary Table 3) were annealed and phosphorylated (T4 polynucleotide kinase, NEB). The annealed sgRNA oligo was then ligated into the pV1382 backbone, previously digested (BsmBI, NEB), and dephosphorylated (Quick CIP, NEB). The repair template for DNA repair was amplified using PCR (GXL Primestar, TaKaRa), using primer oligos listed in Supplementary Table 3. The constructed pV1382 plasmids and repair templates were then transformed into the yeast cells.
The hygromycin resistance marker gene (hphMX6) used to replace genes in Figs. 6, 7 is obtained from plasmid pMV_hyg [25].
Yeast transformation via electroporation
Transformation of S. cerevisiae strains was based on a reported protocol [26]. 1 mL of overnight culture in YPD containing 10 g/L yeast extract (Neogen), 20 g/L peptone (Neogen), and 2 g/L glucose (Sigma-Aldrich), at 30 °C was inoculated into 50 mL YPD in 200 mL Erlenmeyer flasks and cultured for 4 h at 30 °C and 200 rpm. Cultures were then centrifuged at 3000 rpm for 3 min, and the supernatant was discarded. 25 mL of conditioning buffer [0.1 M lithium acetate (VWR), 1X TE buffer pH 8 (1 mM EDTA (Sigma-Aldrich), 10 mM Tris–HCl (Formedium)], 0.1 M dithiothreitol (Sigma-Aldrich) was added, cells resuspended, and incubated for 50 min at room temperature. Cultures were centrifuged at 4 °C, 3000 rpm, and 3 min, and supernatant was removed completely. Cells were washed with 20 mL ice-cold sterile water twice, and then once with 10 mL ice-cold 1M sterile sorbitol (Sigma-Aldrich) solution. Supernatant was removed, and cells were resuspended in 0.5 mL ice-cold 1M sterile sorbitol. For each transformation: in a pre-cooled 1.5 mL microcentrifuge tube, 100 µL cell suspension, 400 ng plasmids, and 3–5 µg linear DNA (PCR product) were mixed gently, and incubated on ice for 10 min. The cells mixture was transferred to cold and dry electroporation cuvettes with 2 mm gap size, and was pulsed once at 2 kV using the MicroPulser Electroporator (Bio-Rad). 1 mL ice-cold 1:1 solution of YPD-1M sorbitol was added, transferred back to the microcentrifuge tube, and incubated for at least 4 h at 30 °C to allow expression of the resistance marker of the plasmid, then plated out on selected medium.
Colony PCR (SapphireAmp Fast PCR Master Mix, TaKaRa) using a template prepared by boiling the clone in 50 µL 0.02 M NaOH (99 °C, 10 min) to amplify the junction of desired insertion to identify positive transformants. For Ilv6N86A, Ilv2W586L, Leu4S542F A551V modifications, positive transformants were identified via PCR (GXL Primestar, TaKaRa) and Sanger sequencing (Eurofins genomics).
Sugarcane molasses media
Sugarcane molasses (Rietsuikermelasse, Stookwinkel, NL) was diluted using deionized water to reach sugar concentrations of around 300 g/L (SCM-300), 250 g/L (SCM-250), 220 g/L (SCM-220), or 40 g/L (SCM-40) (see “Sugars” section for sugar content analysis). The mixture was autoclaved at 110 °C for 10 min. A filter-sterilized concentrated stock of urea (500 g/L) was added to reach a final concentration of 5 g urea/300 g sugars. The final sugar composition is roughly 20% glucose, 20% fructose, and 60% sucrose.
Cultivation conditions
Strain screening in 384-well microtiter plates
Strain colonies were first inoculated in 30 µL SCM-40 in 384-well microtiter plates, and incubated overnight in a shaking platform at 30 °C. 2.5 µL of the overnight culture was then inoculated into 47.5 µL of SCM-300 in 384-well microtiter plates and incubated for 48 h in a shaking platform at 30 °C. The experiment was done with two biological replicates per strain. Absorbance (OD600) measurements were performed at times 0 h and 48 h using a plate reader (TECAN Infinite 200 Pro), and values were subtracted by the value of the blank (uninoculated media). Although other phenotyping experiments in glass vials and flasks were done at 32 °C, in this step, 30 °C was used to avoid excessive media evaporation to maintain consistency across all wells in the microtiter plate.
Strain phenotyping in glass vials
Strain colonies were first inoculated in 5 mL SCM-40 in 20 mL screw-neck clear headspace glass vials (Shimadzu) with a small stirring bar and a septum cap pierced with a needle to allow CO2 to escape. After 24 h at 32 °C with constant stirring (550 rpm), 108 cells of the culture were inoculated to 10 mL SCM-200 in 20 mL glass vials with the same setup. The fermentation started at 107 cells/mL and was incubated for 44–52 h at 32 °C and 550 rpm. The fermentation was ended when the weight difference was < 10 mg per 2 h. 32 °C was used to reflect the standard temperature that occurs in industrial-scale bioethanol fermentation [27].
Strain phenotyping in flasks
Strain colonies were first inoculated in 50 mL SCM-40 in 200 mL Erlenmeyer flasks and incubated overnight at 200 rpm at 32 °C. The overnight culture was then centrifuged (3000 rpm, 3 min), supernatant removed, and resuspended in around 1 mL of sterile deionized water. The number of cells was measured using a cell counter (TC20 Automated Cell Counter, Bio-Rad). 109 cells of the overnight culture were inoculated into 100 mL of SCM-220 (Fig. 3) or SCM-250 (Figs. 4, 5, 6, 7) in a 200 mL flask and capped using an S-shaped airlock. Samples were incubated at 32 °C, 150 rpm, for 48 h (Figs. 5, 6, 7), or until weight difference is ≤ 1 g/L per 2 h (Figs. 3, 4), indicating that sugar utilization has reached its maximal.
Fermentation phenotyping
Sugars
The culture supernatant was diluted 8000X and filtered (0.22 µm polyethersulfone syringe filter, VWR), and rhamnose as an internal standard was added to a final concentration of 10 µg/mL. External standards containing rhamnose, glucose, fructose, and sucrose were used at 1, 5, 10, 15, and 20 µg/mL concentrations.
Sugars were analyzed using high-performance anion-exchange chromatography with pulsed amperometric detection (DIONEX ICS-5000 + DC, Thermo Fisher Scientific). The column CarboPac PA20 (3 × 150 mm) was preceded by a guard column CarboPac PA20 (3 × 30 mm) (Thermo Fisher Scientific), both kept at 30 °C. The analyses were performed in gradient mode of milli-Q water (A), NaOH 250 mM (B), and 500 mM CH3COONa + 100mM NaOH (C) (−5 min (equilibration): 58% B, 0 min: 58% B, 1.5 min: 58% B + 10% C, 5 min: 58% B + 20% C, 8 min: 100% C) and the flow rate was 0.4 mL/min. The injection volume was 10 µL. The classical pulsed amperometric detection (PAD), triple potential with a gold working electrode (Dionex Gold Disposable Electrode, Thermo Fisher Scientific) was used as the detector.
Fusel alcohols
5 mL of supernatant was added to a 20 mL glass GC vial containing 1.75 g NaCl (VWR). External standards containing propanol, isobutanol, 2MB, and 3MB (all procured from Sigma-Aldrich) were used at concentrations between 0.03 and 5 mM, depending on the abundance of the compound in the fermentation broth.
Fusel alcohols were analyzed using headspace gas chromatography/mass spectrometry (GCMS-QP-2010 Ultra, Shimadzu), based on a previously reported method [14] with slight adjustments. The GC–MS was equipped with a low polarity RXi-5Sil MS column (length, 20 m; internal diameter, 0.18 mm; layer thickness, 0.18 µm; Restek). Each sample was incubated at 40 °C in the autosampler for 10 min with constant agitation. 0.5 mL of headspace sample was then injected in split mode (split ratio 20) at 225 °C, a total flow of 24 mL/min, a column flow of 1 mL/min, and a purge flow of 3 mL/min. For the column oven, the temperature was first held at 40 °C for 5 min and then allowed to rise to 45 °C at a rate of 5 °C/min and 1 min hold time, followed by a second ramp of 30 °C/min with a final temperature of 230 °C. The mass acquisition range was 35 to 100 amu at a scan rate of 232 scans/s, between times 1.9–11 min, with a solvent cut time of 1.8 min. The interface and ion source were kept at 230 °C and 225 °C, respectively.
Ethanol (Figs. 2, 3, 4)
Near-infrared analysis (Alcolyzer Beer ME System, Anton Paar) was used to measure ethanol. Measurements comprised 10 mL of culture supernatant and 30 mL of dH2O (4X dilution), and a 10% EtOH solution was used for calibration.
Ethanol, glycerol, and acetate (Figs. 5, 6, 7)
The culture supernatant was diluted 20X and filtered (0.22 µm polyethersulfone, VWR). External standards were used for ethanol (0.04–40 g/L), glycerol (0.02–40 g/L), and acetate (0.03–40 g/L) (all procured from Sigma-Aldrich). Ethanol, glycerol, and acetate were analyzed using high-performance liquid chromatography with an Aminex HPX-87H column (300 × 7.8 mm) (Bio-Rad) column and a refractive index detector (Acquity Arc HPLC, Waters). 5 mM H2SO4 solution [prepared by diluting 2M sulphuric acid (VWR chemicals) 400 times] was used as a mobile phase at a flow rate of 0.6 mL/min. The injection volume was 20 µL. The run time was 30 min. The samples were isocratically separated. The autosampler temperature was 8 °C, the column temperature was 50 °C, and the RI flow cell temperature was 35 °C.
Weight loss
Fermentation flasks were weighed at the beginning, during, and at the end of the fermentation to estimate carbon dioxide production and losses from water evaporation from the S-shaped airlock. Blank flasks containing media without cells were used to take into account water evaporation.
Cell dry weight
At the end of fermentation, 1 mL of well-mixed culture was aliquoted into a pre-weighed microcentrifuge tube and washed twice with Milli-Q water. After a final centrifugation step, the supernatant was removed, and the pellet was dried overnight in an oven at 60 °C. The dried biomass was then weighed, with the initial tube weight subtracted to determine the final biomass weight. An uninoculated medium sample was processed identically to account for any solid particles present in the media, and this value was subtracted from the dried biomass measurements.
Intracellular metabolomics
Sample preparation
Cells were counted (TC20 Automated Cell Counter, Bio-Rad), and at least 106 cells were transferred to a new 1.5 mL microcentrifuge tube. The cells were centrifuged (3000 rpm, 5 min, 4 °C), and supernatant was discarded. Cells were washed with 1 mL of ice-cold washing solution (0.9% NaCl in milli-Q water), centrifuged, and washing solution was removed. 300 µL of − 20 °C extraction buffer (80/20 MeOH/water with internal standard) was added using pre-cooled clear pipette tips. Tubes were vortexed until the pellet was completely dissolved and the solution was cloudy. Samples were stored overnight at − 80 °C, then centrifuged (20,000×g, 4 °C, 10 min). The supernatant was transferred to a new tube and used for metabolite analysis. Different methods were used for different metabolites.
For liquid chromatography–mass spectrometry (LC–MS) methods, the supernatant was then transferred to MS vials. For split injection gas chromatography–mass spectrometry (GC–MS) methods, 100 µL of the supernatant was transferred and evaporated to dryness on a speed vac. A 2% methoxyamine (MOX) solution was prepared by dissolving methoxyamine hydrochloride (Supelco, ref 226904-5g) in pyridine (Sigma-Aldrich, ref 270970-1L). 25 uL MOX solution was added to each sample then left to react for 1.5 h at 37 °C for methoximation of aldehyde and ketone groups. Afterward, 80 uL N,O-Bis(trimethylsilyl)trifluoroacetamide (BSTFA) with 1% trimethylchlorosilane (TMCS) (Supelco, ref 15238) was added and left to react for 45 min at 60 °C for trimethylsilylation of amino, alcohol or acid groups. The samples were left in the dark overnight to maximize the reaction efficiency; then, they were divided into 2 aliquots in different mass spec vials for GC–EI–MS and GC–SICRIT–MS analyses.
Ion-pairing liquid chromatography–MS (QEx)
Pyruvate, α-ketoisovalerate, ketoleucine (α-ketoisocaproate), 2,3-dihydroxyisovalerate, α-isopropylmalate, and 3-isopropylmalate were measured using a Dionex UltiMate 3000 LC System (Thermo Scientific Bremen, Germany) coupled via heated electrospray ionization to a Q Exactive Orbitrap to a Q Exactive Orbitrap mass spectrometer (Thermo Scientific Bremen, Germany). 10 μL sample was taken from an MS vial and injected onto a 15 cm C-18 column (Acquity UPLC -HSS T3 1. 8 μm; 2.1 × 150 mm, Waters). A step gradient was carried out using solvent A (10 mM TBA and 15 mM acetic acid in 95/5 milliQ/MeOH) and solvent B (100% methanol). The gradient started with 100% solvent A until 13 min post-injection. A linear gradient to 33.3% B was carried out until 14 min and increased to 36.4% until 25 min. Between 25 and 26 min, the gradient increased to 90.9% of B and remained like this for 4 min. At 30 min the gradient returned to 100% A. The chromatography was stopped at 40 min. The flow was kept constant at 0.25 mL/min and the column at 40 °C throughout the analysis. The HESI-source operated at negative polarity mode using a spray voltage of 4.8 kV, sheath gas at 40, auxiliary gas at 10, and the latter heated to 260 °C. The ion transfer capillary temperature was 300 °C. The mass spectrometer operated in full scan (range [70.0000–1050.0000]) and AGC target was set at 3.0E+006 using a resolution of 140,000. Data collection was performed using the Xcalibur software (Thermo Scientific). The data analyses were performed by integrating the peak areas (El-Maven-Elucidata).
HILIC LC–MS
Valine was measured using HILIC liquid chromatography–mass spectrometry, performed using a Vanquish LC System (Thermo Scientific) coupled via heated electrospray ionization to a Q Exactive Orbitrap Focus mass spectrometer (Thermo Scientific). 10 μL sample was taken from an MS vial and injected onto a 15 cm Poroshell 120 HILIC-Z PEEK Column (Agilent InfinityLab). A linear gradient was carried out starting with 90% solvent A (acetonitrile) and 10% solvent B (10 mM NH4-formate in milli-Q water, pH 3.8). From 2 to 12 min the gradient changed to 60% B. The gradient was kept on 60% B for 3 min and followed by a decrease to 10% B. The chromatography was stopped at 25 min. The flow was kept constant at 0.25 mL/min and the column was kept at 25 °C throughout the analysis. The HESI-source operated at positive polarity mode using a spray voltage of 3 kV, sheath gas at 45, auxiliary gas at 10, and the latter heated to 260 °C. The ion transfer capillary temperature was 320 °C. The mass spectrometer operated in full scan (range [70.0000–1050.0000]) and AGC target was set at 3.0E+006 using a resolution of 70,000. Data collection was performed using the Xcalibur software (Thermo Scientific). The data analyses were performed by integrating the peak areas (El-Maven-Elucidata).
Hard ionization–GC–MS
To measure leucine, one microliter of each methoximated and trimethylsylilated sample was injected by 10:1 split injection by an Agilent Technologies 7693 autosampler (Agilent Technologies, Santa Clara; California) into an Agilent 7890 A gas chromatograph equipped with an 30 m 0.25 mm i.d fused silica capillary column with a chemically bonded 0.25 µm HP-5MS stationary phase (Agilent J&W GC columns, Folsom; California, ref 19091S-433). The injector temperature was 250 °C, and the septum purge flowrate was 3 mL/min. The helium flow rate through the column was 0.6 mL/min, Routine gc gradient: the column temperature was held at 50 °C for 1 min, then increased by 10 °C/min to 300 °C, and was held there for 3 min. Subsequently, the temperature was increased by 100 °C/min to 325 °C, and held for 1.75 min. The column effluent then entered an Agilent 7000 triple quadrupole mass spectrometer (Agilent Technologies, Santa Clara; California). The transfer line and the electron impact ion source temperatures were 250 and 230 °C, respectively. Ions were generated by a 70 eV electron beam, and ion fragments were separated using an MS1 scan from 50 to 600 da. Leucine was relatively quantified by integrating the peak area of the 158 da fragment (El-Maven-Elucidata), which was confirmed by the 260 da fragment and separated chromatographically from isoleucine.
Soft ionization–GC–MS
Acetolactate was measured with a gas chromatography identical to the hard ionization–GC–Electron Impact-MS method, except GC was a Trace 1610 GC (Thermo Scientific Bremen, Germany) and the helium flow rate was 1.555 mL/min. However, the ionization and mass spectrometry approaches were different. The GC was linked by a transfer line (Plasmion GmbH, Augsburg, Germany) to the SICRIT GC/SPME module (Plasmion GmbH, Augsburg, Germany), which serves to guide the helium gas exiting the GC column to an SICRIT cold plasma ion source (Plasmion GmbH, Augsburg, Germany), installed on an Exploris 120 orbitrap mass spectrometer (Thermo Scientific Bremen, Germany). The transfer line and GC/SPME module were heated to 280 °C, while the MS supplied an N2 gas stream of 2.31 L/min (2 arbitrary units in the Exploris 120 Tune Application) that was humidified by bubbling through Milli-Q water before entering the GC/SPME module. There, it carried the column effluent to the plasma in the SICRIT ion source. The plasma was generated by an AC electric field of 1500 V at 15 kHz. This soft ionization setup allows primarily [M+H+]+ ions to be generated. The mass spectrometer operated in full scan (range [90.0000–900.0000]) and positive mode at a capillary temperature of 250 °C. The AGC target was set at 100% (1 E6 ions) using a maximum injection time of 90 ms, 3 microinjections, and a resolution of 15,000. Data collection was performed using the Xcalibur software (Thermo Scientific). The data analyses were performed by integrating the peak areas of high-resolution parent ion masses (El-Maven-Elucidata).
In silico gene deletion prediction
The genome-based metabolic model Yeast GEM 8.7.1 [28] was used for in silico simulations in this study. Model boundaries were modified to simulate the conditions in this study by changing the lower (lb) and upper bounds (ub) of specific reactions. Glucose uptake was set at − 10 mmol/g DCW h−1 (lb = − 10). Oxygen uptake was disabled (lb = 0) to simulate bioethanol fermentation that often occurs under oxygen-limited environments. Ethanol was set at 15.64 mmol/g DCW h−1 (lb = 15.64) as maintaining high ethanol production was a desired phenotype. No maintenance (b = 0). 3MB export was set as the model objective.
The OptKnock framework [29] was used to identify gene deletion targets. 3MB export was set as the objective function, and propanol/isobutanol/acetate export was set to 0 as an extra constraint. The set of reactions used to search for knockouts was curated by filtering out 1734 reactions, including exchange and transport reactions, spontaneous reactions (occurs without any enzyme), and reactions within the direct pathway toward isoamyl alcohol (Supplementary Table 4). The final set of reactions comprises 2397 reactions to look for knockouts from. The maximum number of solutions is 5. The number of genes to delete simultaneously varies between 1 and 4 genes, iteratively tried from low to high until a viable solution was obtained (Supplementary Table 5).
To see the effect of OptKnock-predicted gene deletions, a flux balance analysis was performed using the COBRA toolbox [30]. The in silico simulations were performed using COBRA Toolbox v2.43.0 [31] with Gurobi Optimizer (Gurobi Optimization Inc.) in Matlab 2024b (The Mathworks Inc.).
Statistical analyses
All statistical analysis was performed using R version 4.2.0 with R packages rstatix and dunn.test. To determine the statistical significance of the phenotype differences between mutants and their parents, we performed a t test, adjusting the p values for multiple comparisons using the Benjamini–Hochberg method, which controls the false discovery rate and makes the results less prone to false positives. For Figs. 3, 4, the p value asterisks refer to the significant difference to the wild-type strain. For Figs. 6, 7, the p value asterisks refer to the significant difference to the LEU4S542F A551V strain.
Results
High-throughput screening enabled the identification of superior bioethanol producers
Previous research from our team showed the enormous genetic and phenotypic variation across S. cerevisiae strains isolated from different niches [32,33,34]. This intraspecies diversity has also been observed in the context of bioethanol production using very high-gravity substrates [35] and lignocellulosic feedstocks [36]. We reasoned that preselection of the best natural yeast strains as a starting point for further optimization through genetic engineering would be a productive strategy to obtain superior strains showing high efficiency and productivity of both ethanol and 3MB. Using our collection of 1020 industrial and wild S. cerevisiae strains isolated from various niches, we first screened for strains that can grow on high concentrations of sugarcane molasses, which is a conventional and increasingly popular feedstock in the Brazilian bioethanol industry [21]. All strains were grown in 384-well microtiter plates on sugarcane molasses at high (300 g/L of sugars, denoted SCM-300) and low (diluted to 40 g/L of sugars, denoted SCM-40) concentrations.
While most strains grew relatively well in SCM-40, their performance in SCM-300 varied significantly (Fig. 2A). This variation highlights the stressful and highly selective nature of concentrated sugarcane molasses as a growth medium. The stress associated with SCM-300 is likely due to osmotic shock from high-sugar concentrations [37] or the presence of toxic compounds in molasses [38]. Additionally, although intuitively we would expect that top-performing strains capable of thriving under these harsh conditions would come mostly from the bioethanol niche, we found many robust strains from other niches, including ale, bread, sourdough, wild isolates, and wine yeast (Figure S1).
Hypothesizing that robust growth in high molasses concentration could lead to superior ethanol productivity in this media, we selected 79 strains with the highest growth in SCM-300 for a second screening step to test their ethanol productivity. To validate the results of our first screening, we also selected eight strains that grew well in SCM-40 but grew poorly in SCM-300 in the first screen. In addition, we also included S288c and CEN.PK 113-7d as laboratory benchmarks, and Ethanol Red® as industry benchmark. S288c is a widely used haploid laboratory strain [39], CEN.PK 113-7d is a laboratory strain widely used in metabolic engineering research [40], and Ethanol Red® is a rapid-fermenting bioethanol standard strain often regarded as a standard among commercial bioethanol yeasts [41] and as a thermo-tolerant strain [42].
This second screening revealed a positive correlation between the growth of the strains on SCM-300 and ethanol productivity (Fig. 2B, Figure S2). As expected, industrial strains outperformed the laboratory strains S288c and CEN.PK 113-7d, agreeing with the other studies that also use industrial conditions for yeast screening [35, 36, 42, 43]. Moreover, several strains showed better ethanol productivity than the industry standard Ethanol Red®. We selected eight superior ethanol producers isolated from various niches, including ale, wine, bioethanol, wild and hybrid strains, and Ethanol Red® as a benchmark for further engineering (Fig. 2B, Figure S2).

A Screening S. cerevisiae strains for growth on high-concentration sugarcane molasses (300 g/L sugars, SCM-300) compared to low-concentration (40 g/L sugars, SCM-40). Fast growers in SCM-300 (red) were selected, along with a few slow growers in SCM-300 (yellow), S288c lab strain (light blue), and Ethanol Red® (dark blue). The values represent the mean of two technical replicates, and error bars denote the standard deviation. B The ethanol productivity of a subset of strains was evaluated on SCM-200 to select nine superior ethanol producers. The values represent the mean of three biological replicates, and error bars denote the standard deviation. Selected: filled circles, unselected: hollow circles
Engineering valine and leucine biosynthetic pathways increased 3MB production
To improve 3MB production, instead of using the commonly used approach of overexpressing the ILV or LEU genes that could compromise ethanol production [15, 16], we opted to search for more subtle changes that could be achieved by modifying the regulation of the leucine and valine biosynthetic pathway. Previous studies have identified several mutations that alleviate the valine and leucine feedback inhibition. Specifically, the Leu4S542F A551V mutations disrupt the leucine-binding site of LEU4 [44], while the Ilv6N86A mutation disrupts the valine-binding site of the regulatory subunit Ilv6p of the Ilv2-Ilv6 complex [45]. Further, a mutation in the catalytic subunit Ilv2p, Ilv2W586L, increases its affinity to pyruvate by ninefold and increases its activity 1.4-fold [46]. Finally, the internal deletion of the regulatory site of Leu3p, where amino acids 173–773 were deleted (Leu3Δ601), makes the transcriptional activator constitutively active [47].
In this study, we evaluated—for the first time—the combined effects of these genetic modifications on 3MB production. To increase flux toward 3MB, we introduced Leu3Δ601, Ilv6N86A, Ilv2W586L, and Leu4S542F A551V, both individually and in combination, in the benchmark strain Ethanol Red®. The mutants were tested in flasks containing 100 mL SCM-220 media (220 g/L sugars). The mutations in Leu4S542F A551Vresulted in the largest effect on 3MB production (Fig. 3), increasing productivity by tenfold and the proportion of 3MB in the fusel alcohol mixture from 40 to 87%. Interestingly, strain Leu4S542F A551Vshowed a 9% increase in ethanol productivity, resulting in a shorter fermentation time (Figure S3) than the wild-type strain. Ilv6N86A significantly increased isobutanol and 2MB production, as reported previously [45]. However, it did not increase 3MB production, possibly due to leucine inhibition that still tightly regulates Leu4p activity and blocks more flux from going through the LEU pathway. Leu3Δ601 increased fusel alcohol production in general, but it significantly decreased ethanol productivity. When Leu3Δ601 was combined with other mutations, ethanol production and cellular growth are reduced considerably (Figure S3).

Engineering valine and leucine pathways for higher 3MB production in Ethanol Red®. The Leu4S542F A551Vmutant showed the highest 3MB increase in average productivity and purity. A Ethanol and fusel alcohol average productivity by different mutants. The values represent the mean of three biological replicates, and error bars denote the standard deviation. P values are depicted as asterisks (* p < 0.05, ** p < 0.01, *** p < 0.001, **** p < 0.0001) showing the statistical significance of the difference of all mutants compared to the wild type, calculated using the Benjamini–Hochberg method. B Titer of fusel alcohols at the end of the fermentation. The values represent the mean of three biological replicates, and error bars denote the standard deviation. Numbers in the bar for 3MB denote its proportion within the fusel alcohol mixture. The Leu4S542F A551Vmutant has the highest 3MB purity, reaching 87%. 2MB: 2-methyl-1-butanol, 3MB: 3-methyl-1-butanol
The effect of feedback-resistant Leu4p varied across strains
In the previous section, Leu4S542F A551V showed the largest effect on 3MB production. Therefore, we introduced this mutation using the CRISPR-Cas9 gene editing tool into the nine strains selected from the screening stage and tested them in glass vials containing 10 mL SCM-250. A higher SCM concentration was tested in this experiment to simultaneously evaluate the robustness of strains under conditions that better reflect industrial sugar concentrations.
Depending on the background strain, the Leu4p mutation affected 3MB and ethanol productivity differently (Fig. 4). While 3MB production increased for all strains, the absolute and relative increase differs between strains, highlighting the importance of strain selection. In addition, while statistical analysis suggests that ethanol production rates are largely unaffected, some strains seem to show a non-statistically significant decrease.
Among the strains that maintained high ethanol production after the Leu4p mutation, the strain Hybrid-1 shows the highest average ethanol productivity, surpassing Ethanol Red® by 6%. Hybrid-1 is a hybrid between a sake strain and a bioethanol strain. Additionally, the Leu4p mutation did not affect Hybrid-1’s superior ethanol yield (Figure S4). Based on its strong 3MB and ethanol production, we selected Hybrid-1 for further engineering.

Leu4S542F A551Veffect on 3MB and ethanol productivities varies across different background strains. The values represent the mean of three biological replicates, and error bars denote the standard deviation. Strain Hybrid-1 showed the highest 3MB productivity without compromising ethanol productivity while exceeding that of Ethanol Red®. Wildtype strains have patterned bars, Leu4S542F A551V mutants have solid-colored bars. A dotted horizontal line helps to compare the strains to Ethanol Red®
Metabolite analysis revealed α-ketoacid decarboxylation as a bottleneck
Based on our results of engineering the valine and leucine biosynthetic pathway (“Engineering valine and leucine biosynthetic pathways increased 3MB production” section), we identified the mutation Leu4S542F A551V that directly increased 3MB production without compromising ethanol production, likely due to reduced leucine feedback inhibition. Additionally, Ilv6N86A seems to increase the flux through the valine biosynthesis pathway, increasing isobutanol yields. We hypothesized that the Ilv6N86A mutant still shows a normal flux through the leucine pathway, because the wild-type Leu4p provides normal feedback inhibition by leucine.
We, therefore, combined the Leu4S542F A551V and Ilv6N86A mutations and tested the mutants for ethanol and fusel alcohol production in flasks containing 100 mL SCM-250 (Fig. 5A). Although 3MB production further increased as expected, isobutanol production remained similar to the Ilv6N86A single mutant. In an attempt to pull more flux from pyruvate toward 3MB, we put LEU4 under transcriptional control of the medium-strong TEF1 promoter or the extremely strong TDH3 promoter [48]. However, instead of increasing 3MB, this modification increased isobutanol production, especially for the pTEF1-Leu4S542F A551V–Ilv6N86A mutant. Overexpressing LEU4 not only decreased 3MB production, but also hampered growth, negatively affecting biomass and ethanol productivity (Figure S5).
We hypothesized that the phenotypes associated with the simultaneous introduction of the Ilv6p and Leu4p mutations might be caused by a bottleneck in the metabolic pathway leading to 3MB formation. To investigate the occurrence of metabolic bottlenecks, we measured the intracellular metabolite levels of the intermediates of the 3MB biosynthetic pathway (Fig. 5B). When Leu4S542F A551V was introduced, 3MB production increased compared to the wild-type strain. Interestingly, the metabolite analysis also revealed an accumulation of α-ketoisocaproate (α-kic), the direct precursor for 3MB production. The introduction of Ilv6N86A showed more pleiotropic effects, accumulating α-kic, all upstream metabolites, and leucine. Together, the metabolite concentrations in the mutants point toward a bottleneck at the α-ketoacid decarboxylation step or the subsequent aldehyde reduction step to the corresponding alcohols. Because aldehyde concentrations in yeast cells are usually low as a result of strong alcohol dehydrogenase activity, we hypothesized that the α-ketoacid decarboxylation step, and not the final reduction to alcohols, might be the primary bottleneck.
In S. cerevisiae, α-ketoacid decarboxylation is performed by a range of promiscuous enzymes encoded by the genes PDC1, PDC5, PDC6, and ARO10 [49], making them obvious targets for engineering. Unfortunately, due to the promiscuity of these enzymes, increasing the activity of the decarboxylation genes would likely not only increase 3MB but also lead to increased production of other unwanted fusel alcohol byproducts such as isobutanol, propanol, and 2-methyl-1-butanol (Fig. 1). Therefore, we explored other, less obvious, strategies to improve further 3MB yield and purity (see “Novel in silico-predicted gene deletions increased 3MB yields and purity” section).

A Rational engineering of the valine-leucine biosynthetic pathways for higher 3MB production. The values represent the mean productivity of different metabolites of three biological replicates, and error bars denote the standard deviation. pTEF1 and pTDH3: native LEU4 promoter substituted with the strong TEF1 or TDH3 promoters. Cdw = cell dry weight in g/Lh. B Intracellular metabolite levels of the valine-leucine intermediate are shown as a heatmap of the z-score normalization of the chromatograph peak area. Red: high abundance, blue: low abundance. Comparison is made per metabolite across mutants (wild type: left box, Leu4S542F A551V: middle box, Leu4S542F A551V Ilv6N86A: right box). Isobutanol and 3MB values are based on extracellular levels (ext). α-ipm and 3-ipm co-elutes. 2,3-div: 2,3-dihydroxyisovalerate, α-kiv: α-ketoisovalerate, α-ipm: α-isopropylmalate, 3-ipm: 3-isopropylmalate α-kic: α-ketoisocaproate, IBA: isobutyraldehyde, 3MA: 3-methyl-1-butanal, 3MB: 3-methyl-1-butanol. Pdc: Pdc1, Pdc5, Pdc6, Aro10. Adh: Adh1, Adh5, Adh6, Adh7
Novel in silico-predicted gene deletions increased 3MB yields and purity
The computational tool OptKnock [29, 31] based on the Yeast8 metabolic model for S. cerevisiae [28] was used to predict genes that, when deleted, might increase 3MB production. Specifically, we used the model to find gene deletions that might reduce unwanted side products: propanol, isobutanol, and acetate. Although acetate is not a fusel alcohol, it is a promising byproduct to eliminate as it is a common metabolite produced by S. cerevisiae. To ensure ethanol production remained high, a constraint was added requiring a minimum of 1.6 mol of ethanol produced per mol of glucose. OptKnock generated five suggestions for sets of gene deletions per byproduct target (Supplementary Table 5), which were refined to remove redundancies, reducing the total to four unique sets of gene targets for knock-out (Table 1, Figs. 6A&C, 7A).
The gene deletion sets were tested in Hybrid-1 Leu4S542F A551V and Ethanol Red® Leu4S542F A551V strains using CRISPR-Cas9 to generate single- and multiple-gene deletions. Several of the predicted genes are essential genes involved in the TCA cycle or amino acid assimilation, and it is, therefore, not always possible to delete all copies of these genes. To avoid crippling the strain, when paralogs (i.e., CIT1/3, SER3/33) existed, only one gene paralog was deleted at a time. For genes without paralogs (i.e., HOM3, MET17), one copy of the gene was deleted and replaced with a hygromycin-B resistance gene (marked with a † symbol). Mutants were then tested in SCM-250 media over 48 h of fermentation.
Several mutants showed enhanced 3MB production, notably the Leu4S542F A551V–cit1Δ (Fig. 6B), Leu4S542F A551V–aro4Δ (Fig. 6D), and Leu4S542F A551V–ald6Δ-eat1Δ-met17Δ† mutants (Fig. 7B). Other fusel alcohols like propanol and isobutanol also increased, although to a lesser extent. The most promising strain, Hybrid-1 Leu4S542F A551V–ald6Δ-eat1Δ-met17Δ†, achieved a 4.4-fold increase in 3MB yield compared to the wild type, with the 3MB proportion in the fusel alcohol mix increasing from 42 to 71%, and an 86% decrease of acetate (Table 2). These strains also maintained stable ethanol, glycerol, and biomass production compared to the parent strain, making them strong candidates for industrial applications (Figs. 6B&D, 7C, Figure S6).
The best agreement between OptKnock predictions and experimental results occurred when targeting acetate biosynthesis. The model suggested deleting ALD6, MET17, and EAT1 to block acetate production (Fig. 7A). While individual deletions had minimal impact, their combination (ald6Δ–eat1Δ–met17Δ†) significantly increased 3MB production, albeit with a slight increase in isobutanol (Fig. 7B). This result aligns with the metabolic separation of acetate and fusel alcohol pathways, as they share pyruvate as a precursor but rely on distinct enzymatic routes.
Interestingly, not all predicted gene deletions resulted in increased 3MB production, and for mutants with significantly increased 3MB production, unwanted byproducts also increased. For example, CIT1 deletion was predicted to decrease propanol production. However, cit1Δ increased both 3MB and propanol instead. The CIT1 deletion may have also been the main contributor to the phenotype of the Leu4S542F A551V–cit1Δ–hom3Δ† double deletion mutant (Fig. 6B). The metabolic model suggested that cit1Δ should lead to a decrease in TCA cycle intermediates needed as the precursor for propanol (Fig. 6A). However, in vivo, propanol may not have been produced through this pathway. Instead, cit1Δ likely redirected acetyl-CoA and oxaloacetate to enhance 3MB and propanol production, respectively.
Similarly, ARO3/4 and PYC1/2 deletions were predicted to decrease isobutanol by relying on cofactor preferences between 3MB and isobutanol. The only difference between 3MB and isobutanol production is the NADH requirement (Fig. 6C). However, aro4Δ increased all fusel alcohols instead (Fig. 6D). The aro4Δ deletion may have decreased flux in shikimate biosynthesis, which leads to aminobenzoate, tyrosine, and tryptophan biosynthesis. Carbon could have been redirected toward glycolytic intermediates, enhancing pyruvate availability for fusel alcohol and ethanol synthesis.
Strain background also influenced phenotypic outcomes from the same genetic engineering strategy as previously noted by others [50]. For instance, the effect of cit1Δ is more prominent in Ethanol Red® than in the Hybrid-1 strain (Fig. 6B). In another instance, introducing the combination Leu4S542F A551V–ald6Δ-eat1Δ-met17Δ† decreased ethanol Red®’s ethanol production, but Hybrid-1 strain’s ethanol production remained uncompromised (Fig. 7C, Table 2). Similarly, Leu4S542F A551V–ald6Δ-eat1Δ-met17Δ† increased glycerol yields in Ethanol Red®, but not in Hybrid-1 (Figure S6C). Given these differences, strain Hybrid-1 Leu4S542F A551V–ald6Δ-eat1Δ-met17Δ† emerges as the optimal candidate for industrial implementation, balancing high 3MB production with uncompromised ethanol yields.

Metabolic pathways predicted to contribute to the production of the byproducts propanol (A) and isobutanol (C). In red are genes that, when deleted, are predicted by OptKnock to decrease byproduct synthesis. B, D Yields of fusel alcohols and ethanol (as a secondary axis on the right) of the mutants. The values represent the mean of three biological replicates, and error bars denote the standard deviation; †: one copy of the gene replaced with a hygromycin marker. p values are depicted as asterisks (* p < 0.05, ** p < 0.01, *** p < 0.001, **** p < 0.0001), showing the statistical significance of the difference of all mutants compared to the Leu4S542F A551V strain, calculated using the Benjamini–Hochberg method

A Metabolic pathways predicted to contribute to the production of the byproduct acetate. In red are genes that, when deleted, are predicted by OptKnock to decrease byproduct synthesis. B The production of fusel alcohols. C The production of acetate and ethanol (as a secondary axis on the right) of the mutants. The values represent the mean of three biological replicates, and error bars denote the standard deviation; †: one copy of the gene replaced with a hygromycin marker. P values are depicted as asterisks (* p < 0.05, ** p < 0.01, *** p < 0.001, **** p < 0.0001), showing the statistical significance of the difference of all mutants compared to the Leu4S542F A551V strain, calculated using the Benjamini–Hochberg method
Discussion
We began this study by screening a collection of 1,020 industrial and wild S. cerevisiae strains to identify robust hosts capable of tolerating molasses toxicity and osmotic stress while efficiently producing ethanol. Surprisingly, we found that top-performing strains were not only originating from the bioethanol industry, but were spread over almost all niches available in the collection. These findings underscore the importance of leveraging natural genetic variation to discover strains with unique phenotypic traits, which can serve as promising candidates for further optimization and large-scale industrial use.
Our first screening strategy prioritized strains with superior growth in high-sugar (SCM-300) medium, based on the assumption that tolerance to molasses toxicity and osmotic stresses would correlate with enhanced metabolic capacity and ethanol productivity. However, we observed that several of the top-performing strains, as well as Ethanol Red® and several unselected strains, showed comparable growth in both SCM-40 and SCM-300 (Fig. 2A), suggesting a distinct metabolic strategy in which surplus carbon is preferentially directed toward ethanol rather than biomass. As a result, such strains may have been unintentionally excluded by our current selection criterion. This highlights the limitation of single-parameter preselection; namely, the trade-off between the number of starting candidates and the depth of screening that is practically achievable. Nonetheless, we believe that our multi-step screening approach remains a pragmatic and effective strategy for identifying promising industrial strains, as also demonstrated in other relevant studies [51,52,53].
Beyond strain selection, our study revealed that the same genetic modifications can lead to different phenotypic outcomes depending on the strain’s genetic background, reinforcing that metabolic engineering is not a one-size-fits-all approach. For example, when testing the Leu4S542F A551V mutation in nine different strains, we found that while some strains exhibited reduced ethanol production, others showed no significant effects. Similarly, when evaluating OptKnock-predicted gene deletions, we observed strain-dependent phenotypic variations. This phenomenon has also been reported in the other studies [51, 54] and is likely a widespread occurrence in yeast metabolic engineering. In addition to genetic background, environmental factors like the choice of substrate can potentially influence the phenotypic outcome of engineered traits [54]. It is reasonable to speculate that different strain phenotypes might be observed with other industrially relevant substrates, such as corn or sugar beet, which could be evaluated in future studies.
To expand engineering targets for increased 3MB production beyond the traditionally targeted valine–leucine biosynthetic pathway, we utilized the metabolic yeast model Yeast8 in conjunction with the OptKnock tool, to predict gene deletions that could enhance 3MB production by reducing propanol, isobutanol, or acetate. The identified gene knockouts were not directly related to fusel alcohol production, demonstrating the utility of OptKnock in identifying non-obvious metabolic engineering targets for 3MB improvement. However, although the OptKnock gene targets were designed solely to increase 3MB, all successful interventions that significantly raised 3MB levels also led to simultaneous increases in propanol and isobutanol. This highlights the challenges of uncoupling the biosynthesis of propanol and isobutanol from 3MB. Previous studies have attempted to uncouple 3MB from other fusel alcohol biosynthesis by relocalizing leucine biosynthetic enzymes to the mitochondria, which successfully increased 3MB but at the cost of significantly reducing ethanol production [16, 17]. Given our focus on maintaining ethanol yields, these strategies were not suitable for our study. With this in mind, increasing 3MB yield by more than fourfold without significantly affecting ethanol yields can be considered a very positive outcome.
While the model Yeast8 provided useful to explore potential pathways, its simplifications—such as neglecting enzyme kinetics and genetic regulation—may have contributed to the inconsistencies between the expected metabolic outcome in silico and the observed phenotype in vivo. Apart from the limitations of the model itself, two additional factors may explain these inconsistencies. First, partial knockouts—such as deleting only one paralog or a single gene copy—may have left residual enzymatic activity, reducing the expected phenotypic impact. Second, some target genes may have low baseline expression, meaning that their deletion did not significantly alter metabolic flux. To obtain better predictions, advanced models that incorporate protein expression (pcYeast) or enzyme abundance (ecYeast7.6) could be explored in the future [55].
In terms of quantitative performance, the best engineered strain in our study produced 1.5 mg of 3MB per gram of sugar, with a productivity of 5 mg/Lh. The yield and productivity are lower than those reported in the previous studies, some of which achieved up to 12.4 mg/g and productivity rates approaching 25.8 mg/Lh [16, 18]. Their strategies, which included mitochondrial localization of the LEU genes and overexpression of the mitochondrial α-IPM transporter OAC1, could be explored in future work to further enhance 3MB production in the Hybrid-1 mutant. However, it is important to note that these engineering strategies came at the cost of reduced ethanol output. In contrast, our best-performing strain simultaneously produced ethanol at a yield of 0.43 g/g sugars and a productivity of 1.46 g/Lh. These values are comparable to those observed in batch sugarcane molasses-based bioethanol fermentations, which typically achieve ethanol yields ranging from 0.43 to 0.46 g/g sugars and productivity rates between 1 and 3 g/Lh [56]. This demonstrates a key added value of our approach: improving 3MB production without sacrificing ethanol productivity.
In an industrial context, the strategy presented here would result in 3MB being produced as part of a fusel alcohol mixture that arises as a byproduct during bioethanol purification. Isolating 3MB from this mixture would require additional downstream processing, typically involving multiple distillation steps. A key challenge is the presence of water, which forms heterogeneous azeotropes with fusel alcohols—these azeotropes often have lower boiling points than that of the pure compounds, complicating separation. Addressing this requires specialized separation techniques, such as dividing wall distillation columns, pressure-swing distillation (operating columns at different pressures), or hybrid approaches combining liquid–liquid extraction or decantation with distillation [9, 57, 58]. These processes are generally energy-intensive, making 3MB purification non-trivial. Therefore, improving the composition of the fusel alcohol mixture, specifically by increasing the proportion of 3MB, could potentially reduce the purification energy requirements, and offer a significant economic advantage. However, to assess the impact of such an improvement, process simulations (e.g., using Aspen Plus®) or pilot-scale experiments would be needed.
Conclusions
In this study, we first screened a large set of industrial and wild S. cerevisiae strains for superior bioethanol producers, identifying Hybrid-1 as a strain outperforming the industry standard Ethanol Red®. A critical bottleneck for fusel alcohol production is the feedback regulation of the valine and leucine biosynthetic pathways. In this study, we tested various engineering strategies to alleviate the feedback regulation and showed that Leu4S542F A551V selectively enhances 3MB production. Moreover, when testing Leu4S542F A551V in nine different strains, we observed that the same engineering approach yielded different outcomes depending on the genetic background of the strains, demonstrating the complexity of metabolic engineering. Additionally, intermediate metabolite analysis revealed a bottleneck at the promiscuous α-ketoacid decarboxylation step, identifying a promising target for future engineering. Furthermore, we leveraged in silico metabolic modeling to identify novel gene deletion targets to reduce acetate byproduct formation, highlighting the potential of these tools to explore complex metabolic interactions.
Following a 4.4-fold increase of 3MB yield, the final strain Hybrid-1 Leu4S542F A551V-ald6Δ-eat1Δ-met17Δ† produces 1.5 mg 3MB and 0.43 g ethanol per gram of sugar without any significant reduction in ethanol yields. Extrapolating this yield to the current global ethanol production of 110 billion liters annually, up to 380 million liters of bio-based 3MB could theoretically be obtained each year, representing a theoretical gross extra value of over $750 M. Moreover, the Hybrid-1 mutant increased 3MB purity from 42 to 71% within the fusel alcohol mix, which could reduce purification efforts and costs. Together, our results demonstrate the possibility of industrially co-producing 3MB alongside bioethanol, which could lead toward cost-effective and sustainable solution for large-scale 3MB production by valorizing the existing fusel alcohol side stream of the bioethanol industry.
Data availability
Data are provided within the manuscript and supplementary information files.
References
-
Ardebili SMS, Solmaz H, İpci D, Calam A, Mostafaei M. A review on higher alcohol of fusel oil as a renewable fuel for internal combustion engines: Applications, challenges, and global potential. Fuel. 2020;279: 118516.
-
Transparency Market Research. Isoamyl Alcohol Market; 2022. https://www.transparencymarketresearch.com/isoamyl-alcohol-market.html
-
Güvenç A, Kapucu N, Kapucu H, Aydoǧan Ö, Mehmetoǧlu Ü. Enzymatic esterification of isoamyl alcohol obtained from fuel oil: optimization by response surface methodolgy. Enzyme Microb Technol. 2007;40(4):778–85.
-
Breitkreuz K, Menne A, Kraft A. New process for sustainable fuels and chemicals from bio-based alcohols and acetone. Biofuels Bioprod Biorefining. 2014;8(4):504–15.
-
Gabriëls D, Hernández WY, Sels BF, Van Der Voort P, Verberckmoes A. Review of catalytic systems and thermodynamics for the Guerbet condensation reaction and challenges for biomass valorization. Catal Sci Technol. 2015;5(8):3876–902.
-
Anissimova M, Allard M. Method for the production of isoamyl alcohol. WO2016207267A1; 2016.
-
U.S. Grains Council. Ethanol market and pricing data—December 24, 2024; 2024. Available from: https://grains.org/ethanol_report/ethanol-market-and-pricing-data-december-24-2024/
-
Bai W, Geng W, Wang S, Zhang F. Biosynthesis, regulation, and engineering of microbially produced branched biofuels. Biotechnol Biofuels. 2019;12:84. https://doi.org/10.1186/s13068-019-1424-9.
-
de Mendoza-Pedroza JJ, Sánchez-Ramírez E, Segovia-Hernández JG, Hernández S, Orjuela A. Recovery of alcohol industry wastes: revaluation of fusel oil through intensified processes. Chem Eng Process Process Intensif. 2021;163:1–6.
-
Naz S, Liu P, Farooq U, Ma H. Insight into de-regulation of amino acid feedback inhibition: a focus on structure analysis method. Microb Cell Fact. 2023;22(1):1–28. https://doi.org/10.1186/s12934-023-02178-z.
-
Cullin C, Baudin-Baillieu A, Guillemet E, Ozier-Kalogeropoulos O. Functional analysis of YCL09C: evidence for a role as the regulatory subunit of acetolactate synthase. Yeast. 1996;12:1511–8.
-
Cavalieri D, Casalone E, Bendoni B, Fia G, Polsinelli M, Barberio C. Trifluoroleucine resistance and regulation of α-isopropyl malate synthase in Saccharomyces cerevisiae. Mol Gen Genet. 1999;261(1):152–60.
-
Kohlhaw GB. Leucine biosynthesis in fungi: entering metabolism through the back door. Microbiol Mol Biol Rev. 2003;67(1):1–15.
-
Yuan J, Mishra P, Ching CB. Engineering the leucine biosynthetic pathway for isoamyl alcohol overproduction in Saccharomyces cerevisiae. J Ind Microbiol Biotechnol. 2017;44(1):107–17.
-
Park SH, Kim S, Hahn JS. Metabolic engineering of Saccharomyces cerevisiae for the production of isobutanol and 3-methyl-1-butanol. Appl Microbiol Biotechnol. 2014;98(21):9139–47. https://doi.org/10.1007/s00253-014-6081-0.
-
Hammer SK, Zhang Y, Avalos JL. Mitochondrial compartmentalization confers specificity to the 2-ketoacid recursive pathway: increasing isopentanol production in Saccharomyces cerevisiae. ACS Synth Biol. 2020;9(3):546–55.
-
Avalos JL, Fink GR, Stephanopoulos G. Compartmentalization of metabolic pathways in yeast mitochondria improves the production of branched-chain alcohols. Nat Biotechnol. 2013;31(4):335–41.
-
Yuan J, Chen X, Mishra P, Ching CB. Metabolically engineered Saccharomyces cerevisiae for enhanced isoamyl alcohol production. Appl Microbiol Biotechnol. 2017;101(1):465–74. https://doi.org/10.1007/s00253-016-7970-1.
-
RFA. Annual ethanol production; 2024. https://ethanolrfa.org/markets-and-statistics/annual-ethanol-production
-
Markets and Markets. Bioethanol Market by Feedstock (Starch based, Sugar based, Cellulose-based), Fuel blend (E5, E10, E15 to E70, E75& E85), End-use (transportation, pharmaceutical, cosmetic, alcoholic beverages), Generation and Region Global Forecast to 2028; 2024. https://www.marketsandmarkets.com/Market-Reports/bioethanol-market-131222570.html?gad_source=1&gclid=Cj0KCQiAu8W6BhC-ARIsACEQoDDiAwZSa-yUxMwyOW5Fu7yTr6OfAm6_cm3RLJMH7YorQPW-wCC7W90aAiKkEALw_wcB
-
dos Santos RA, de Almeida YMB, Andrade SAC, Caldas CS, de Freitas JD, Costa CACB. Formation of isoamyl alcohol and isobutanol in the fermentation of sugarcane molasses in a microdistillery: evaluation of pH, refrigeration and supplementation factors. 2024. p. 1–23
-
Li J, Feng R, Wen Z, Zhang A. Overexpression of ARO10 in pdc5Δmutant resulted in higher isobutanol titers in Saccharomyces cerevisiae. Biotechnol Bioprocess Eng. 2017;22(4):382–9.
-
Gallone B, Steensels J, Prahl T, Soriaga L, Saels V, Herrera-Malaver B, et al. Domestication and divergence of Saccharomyces cerevisiae beer yeasts. Cell. 2016;166(6):1397-1410.e16. https://doi.org/10.1016/j.cell.2016.08.020.
-
Vyas VK, Bushkin GG, Bernstein DA, Getz MA, Sewastianik M, Barrasa MI, et al. New CRISPR mutagenesis strategies reveal variation in repair mechanisms among fungi. mSphere. 2018;3(2):10–128.
-
Zimmermann A, Prieto-Vivas JE, Cautereels C, Gorkovskiy A, Steensels J, Van de Peer Y, et al. A Cas3-base editing tool for targetable in vivo mutagenesis. Nat Commun. 2023;14(1):3389.
-
Thompson JR, Register E, Curotto J, Kurtz M, Kelly R. An improved protocol for the preparation of yeast cells for transformation by electroporation. Yeast. 1998;14(6):565–71.
-
de Souza Dias MO, Maciel Filho R, Mantelatto PE, Cavalett O, Rossell CEV, Bonomi A, et al. Sugarcane processing for ethanol and sugar in Brazil. Environ Dev. 2015;15:35–51. https://doi.org/10.1016/j.envdev.2015.03.004.
-
Lu H, Li F, Sánchez BJ, Zhu Z, Li G, Domenzain I, et al. A consensus S. cerevisiae metabolic model Yeast8 and its ecosystem for comprehensively probing cellular metabolism. Nat Commun. 2019;10(1):3586.
-
Burgard AP, Pharkya P, Maranas CD. OptKnock: a bilevel programming framework for identifying gene knockout strategies for microbial strain optimization. Biotechnol Bioeng. 2003;84(6):647–57.
-
Orth JD, Thiele I, Palsson BO. What is flux balance analysis? Nat Biotechnol. 2010;28(3):245–8.
-
Heirendt L, Arreckx S, Pfau T, Mendoza SN, Richelle A, Heinken A, et al. Creation and analysis of biochemical constraint-based models using the COBRA Toolbox v.3.0. Nat Protoc. 2019;14(3):639–702.
-
Gallone B, Mertens S, Gordon JL, Maere S, Verstrepen KJ, Steensels J. Origins, evolution, domestication and diversity of Saccharomyces beer yeasts. Curr Opin Biotechnol. 2018;49:148–55.
-
Steensels J, Verstrepen KJ. Taming wild yeast: potential of conventional and nonconventional yeasts in industrial fermentations. Annu Rev Microbiol. 2014;68:61–80.
-
Steensels J, Gallone B, Voordeckers K, Verstrepen KJ. Domestication of industrial microbes. Curr Biol. 2019;29(10):R381–93. https://doi.org/10.1016/j.cub.2019.04.025.
-
Pereira FB, Guimarães PMR, Teixeira JA, Domingues L. Selection of Saccharomyces cerevisiae strains for efficient very high gravity bio-ethanol fermentation processes. Biotechnol Lett. 2010;32(11):1655–61.
-
Pereira FB, Romaní A, Ruiz HA, Teixeira JA, Domingues L. Industrial robust yeast isolates with great potential for fermentation of lignocellulosic biomass. Bioresour Technol. 2014;161:192–9.
-
Attfield PV, Kletsas S. Hyperosmotic stress response by strains of bakers’ yeasts in high sugar concentration medium. Lett Appl Microbiol. 2000;31(4):323–7.
-
Basso LC, Basso TO, Rocha SN. Ethanol production in Brazil: the industrial process and its impact on yeast fermentation. Biofuel Prod Dev Prospect. 2011;1530:85–100.
-
Brachmann CB, Davies A, Cost GJ, Caputo E, Li J, Hieter P, et al. Designer deletion strains derived from Saccharomyces cerevisiae S288C : a useful set of strains and plasmids for pcr-mediated gene disruption and other applications. Yeast. 1998;132:115–32.
-
van Dijken JP, Bauer J, Brambilla L, Duboc P, Francois JM, Gancedo C, et al. An interlaboratory comparison of physiological and genetic properties of four Saccharomyces cerevisiae strains. Enzyme Microb Technol. 2000;26:706–14.
-
Lino FSDO, Basso TO, Sommer MOA. A synthetic medium to simulate sugarcane molasses. Biotechnol Biofuels. 2018;11(1):1–12. https://doi.org/10.1186/s13068-018-1221-x.
-
Lip KYF, García-Ríos E, Costa CE, Guillamón JM, Domingues L, Teixeira J, et al. Selection and subsequent physiological characterization of industrial Saccharomyces cerevisiae strains during continuous growth at sub- and- supra optimal temperatures. Biotechnol Rep. 2020;26: e00462.
-
Kong II, Turner TL, Kim H, Kim SR, Jin YS. Phenotypic evaluation and characterization of 21 industrial Saccharomyces cerevisiae yeast strains. FEMS Yeast Res. 2018;18(1):1–11.
-
Takagi H, Hashida K, Watanabe D, Nasuno R, Ohashi M, Iha T, et al. Isolation and characterization of awamori yeast mutants with l-leucine accumulation that overproduce isoamyl alcohol. J Biosci Bioeng. 2015;119(2):140–7.
-
Takpho N, Watanabe D, Takagi H. High-level production of valine by expression of the feedback inhibition-insensitive acetohydroxyacid synthase in Saccharomyces cerevisiae. Metab Eng. 2018;46:60–7. https://doi.org/10.1016/j.ymben.2018.02.011.
-
Duggleby RG, Pang SS, Yu H, Guddat LW. Systematic characterization of mutations in yeast acetohydroxyacid synthase: interpretation of herbicide-resistance data. Eur J Biochem. 2003;270(13):2895–904.
-
Friden P, Reynolds C, Schimmel P. A large internal deletion converts yeast LEU3 to a constitutive transcriptional activator downloaded from. Molecular Cellular Biology 1989; 9. http://mcb.asm.org/
-
Apel AR, D’Espaux L, Wehrs M, Sachs D, Li RA, Tong GJ, et al. A Cas9-based toolkit to program gene expression in Saccharomyces cerevisiae. Nucleic Acids Res. 2017;45(1):496–508.
-
Romagnoli G, Luttik MAH, Kötter P, Pronk JT, Daran JM. Substrate specificity of thiamine pyrophosphate-dependent 2-oxo-acid decarboxylases in Saccharomyces cerevisiae. Appl Environ Microbiol. 2012;78(21):7538–48.
-
Costa CE, Romaní A, Cunha JT, Johansson B, Domingues L. Integrated approach for selecting efficient Saccharomyces cerevisiae for industrial lignocellulosic fermentations: Importance of yeast chassis linked to process conditions. Bioresour Technol. 2017;227:24–34.
-
Zhu Y, Yogiswara S, Willekens A, Gérardin A, Lavigne R, Goossens A, et al. Beyond CENPK—parallel engineering of selected S. cerevisiae strains reveals that superior chassis strains require different engineering approaches for limonene production. Metab Eng. 2025;91:276–89.
-
Mukherjee V, Steensels J, Lievens B, Van de Voorde I, Verplaetse A, Aerts G, et al. Phenotypic evaluation of natural and industrial Saccharomyces yeasts for different traits desirable in industrial bioethanol production. Appl Microbiol Biotechnol. 2014;98(22):9483–98.
-
Snoek T, Picca Nicolino M, Van den Bremt S, Mertens S, Saels V, Verplaetse A, et al. Large-scale robot-assisted genome shuffling yields industrial Saccharomyces cerevisiae yeasts with increased ethanol tolerance. Biotechnol Biofuels. 2015;8(1):32. https://doi.org/10.1186/s13068-015-0216-0.
-
Cunha JT, Aguiar TQ, Romaní A, Oliveira C, Domingues L. Contribution of PRS3, RPB4 and ZWF1 to the resistance of industrial Saccharomyces cerevisiae CCUG53310 and PE-2 strains to lignocellulosic hydrolysate-derived inhibitors. Bioresour Technol. 2015;191:7–16.
-
Chen Y, Li F, Nielsen J. Genome-scale modeling of yeast metabolism: retrospectives and perspectives. FEMS Yeast Res. 2022;22(1):1–9.
-
Sánchez ÓJ, Cardona CA. Trends in biotechnological production of fuel ethanol from different feedstocks. Bioresour Technol. 2008;99(13):5270–95.
-
Ferreira MC, Meirelles AJA, Batista EAC. Study of the fusel oil distillation process. Ind Eng Chem Res. 2013;52(6):2336–51.
-
Missyurin A, Cursaru DL, Neagu M, Nicolae M. Hybrid process flow diagram for separation of fusel oil into valuable components. Processes. 2024;12(12):1–16.
Acknowledgements
S.Y. is supported by a PhD fellowship from FWO (1S22422N). Research in the lab of K.J.V. is supported by KU Leuven, VIB, VLAIO, FWO (S001421N), and iBOF (IBOF/21/092). The authors thank the VIB Metabolomics Core Leuven for their support. Part of this research was funded by the FWO Medium Infrastructure under Grant No. I002722N.
Funding
S.Y. is supported by a PhD fellowship from FWO (1S22422N). Research in the lab of K.J.V. is supported by KU Leuven, VIB, VLAIO, FWO (S001421N), and iBOF (IBOF/21/092). The authors thank the VIB Metabolomics Core Leuven for their support. Part of this research was funded by the FWO Medium Infrastructure under Grant No. I002722N.
Ethics declarations
Ethics approval and consent to participate
Not applicable.
Consent for publication
Not applicable.
Declaration of generative AI and AI-assisted technologies in the writing process
During the preparation of this work, the authors used ChatGPT 4o (OpenAI) to improve sentence clarity and to fix grammatical mistakes. After using this tool, the authors reviewed and edited the content as needed and took full responsibility for the content of the publication.
Competing interests
The authors declare no competing interests.
Additional information
Publisher’s Note
Springer Nature remains neutral with regard to jurisdictional claims in published maps and institutional affiliations.
Supplementary Information
Rights and permissions
Open Access This article is licensed under a Creative Commons Attribution-NonCommercial-NoDerivatives 4.0 International License, which permits any non-commercial use, sharing, distribution and reproduction in any medium or format, as long as you give appropriate credit to the original author(s) and the source, provide a link to the Creative Commons licence, and indicate if you modified the licensed material. You do not have permission under this licence to share adapted material derived from this article or parts of it. The images or other third party material in this article are included in the article’s Creative Commons licence, unless indicated otherwise in a credit line to the material. If material is not included in the article’s Creative Commons licence and your intended use is not permitted by statutory regulation or exceeds the permitted use, you will need to obtain permission directly from the copyright holder. To view a copy of this licence, visit http://creativecommons.org/licenses/by-nc-nd/4.0/.
About this article

Cite this article
Yogiswara, S., Rombout, J., Micharikopoulos, G. et al. Metabolic engineering of Saccharomyces cerevisiae for co-production of ethanol and 3-methyl-1-butanol from sugarcane molasses. Biotechnol. Biofuels Bioprod. 18, 86 (2025). https://doi.org/10.1186/s13068-025-02685-8
-
Received:
-
Accepted:
-
Published:
-
DOI: https://doi.org/10.1186/s13068-025-02685-8


