- Research
- Open access
- Published:
Biotechnology for Biofuels and Bioproducts volume 18, Article number: 89 (2025) Cite this article
Abstract
Background
Industrial lignocellulosic side streams are considered an attractive carbon source for the cultivation of biotechnologically important fungi, although the presence of toxic pretreatment by-products is a major challenge yet to be overcome. Aspergillus oryzae is a filamentous fungus with a large secretion capacity, high tolerance for toxins, and a wide substrate range, making it a promising candidate for side stream utilization. In the present study, the cellular mechanisms of tolerance against furfural, 5-hydroxymethylfurfural (HMF), levulinic acid, ferulic acid, and vanillin were studied at the transcriptome level.
Results
A. oryzae RIB40 was grown in the presence of different inhibitors commonly found in lignocellulosic side streams, and RNA sequencing was utilized to investigate the transcriptomic changes in response to the inhibitors. Analysis of the transcriptomic response in all conditions indicates that a large fraction of differentially expressed genes responded to the inhibitor-induced formation of reactive oxygen species (ROS). Apart from levulinic acid, all inhibitors showed strong initial suppression of metabolic pathways related to cell cycle, ribosome functions, protein folding, and sorting in the endoplasmic reticulum. Genes associated with cellular detoxification, namely, NAD(P)H-dependent oxidoreductases and efflux transporters, such as the ATP-Binding Cassette (ABC) transporters and major facilitator superfamily (MFS) transporters, showed strong upregulation upon exposure to the inhibitors.
Conclusions
The results obtained provide important insights into the stress response of A. oryzae to the xenobiotic compounds and their cellular detoxification. Aldehydic inhibitors, especially HMF, caused a strong and severe stress response in A. oryzae RIB40. Additionally, we identified several highly upregulated uncharacterized genes upon exposure to the inhibitors. These genes serve as promising targets for strain engineering to build robust industrial strains capable of utilizing lignocellulosic side streams as feedstock.
Background
Lignocellulose is a renewable resource that can be used as an inexpensive raw material in biorefineries for the production of biofuels and other biobased chemicals, primarily by the yeast Saccharomyces cerevisiae [1]. Filamentous fungi, including members of the genus Aspergillus, have shown promise as potential alternative organisms for lignocellulose bioconversion [2,3,4,5]. Aspergillus oryzae is a filamentous fungus that has been used for centuries in food fermentation in Asia. Presently, A. oryzae serves as an important host organism in biotechnology, tolerating high concentrations of acetate and other inhibitory compounds formed during the pretreatment of biomass [6,7,8].
Biomass pretreatment is required to overcome the recalcitrant nature of lignocellulose, since it improves the accessibility of carbohydrate polymers for enzymatic hydrolysis [1]. However, the pretreatment process yields inhibitory by-products, including furaldehydes, phenolics, and weak acids, the composition and ratio of which depend on the type of biomass and pretreatment method applied [9]. In eukaryotes, the metabolism of xenobiotics often takes place in three phases. Phase I involves enzymatic modification of the toxic compound by oxidative enzymes such as alcohol and aldehyde dehydrogenases, reductases, cytochrome P450s, and monooxygenases [10, 11]. In phase II, they are conjugated with glutathione or sugar moiety by conjugating enzymes (e.g., glutathione S-transferases (GST) and UDP-glucuronosyltransferases (UGT)) [12] and excreted in phase III by transporters like ATP-binding cassette (ABC) or major facilitator superfamily (MFS) transporters either outside of the cell or into vacuoles [13, 14]. Alcohol and aldehyde dehydrogenases have been shown to be involved in the detoxification of hydrolysate inhibitors in S. cerevisiae, Scheffersomyces stipitis, Neurospora crassa, and Pleurotus ostreatus [2, 3, 15, 16]. In S. cerevisiae, the upregulation of pleiotropic drug resistance (PDR) genes has been observed under furaldehyde-induced stress. Exposure to hydrolysate inhibitors also resulted in the upregulation of ABC transporters in several fungal species [17,18,19,20,21,22], indicating the potential role of those transporters in the inhibitor tolerance. ABC transporters excrete a wide range of exogenous and endogenous toxic compounds (drugs, secondary metabolites, organic acids, etc.), and certain groups of ABC transporters are referred to as multidrug resistance (MDR) or PDR transporters [23]. Notably, A. oryzae possesses one of the highest numbers of predicted ABC transporters among filamentous fungi [24].
Two furaldehydes, furfural and 5-hydroxymethylfurfural (HMF), are the main furan inhibitors in lignocellulosic hydrolysates. They are formed during the pretreatment via the dehydration of pentose and hexose sugars, respectively [1]. Furaldehydes have been shown to induce reactive oxygen species (ROS) formation in S. cerevisiae, causing severe oxidative stress [25]. Furfural also inhibits enzymes involved in the central metabolism of S. cerevisiae and other yeasts in vitro [26, 27]. Furfural and HMF degradation pathways have been elucidated in the bacterium Cupriavidus basilensis [28]. Both pathways converge at 2-furoic acid, which is further converted to 2-oxoglutaric acid and then metabolized via TCA pathway. Several fungi are able to catabolize furfural and HMF, and a few of them can use furaldehydes as a sole carbon source [29]. The biochemical pathways of furaldehyde catabolism in fungi have not been well characterized, but it is hypothesized to occur similarly to that in bacteria [28, 30]. Microorganisms that are unable to catabolize furaldehydes, e.g., S. cerevisiae, minimize the toxicity of furaldehydes by reducing them to less toxic furfuryl alcohols [4, 16, 31,32,33]. In those organisms, furfuryl alcohols remain as dead-end products [34]. Reduction of furaldehydes also occurs in organisms that can catabolize them. Presumably, the reduction and oxidation processes of furaldehydes coexist in these organisms to minimize their negative impact by keeping their intracellular concentration below the toxicity limit [28, 29]. Lignin residues are the main source of aromatic compounds in lignocellulosic hydrolysates. The variety and toxicity of these aromatic compounds depend on the source material [1]. Examples of aromatic compounds occurring in lignocellulosic hydrolysates are ferulic, gallic, and syringic acids and vanillin. Generally, the aromatic compound metabolism in fungi converges to a small number of central intermediates through several metabolic pathways. Additionally, several enzymes have been identified in Aspergillus niger through which various aromatic compounds are metabolized into the central intermediates and ultimately into 3-oxoadipate [35,36,37,38]. Aromatic compound catabolism has also been characterized in S. cerevisiae [39]. Acetic acid, formic acid, and levulinic acid comprise the most abundant of the weak acids found in the lignocellulolytic hydrolysates [1]. The weak acids in the hydrolysate affect the cells through two main mechanisms. Firstly, undissociated acids can enter the cells via passive diffusion, after which they dissociate in the cytosol, decreasing the intracellular pH [40]. Simultaneously, acids induce ROS accumulation, which can lead to irreversible DNA damage and ultimately cell death [41]. Fungi combat weak acid-induced oxidative stress with several mechanisms, including scavenging ROS by glutathione, enzymatic conjugation of oxidized compounds by GSTs and UGTs, and exporting the acids through efflux transporters [12]. ABC transporters Pdr12 in S. cerevisiae and ABC40 in Penicillium chrysogenum have been shown to be involved in weak acid detoxification [19, 20, 22].
In this study, we aimed to provide insight into the transcriptional response of A. oryzae to common inhibitory compounds in lignocellulosic hydrolysates and identify tolerance-related genes. We produced transcriptome data under exposure to furfural, HMF, ferulic acid, vanillin, and levulinic acid and identified several highly expressed uncharacterized oxidoreductases and transporters, which could be targets for improving fungal tolerance against lignocellulose-derived inhibitors.
Materials and methods
Microbial strains, chemicals, media, and cultivation
The A. oryzae RIB40 strain was cultivated in Czapek-Dox (CZ) medium containing 3 g/L NaNO3, 1 g/L KH2PO4, 0.5 g/L KCl, and 0.5 g/L MgSO4·7H2O in distilled deionized water (DDIW) with the pH adjusted to 6.0 with NaOH before autoclaving. After autoclaving 1 mL/1000 mL 1000 × trace elements (1 g/L FeSO4·7H2O, 10 g/L EDTA, 4.4 g/L ZnSO4·7H2O, 2.2 g/L H3BO3, 1 g/L MnCl2·4H2O, 0.32 g/L CoCl2·6H2O, 0.32 g/L CuSO4·5H2O, 0.22 g/L (NH4)6Mo7O24·4H2O) were added. Solid media were supplemented with 15 g/L agar. For the preparation of spore suspensions, A. oryzae was grown on potato dextrose agar plates for 5 days, and the spores were collected into a solution containing 0.8% NaCl, 0.025% Tween 20, and 20% glycerol, and the resulting suspensions were stored at − 80 °C. Liquid cultures were grown at 28 °C with 230 rpm shaking in 50 mL volume in 250 mL flasks. For chemical sensitivity testing, the following chemicals were obtained from Sigma-Aldrich (Saint Louis, MO) unless otherwise mentioned: cinnamic acid, ferulic acid, furfural (FLUKA, Charlotte, NC), gallic acid, 5-hydroxymethylfurfural (Merck, Darmstadt, Germany), levulinic acid, salicylic acid, syringic acid, and vanillin.
Chemical sensitivity
For chemical sensitivity screens, a total of 103 A. oryzae RIB40 spores in 2 µL were inoculated at the center of CZA + 2% fructose plates with and without chemicals. All chemicals were dissolved in DMSO and then diluted into cooled, autoclaved CZ + 2% fructose agar medium in desired concentrations. Plates were incubated at 28 °C for seven days. Plates lacking chemicals were used as controls. The percentage inhibition of the radial growth of the target fungus was determined by calculating the average colony radius (ACR) for the control plates and the plates containing the chemical, and using the formula:
$${text{Percent inhibition }} = , left( {{text{ACR}}_{{({text{control}})}} {-}{text{ ACR}}_{{({text{chemical}})}} } right)/{text{ACR}}_{{({text{control}})}} times { 1}00% .$$
Control plates were grown in quadruplicate, and three biological replicates were grown for each concentration of an inhibitor. The IC50 value for chemicals was determined as the point at which 50% of the growth was inhibited on day 7.
RNA extraction and sequencing
Pre-cultures of A. oryzae RIB40 were inoculated with 1.5 × 10⁷ spores and were cultured overnight at 28 °C with 220 rpm in shake flasks containing 250 mL CZ with D-fructose (20 g/L). Mycelium was harvested on Miracloth and washed with CZ. Equal portions of fungal hyphae were transferred to flasks containing 50 mL CZ with D-fructose (20 g/L) and the selected inhibitors at the determined IC50 values (Table 1). The cultures were incubated in rotary shakers for 24 h at 220 rpm. Total RNA of three biological replicates (quadruplicate for the control) was extracted at five different time points: zero hour, one hour, three hours, five hours, and 24 h after induction. Fungal hyphae were harvested, dried between tissue paper, and snap-frozen in liquid nitrogen at each time point. Frozen hyphae were ground with a mortar and pestle. Total RNA was extracted using TRIzol reagent (Invitrogen, Thermo Fisher Scientific, Carlsbad, CA) and was purified using the RNeasy plant mini kit (Qiagen, Hilden, Germany) according to the manufacturer’s recommendations. The quantity and quality of RNA were determined by the Nanodrop 2000 (Thermo Scientific) and RNA 6000 Nano chips using the Agilent 2100 Bioanalyzer (Agilent Technologies, Santa Clare, CA). RNA sequencing was performed by CeGaT GmbH (Tübingen, Germany) using the Illumina NovaSeq 6000 platform (Illumina Inc., San Diego, CA). Stranded paired-end library was produced for 83 of the total 95 samples that passed the quality check with TruSeq stranded mRNA kit (Illumina Inc., San Diego, CA) for 101 bp for both pair ends with an average Q30 value of ≥ 91.38%. The sample quality of three-hour and five-hour samples of ferulic acid and levulinic acid was below the required threshold, and those samples were excluded from the dataset.
RNA-seq data analysis
RNA-seq data were analyzed using the bioinformatic toolbox at the Chipster virtual interface at the IT Center for Science (CSC), Finland [42]. Adapters were trimmed with Skewer (version 0.2.2) [43], and low-quality sequencing reads were trimmed using Trimmomatic (version 0.33) [44]. The quality of the sequencing data was checked using FastQC [(https://www.bioinformatics.babraham.ac.uk/projects/fastqc/)]. Trimmed paired-end sequencing reads were mapped to the A. oryzae RIB40 [8] genome retrieved with GFF from EmsemblFungi [45] using HISAT2 (version 2.2.1) [46]. BAM files were used as input files to quantify the number of short reads with HTSeq (version 0.6.1) [47], which resulted in the aligned read counts for all sequenced gene transcripts. Differential expression analysis was performed using the DESeq2 (version 1.26.0) [48]. Genes with an adjusted p ≤ 0.01 and log2 fold change of ≥ 1 or ≤ − 1 were considered as significantly differentially expressed. Individual genes were characterized by homology search using the NCBI BLASTp tool (https://blast.ncbi.nlm.nih.gov/Blast.cgi), annotations of Joint Genome Institute genomics resource database https://genome.jgi.doe.gov and the Blast2GO suite in OmicsBox [49]. The functional categories of the GO terms of the differentially expressed genes were determined using OmicsBox Blast2GO suite by setting the sequence filter at 5% of the gene set size and the GO term level at 3 [49]. The dataset supporting the conclusions of this article is available in NCBI’s Gene Expression Omnibus and is accessible through GEO Series accession number GSE296876 (https://www.ncbi.nlm.nih.gov/geo/query/acc.cgi?acc=GSE296876). Genes with adjusted p-value ≤ 0.01 and log2 fold change of ≥ 1 or ≤ − 1 in any comparison were included in the clustering analysis. Variance-stabilized transformation was performed for the normalized counts, and the average of the biological replicates was calculated for each sample and time point. Samples were divided into aldehydes (control, HMF, furfural, and vanillin) and acids (control, ferulic acid, and levulinic acid) based on the main reactive functional group. Genes were soft-clustered into 25 groups using the R package Mfuzz v2.64.0 [50] and assigned to the cluster in which they had the highest membership value. Over-representation analysis was performed in R with clusterProfiler v4.12.6 [51, 52], using enricher function for GO terms and enrichKEGG function for KEGG pathways. GO term annotations were generated for A. oryzae RIB40 using OmicsBox [49]. Statistical significance was assessed with p-value and q-value cut-offs of 0.01. GO.db v3.19.1 was used to retrieve GO term names, and rrvgo v1.16.0 was used to identify the corresponding parent terms for GO terms using the closest supported organism, Saccharomyces cerevisiae (org.Sc.sgd.db v3.19.1) [53, 54]. Results for the differential expression analysis and soft-clustering analysis are shown in Additional files 2 and 3.
Sequence similarity network (SSN)
Sequences for the SSN were retrieved from the UniProt database, using reviewed oxidoreductase sequences with confirmed protein-level existence, within the kingdom of fungi. For each condition, 30 of the most highly upregulated oxidoreductases were selected. After removing duplicates, 91 A. oryzae amino acid sequences of interest were combined with the oxidoreductase sequences retrieved from UniProt, resulting in 1519 amino acid sequences (Additional file 4). SSN was generated using SSNpipe, which is freely available on GitHub (https://github.com/ahvdk/SSNpipe), and the edge threshold cut-off was set to 10–60. The SSNs were visualized and edited in Cytoscape v3.10.1 using the yFiles organic layout [55].
Results and discussion
IC50 determination of nine growth inhibitors for A. oryzae RIB40
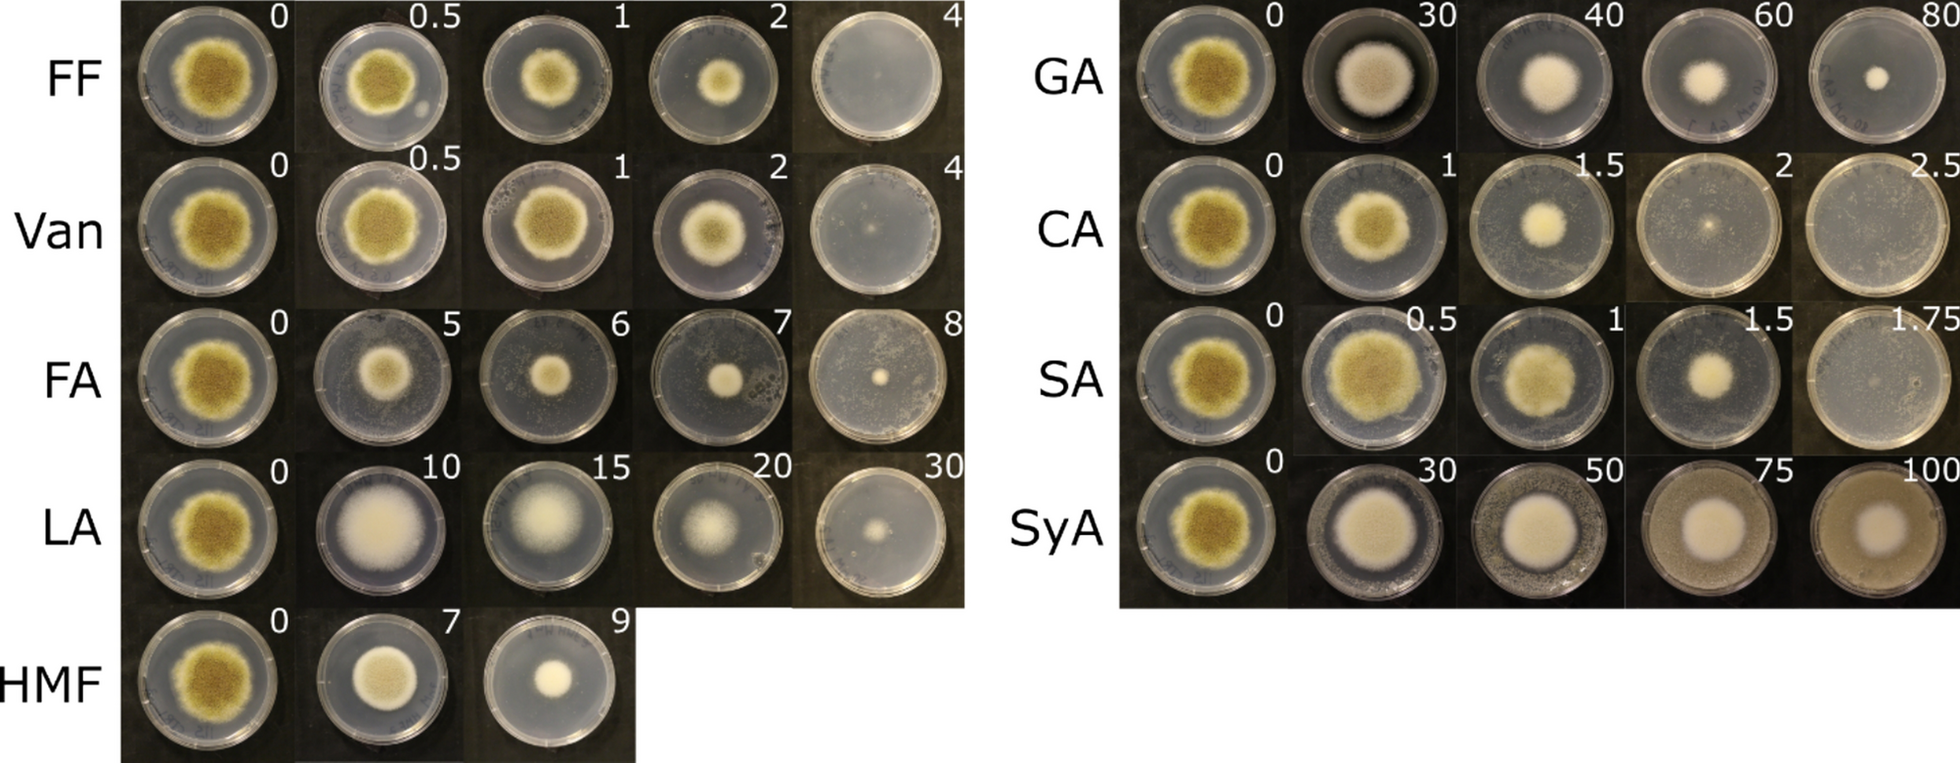
Lignocellulosic hydrolysates contain three main classes of compounds that have an inhibitory effect on fungal growth, i.e., furaldehydes, phenolics, and organic acids [31]. Nine compounds representing those three groups were selected based on literature data. Growth profiles on solid media with and without the inhibitors were generated and analyzed to evaluate the effect of the selected compounds on the growth of A. oryzae strain RIB40 (Fig. 1, Table 1). Of the compounds tested, salicylic acid, cinnamic acid, vanillin, and furfural showed the strongest inhibitory effect. In contrast, syringic acid and gallic acid were the least effective and were excluded from further study. In addition, because of their low solubility in aqueous solutions, cinnamic acid and salicylic acid were also excluded from further study. Therefore, five compounds, i.e., ferulic acid, furfural, HMF, levulinic acid, and vanillin, were selected for transcriptome analysis in shake flask cultivations and were subsequently cultivated at their determined IC₅₀ values (Table 1).

Determination of IC50 values for the selected inhibitors. Growth profiles of Aspergillus oryzae RIB40 on solid media supplemented with different inhibitors found in lignocellulosic hydrolysates. Cultures were grown on CZA medium supplemented with 2% D-fructose and increasing concentrations of the inhibitory compounds. Plates were incubated at + 28 °C for seven days. Control plates without supplementation of the inhibitors were made in quadruplicate. Three biological replicates were prepared for each concentration of the inhibitor. The white number in the upper right corner of each plate indicates the inhibitor concentration (mM). FF, furfural; Van, vanillin; FA, ferulic acid; LA, levulinic acid; HMF, hydroxymethylfurfural; GA, gallic acid; CA, cinnamic acid; SA, salicylic acid; SyA, syringic acid
Transcriptional response of A. oryzae to growth-inhibiting compounds
Sequencing of RNA samples that passed quality control generated approximately 44 million 101 bp paired-end reads per sample. Sufficient quality RNA-seq data from levulinic and ferulic acid samples at three- and five-hour time points could not be generated; therefore, those data points were excluded from further analysis. The Q30 values for all remaining samples were higher than 91.4%, and overall alignment rates per sample against the A. oryzae RIB40 genome [8] were between 83.2% and 94.8%, the average being 90.5%. Genes with adjusted p-value < 0.01 and Log2 fold change (LFC) > 1 or < -1 were considered to be significantly differentially expressed genes (DEG) (Table 2; Tables S1–S5). Principal component analysis (PCA) was conducted to evaluate the reliability of the sequencing data and the replicate samples (Fig. S1). The first two components of the PCA of the dataset, which include all five time points and six conditions, accounted for 78% of the variation, indicating that time and the presence of inhibitors were the main factors contributing to the observed variation between the samples. Replicate samples generally clustered closely together in the PCA plot, except for the HMF 24-h samples, where one outlier sample was observed, but was still included in the dataset.
All five conditions shared 691 genes throughout all the time points that were upregulated and 1131 genes that were downregulated. However, there was a clear difference between the tested compounds in the temporal pattern of the transcriptional response. The highest numbers of DEGs, both up- and downregulated for furfural, HMF, and vanillin, were observed one-hour post-exposure (Table 2), gradually decreasing over time, with the least changes at 24 h after induction. Compared to furfural and vanillin, HMF induced a stronger and longer-lasting transcriptional response, reflected in a greater number of DEGs at later time points. In contrast, the total number of DEGs on ferulic acid and levulinic acid increased between one hour and 24 h. Venn diagrams of DEG detected one hour after the addition of inhibitors show that 498 out of 3869 genes (12.9%) were induced on all five compounds (Fig. 2a), whereas 997 out of 3956 genes (25.2%) were downregulated on all five compounds (Fig. 2b). There was also a high overlap in responses to chemically or functionally related compounds, i.e., between two furaldehydes (furfural and HMF) and between two aromatic compounds (ferulic acid and vanillin). Thus, there were 279 upregulated and 240 downregulated genes that responded exclusively to furaldehydes (furfural and HMF), whereas 281 upregulated and 208 downregulated genes responded specifically to two weak acids (ferulic acid and levulinic acid). A substantial fraction of genes also responded to compounds with aldo groups (furfural, HMF, or vanillin) but not to organic acids (220 upregulated and 263 downregulated genes, respectively). Finally, a set of 115 upregulated genes was shared between all tested compounds except for levulinic acid. Significant overlap in the downregulated genes suggests that a common cellular response to stress is activated in response to any inhibitor treatment applied. On the other hand, the lower overlap among upregulated genes implies that each inhibitor induced a rather specific transcriptional response, which is likely tailored to address the unique challenges posed by each compound.

Venn diagrams of differentially expressed genes of each inhibitor one hour after induction (a) upregulated genes (b) downregulated genes
GO analysis was used to identify the most abundant functional groups among DEGs. Our analysis revealed a considerable overlap in GO terms between up- and downregulated genes (Fig. S2). Such GO terms as “Small molecule binding,” “Oxidoreductase activity,” “Hydrolase activity,” and “Transferase activity” had high scores among upregulated as well as among downregulated genes on all inhibitors and at all time points. This result might indicate large-scale metabolic rearrangements in cells exposed to chemical stress. Additionally, genes assigned to the GO term “Transmembrane transport” had high scores in most of the conditions, reflecting the importance of transporter proteins in cell adaptation to chemical stress.
Our data suggest that exposure to the fungistatic compounds triggers an initial shock response in the cells. This shock response occurs very fast (within the first hour) and affects about 30% to 40% of the total number of genes. At the later time points, on the aldehydic inhibitors, the total number of DEGs decreased, and the number of upregulated genes (especially genes associated with the detoxification of the inhibitors) exceeded the number of downregulated genes, indicating that the cells are beginning to recover from the inhibitor-induced stress.
Clustering-based analysis of the transcriptional responses to inhibitory compounds
To explore broader transcriptional trends beyond GO term analysis, soft clustering was performed on the differentially expressed genes, enabling the identification of distinct expression patterns within the dataset. Enriched GO terms and KEGG pathways for each cluster are listed in Tables S6 and S7, and cluster-specific information is in Additional file 3.
Transcriptional regulation appears to differ in response to aldehydes versus acids. Upon exposure to aldehydic compounds, especially furaldehydes, clusters 10 and 17 (Fig. S3), which contain genes related to transcriptional regulator activity, show an initial strong upregulation, with expression levels gradually returning to baseline over time. In contrast, for the acids, in clusters 22 and 23 that contain genes related to transcriptional activity, the expression of the related genes was significantly lower in comparison to the control (Fig. S4). Differences between the aldehyde and acid compounds regarding transcriptional regulator activity might indicate distinct cellular detoxification strategies, possibly due to the acidic compounds’ lower reactivity and reduced capacity to cause cellular damage, in contrast to the aldehydes. For aldehyde clustering, genes in clusters 8 and 23 displayed a strong initial upregulation, especially on HMF. Cluster 23 consists of genes associated with both proteasomal ubiquitin-independent and -dependent protein catabolic processes, and cluster 8 genes are associated with terms related to autophagy and peroxisomes. Strong upregulation of proteasome-related genes in cluster 23 suggests a cellular response to combat ROS-induced protein damage, whereas the upregulated genes related to autophagy in cluster 8 further support this coordinated response to oxidative stress, since autophagy is important for oxidative stress tolerance in fungi and is likely induced by the increase of intracellular ROS levels [56,57,58]. Peroxisomes generate ROS naturally through several metabolic functions, and in the plant pathogen Alternaria alternata autophagy-mediated degradation of peroxisomes was found to be a central response mechanism to high levels of ROS [58].
In both cluster analyses, genes associated with cell cycle progression, chromosome regulation, and DNA replication (clusters 2 and 3 for aldehydes, 24 and 25 for acids) are strongly downregulated in the first hours following exposure to inhibitory compounds. This suggests that the cell cycle is rapidly halted, likely as a protective response to oxidative stress, which is known to induce cell cycle arrest in S. cerevisiae [59]. Suppression of these processes likely serves a dual function: preventing genomic instability caused by ROS generated during inhibitor metabolism while conserving energy, as metabolism shifts toward catabolic and stress adaptation pathways. At the same time, on aldehydes clusters 4, 15, and 16, which are enriched with GO and KEGG terms related to transcription, translation, RNA metabolism, protein packing, and sorting in the ER and Golgi, are strongly downregulated one hour after induction. Expression levels on clusters 15 and 16 recover to the control strains’ level by the fifth hour, except for HMF, but cluster 4 genes show strong upregulation at three and five hours after induction for furfural and HMF, respectively. The samples exposed to ferulic acid behave similarly (clusters 12, 14, and 15), but interestingly, for levulinic acid, only ER-related terms were downregulated one hour after induction, in contrast to RNA metabolism and ribosome-related terms that were upregulated moderately. Similar results for ribosomal gene downregulation have been reported for S. cerevisiae under lignocellulose-derived inhibitor stress [21, 60, 61].
Cluster 6 for aldehydes and 1 and 8 for acids, associated with oxidoreductase activity terms, showed upregulation in comparison to the control conditions, although on aldehydes, the upregulation was very modest, except for HMF. However, on closer inspection, the majority of the most highly expressed oxidoreductases did not cluster with the aforementioned clusters, but instead into clusters 18 and 9 for aldehydes and acids, respectively, although neither cluster is associated with oxidoreductase activity terms, although both clusters display a strong relative expression change upon first hours after induction.
The initial response is most potent in cells exposed to the furaldehydes and ferulic acid. However, furfural-treated cells recover much faster than those exposed to HMF, suggesting that HMF imposes a more prolonged or severe metabolic burden on the fungus. The clustering analyses suggest that aldehydic compounds generate a much stronger stress response in A. oryzae, during which cellular functions are halted, and energy is conserved as the cells focus on detoxification and recovery of homeostasis. Levulinic acid appears to provoke a distinct cellular reaction compared to furaldehydes or aromatic compounds, as genes involved in RNA metabolism and ribosomal functions are upregulated upon exposure to levulinic acid, contrary to the effect of all the other inhibitors. Additionally, oxidoreductase activity is upregulated only moderately on levulinic acid compared to other inhibitors. Following these results, we focused our further analysis on oxidoreductase genes and genes encoding ABC and MFS transporters.
Phase I detoxification is mainly driven by NAD(P)H-dependent oxidoreductases in A. oryzae
Two principal mechanisms of cell tolerance against inhibitory compounds are their metabolic transformation and excretion/sequestration [12]. Our data showed differential expression of hundreds of predicted oxidoreductase (EC 1.-.-.-.) genes that potentially contribute to phase I detoxification, i.e., the metabolic transformation of the lignocellulose-derived inhibitors. Both clusters 18 for aldehydes and 9 for acids contained largely overlapping oxidoreductases, which were highly induced after the first hour of induction. The majority of the oxidoreductases were putative alcohol and aldehyde dehydrogenases (ADH, ALDH), cinnamyl alcohol dehydrogenases (CAD), aldo–keto reductases (AKR), trans-enoyl reductases (TER), and aryl alcohol dehydrogenases (AADH). These enzymes catalyze the NAD(P)H-dependent interconversion of alcohols, aldehydes, and ketones, as well as the reduction of C=C double bonds in enoyl-CoA substrates. Additionally, several short-chain dehydrogenase/reductases (SDR) genes were observed to be highly induced. Many of these enzymes have been shown to be involved in the detoxification of various inhibitors found in the lignocellulose hydrolysate in several organisms [2, 16, 33, 62]. Additionally, among the most highly expressed oxidoreductases were also glucose-methanol-choline oxidoreductases (GMC), peroxidases, cytochrome P450 monooxygenases (CYP), and fatty acid desaturases (Table S8).
The strongest initial induction of the putative oxidoreductase genes was observed on HMF, where several oxidoreductases were upregulated during the first five hours after induction with an LFC over 10 (Fig. 3, Table S8). Putative CAD AO090010000668 was the gene with the highest fold change one hour after induction on vanillin, with an LFC of 10.7, and the gene with the second highest fold change on furfural, with an LFC of 8.0. Upregulation remained high on HMF even five hours after induction, when increased expression of a 9.8 LFC was still observed. Similarly, on levulinic and ferulic acid, AO090010000668 was among the most highly upregulated oxidoreductases one hour after induction. Three putative AADHs, AO090120000002, AO090026000525, and AO090120000379, exhibited strong induction in response to all inhibitors except for levulinic acid. On HMF, AO090120000002 showed the most substantial induction, as the upregulation reached LFCs of 16.1 and 13.1 three and five hours after induction, respectively. The putative AKR AO090009000538 was the most upregulated gene on HMF and the most upregulated oxidoreductase on ferulic acid one hour after induction, and among the most expressed oxidoreductases on furfural and vanillin. ALDH AO090009000135 was the most upregulated oxidoreductase on levulinic acid after one hour, with an LFC of 8.4. It also showed high upregulation on furaldehydes, but not on aromatics.

Heatmaps of LFC values of the most upregulated oxidoreductases one hour after induction under levulinic acid (LA), ferulic acid (FA), vanillin, furfural, and HMF in comparison to the control strain at different time points. LFC values in the heatmaps are capped from − 5 to 10
The amino acid sequences of the most strongly upregulated oxidoreductases for each inhibitor were used to build a sequence similarity network (SSN). SSN can be used to cluster and visualize similarities within large enzyme families to determine the structural and functional relationships of the enzyme sequences [63] (Fig. 4). Both A. oryzae CADs clustered in the SSN together with S. cerevisiae CADs ADH6 and ADH7 suggesting that they may be functionally related to those putative yeast CADs. Both ADH6 and ADH7 have been shown to have substrate specificity toward aromatic compounds and aliphatic aldehydes, which are both found in the lignocellulolytic hydrolysates and have been shown to contribute to the tolerance toward furaldehydes by reducing furfural and HMF to less toxic furfuryl alcohol and HMF alcohol, respectively [15, 33, 62, 64]. Additionally, ADH6 has been shown to reduce vanillin in S. cerevisiae [65]. A. oryzae AADHs formed two distinct clusters in the SSN, where AO090120000002 clustered together with S. cerevisiae AAD16, whereas AO090120000379 and AO090026000525 clustered together with Phanerochaete chrysosporium AADH AAD1 and S. cerevisiae AAD14. It has been shown that recombinant P. chrysosporium AADH Aadp1 has substrate specificity toward HMF and vanillin [66]. AADHs act primarily on aromatic alcohols and aldehydes [67], but they have been shown to be upregulated under furaldehyde-induced stress in P. ostreatus and S. cerevisiae, including AAD14 and AAD16 [2, 60]. Putative aldehyde reductase AO090023000153 was strongly upregulated on HMF (Table S9) and in the SSN, it clustered together with S. cerevisiae aldehyde reductases ARI1, GRE2, YGL039W, and YDR541C, all of which have been shown to reduce both furfural and HMF, among other aldehydes found in hydrolysates, suggesting a similar role in A. oryzae [68,69,70,71]. However, the function and involvement of many highly expressed oxidoreductases, which are presumably involved in detoxification, remain unclear, as they do not cluster together with any previously characterized fungal oxidoreductase in the SSN.

Sequence similarity network with an E-value cut-off of 10–60 for reported fungal amino acid sequences of oxidoreductases (EC: 1.-.-.-). The sequences were colored based on characterized activity; the shape distinguishes the A. oryzae sequences (diamond) from sequences of characterized S. cerevisiae (circle) and other fungal proteins (square). Bolded sequences represent genes primarily involved in chemical stress responses, with some included to provide functional context within the clusters. Sc, Saccharomyces cerevisiae; Pc, Phanerochaete chrysosporium; Mr, Monascus ruber
In response to each inhibitor, peroxidases were upregulated early after induction, likely to combat the inhibitor-induced ROS, while fatty acid desaturases were upregulated at later time points to restore cell membrane composition after lipid peroxidation damage to maintain membrane fluidity. Surprisingly, few CYPs exhibited significant upregulation during the initial hours after induction, despite their well-documented role in xenobiotic detoxification in fungi and the fact that the A. oryzae genome is predicted to encode at least 149 CYPs [8, 11]. Overall, there was considerable overlap among the inhibitors regarding the most highly expressed oxidoreductases, like the CAD AO090010000668 and AADHs AO090120000002, AO090026000525, and AO090120000379, suggesting that they may be part of a unified response to chemical stress in A. oryzae. Our findings indicate that the detoxification of lignocellulose-derived inhibitors in A. oryzae primarily relies on NAD(P)H-dependent oxidoreductase activity and aligns with previous studies on fungal AADHs and CADs, supporting their activity on cyclic compounds such as furaldehydes in addition to aryl-alcohols and highlighting their potential role in xenobiotic detoxification in fungi. Our SSN analysis can not only guide the functional verification of A. oryzae enzymes that are clustered together with well-known genes but also emphasizes the possibility to discover novel enzyme specificities among genes that remain outside the known clusters. However, a large proportion of the highly induced oxidoreductases, especially SDRs, remain functionally uncharacterized.
Lignocellulose-derived inhibitors elicit distinct transcriptional responses for ABC and MFS transporters
In the phase III of xenobiotic detoxification, the harmful compounds are either excreted outside of the cells or sequestrated into vacuoles [12, 72]. In our dataset, multiple members of two transporter families, MFS and ABC transporters, were upregulated in response to the treatments. The largest subset of MFS transporters clustered into cluster 12 for aldehydic compounds and into cluster 18 for acids. However, the most highly upregulated MFS transporters were distributed more evenly across the clusters, as clusters 21, 23, and 25 for aldehydes and clusters 6 and 8 for acids contained most of the highly expressed MFS transporters. ABC transporters clustered largely into different clusters than MFS transporters, but interestingly, five ABC transporters clustered in the same cluster 18 on aldehydes as the most upregulated oxidoreductases, and eight ABC transporters clustered in cluster 9 on acids.
Eukaryotic ABC proteins are classified into nine subfamilies, of which the largest and most relevant are the ABCB, ABCC, and ABCG subfamilies [24]. Eukaryotic ABC transporters function mainly as exporters with a broad range of substrates [23]. Overall, most of the highly upregulated ABC transporters were ABCG transporters. Two ABCG transporters, AO090003001385 and AO090701000115, showed the strongest upregulation on HMF and vanillin. AO090003001385 was upregulated on vanillin with an LFC of 8.5 three hours after induction and still 24 h after induction with an LFC of 3.1, whereas on HMF, expression reached an LFC of 5.6 five hours after induction (Fig. 5, Table S9). Expression of AO090701000115 was strongest on HMF, with an LFC of 8.5 observed three hours after induction. AO090701000115 is a homolog of atrF, which has been associated with antifungal azole resistance in invasive aspergillosis-causing A. fumigatus [73]. Additionally, ABCG transporters AO090010000219, AO090011000378, and AO090012000328 have also been shown to contribute to azole resistance [74]. ABCG AO090009000055 displayed strong upregulation on aromatics, as an LFC of 4 was reached three hours after induction on vanillin, and an LFC of 6.5 on ferulic acid 24 h after induction. Upregulation of AO090038000511 was only observed on ferulic acid, whereas elevated expression levels for AO090038000449 were only attained under exposure to furaldehydes. In P. chrysogenum, Weber et al. [22] showed that a deletion of an ABCG transporter ABC40 (81% amino acid sequence similarity to AO090038000511 and 66% similarity to AO090009000055) led to increased sensitivity to phenylacetic, sorbic, and benzoic acids, inferring ABC40 involvement in weak acid detoxification. Other studies have also shown involvement of ABC transporters in resistance to several weak acids in S. cerevisiae [19, 20]. Interestingly, the ABCG transporters AO090003000126, AO090012000413, AO090038000449, and AO090701000115 all clustered in cluster 18 on aldehydic compounds.

Heatmaps of LFC of the most highly upregulated A. oryzae ABC transporter genes under levulinic acid (LA), ferulic acid (FA), vanillin, furfural, and HMF in comparison to the control strain at different time points. LFC values in the heatmaps are capped from − 4 to 8
Several MFS transporters were also highly upregulated under exposure to inhibitors found in lignocellulolytic hydrolysates (Table S9). The research of fungal MFS transporters has mainly focused on sugar transporters, which constitute the largest portion of the transporter family, apart from the invasive fungal species, such as those in the genus Candida. Many MFS transporter families are associated with drug efflux and the secretion of toxins, and several MFS transporters have been shown to confer resistance to weak acids, azoles, and other drugs in S. cerevisiae [75]. In S. cerevisiae, polyamine transporters have been shown to be upregulated under exposure to furaldehydes [21]. Of the most highly upregulated MFS transporters (Fig. S5), AO090010000407, AO090005001365, AO090102000388, and AO090009000008, which have been annotated as multidrug transporters in A. flavus, showed strong upregulation on at least four different conditions, whereas several others were upregulated on two or three conditions. Interestingly, AO090009000008, which is not putatively annotated as a polyamine transporter, showed similarity to yeast polyamine transporters Tpo2p and Tpo3p, which have been shown to alleviate acetic acid stress in S. cerevisiae [75]. Tpo2p and Tpo3p also showed lower similarity to several other highly induced transporters, AO090102000388, AO090102000135, AO090026000494, and AO090010000350. AO090010000407 was the most upregulated MFS transporter for the aldehydic compounds one hour after induction, and for HMF, it remained the most upregulated MFS transporter still five hours after induction, with an LFC of 9.3. For levulinic acid, the putative monocarboxylate transporters AO090020000614 and AO090038000078 displayed a significant increase in expression. AO090020000614 was the most highly induced gene on levulinic acid with an LFC of 11.6 one hour after induction, whereas AO090038000078 was upregulated with an LFC of 5.6. On the other inhibitors, considerably lower upregulation was observed for the two transporters. Additionally, putative multidrug transporter AO090038000031 showed significantly stronger upregulation only on levulinic acid, one hour after induction.
The A. oryzae genome is predicted to code for at least 365 MFS transporters and 66 ABC transporters alone; however, the natural substrates of these transporters involved in xenobiotic excretion remain elusive [8]. Most efflux transporters can excrete a wide range of substrates, thus complicating the identification of the role of a single transporter in detoxification. The strong induction of specific ABC and MFS transporters observed in our study likely reflects their important role in physiological responses to chemical stress. At least some of the induced transporters probably excrete either lignocellulosic inhibitors or products of their conversion, thereby helping reduce their intracellular concentrations. Our data suggest that the monocarboxylate transporter AO090020000614 is crucial for levulinic acid tolerance in A. oryzae.
Identification of genes involved in aromatic compound metabolism
Four putative decarboxylases, AO090001000093, AO090001000094, AO090003000423, and AO090003000424, showed upregulation on ferulic acid, and only AO090001000093 was upregulated on vanillin (Table S10). AO090001000093 and AO090001000094 were highly upregulated one hour after induction with an LFC over 7.4. Both AO090001000093 and AO090003000424 showed amino acid similarity to S. cerevisiae ferulic acid decarboxylase FDC1 and its homolog in A. niger [76, 77], whereas AO090001000094 and AO090003000423 are homologous to S. cerevisiae PAD1 and A. niger padA1 [78]. Both genes are essential for the decarboxylation of ferulic acid into 4-vinylguaiacol in S. cerevisiae [76]. It has been shown that in A. niger PadA1 does not decarboxylate ferulic acid but ferulic acid and other hydrocinnamic acids are degraded through CoA-dependent β-oxidative pathway [37, 76, 78]. However, the homologs of the CoA-dependent β-oxidative pathway genes in A. oryzae did not show differential expression in our data on ferulic acid, suggesting that A. oryzae may utilize different metabolic pathways in ferulic acid conversion. Our expression data, together with previous studies, suggest that AO090001000093 and AO090003000424 are responsible for decarboxylating ferulic acid into 4-vinylguaiacol in A. oryzae, although it is not known which genes are responsible for the conversion of 4-vinylguaiacol further in the pathway. A high induction level of AO090001000093 (it is the most highly induced gene on ferulic acid one hour after induction) indicates the importance of this reaction in alleviating the toxicity of ferulic acid.
In A. niger, vanillin is converted into 3-oxoadipate via metabolic pathway consisting of five enzymes; vanillin dehydrogenase (vdhA), vanillate hydroxylase (vhyA), methoxyhydroquinone 1,2 dioxygenase (mhdA), maleylacetate reductase, and 4-oxomonomethyl adipate esterase (omeA) [36]. A. niger vdhA has two homologs in A. oryzae, AO090003000983 and AO090005000290, but only AO090003000983 was found to be differentially expressed. Upregulation was not observed on ferulic acid. Vanillin is typically found in cells at low concentrations and is quickly metabolized [79, 80]. It is possible that the intracellular concentrations of intermediate vanillin during ferulic acid conversion may not be high enough to require strong vdhA activation, as observed with A. niger cells fed vanillin extracellularly [80]. In contrast, vhyA homolog AO090003000219 was heavily upregulated on both aromatics (Table S10). MhdA homolog AO090012000156 was upregulated on both aromatics, but with a higher LFC and longer upregulation period on vanillin. Maleylacetate reductase AO090012000939 showed upregulation on vanillin until five hours after induction, but no differential expression was observed on ferulic acid. OmeA homolog AO090023000186 was upregulated on both aromatic compounds, with an LFC of 5.9 on vanillin after three hours of induction. Strong upregulation of decarboxylases and vhyA, and the lack of differential expression of the genes present in the CoA-dependent β-oxidative pathway, suggests that ferulic acid is metabolized via the same metabolic route as vanillin, even though vdhA is not differentially expressed.
The intermediate methoxyhydroquinone could be converted into 4-hydroxy-6-methoxy-6-oxohexa-2,4-enedioic acid either by MhdA or into hydroxyquinol by an uncharacterized O-demethylase. However, unlike in bacteria, no fungal O-demethylases have been characterized in detail. Fungi also exploit cytochrome P450 oxidases, peroxidases, laccases, and ROS generated by Fenton chemistry to achieve lignin O-demethylation [81]. In response to vanillin treatment, hqdA homolog AO090011000385 displayed strong upregulation up to five hours after induction, but on ferulic acid, increased expression was only observed 24 h after induction. Even though A. niger HqdA has high catalytic efficiency toward hydroxyquinol [82]. Lubbers et al. [35] showed that the deletion of hqdA did not affect the growth on ferulic acid, vanillin, or vanillic acid, suggesting that the alternative pathway where methoxyhydroquinone would be converted into hydroxyquinol is not the primary metabolic route. Another possible pathway through which vanillin could be metabolized is the protocatechuate branch of the β-ketoadipate pathway, which would require the O-demethylation of vanillic acid into protocatechuic acid. However, such an enzyme has not yet been discovered in fungi. Sgro et al. [83] characterized genes involved in the protocatechuate branch of the β-ketoadipate pathway in A. niger, and in our data all corresponding A. oryzae homologs, namely, protocatechuic acid 3,4-dioxygenase prcA AO090038000040, the 3-carboxy-cis,cis-muconate cyclase cmcA AO090023000419, and 3-carboxymuconolactone hydrolase/decarboxylase chdA AO090023000421, displayed strong upregulation on vanillin, whereas on ferulic acid, the upregulation of genes involved in the pathway was more modest, and upregulation was not observed for all the genes. Based on our transcriptome data and previous studies by others in A. niger, we suggest a metabolic pathway of ferulic acid and vanillin metabolism (Fig. 6) [35, 36, 83].

Overview of the genes proposed for ferulic acid and vanillin (a) metabolic pathways in A. oryzae (b) LFC values of the genes. Black arrows indicate a known homolog from A. niger where the corresponding genes have been characterized. White arrows indicate a suggested conversion where the corresponding genes are unknown. Multiple arrows indicate multiple-step conversions. Black line indicates ring cleavage. LFC values in the heatmaps are capped from -5 to 10. Genes after the gap belong to the CoA-dependent β-oxidative pathway
Identification of the genes involved in furaldehyde degradation
The catabolism of furaldehyde in fungi is not as well understood as that in bacteria, although a degradation pathway for HMF has been proposed in Aspergillus nidulans as well as for both furfural and HMF in the biodetoxification fungus Amorphotheca resinae ZN1 [4, 28, 29, 84]. For S. cerevisiae, the reduction of both furaldehydes to their respective alcohols has been demonstrated, but their oxidation into acids has not [85]. A. resinae ZN1 has been shown to convert both furfural and HMF into their respective alcohols and acids [84]. Ran et al. [84] also proposed a pathway for furaldehyde catabolism in A. resinae, suggesting that the pathway occurs similarly to that in C. basilensis as presented by Koopman et al. [28]. In the proposed pathway, both furaldehydes are reduced to more stable and less toxic alcohols when sufficient oxygen is not available. If oxygen is present, the inhibitors or their respective alcohols are oxidized back to aldehydes and subsequently into their respective acids. HMF is oxidized into HMF acid, which is converted to 2,5-furan-dicarboxylic acid (FDCA) and subsequently to 2-furoic acid (FCA), where the degradation pathways for HMF and furfural converge, followed by a further six-step conversion to 2-oxoglutaric acid, which then enters the TCA cycle. In a transcriptome analysis conducted by Wang et al. [29], furaldehyde-induced stress led to a significant upregulation of ADHs, ALDHs, SDRs, and AKRs in A. resinae ZN1. Several of the genes proposed to be involved in the detoxification of the furaldehydes, either to their respective alcohols or acids, showed strong similarity to the genes induced by the furaldehydes in A. oryzae (Table S11).
Martins et al. [4] identified an HMF degradation pathway in A. nidulans, corresponding to the previously identified three-gene cluster hmfFGH of C. brasiliensis, which is responsible for the oxidation and decarboxylation steps of HMF conversion into FCA [28]. However, none of the homologs or orthogroup members of AN4212/hmfG displayed upregulation on HMF in our data. Both AN7164/hmfF and AN12147/hmfG are decarboxylases that should mediate the conversion of FDCA to FCA. Both genes have two homologs in A. oryzae: AO090001000093 and AO090003000424 for AN7164, and AO090001000094 and AO090003000423 for AN12147. Martins et al. [4] did not observe any significantly changed expression levels for AN12147 when A. nidulans was exposed to HMF or its derivatives. On the contrary, our data showed high upregulation for AO090003000424 and AO090003000423 in response to both furaldehydes, and for AO090001000094 in response to HMF (Table S11). As shown by both Ran et al. [84] and Martins et al. [4], the conversion rates of HMF and furfural into their corresponding acids in A. resinae and A. nidulans, even under favorable conditions, are significantly lower compared to their conversion into corresponding alcohols, which may explain the lack of strong induction for the AN4212 homologs in A. oryzae, if they are involved in the HMF degradation. Similarly to A. resinae, we have identified several genes possibly involved in the furaldehyde degradation in A. oryzae. However, to our knowledge, no enzyme has been characterized in fungi that can convert furfural or HMF to their respective acids or further in the proposed degradation pathway.
Conclusions
This study describes the transcriptional response of A. oryzae RIB40 to cytotoxic compounds of lignocellulosic hydrolysates. Our results highlight pathways through which A. oryzae metabolizes and detoxifies these inhibitors. Significant transcriptome changes were observed for all inhibitors, with strong induction of genes encoding predicted oxidoreductases, presumably in response to oxidative stress triggered by these chemicals. The detoxification of ferulic acid and vanillin likely occurs via the same catabolic pathway, whereas the main pathway used by A. oryzae to alleviate furaldehyde toxicity is the reduction of aldehydes to alcohols. For levulinic acid, active excretion by transporters may be the main tolerance mechanism. Aldehydic inhibitors induced a greater transcriptomic response to oxidative stress than organic acids, as indicated by a metabolic shift to stress response pathways. Several uncharacterized oxidoreductases and transporters were discovered to be differentially regulated by lignocellulosic inhibitors. These genes will be crucial targets for developing robust fungal strains utilizing lignocellulosic side streams as carbon sources.
Availability of data and materials
The dataset supporting the conclusions of this article is available in NCBI’s Gene Expression Omnibus and is accessible through GEO Series accession number GSE296876 (https://www.ncbi.nlm.nih.gov/geo/query/acc.cgi?acc = GSE296876).
References
-
Jönsson LJ, Alriksson B, Nilvebrant NO. Bioconversion of lignocellulose: inhibitors and detoxification. Biotechnol Biofuels. 2013;6:16. https://doi.org/10.1186/1754-6834-6-16.
-
Feldman D, Kowbel DJ, Glass NL, Yarden O, Hadar Y. Detoxification of 5-hydroxymethylfurfural by the Pleurotus ostreatus lignolytic enzymes aryl alcohol oxidase and dehydrogenase. Biotechnol Biofuels. 2015;8:63. https://doi.org/10.1186/s13068-015-0244-9.
-
Feldman D, Kowbel DJ, Cohen A, Glass NL, Hadar Y, Yarden O. Identification and manipulation of Neurospora crassa genes involved in sensitivity to furfural. Biotechnol Biofuels. 2019;12:210. https://doi.org/10.1186/s13068-019-1550-4.
-
Martins C, Hartmann DO, Varela A, Coelho JAS, Lamosa P, Afonso CAM, et al. Securing a furan-based biorefinery: disclosing the genetic basis of the degradation of hydroxymethylfurfural and its derivatives in the model fungus Aspergillus nidulans. Microb Biotechnol. 2020;13:1983–96. https://doi.org/10.1111/1751-7915.13649.
-
Troiano D, Orsat V, Dumont MJ. Use of filamentous fungi as biocatalysts in the oxidation of 5-(hydroxymethyl)furfural (HMF). Bioresour Technol. 2022;344: 126169. https://doi.org/10.1016/j.biortech.2021.126169.
-
Kubisch C, Ochsenreither K. Detoxification of a pyrolytic aqueous condensate from wheat straw for utilization as substrate in Aspergillus oryzae DSM 1863 cultivations. Biotechnol Biofuels Bioprod. 2022;15:18. https://doi.org/10.1186/s13068-022-02115-z.
-
Kövilein A, Umpfenbach J, Ochsenreither K. Acetate as substrate for l-malic acid production with Aspergillus oryzae DSM 1863. Biotechnol Biofuels. 2021;14:48. https://doi.org/10.1186/s13068-021-01901-5.
-
Machida M, Asai K, Sano M, Tanaka T, Kumagai T, Terai G, et al. Genome sequencing and analysis of Aspergillus oryzae. Nature. 2005;438:1157–61. https://doi.org/10.1038/nature04300.
-
Palmqvist E, Hahn-Hägerdal B. Fermentation of lignocellulosic hydrolysates. II: Inhibitors and mechanisms of inhibition. Bioresour Technol. 2000;74:25–33. https://doi.org/10.1016/s0960-8524(99)00161-3.
-
Di L, Balesano A, Jordan S, Shi SM. The role of alcohol dehydrogenase in drug metabolism: beyond ethanol oxidation. AAPS J. 2021;23:20. https://doi.org/10.1208/s12248-020-00536-y.
-
Lah L, Podobnik B, Novak M, Korošec B, Berne S, Vogelsang M, et al. The versatility of the fungal cytochrome P450 monooxygenase system is instrumental in xenobiotic detoxification. Mol Microbiol. 2011;81:1374–89.
-
Xu C, Li CYT, Kong ANT. Induction of phase I, II and III drug metabolism/transport by xenobiotics. Arch Pharm Res. 2005;28:249–68. https://doi.org/10.1007/bf02977789.
-
Paumi CM, Chuk M, Snider J, Stagljar I, Michaelis S. ABC transporters in Saccharomyces cerevisiae and their interactors: new technology advances the biology of the ABCC (MRP) subfamily. Microbiol Mol Biol Rev. 2009;73:577–93. https://doi.org/10.1128/mmbr.00020-09.
-
Sang H, Hulvey JP, Green R, Xu H, Im J, Chang T, et al. A xenobiotic detoxification pathway through transcriptional regulation in filamentous fungi. MBio. 2018;9:1–17. https://doi.org/10.1128/mbio.00457-18.
-
Larroy C, Fernández MR, Gozález E, Parés X, Biosca JA. Characterization of the Saccharomyces cerevisiae YMR318C (ADH6) gene product as a broad specificity NADPH-dependent alcohol dehydrogenase: relevance in aldehyde reduction. Biochem J. 2002;361:163. https://doi.org/10.1042/0264-6021:3610163.
-
Ma M, Wang X, Zhang X, Zhao X. Alcohol dehydrogenases from Scheffersomyces stipitis involved in the detoxification of aldehyde inhibitors derived from lignocellulosic biomass conversion. Appl Microbiol Biotechnol. 2013;97:8411–25. https://doi.org/10.1007/s00253-013-5110-8.
-
Almario MP, Reyes LH, Kao KC. Evolutionary engineering of Saccharomyces cerevisiae for enhanced tolerance to hydrolysates of lignocellulosic biomass. Biotechnol Bioeng. 2013;110:2616–23. https://doi.org/10.1002/bit.24938.
-
Wang X, Liang Z, Hou J, Shen Y, Bao X. The absence of the transcription factor Yrr1p, identified from comparative genome profiling, increased vanillin tolerance due to enhancements of ABC transporters expressing, rRNA processing and ribosome biogenesis in Saccharomyces cerevisiae. Front Microbiol. 2017;8:1–12. https://doi.org/10.3389/fmicb.2017.00367.
-
Piper P, Mahé Y, Thompson S, Pandjaitan R, Holyoak C, Egner R, et al. The Pdr12 ABC transporter is required for the development of weak organic acid resistance in yeast. EMBO J. 1998;17:4257–65. https://doi.org/10.1093/emboj/17.15.4257.
-
Nygård Y, Mojzita D, Toivari M, Penttilä M, Wiebe MG, Ruohonen L. The diverse role of Pdr12 in resistance to weak organic acids. Yeast. 2014;31:219–32. https://doi.org/10.1002/yea.3011.
-
Ma M, Liu ZL. Comparative transcriptome profiling analyses during the lag phase uncover YAP1, PDR1, PDR3, RPN4, and HSF1 as key regulatory genes in genomic adaptation to the lignocellulose derived inhibitor HMF for Saccharomyces cerevisiae. BMC Genomics. 2010;11:660. https://doi.org/10.1186/1471-2164-11-660.
-
Weber SS, Kovalchuk A, Bovenberg RAL, Driessen AJM. The ABC transporter ABC40 encodes a phenylacetic acid export system in Penicillium chrysogenum. Fungal Genet Biol. 2012;49:915–21. https://doi.org/10.1016/j.fgb.2012.09.003.
-
Víglaš J, Olejníková P. An update on ABC transporters of filamentous fungi—from physiological substrates to xenobiotics. Microbiol Res. 2021;246: 126684. https://doi.org/10.1016/j.micres.2020.126684.
-
Kovalchuk A, Driessen AJM. Phylogenetic analysis of fungal ABC transporters. BMC Genomics. 2010;11:177. https://doi.org/10.1186/1471-2164-11-177.
-
Kim D, Hahn JS. Roles of the Yap1 transcription factor and antioxidants in Saccharomyces cerevisiae’s tolerance to furfural and 5-Hydroxymethylfurfural, which function as Thiol-Reactive electrophiles generating oxidative stress. Appl Environ Microbiol. 2013;79:5069–77. https://doi.org/10.1128/aem.00643-13.
-
Modig T, Lidén G, Taherzadeh MJ. Inhibition effects of furfural on alcohol dehydrogenase, aldehyde dehydrogenase and pyruvate dehydrogenase. Biochem J. 2002;363:769–76. https://doi.org/10.1042/0264-6021:3630769.
-
Hristozova T, Angelov A, Tzvetkova B, Paskaleva D, Gotcheva V, Gargova S, et al. Effect of furfural on carbon metabolism key enzymes of lactose-assimilating yeasts. Enzyme Microb Technol. 2006;39:1108–12.
-
Koopman F, Wierckx N, De Winde JH, Ruijssenaars HJ. Identification and characterization of the furfural and 5-(hydroxymethyl)furfural degradation pathways of Cupriavidus basilensis HMF14. Proc Natl Acad Sci U S A. 2010;107:4919–24. https://doi.org/10.1073/pnas.0913039107.
-
Wang X, Gao Q, Bao J. Transcriptional analysis of Amorphotheca resinae ZN1 on biological degradation of furfural and 5-hydroxymethylfurfural derived from lignocellulose pretreatment. Biotechnol Biofuels. 2015;8:136. https://doi.org/10.1186/s13068-015-0323-y.
-
Jilani SB, Olson DG. Mechanism of furfural toxicity and metabolic strategies to engineer tolerance in microbial strains. Microb Cell Fact. 2023;22:221. https://doi.org/10.1186/s12934-023-02223-x.
-
Kudahettige Nilsson RL, Holmgren M, Madavi B, Nilsson RT, Sellstedt A. Adaptability of Trametes versicolor to the lignocellulosic inhibitors furfural, HMF, phenol and levulinic acid during ethanol fermentation. Biomass Bioenerg. 2016;90:95–100. https://doi.org/10.1016/j.biombioe.2016.03.030.
-
Lewis Liu Z, Moon J, Andersh BJ, Slininger PJ, Weber S. Multiple gene-mediated NAD(P)H-dependent aldehyde reduction is a mechanism of in situ detoxification of furfural and 5-hydroxymethylfurfural by Saccharomyces cerevisiae. Appl Microbiol Biotechnol. 2008;81:743–53. https://doi.org/10.1007/s00253-008-1702-0.
-
Petersson A, Almeida JRM, Modig T, Karhumaa K, Hahn-Hägerdal B, Gorwa-Grauslund MF, et al. A 5-hydroxymethyl furfural reducing enzyme encoded by the Saccharomyces cerevisiae ADH6 gene conveys HMF tolerance. Yeast. 2006;23:455–64. https://doi.org/10.1002/yea.1370.
-
Guarnieri MT, Ann Franden M, Johnson CW, Beckham GT. Conversion and assimilation of furfural and 5-(hydroxymethyl)furfural by Pseudomonas putida KT2440. Metab Eng Commun. 2017;4:22–8. https://doi.org/10.1016/j.meteno.2017.02.001.
-
Lubbers RJM, Dilokpimol A, Peng M, Visser J, Mäkelä MR, Hildén KS, et al. Discovery of novel p-Hydroxybenzoate-m-hydroxylase, protocatechuate 3,4 ring-cleavage dioxygenase, and hydroxyquinol 1,2 ring-cleavage dioxygenase from the filamentous fungus Aspergillus niger. ACS Sustain Chem Eng. 2019;7:19081–9. https://doi.org/10.1021/acssuschemeng.9b04918.
-
Lubbers RJM, Dilokpimol A, Nousiainen PA, Cioc RC, Visser J, Bruijnincx PCA, et al. Vanillic acid and methoxyhydroquinone production from guaiacyl units and related aromatic compounds using Aspergillus niger cell factories. Microb Cell Fact. 2021;20:151. https://doi.org/10.1186/s12934-021-01643-x.
-
Lubbers RJM, Dilokpimol A, Visser J, de Vries RP. Aspergillus niger uses the peroxisomal CoA-dependent β-oxidative genes to degrade the hydroxycinnamic acids caffeic acid, ferulic acid, and p-coumaric acid. Appl Microbiol Biotechnol. 2021;105:4199–211. https://doi.org/10.1007/s00253-021-11311-0.
-
Lubbers RJM, Dilokpimol A, Visser J, Hildén KS, Mäkelä MR, de Vries RP. Discovery and functional analysis of a salicylic acid hydroxylase from Aspergillus niger. Appl Environ Microbiol. 2021;87:1–14. https://doi.org/10.1128/aem.02701-20.
-
Adeboye PT, Bettiga M, Aldaeus F, Larsson PT, Olsson L. Catabolism of coniferyl aldehyde, ferulic acid and p-coumaric acid by Saccharomyces cerevisiae yields less toxic products. Microb Cell Fact. 2015;14:149. https://doi.org/10.1186/s12934-015-0338-x.
-
Casal M, Cardoso H, Leão C. Mechanisms regulating the transport of acetic acid in Saccharomyces cerevisiae. Microbiology. 1996;142:1385–90. https://doi.org/10.1099/13500872-142-6-1385.
-
Guaragnella N, Antonacci L, Passarella S, Marra E, Giannattasio S. Achievements and perspectives in yeast acetic acid-induced programmed cell death pathways. Biochem Soc Trans. 2011;39:1538–43.
-
Kallio MA, Tuimala JT, Hupponen T, Klemelä P, Gentile M, Scheinin I, et al. Chipster: user-friendly analysis software for microarray and other high-throughput data. BMC Genomics. 2011;12:507. https://doi.org/10.1186/1471-2164-12-507.
-
Jiang H, Lei R, Ding S-W, Zhu S. Skewer: a fast and accurate adapter trimmer for next-generation sequencing paired-end reads. BMC Bioinformatics. 2014;15:182. https://doi.org/10.1186/1471-2105-15-182.
-
Bolger AM, Lohse M, Usadel B. Trimmomatic: a flexible trimmer for Illumina sequence data. Bioinformatics. 2014;30:2114–20. https://doi.org/10.1093/bioinformatics/btu170.
-
Kersey PJ, Allen JE, Armean I, Boddu S, Bolt BJ, Carvalho-Silva D, et al. Ensembl Genomes 2016: more genomes, more complexity. Nucleic Acids Res. 2016;44:D574–80. https://doi.org/10.1093/nar/gkv1209.
-
Kim D, Paggi JM, Park C, Bennett C, Salzberg SL. Graph-based genome alignment and genotyping with HISAT2 and HISAT-genotype. Nat Biotechnol. 2019;37:907–15. https://doi.org/10.1038/s41587-019-0201-4.
-
Anders S, Pyl PT, Huber W. HTSeq—a Python framework to work with high-throughput sequencing data. Bioinformatics. 2015;31:166–9. https://doi.org/10.1093/bioinformatics/btu638.
-
Love MI, Huber W, Anders S. Moderated estimation of fold change and dispersion for RNA-seq data with DESeq2. Genome Biol. 2014;15:550. https://doi.org/10.1186/s13059-014-0550-8.
-
Gotz S, Garcia-Gomez JM, Terol J, Williams TD, Nagaraj SH, Nueda MJ, et al. High-throughput functional annotation and data mining with the Blast2GO suite. Nucleic Acids Res. 2008;36:3420–35. https://doi.org/10.1093/nar/gkn176.
-
Kumar L, Futschik ME. Mfuzz: a software package for soft clustering of microarray data. Bioinformation. 2007;2:5–7. https://doi.org/10.6026/97320630002005.
-
Yu G, Wang L-G, Han Y, He Q-Y. clusterProfiler: an R package for comparing biological themes among gene clusters. Omi A J Integr Biol. 2012;16:284–7. https://doi.org/10.1089/omi.2011.0118.
-
Wu T, Hu E, Xu S, Chen M, Guo P, Dai Z, et al. clusterProfiler 4.0: a universal enrichment tool for interpreting omics data. Innovation. 2021;2:100141. https://doi.org/10.1016/j.xinn.2021.100141.
-
Carlson M. GO.db: a set of annotation maps describing the entire Gene Ontology [Internet]. 2022.
-
Sayols S. rrvgo: a Bioconductor package for interpreting lists of Gene Ontology terms. microPublication Biol. 2023;2023.
-
Shannon P, Markiel A, Ozier O, Baliga NS, Wang JT, Ramage D, et al. Cytoscape: a software environment for integrated models of biomolecular interaction networks. Genome Res. 2003;13:2498–504. https://doi.org/10.1101/gr.1239303.
-
Filomeni G, De Zio D, Cecconi F. Oxidative stress and autophagy: the clash between damage and metabolic needs. Cell Death Differ. 2015;22:377–88. https://doi.org/10.1038/cdd.2014.150.
-
Hou J, Wang J-J, Lin H-Y, Feng M-G, Ying S-H. Roles of autophagy-related genes in conidiogenesis and blastospore formation, virulence, and stress response of Beauveria bassiana. Fungal Biol. 2020;124:1052–7. https://doi.org/10.1016/j.funbio.2020.10.002.
-
Wu P, Choo CYL, Lu H, Wei X, Chen Y, Yago JI, et al. Pexophagy is critical for fungal development, stress response, and virulence in Alternaria alternata. Mol Plant Pathol. 2022;23:1538–54. https://doi.org/10.1111/mpp.13247.
-
Shapira M, Segal E, Botstein D. Disruption of yeast forkhead-associated cell cycle transcription by oxidative stress. Mol Biol Cell. 2004;15:5659–69. https://doi.org/10.1091/mbc.e04-04-0340.
-
Bajwa PK, Ho CY, Chan CK, Martin VJJ, Trevors JT, Lee H. Transcriptional profiling of Saccharomyces cerevisiae T2 cells upon exposure to hardwood spent sulphite liquor: Comparison to acetic acid, furfural and hydroxymethylfurfural. Antonie van Leeuwenhoek, Int J Gen Mol Microbiol. 2013;103:1281–95. https://doi.org/10.1007/s10482-013-9909-1.
-
Li B-Z, Yuan Y-J. Transcriptome shifts in response to furfural and acetic acid in Saccharomyces cerevisiae. Appl Microbiol Biotechnol. 2010;86:1915–24. https://doi.org/10.1007/s00253-010-2518-2.
-
Heer D, Heine D, Sauer U. Resistance of Saccharomyces cerevisiae to high concentrations of furfural is based on NADPH-dependent reduction by at least two oxireductases. Appl Environ Microbiol. 2009;75:7631–8.
-
Atkinson HJ, Morris JH, Ferrin TE, Babbitt PC. Using sequence similarity networks for visualization of relationships across diverse protein superfamilies. PLoS ONE. 2009;4:e4345. https://doi.org/10.1371/journal.pone.0004345.
-
Larroy C, Parés X, Biosca JA. Characterization of a Saccharomyces cerevisiae NADP(H)-dependent alcohol dehydrogenase (ADHVII), a member of the cinnamyl alcohol dehydrogenase family. Eur J Biochem. 2002;269:5738–45. https://doi.org/10.1046/j.1432-1033.2002.03296.x.
-
Wang X, Liang Z, Hou J, Bao X, Shen Y. Identification and functional evaluation of the reductases and dehydrogenases from Saccharomyces cerevisiae involved in vanillin resistance. BMC Biotechnol. 2016;16:31. https://doi.org/10.1186/s12896-016-0264-y.
-
Yang D-D, François JM, de Billerbeck GM. Cloning, expression and characterization of an aryl-alcohol dehydrogenase from the white-rot fungus Phanerochaete chrysosporium strain BKM-F-1767. BMC Microbiol. 2012;12:126. https://doi.org/10.1186/1471-2180-12-126.
-
Gutierrez A, Caramelo L, Prieto A, Martinez MJ, Martinez AT. Anisaldehyde production and aryl-alcohol oxidase and dehydrogenase activities in ligninolytic fungi of the genus Pleurotus. Appl Environ Microbiol. 1994;60:1783–8.
-
Bowman MJ, Jordan DB, Vermillion KE, Braker JD, Moon J, Liu ZL. Stereochemistry of furfural reduction by a Saccharomyces cerevisiae aldehyde reductase that contributes to in situ furfural detoxification. Appl Environ Microbiol. 2010;76:4926–32. https://doi.org/10.1128/aem.00542-10.
-
Liu ZL, Moon J. A novel NADPH-dependent aldehyde reductase gene from Saccharomyces cerevisiae NRRL Y-12632 involved in the detoxification of aldehyde inhibitors derived from lignocellulosic biomass conversion. Gene. 2009;446:1–10. https://doi.org/10.1016/j.gene.2009.06.018.
-
Moon J, Liu ZL. Engineered NADH-dependent GRE2 from Saccharomyces cerevisiae by directed enzyme evolution enhances HMF reduction using additional cofactor NADPH. Enzyme Microb Technol. 2012;50:115–20. https://doi.org/10.1016/j.enzmictec.2011.10.007.
-
Moon J, Liu ZL. Direct enzyme assay evidence confirms aldehyde reductase function of Ydr541cp and Ygl039wp from Saccharomyces cerevisiae. Yeast. 2015;32:399–407. https://doi.org/10.1002/yea.3067.
-
Sipos G, Kuchler K. Fungal ATP-binding cassette (ABC) transporters in drug resistance & detoxification. Curr Drug Targets. 2006;7:471–81.
-
Slaven JW, Anderson MJ, Sanglard D, Dixon GK, Bille J, Roberts IS, et al. Increased expression of a novel Aspergillus fumigatus ABC transporter gene, atrF, in the presence of itraconazole in an itraconazole resistant clinical isolate. Fungal Genet Biol. 2002;36:199–206. https://doi.org/10.1016/s1087-1845(02)00016-6.
-
Miura D, Sugiyama K, Ito A, Ohba-Tanaka A, Tanaka M, Shintani T, et al. The PDR-type ABC transporters AtrA and AtrG are involved in azole drug resistance in Aspergillus oryzae. Biosci Biotechnol Biochem. 2018;82:1840–8. https://doi.org/10.1080/09168451.2018.1497941.
-
Sá-Correia I, dos Santos SC, Teixeira MC, Cabrito TR, Mira NP. Drug:H+ antiporters in chemical stress response in yeast. Trends Microbiol. 2009;17:22–31. https://doi.org/10.1016/j.tim.2008.09.007.
-
Mukai N, Masaki K, Fujii T, Kawamukai M, Iefuji H. PAD1 and FDC1 are essential for the decarboxylation of phenylacrylic acids in Saccharomyces cerevisiae. J Biosci Bioeng. 2010;109:564–9. https://doi.org/10.1016/j.jbiosc.2009.11.011.
-
Payne KAP, White MD, Fisher K, Khara B, Bailey SS, Parker D, et al. New cofactor supports α,β-unsaturated acid decarboxylation via 1,3-dipolar cycloaddition. Nature. 2015;522:497–501. https://doi.org/10.1038/nature14560.
-
Stratford M, Plumridge A, Pleasants MW, Novodvorska M, Baker-Glenn CAG, Pattenden G, et al. Mapping the structural requirements of inducers and substrates for decarboxylation of weak acid preservatives by the food spoilage mould Aspergillus niger. Int J Food Microbiol. 2012;157:375–83. https://doi.org/10.1016/j.ijfoodmicro.2012.06.007.
-
Karmakar B, Vohra RM, Nandanwar H, Sharma P, Gupta KG, Sobti RC. Rapid degradation of ferulic acid via 4-vinylguaiacol and vanillin by a newly isolated strain of Bacillus coagulans. J Biotechnol. 2000;80:195–202.
-
Baqueiro-Peña I, Rodríguez-Serrano G, González-Zamora E, Augur C, Loera O, Saucedo-Castañeda G. Biotransformation of ferulic acid to 4-vinylguaiacol by a wild and a diploid strain of Aspergillus niger. Bioresour Technol. 2010;101:4721–4. https://doi.org/10.1016/j.biortech.2010.01.086.
-
Venkatesagowda B, Dekker RFH. Microbial demethylation of lignin: Evidence of enzymes participating in the removal of methyl/methoxyl groups. Enzyme Microb Technol. 2021;147: 109780. https://doi.org/10.1016/j.enzmictec.2021.109780.
-
Semana P, Powlowski J. Four aromatic intradiol ring cleavage dioxygenases from Aspergillus niger. Appl Environ Microbiol. 2019;85:1–18. https://doi.org/10.1128/aem.01786-19.
-
Sgro M, Chow N, Olyaei F, Arentshorst M, Geoffrion N, Ram AFJ, et al. Functional analysis of the protocatechuate branch of the β-ketoadipate pathway in Aspergillus niger. J Biol Chem. 2023;299: 105003. https://doi.org/10.1016/j.jbc.2023.105003.
-
Ran H, Zhang J, Gao Q, Lin Z, Bao J. Analysis of biodegradation performance of furfural and 5- hydroxymethylfurfural by Amorphotheca resinae ZN1. Biotechnol Biofuels. 2014;7:51. https://doi.org/10.1186/1754-6834-7-51.
-
Liu ZL. Genomic adaptation of ethanologenic yeast to biomass conversion inhibitors. Appl Microbiol Biotechnol. 2006;73:27–36. https://doi.org/10.1007/s00253-006-0567-3.
Acknowledgements
Antti Aalto from VTT is thanked for the help with proofreading.
Funding
The work was funded by the Academy of Finland (funding decision No. 351097).
Ethics declarations
Ethics approval and consent to participate
Not applicable.
Consent for publication
Not applicable.
Competing interests
The authors declare no competing interests.
Additional information
Publisher’s Note
Springer Nature remains neutral with regard to jurisdictional claims in published maps and institutional affiliations.
Supplementary Information
Rights and permissions
Open Access This article is licensed under a Creative Commons Attribution 4.0 International License, which permits use, sharing, adaptation, distribution and reproduction in any medium or format, as long as you give appropriate credit to the original author(s) and the source, provide a link to the Creative Commons licence, and indicate if changes were made. The images or other third party material in this article are included in the article’s Creative Commons licence, unless indicated otherwise in a credit line to the material. If material is not included in the article’s Creative Commons licence and your intended use is not permitted by statutory regulation or exceeds the permitted use, you will need to obtain permission directly from the copyright holder. To view a copy of this licence, visit http://creativecommons.org/licenses/by/4.0/.
About this article

Cite this article
Korpioja, ME., Sveholm, E., Dilokpimol, A. et al. Transcriptome analysis of Aspergillus oryzae RIB40 under chemical stress reveals mechanisms of adaptation to fungistatic compounds of lignocellulosic side streams. Biotechnol. Biofuels Bioprod. 18, 89 (2025). https://doi.org/10.1186/s13068-025-02688-5
-
Received:
-
Accepted:
-
Published:
-
DOI: https://doi.org/10.1186/s13068-025-02688-5