
Introduction
A characteristic feature of enzyme function is its specificity for a particular substrate. In histochemistry, enzymatic digestion has been used to identify specific substances, such as glycogen and hyaluronan, using amylase and hyaluronidase, respectively. We have previously used various proteolytic enzymes to assess tissue fragility in the skin1 and blood vessels2,3. The quality and quantity of tissue components change with age4, and sensitivity to proteolytic enzymes also varies5. Although enzyme reactions in tissue sections can be assessed by staining after digestion, it is difficult to monitor changes over time. Post-digestion monitoring can help avoid both over- and under-digestion.
When substrates are widely distributed in tissues, there has been no effective method to prevent enzymatic degradation of a specific substance. In this study, we identified a method to preserve the target substance suing specific inhibitors.
Scanning acoustic microscopy (SAM) detects tissue viscosity by measuring the attenuation of sound (AOS)6,7,8. Tissues consist of various components that maintain their mechanical strength and active function. If a particular component breaks down, the tissue structure and function are damaged, which can be used to identify the role and constituents. Enzymes that bind to specific substrates can break down a particular constituent for its detection. The more that a substrate is digested, the more easily ultrasound can pass through the structure, which reduces the AOS values. Herein, we digested various tissues with substrate-specific enzymes and followed their AOS images over time. Moreover, we used specific enzyme inhibitors to protect and preserve the target.
AOS, the decrease in sound wave intensity as it travels through a medium, is a crucial concept in biology and health sciences, particularly in medical imaging. SAM, which employs high-frequency ultrasound, is used to study sound wave behaviour in biological tissues, assess tissue properties and support the development of diagnostic and therapeutic technologies9.
Sound attenuation varies by tissue type10,11,12. Previous studies have shown that AOS values increase with collagen concentration13. For histological analysis, high-frequency ultrasound (usually > 100 MHz) is required to achieve sufficient resolution. Accurate measurement of energy loss through tissues needs a longer travel path. However, higher frequencies also result in greater energy loss14. Therefore, proper section thickness, typically around 10 μm, which is thicker than that used in light microscopy, is essential.
SAM constructs histological images by plotting the AOS values of each region in the section6,15,16. SAM uses the same section as that for light microscopy (LM), although its thickness may be twice or three times that of the usual LM sections. This thick section contains many constituents and provides a large amount of substrate for the enzymes to digest. Enzyme activity can be monitored over time by AOS images because SAM observation does not require staining and takes a few minutes to generate the images.
In a previous study, we used various proteases to elucidate pathological alterations, such as actinase to detect amyloid deposits8, collagenase to reveal the structural differences of the ageing lung3, renal artery17, aorta18 and aortic valve19 and pepsin to assess skin ageing1.
In this study, we attempted to eliminate various tissue components, including proteins, glycans and nucleic acids, to clarify their location. Moreover, we used materials that block enzyme activity, such as dyes and antibodies, to preserve specific cells and materials.
This method allows for the intentional deletion or retention of components in a section, and the degree of degradation can be compared using the AOS values.
Results
Collagenase type 2 degradation of mouse bone
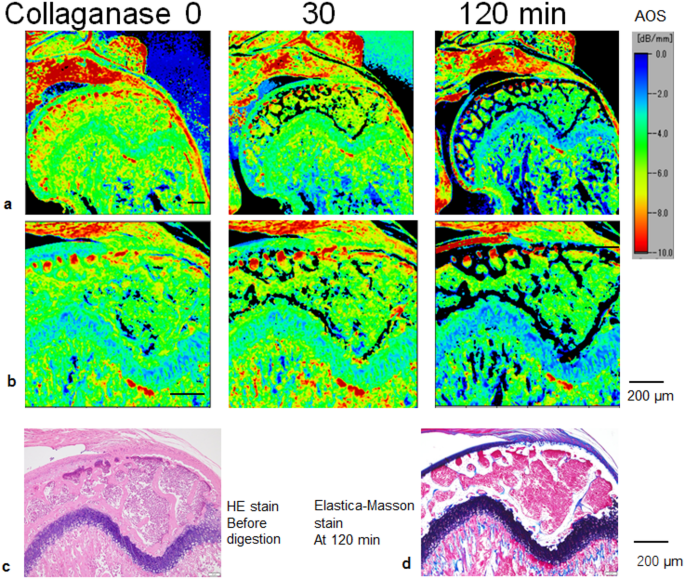
Collagenase type 2 is an enzyme that degrades collagen in cartilage and bone. Following incubation, AOS images showed a decreased value over time (Fig. 1). Before digestion, the tissue was a mixture of many components with no gaps between them, making it challenging to distinguish the boundaries between the components. The marrow was easy to discriminate from the trabeculae. Throughout digestion, the AOS values of all components decreased (Fig. 2). The AOS values of the components in increasing order were the ligament, periosteum, trabeculae, marrow and cartilage, and this order was maintained for up to 120 min of digestion. Trabeculae dropped in rank because of the decalcification treatment. The ligament, periosteum and trabeculae consistently showed significantly higher AOS values than the marrow and cartilage. Collagenase digestion caused a significant decline in AOS values in the ligament, trabeculae and cartilage, whereas no significant decrease was observed in the periosteum or bone marrow.

Collagenase type 2 degradation of the mouse femoral head bone. (a, b) Attenuation-of-sound (AOS) images at low and high magnification, respectively. The colour changes after digestion indicate a gradual decline in AOS values. Cartilage and bone collagen exhibits digestive change, whereas the bone marrow haematopoietic cells withstood the digestion. The ligaments on the articular cartilage and the connecting portions between the cartilage and trabeculae maintained high AOS values. (c) Light microscopic (LM) image of HE-stained tissue before digestion. (d) LM image of Elastica-Masson stain at 2 h after digestion.

Mean and standard deviation of attenuation-of-sound (AOS) values after collagenase digestion. ASO values for the bone trabeculae, cartilage, ligament, periosteum, and bone marrow were measured at 30, 60, and 120 min after digestion. Initially, the bone components could be classified into high-AOS and low-AOS groups. The high-AOS group included the ligament, periosteum, and bone trabeculae, while the lower AOS group comprised cartilage and bone marrow. A significant difference was observed between the two groups. The AOS values of all components gradually decreased. Ligament, trabeculae, and cartilage showed a significant decline, whereas the periosteum and bone marrow displayed no significant decrease.
Actinase digestion of amyloid deposits in the cervical carotid artery
Amyloid fibrils, which are structurally stable against proteolytic enzymes in general, were digested with actinase over time.
Figure 3 shows the gradual disappearance of tissue components except for amyloid in AOS images. The corresponding images in Congo red staining showed diffuse nonspecific staining before digestion, and conspicuous amyloid deposits were retained after digestion.

Actinase digestion of amyloid in the carotid artery. The Congo red stain image at the lower left shows broad nonspecific positive areas on the carotid artery before digestion. Figures in the upper row display the attenuation-of-sound (AOS) images after actinase digestion over time. Amyloid, which is resistant to actinase digestion, retained high-AOS values after digestion. Only the amyloid portion remained in the Congo red staining, and nonspecific staining disappeared.
Lymph node with metastatic breast carcinoma digested with actinase
We prepared three different conditions before digestion: (A) untreated, (B) anti-Ki67 only, and (C) anti-Ki67 with immunostaining using HRP colour development (Figs. 4a–c).

Protection of nuclei from actinase digestion using immunostaining. A lymph node containing metastatic breast carcinoma was digested with actinase. AOS images were compared under three different conditions: A: untreated, B: treated with anti-Ki67 only, and C: treated with anti-Ki67 followed by immunostaining using DAB. Before digestion (a), AOS values increased in this order. After digestion, A and B show remarkable AOS value reduction, while condition C retained high-AOS-dotted areas. The LM images in (c) correspond to the above AOS images, showing that the high-AOS dots correspond to lymphocytes. The bottom left panel in (c) shows an HE-stained LM image of the metastatic carcinoma (*) before digestion.
Before digestion, AOS values increased in this order, and C had a significantly higher AOS compared with A (Fig. 4a). After digestion for 2 h with actinase, only C kept high AOS dots in the lymph node (Fig. 4b), whereas A and B displayed a remarkable reduction. The corresponding LM images showed that the positive dots corresponded to the lymphocyte nuclei (Fig. 4c). Statistical analysis showed that C had significantly greater AOS than A before digestion (Fig. 5). A and B significantly reduced AOS after digestion, whereas C exhibited no significant AOS decrease.

Mean and standard deviation of AOS values in the lymphocyte region. AOS values in lymphocyte region are compared before and after digestion under three different conditions: A: untreated, B: treated with anti-Ki67 only, and C: treated with anti-Ki67 followed by immunostaining using DAB. Before digestion, AOS values increased in this order, and with condition C showing a significantly higher AOS values compared to A. A and B show significant differences (p < 0.01), whereas C exhibits no significant difference.
Amylase digestion of corpora amylacea in the brain
The CA has nothing to do with amyloid; rather, it is derived from sugar-like globules that stain with PAS stain20,21. Before digestion, CA was present in tissues surrounding the ventricles (Fig. 6a). Digestion with amylase for 60 min revealed that most of the CA surrounding the ventricle disappeared, as observed via PAS staining, and other CAs scattered in the parenchyma remained. However, the AOS images revealed that most CAs maintained high values even after digestion.

Amylase digestion of the corpora amylacea (CA) of the brain. (a) Attenuation-of-sound (AOS) and PAS-stained images; (b) Transmission electron microscopic (TEM) images. A cerebral section from an elderly individual was digested with amylase. The CA surrounding the ventricle disappeared in PAS staining, although AOS images revealed that the CA remained with high-AOS values. Some CA in the parenchyma exhibited a reduced number. Regarding the TEM images, before digestion, the CA was spherical and surrounded by an electron-dense amorphous material. The contents were composed of distorted fibrous structures and electron-dense amorphous material. After digestion, the spheroid was eroded, exhibiting a moth-eaten pattern, which resulted in an irregular shape.
Transmission electron microscopic (TEM) imaging (Fig. 6b) showed that the predigested CA was spherical and surrounded by electron-dense amorphous materials. Distorted fibrous structures and electron-dense amorphous material dominated the contents of the spherical body. However, after digestion, the spheroid was eroded with a moth-eaten appearance, which resulted in an irregular shape. The dotted electron-dense materials surrounding the spherical body increased in number.
Inhibitory effect of 3,3’-Diaminobenzidine (DAB) reaction products on DNase activity
We examine DAB colour development as an inhibitor of DNase activity. For cytology, a serous adenocarcinoma (Fig. 7a) positive for anti-Ki67 was digested with DNase for up to 60 min (Fig. 7b). The results showed that 70% of the cancer cells that were larger than the inflammatory cells showed a brown colour in the nucleus in the DAB reaction (Fig. 7c). In contrast, other negative cells displayed a blue colour in the nucleus by haematoxylin staining before digestion. After 60 min of digestion, the positive cells retained their brown colour, whereas the negative cells diminished in blue or disappeared. We followed the digestion reaction with AOS imaging. In the beginning, most cells showed higher AOS values, and then after digestion for 30 min, the AOS values were rapidly reduced and after 60 min, they decreased further. The separate larger cells or clustered cells remained compared with the smaller cells that were broken in shape.

Inhibition of DNase activity by DAB reaction products. (a) A cytological specimen of ascites containing serous carcinoma and inflammatory cells. (b) Attenuation-of-sound (AOS) images of the slide stained with anti-Ki67 and subjected to DAB reaction, followed by DNase digestion and observed over time. All cells showed higher AOS values before digestion, which gradually decreased over time, especially in the smaller cells. Cells or clusters that were larger maintained higher AOS values. (c) Light microscopy (LM) images before and 60 min after digestion showed positive brown staining in the nuclei. Many cancer cells with large nuclei were positive. In contrast, the nuclei of cells stained with haematoxylin before digestion had almost disappeared after digestion. (d) AOS images of breast apocrine carcinoma after DNase digestion following anti-Ki67 immunostaining. DNase digested the breast carcinoma stained with anti-Ki67 antibody and DAB solution. (e)The corresponding LM slides before and after digestion for 60 min. After digestion, cells stained with haematoxylin disappeared, whereas DAB-positive cells with a brown colour remained. After digestion, the AOS values of most cells and fibrous tissues declined, except for some cells that corresponded to the brown-coloured positive cells (arrows) that maintained high AOS values. (f) The HE-stained slide before digestion. Scale bar = 100 μm.
For the tissue section, breast apocrine carcinoma was digested with DNase after anti-Ki67 immunostaining (Fig. 7d-f). After 60 min of digestion, 50% of the cancer cells were positive and maintained their positivity. In contrast, negative cells stained in blue lost their colour after incubation. In the AOS images, cancer cells with high-AOS values were reduced in number after degradation, and the residual cancer cells corresponded to the positive cells in the LM image.
Inhibitory effect of haematoxylin on DNase digestion
A section of lymph node with breast carcinoma was digested with DNase. The haematoxylin-stained section was compared with the unstained section to examine the inhibitory effect of haematoxylin on digestion. The AOS images of the haematoxylin-stained section retained a higher portion of dotted cells compared with the non-stained section (Fig. 8a and b). LM images that were restained with haematoxylin after digestion showed more intense nuclear staining in the pre-stained section than the unstained one. The portion of dotted positive cells with high-AOS values corresponded to the lymphocytes. Compared AOS values before digestion between the stained and the unstained sections showed no significant difference in the carcinoma portion (Fig. 8c) (p = 0.052), whereas lymphocyte portions exhibited significant difference (Fig. 8d) (p = 0.0003). The both portions showed significant decline after digestion. However, the stained sections even kept high dotted portion at 60 min.

Inhibition of DNase activity by haematoxylin staining. Metastatic lymph node with breast carcinoma was digested with DNase 1 to compare unstained (a) and haematoxylin-stained (b) sections. Attenuation-of-sound (AOS) images of the stained section retained nuclear dot structures over time, while the unstained section showed waning nuclear dots. Corresponding LM images after digestion revealed that haematoxylin-treated sections preserved nuclear clarity better than untreated sections. (c) Dot plot graphs indicate no significant difference (p = 0.052) in AOS values between unstained and stained carcinoma portions before digestion. (d) The lymphocyte portion showed a significant difference (p = 0.0003). Both portions displayed a significant decrease in AOS values after digestion. Ca: metastatic carcinoma; Ly: lymphocyte.
Discussion
As columns, beams and braces provide support for a house, the trabeculae, cartilage, periosteum and ligaments hold the bones, which mainly consist of collagen. Therefore, the ligament, trabeculae and cartilage showed a significant decline in AOS values after collagenase digestion, while the bone marrow exhibited no significant reduction. The periosteum was too thin to yield accurate measurements, resulting in increased variance. The order of the AOS values corresponded to the fibre density. The digital AOS values were easy to compare among the different components and incubation durations.
The nonspecific binding of Congo red gradually decreased after actinase digestion, followed by AOS imaging. This method helped to identify tiny amyloid deposits in many contaminants. Moreover, the recovered amyloid from the section is available for analysing the type of amyloid using immunostaining or other molecular techniques. Among the three different methods, only the HRP colour development method helped to retain the antigen-positive cells in the section. The antigen-keeping method relies on the combination of the antibody and the enzyme. Only when the antibody successfully covers the enzymatic cleavage sites can the enzymatic activity be suppressed. This method could potentially apply to any antigen that is detected by various antibodies with HRP colour development.
Although the PAS-stained LM images of the CA disappeared after digestion, the AOS images retained high-intensity values. This discrepancy occurred from the different CA contents. The CA was recently renamed wastesome22, which consists of sugar chains and proteins, such as immunoglobulins. The sugar chain portion was digested by amylase, while the protein portion remained. The proportion of the sugar chain to that of the protein differed in each CA, and the CA showed various AOS values after digestion. The TEM images displayed the fibrillar and electron-dense amorphous contents of the CA. Comparing the TEM images before and after digestion confirmed that amylase digested CA from the surroundings.
Figure 4a and b show that DAB-positive cells maintained their positivity after DNase digestion, whereas negative cells disappeared with digestion, which indicates that DAB suppressed the DNase activity. Ki67-positive cells, which are proliferating cells, can be reserved to analyse DNA sequences. Microdissection methods23 are used in molecular biology for DNA analysis. This method physically captures cell clusters from the section and requires a special instrument or slides. The nuclear antigen-keeping antibody combined with DNase could suppress DNA breakdown, shedding light on the possibility of an alternative method for analysing the DNA of target cells. We plan to utilise this nuclear antigen-keeping method to apply PCR analysis shortly. Haematoxylin staining inhibited DNase activity to maintain the nuclear structure and AOS values compared with the unstained section.
SAM images have the advantage of establishing a numerical evaluation of each structure because the handling data are digital and thus statistical analysis can be performed. Moreover, we could follow the enzymatic degradation process using AOS images over time. The decline in AOS values showed that the enzyme properties could determine the substrate distribution. Furthermore, dyes and antibodies that bind to the substrate could inhibit enzymatic degradation. Therefore, we could intentionally delete or retain the substrate in the section by controlling the enzymatic reaction.
This method has several limitations that should be acknowledged. First, SAM requires flat 10-µm-thick sections, but enzymatic digestive reactions can cause surface irregularities and delamination of the sections, which makes observation challenging. Enzymatic reactions must occur at a suitable pH and temperature, and sections are prone to alkali, acid and heat denaturation, which may cause bias in the evaluations. Second, dyes and antibodies bind to tissues, potentially altering the AOS values. Comparisons with untreated and other treated sections are necessary to evaluate the inhibitory effects. Third, determining the observation areas and quality control requires the corresponding LM sections. LM observation is superior in terms of having an adjustable resolution and wider survey area, whereas SAM observation has limited survey areas with a fixed resolution.
Conclusions
The present method can visualise the location of the substrate in sections and estimate the constituents of complex structures, as observed in CA. Enzymes can discriminate among various substances, such as proteins, sugars and fats. The degradation pattern differed among cases and was comparable with the decline in AOS values.
Furthermore, revealing the binding of some drugs and chemicals to tissues may be possible if changes in AOS values can be observed. The retention of particular cells, nuclei or materials was possible using dyes or antibodies that inhibit enzyme activity. In addition, biochemical or molecular analysis may be available for the residual materials after treatment.
We obtained distinct results by degrading various tissues with specific enzymes, and this method can intentionally delete or retain target components in the section. Moreover, the degree of degradation can be adjusted and compared using AOS values.
Methods
Human and mouse specimen Preparation
Tissue samples were fixed in a 10% buffered formalin solution, embedded in paraffin and sliced into flat Sect. (10-µm-thick sections were prepared for SAM, whereas 4-µm-thick sections were prepared for LM). Enzymatic digestion makes the surface irregular and causes the section to detach from the glass slide. To protect the detachment, we used an immune-coated slide for immunostaining (Muto Pure Chemicals, Tokyo, Japan).
For mouse bone tissue, the bones were provided by Dr. Y. Enomoto from the Department of Regenerative & Infectious Pathology and fixed and soaked in a 0.5 mol/L ethylenediaminetetraacetic acid (EDTA) solution (Fujifilm Wako chemicals, Tokyo, Japan) for 2 days for decalcification.
For the cytology section, residual free cells from ascites or pleural effusions were prepared to make single-cell-layer slides using a previously reported liquid-based cytology method (BD CytoRich™; Franklin Lakes, NJ, USA)12. The slides were fixed in 95% ethanol for 10 min and postfixed in 10% buffered formalin for 45 min.
Enzyme digestion
To digest the sections, various enzymes were used, including actinase E (pronase E) (Funakoshi, Tokyo, Japan), collagenase type 2 (Worthington, Lakewood, NJ, USA), DNase 1 (Merck, Darmstadt, Germany) and α-amylase (Fujifilm Wako, Osaka, Japan). Actinase and collagenase type 2 were dissolved at 1 mg/mL in phosphate-buffered saline (PBS) containing 0.5 mM CaCl2. α-Amylase (10 mg/mL) was dissolved in PBS (pH 7.4), and DNase 1 (0.1 mg/mL) was dissolved in 20 mM HCl containing 1 mM MgCl2 and 1 mM CaCl2. The enzyme solution was mounted on the section and incubated at 37 °C. The activity of each enzyme determined the incubation duration. The sections were washed in distilled water at each time point and observed with SAM. After observation, the same section was reincubated in the enzyme solution.
SAM observations
We used a SAM system (AMS-50AI; Honda Electronics, Toyohashi, Aichi, Japan) with a central frequency of 320 MHz and a lateral resolution of 3.8 μm, as previously reported24,25,26. The tissue or cytology section was placed on the stage, and distilled water was used as the coupling fluid between the transducer and the section. The waveforms reflected from the surface and bottom of the sample were compared to measure the AOS at each point8. The waveform from the glass surface without a specimen was considered the zero AOS area (black) and was used as the reference. The transducer scanned the sections along the X- and Y-axis for a few minutes to capture the images. The plotted AOS value at each point generated an AOS image.
LM observation
LM slides taken from near the SAM section locations or the same section as for the SAM observation were prepared for comparison with the corresponding AOS images. Staining methods, including haematoxylin and eosin, Elastica Masson trichrome, Congo red and periodic acid-Schiff (PAS), were the same as the routine histology methods employed in the pathology laboratory.
Immunohistochemistry
We utilised the Dako REAL EnVision detection system using the peroxidase reaction with DAB for immunohistochemistry and followed the analysis procedure. The primary antibody was anti-Ki67 (MIB-1, DAKO). For antigen retrieval, histological and cytological sections were soaked in 10 mM Tris-EDTA buffer (pH 9.0) (Abcam, Tokyo, Japan) at 95 °C for 40 min. After immunostaining, the sections were counterstained with haematoxylin.
Transmission electron microscopic observation of paraffin sections
TEM observation of formalin-fixed paraffin sections was performed using previously reported methods27,28. DAB-stained sections were fixed with 2% glutaraldehyde for 60 min for pre-fixation and then incubated with 2% osmium tetroxide for 15 min for post-fixation. The sections were dehydrated with an alcohol gradient and embedded in epoxy resin (Quetol 812, Nisshin EM, Tokyo, Japan) by heating at 60 °C for 48 h. Ultrathin 70-nm-thick sections were prepared, stained with lead and uranium acetate (Merck), and observed by JEM 1400 Plus (JEOL, Tokyo, Japan).
Statistical analysis
The means and standard deviations (SD) of the AOS values were calculated from at least five areas per slide. Mean AOS values between different tissue components and at different time points following protease digestion were compared using Student’s t-test or Welch’s t-test, as appropriate. A commercial statistical software package (BellCurve for Excel; Social Survey Research Information, Tokyo, Japan) was used to calculate the mean values for areas-of-interest, generate dot plot graphs and perform t-test analyses. Before statistical analysis, all continuous datasets were tested for normal distribution. A p-value of < 0.05 was considered statistically significant.
Data availability
The datasets used and/or analysed during the current study are available from the corresponding author on reasonable request.
References
-
Miura, K. & Yamashita, K. Evaluation of aging, diabetes mellitus, and skin wounds by scanning acoustic microscopy with protease digestion. Pathobiol Aging Age Relat. Dis. 8, 1516072 (2018).
-
Miura, K. Tunica intima compensation for reduced stiffness of the tunica media in aging renal arteries as measured with scanning acoustic microscopy. PLoS One. 15, e0234759 (2020).
-
Miura, K. Stiffness reduction and collagenase resistance of aging lungs measured using scanning acoustic microscopy. PLoS One. 17, e0263926 (2022).
-
Park, S. Biochemical, structural and physical changes in aging human skin, and their relationship. Biogerontology 23, 275–288 (2022).
-
Frankowska, N., Lisowska, K. & Witkowski, J. M. Proteolysis dysfunction in the process of aging and age-related diseases. Front. Aging. 3, 927630 (2022).
-
Saijo, Y. Recent applications of acoustic microscopy for quantitative measurement of acoustic properties of soft tissues in Quantitative Ultrasound in Soft Tissues (eds Mamou, J. & Oelze, M.) 291–313 (Springer, (2013).
-
Miura, K. & Fukushi, Y. Scanning acoustic microscopy imaging of cellular structural and mechanical alterations from external stimuli. Heliyon 7, e07847 (2021).
-
Miura, K. & Iwashita, T. Observations of amyloid breakdown by proteases over time using scanning acoustic microscopy. Sci. Rep. 13, 20642 (2023).
-
Saijo, Y. Acoustic microscopy: latest developments and applications. Imaging Med. 1, 47–63 (2009).
-
Saijo, Y. et al. Ultrasonic tissue characterization of infarcted myocardium by scanning acoustic microscopy. Ultrasound Med. Biol. 23, 77–85 (1997).
-
Saijo, Y. & Sasaki, H. Acoustic properties of atherosclerosis of human aorta obtained with high-frequency ultrasound. Ultrasound Med. Biol. 24, 1061–1064 (1998).
-
Miura, K. & Yamamoto, S. A scanning acoustic microscope discriminates cancer cells in fluid. Sci. Rep. 5, 15243 (2015).
-
Johnston, R. et al. Elements of tissue characterization part I ultrasonic propagation properties in Ultrasonic Tissue Characterization (ed Linzer, M.) 19–27 (US Government Printing Office, (1979).
-
Goss, S. A., Frizzell, L. A. & Dunn, F. Ultrasonic absorption and Attenuation in mammalian tissues. Ultrasound Med. Biol. 5, 181–186 (1979).
-
Khuri-Yakub, B. T. Scanning acoustic microscopy. Ultrasonics 31, 361–372 (1993).
-
Miura, K. Application of scanning acoustic microscopy to pathological diagnosis in. In Microscopy and Analysis (ed. Stanciu, S. G.) 381–403 (Intech, 2016).
-
Miura, K. Histological and mechanical information based on biochemical alterations of cardiovascular diseases using scanning acoustic microscopy with proteinases: a novel technique for cardiovascular research. Atherosclerosis: Open. Access. 6, 1000149 (2021).
-
Miura, K. & Yamashita, K. Mechanical weakness of thoracic aorta related to aging or dissection predicted by speed of sound with collagenase. Ultrasound Med. Biol. 45, 3102–3115 (2019).
-
Miura, K. & Katoh, H. Structural and histochemical alterations in the aortic valves of elderly patients: a comparative study of aortic stenosis, aortic regurgitation, and normal valves. Biomed. Res. Int. 612520 (2016).
-
Riba, M. et al. Corpora amylacea act as containers that remove waste products from the brain. Proc. Natl. Acad. Sci. U S A. 116, 26038–26048 (2019).
-
Augé, E. et al. Corpora amylacea in human hippocampal brain tissue are intracellular bodies that exhibit a homogeneous distribution of neo-epitopes. Sci. Rep. 9, 2063 (2019).
-
Riba, M., del Valle, J., Augé, E., Vilaplana, J. & Pelegrí, C. From corpora amylacea to wasteosomes: history and perspectives. Ageing Res. Rev. 72, 101484 (2021).
-
Hunt, J. L. & Finkelstein, S. D. Microdissection techniques for molecular testing in surgical pathology. Arch. Pathol. Lab. Med. 128, 1372–1378 (2004).
-
Miura, K. & Yamamoto, S. Histological imaging from speed-of-sound through tissues by scanning acoustic microscopy (SAM). Protoc. Exch. 10, 40 (2013).
-
Tamura, K. et al. Alteration of speed-of-sound by fixatives and tissue processing methods in scanning acoustic microscopy. Front. Phys. 11, 1060296 (2023).
-
Hozumi, N. et al. Time-frequency analysis for pulse driven ultrasonic microscopy for biological tissue characterization. Ultrasonics 42, 717–722 (2004).
-
Itoh, T. et al. Identifying active progeny virus particles in formalin-fixed, paraffin-embedded sections using correlative light and scanning electron microscopy. Lab. Invest. 103, 100020 (2023).
-
Tsutsumi, Y. Electron microscopic study using formalin-fixed, paraffin-embedded material, with special reference to observation of microbial organisms and endocrine granules. Acta Histochem. Cytochem. 51, 63–71 (2018).
Acknowledgements
The authors acknowledge Drs. Yuki Egawa and Toshiaki Moriki of Shizuoka City Hospital for the sample preparation, Dr. Yuki Kurita of the Department of Preeminent Research Support for making histology sections, and Dr. Isao Ohta of the ultrastructure analysis centre for making TEM sections. Drs. Kanna Yamashita, Michio Fujie, and Toshi Nagata of the Department of Health Science, Hamamatsu University School of Medicine, provided the research facilities for this study.
Ethics declarations
Ethics approval and consent to participate
Patient samples were retrospectively selected from the files of Hamamatsu University School of Medicine between 2008 and 2022. The clinical information, including age, gender and pathological diagnosis, was acquired following the protocol approved by the ethical committee of the Hamamatsu University School of Medicine (approval number: 19–180). The study protocol conformed to the ethical guidelines of the Helsinki Declaration of 1975, as revised in 1983. The pathology samples were collected during surgery, and verbal and written informed consents were obtained from each patient before sample collection. The name and other identifying information were not used in the study. All methods were carried out in accordance with the guidelines and the regulations of the ethical committee.
Competing interests
KM has a relationship with Honda Electronics Co Ltd that includes consulting fees, and the other authors have no competing interests.
Additional information
Publisher’s note
Springer Nature remains neutral with regard to jurisdictional claims in published maps and institutional affiliations.
Rights and permissions
Open Access This article is licensed under a Creative Commons Attribution-NonCommercial-NoDerivatives 4.0 International License, which permits any non-commercial use, sharing, distribution and reproduction in any medium or format, as long as you give appropriate credit to the original author(s) and the source, provide a link to the Creative Commons licence, and indicate if you modified the licensed material. You do not have permission under this licence to share adapted material derived from this article or parts of it. The images or other third party material in this article are included in the article’s Creative Commons licence, unless indicated otherwise in a credit line to the material. If material is not included in the article’s Creative Commons licence and your intended use is not permitted by statutory regulation or exceeds the permitted use, you will need to obtain permission directly from the copyright holder. To view a copy of this licence, visit http://creativecommons.org/licenses/by-nc-nd/4.0/.
About this article

Cite this article
Miura, K., Iwashita, T. Selective deletion or preservation of tissue components via enzymatic digestion monitored by scanning acoustic microscopy. Sci Rep 15, 29300 (2025). https://doi.org/10.1038/s41598-025-15598-1
-
Received:
-
Accepted:
-
Published:
-
DOI: https://doi.org/10.1038/s41598-025-15598-1