
Introduction
Acute myocardial infarction (AMI) affects over 120 million people globally and results from obstruction of a coronary artery. In severe cases, heart transplantation is needed but there is a worldwide donor shortage. We have shown in a small pilot study that intracardiac delivery of autologous CD34 + cells after AMI is safe and leads to long term improvement1. The improvement was such that three patients initially recommended for early heart transplantation, no longer required it several years after the cell injection. After the successful results of this pilot study, we started2 a multicenter, randomized, controlled Phase I/IIb study in post-AMI (NCT02669810, study registered on 25/09/2015) to investigate the safety and efficacy of intramyocardial injection of ProtheraCytes, our Advanced Therapy Medicinal Product (ATMP) which is composed of expanded autologous CD34 + cells.
During this study, we developed a potency assay3 needed before the start of the phase III clinical trial. We showed that ProtheraCytes promote cardiac regeneration by revascularising damaged myocardial tissue through the secretion of pro-angiogenic paracrine factors. Among these paracrine factors, we showed that ProtheraCytes secrete vascular endothelial growth factor type A (VEGF) and that its concentration is significantly correlated with the number of CD34 + cells obtained after expansion3,4.
Therefore, the development of our potency assay was based on measuring the secreted VEGF during the expansion of CD34 + cells. The main goal of this development was to design a potency assay that represents the product’s mechanism of action, quantitatively measures the relevant biological product attribute5has batch to batch consistency, and is a validated method that allows for the quick release of the finished product before injection in the clinic. This potency assay was reviewed and deemed acceptable by different regulatory agencies.
The development and validation of VEGF quantification potency assay was performed in accordance with the recommendations and guidelines for cell therapy products, EMA’s guide on human cell-based medicinal products6ICH Q6B Specifications for test procedures and acceptance criteria for biotechnological/biological products7 and ICH Q2(R2) Validation of analytical procedures – Scientific guideline8FDA – Guidance for Industry Potency Tests for Cellular and Gene Therapy Products9and with an International Society for Cell & Gene Therapy review of the requirements and experiences in the industry Potency assay development for cellular therapy10.
After validation of this VEGF quantification method using the ELLA system with its VEGF cartridge, the VEGF potency assay was used to evaluate the potency of 38 clinical batches from phase I/IIb study, as rendered in the demonstration of the consistency of this attribute.
Results and discussion
Development of the VEGF quantification method
The development of the potency assay based on the quantification of VEGF secreted by CD34 + cells from AMI patients in cell culture supernatants collected after 9 days of cell expansion was initiated using the traditional ELISA luminescence method with the QuantiGlo ELISA Kit (R&D Systems) and its positive control3.
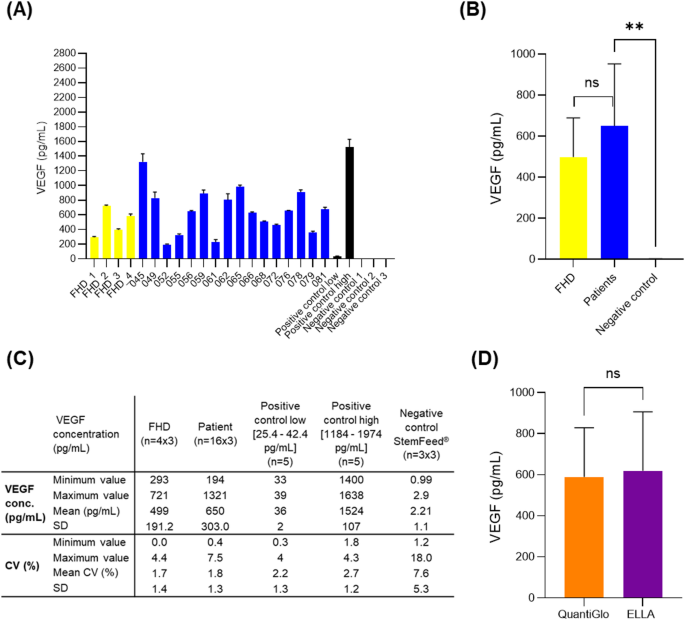
In this study, assays to quantify the VEGF in the supernatant were performed using 16 CD34 + cell culture supernatants from phase I/IIb patients, four Frozen Healthy Donor CD34 + cell culture supernatants and three StemFeed medium samples as a negative control. The VEGF concentration observed in AMI patient samples was high with a mean value of 596.2 ± 242.3 pg/mL, ranging from 185.6 pg/mL to 1032.4 pg/mL. No significant difference was observed when this concentration was compared with the VEGF concentration in healthy donor samples (mean value of 516.2 ± 208.1 pg/mL). A significant difference (t-test, p = 0.0007) was observed when this concentration was compared to that quantified in StemFeed culture medium alone (2.8 ± 0.2 pg/mL)3.
These results support the proangionic effect of CD34 + cells after cell expansion from AMI patients and healthy donors. Secretion of the pro-angiogenic and vascular VEGF factor is a powerful mediator of both angiogenesis and vasculogenesis11,12. It plays a role in the recruitment of endogenous endothelial cells which proliferate and differentiate into new blood vessels in vivo and participates in the regeneration of damaged myocardial tissue. Similar potency assays were used by other cell therapy developers such as Athersys13 and Stempeutics14 in AMI and limb ischemia indications, respectively. Based on these results, we decided to pursue the development of this ELISA-based quantification of VEGF as a potency assay to measure the cells’ angiogenic therapeutic response.
Nevertheless, with the ELISA traditional method some of the CVs obtained were higher than 15% (e.g. 18.4% (patient 045); 30.1% (patient 079)). Then, to reduce CVs and ensure the validation of this VEGF potency assay, we decided to test a new equipment for the quantification VEGF in samples, the ELLA system from Bio-Techne (ref # 600 − 100). This system is an automated immunoassay platform characterized by a microfluidic cartridge design allowing immunoassays with the specificity of a traditional quantitative sandwich ELISA. It allows rapid, low handling, reproducible assays with no potential for cross-contamination by using cartridges available in single or multiple analyte configurations. In order to compare the ELLA system and its cartridge to the traditional method for the quantification of VEGF, the same samples analyzed with the traditional method were analyzed with the ELLA system and its Human VEGF cartridge (ref # SPCKA-CS- 001911). Quantification of VEGF concentration showed similar results to those obtained with the traditional method, with no significant difference as confirmed by statistical analyses (p = 0.0670) (Fig. 1. D). VEGF concentration in the supernatant of CD34 + cell cultures from AMI patients ranged from 194 pg/mL to 1321 pg/mL with a mean value of 650 ± 303.0 pg/mL. VEGF concentration in the supernatant of CD34 + cell cultures from healthy donors ranged from 293 pg/mL to 721 pg/mL with a mean value of 499 ± 191.2 pg/mL (Fig. 1. A, B and C). With the ELLA system, the CVs obtained were below 15%, ranging from 0.0 to 7.5% for all positive controls, AMI patients and healthy donor samples, with all VEGF concentrations between 25.4 pg/mL and 1974 pg/mL, which are the limits of low and high positive controls, respectively.
Based on these results, the validation of the method used to determine the VEGF concentration was carried out with the ELLA system and the “Simple Plex Cartridge Kit, containing VEGF-A for use with Human Cell Supernatant”.

Quantification of VEGF in the supernatant of ProtheraCytes cultures as a potency assay. (A) (C) Concentration of VEGF in cell culture supernatants after 9 days of CD34 + cell expansion from four healthy donors and 16 AMI patients (Phase I/IIb clinical trial). (B) No significant difference observed when VEGF concentration was compared between AMI patients and healthy donors, but a significant difference was observed between AMI patients and StemFeed culture medium as negative control (t-test, p = 0.0021). (D) No significant difference (t-test, p = 0.0670) when VEGF concentrations in AMI patient and healthy donor supernatants quantified with the conventional method (Human VEGF QuantiGlo ELISA) were compared to those quantified with the ELLA system and its VEGF cartridge. These results have also been normalized to the number of CD34 + cells obtained after expansion and can be found in Supplemental Fig. 1.
Validation of the VEGF quantification method
The validation of the method used to determine the VEGF concentration in AMI patient supernatants was performed with the « Simple Plex Cartridge Kit, containing VEGF-A for use with Human Cell Supernatant » and the ELLA system from Bio-Techne. The method is a fully automated immunoassay based on sandwich-type quantitative ELISA method using specific antibodies against VEGF-A. The relative fluorescence units (RFU) measured by the fluorometer are proportional to the quantity of antibody/antigen complexes formed. The concentration of antigens is evaluated against a factory calibrated standard curve. The validation of this method was conducted in accordance with the International Conference of Harmonization guidelines Q2 (R2) by evaluating the following performance characteristics: specificity, linearity (working range), accuracy, precision (repeatability and intermediate precision) and robustness.
Validity criteria for each VEGF quantification run
The results of the controls obtained for the 11 series performed for the method validation are reported in Table 1. The VEGF concentrations obtained for the positive controls (high and low) were in the range provided by the supplier, which are [1108 pg/mL − 2274 pg/mL] and [24.4 pg/mL − 42.0 pg/mL], respectively. The VEGF concentrations obtained for the negative controls were below the low limit of quantification (LLOQ: 20 pg/mL), and the R² for all the series were above 0.95. All the series performed for the validation method were conforming.
Specificity of the VEGF quantification method
The specificity was evaluated based on the specificity of a traditional sandwich-type quantitative ELISA using specific antibodies against the VEGF-A. Demonstration that the quantification of VEGF is not impacted by the presence of other substances, was evaluated for the absence of interferences of tested product with the assay. It was performed using the StemFeed medium as it is representative of the routine supernatant without VEGF, and the Spiked StemFeed medium with VEGF-A. The established acceptance criterion was that VEGF concentration in all unspiked StemFeed medium samples should be below the LLOQ (20 pg/mL). The maximal VEGF concentration observed in the StemFeed medium was 2 pg/mL, which is below LLOQ. The results demonstrated that the method is specific for the VEGF quantification in the supernatant samples using the ELLA system and its VEGF cartridge.
Linearity of the VEGF quantification method
The linearity was evaluated based on the range for VEGF concentration from 20 pg/mL to 2800 pg/mL. This range was established from patient results (35 batches) obtained at the time [200 pg/mL − 1600 pg/mL], and the control range from the method [24.4–42.0 pg/mL (Low control) – 1108–2274 pg/mL (High control)]. The proposed range from 20 pg/mL to 2800 pg/mL cover 80% of the low limit (24 pg/mL) to 120% to the high limit (2274 pg/mL), as per ICH Q2/R2. Linearity was then evaluated with eight concentrations (from 20 to 2800 pg/mL (Table 2; Fig. 2) using spiked StemFeed medium with VEGF-A to cover the proposed range. The data met the acceptance criteria with a correlation coefficient R2 ≥ 0.98. The slope and the intercept of the linear regression were 1.03 and − 45.56, respectively. Therefore, the VEGF quantification method is linear for the range 20 pg/mL − 2800 pg/mL.

Linearity – Linear regression between theoretical VEGF concentrations and the mean of experimental VEGF concentrations.
Precision of the VEGF quantification method
The precision was evaluated at several VEGF concentrations to cover the range 20 pg/mL to 2800 pg/mL using 1- the data from the precision study with 4 patient supernatants (Table 3), and 2- the data from the linearity study with (8 concentrations of StemFeed medium spiked with VEGF, Table 4). All the CVs obtained for the repeatability precision met the acceptance criterion ≤ 10%. The higher CV of repeatability precision observed was for the sample spiked at 20 pg/mL (10%) corresponding to the lower concentration of the range. As for the CVs of intermediate precision, they were also compliant with the acceptance criterion ≤ 20%. The higher CV was observed for patient 045 supernatant (20%) which has the higher VEGF concentration. Therefore, the VEGF quantification method using the ELLA system is precise for the range 20 pg/mL to 2800 pg/mL.
Accuracy of the VEGF quantification method
The accuracy is evaluated for the proposed range [20 pg/mL − 2800 pg/mL], using data from the linearity study. Individual recovery was calculated for each concentration tested in linearity in the 5 series (1a, 1b, 1c, 2 and 3) and the mean recovery. The formula:
% recovery = (VEGF Experimental conc./VEGF Theoretical conc.) * 100
was used for recovery calculation. The results obtained are presented in Table 5. Individual recoveries observed are between 85% and 111%. The mean recovery observed for each concentration is between 92% and 105%. All the recoveries (individual and mean) met the acceptance criteria defined for mean recovery (Mean recovery between 80 and 120%). The VEGF quantification method is accurate for the proposed range 20 pg/mL to 2800 pg/mL.
Robustness of the VEGF quantification method
The robustness of the method was assessed by evaluating the factors “lot of cartridges” and “operators”. Data obtained from the precision study were used for this evaluation. Analysis of Variance with a statistical test ANOVA were used to evaluate impact of variability factors. Based on the experimental design, the variability factors and associated interactions evaluated by ANOVA were the factors “cartridge batch and operators (Op)” and the interaction “batch*operators” (Table 6). The factor “Cartridge batch” is statistically significant (p-value < 0.05) for 3 of 4 samples. Moreover, for all the samples, according to variance components analysis, the factor “Cartridge batch” explains more than 83% of the total variability of the results. The factor “operator” is not significant and explains less than 6% of the global variability of the results. For Patient 052 and Patient 065, the interaction between “Cartridge batch” and “Operator” seems to be significant, but the percentage of variability explained by this interaction stays relatively low. Amongst the factors analyzed (Cartridge batch, Operator) and associated interactions, only the cartridge batch has a statistical impact on the method performance. This could be explained by the fact that the method has only one dilution step, so the operator does not have a significant impact on the results. Therefore, based on the results, control of batch cartridge in routine testing will be done.
To summarize, the potency assay method based on the quantification of VEGF in supernatant samples collected after the culture of CD34 + cells from AMI patients has been validated according to ICH Q2 (R2) with the system ELLA and its VEGF cartridge. The validation results demonstrated that the method using “Simple Plex Cartridge Kit, containing VEGF-A for use with Human Cell Supernatant” (Bio-Techne) with the ELLA system is validated to quantify the VEGF concentration in patient supernatants. The method is validated for the range 20 pg/mL to 2800 pg/mL of VEGF. The specificity of the method has been demonstrated in the frame of the validation. For the robustness of the factors analysed (batch of cartridges, operator) and the associated interactions, only the batch of cartridges has a statistical impact on the performance of the method. An incoming inspection of cartridge batches during routine testing will be carried out. The revalidation of this method will be performed, if necessary, after assessment of the impact in the event of changes to the products and reagents used during this validation, the equipment used during this validation, or a step in method. Finally, the VEGF concentration obtained in the 38 patient samples collected during phase I/IIb showed a mean value of 634 ± 317.1 pg/mL with a minimum value at 205 pg/mL and a maximum value at 1348 pg/mL.
Therefore, based on these results and studies showing that VEGF concentrations 1- as low as 25 pg/mL are sufficient to induce angiogenic activity in the presence of other growth factors13 and 2- as high as 4000 pg/mL have been safely tested in clinical trials14the acceptance criterion established for the potency assay based on the quantification of VEGF in the supernatants of AMI patients after culture of CD34 + cells is: [100 pg/mL − 2800 pg/mL] in the culture supernatant of CD34 + cells after expansion. We chose 100 pg/mL as the lowest range for the potency assay because we observed that this was the minimum VEGF concentration necessary to show significant in vitro angiogenic activity (Supplemental Fig. 2). We performed a dose escalation study and showed that increasing concentrations of VEGF, increased the in vitro angiogenic activity until a plateau was reached around 500 to 1000 pg/mL VEGF.
We also showed that anti-VEGF antibody significantly reduced the in vitro angiogenic activity of ProtheraCytes (Supplemental Fig. 3). The angiogenic activity was not reduced to negative control levels, meaning that there are other factors responsible for this activity. We are in the process of developing additional potency assays based on the quantification of other growth factors. We have also explored the development of potency assays based on the quantification of miRNAs3 via luminescence, but the results have high variability, and the method takes two days to complete, so it cannot be used for the same-day release of the clinical batches. We also considered the cells differentiation potential. CD34 + cells contain endothelial progenitor cells15and we have shown that CD34 + can differentiate into endothelial cells in vitro3but this differentiation takes 17 days and therefore it cannot be used for the same-day release of the batches. We believe that quantifying growth factors with an automated ELISA system is one of the fastest ways of obtaining reliable and consistent results with low CVs, allowing the timely release of the clinical batches to the patient.
Methods
Method development
VEGF quantification with ELLA system
Supernatants from AMI patients and FHD ProtheraCytes were collected after 9 days of expansion in StemFeed cell culture medium (Eurobio Scientific, France) and stored at − 80 °C until analysis. Supernatants were thawed and VEGF levels were measured using the system ELLA (Bio-Techne, Minneapolis, MN USA), and the Simple Plex Cartridge Kit for 16 samples, containing VEGF-A for use with Human Cell Supernatant (Bio-Techne). The Immunoassay Control “Simple Plex Control for Human VEGF” (Bio-Techne) was used to prepare the positive controls low and high according to supplier’s recommendations. The StemFeed medium was used as a negative control.
Method validation
Specificity
To demonstrate that the VEGF quantification is not impacted by the presence of other substances, the specificity was evaluated for the absence of interferences of tested product with the assay. It was performed using the StemFeed culture medium as it is representative of the routine supernatant without VEGF and the spiked StemFeed medium with VEGF-A. VEGF quantification was performed five times per sample, therefore five cartridges were used to evaluate the specificity. Data generated during linearity study were used for specificity evaluation.
Linearity
The spiked StemFeed medium with VEGF-A was prepared from the high positive control for the eight concentrations required to assess the linearity. The proposed range [20 pg/mL − 2800 pg/mL] covers 80% of the low limit (24 pg/mL) to 120% to the high limit (2274 pg/mL), as per ICH Q2/R2. Therefore, linearity was evaluated with the eight following concentrations (20, 200, 600, 1000, 1400, 1800, 2400 and 2800 pg/mL) using spiked StemFeed medium with VEGF-A and successive dilutions to cover the proposed range. Three independent series (Series 1 to 3) were performed by 3 operators. For the series 1, each assay was repeated in triplicate to evaluate repeatability precision at each concentration level. In total, five cartridges were used form the same batch. The batch cartridge used was lot 30,306.
Precision
Repeatability precision was evaluated at several VEGF concentration levels in order to cover the proposed range [20 pg/mL − 2800 pg/mL] using 1- spiked StemFeed medium with VEGF-A, and 2- patient supernatants. The four patient supernatants selected for method validation were the ones with the lowest observed VEGF concentration (patient 052: 204.5 pg/mL), the highest concentration (patient 045: 1347 pg/mL) and two in between (patient 056: 672 pg/mL), (patient 065: 1117 pg/mL). Data from spiked StemFeed medium, which are triplicate results obtained from series 1 (Series 1a, 1b and 1c) of linearity assays for each concentration level, were used to evaluate the repeatability precision. To evaluate the repeatability precision from patient supernatants, triplicate analysis was performed for patient supernatants (052, 056, 065 and 045). To evaluate the intermediate precision, data from all series of linearity assays for each concentration level (Series 1a,1b and 1c, 2 and 3) were used, and also from the four patient supernatants. For each concentration level, six independent series were performed considering two operators, three days and three cartridge lots (30306, 27149 and 27099).
Variance of repeatability (error), variance of inter-run and total variance (intermediate precision) were calculated by Minitab using ANOVA (General Linear Model with run as factor). CV of repeatability and of intermediate precision were calculated as follows:
$$:CV:of:repeatability=:frac{sqrt{variance}:of:repeatability}{Global:Mean:of:concentration}$$
$$:CV:of:Intermediate:Precision=:frac{sqrt{Total:variance}}{Global:Mean:of:concentration}$$
Accuracy
Accuracy was across the range [20 pg/mL − 2800 pg/mL] by comparing measured value to expected value. For each concentration level, three independent series were performed with three operators. The data generated during linearity study were used for the accuracy evaluation.
Robustness
Robustness was assessed by evaluating the two following factors: “lot of cartridges” and “operators”. These assays were done at different concentrations of VEGF in patient supernatants. These concentrations cover the proposed range for validation [20 pg/mL − 2800 pg/mL]. The data obtained from the precision study were used for this robustness evaluation. Data analysis was performed with the mean of the triplicates generated by the ELLA System and ANOVA (general linear model) was performed by Minitab including “cartridge batch” and “operators” as factors and the associated interaction.
In vitro tube formation assays
2.5 × 10⁴ serum-starved overnight Human umbilical Vein Endothelial Cells (HUVECs) were seeded with ProtheraCytes supernatant, 10 µg/mL anti-VEGF neutralizing antibody (MAB293-SP, Bio-Techne), 10 µg/mL isotype control IgG antibody (MAB004, Bio-Techne), or increasing concentrations of VEGF (0, 0.025, 0.05, 0.1, 0.25, 0.5, 1, and 2 ng/mL) (VE5-H4210, ACROBiosystems) into 48-well plates that had been coated with 150 µL of growth-factor–reduced Matrigel (Corning, Arizona, US). Tube formation was examined by phase-contrast microscopy 6 h later and the number of tubes was quantified in each condition in triplicate.
Statistical analysis
All experiments were performed in triplicates. Statistical analysis was performed using the Graph Pad Prism 9.0 software (GraphPad Software, San Diego, La Jolla CA, USA) during method development phase, and also using the Minitab statistical software (Minitab LLC, Pennsylvania, USA) and the ANOVA (General Linear Model) during method validation phase.
Ethics approval and consent to participate
All human tissues were obtained with written informed consent. The clinical study titled: EXCELLENT (Expanded CELL Endocardiac Transplantation) A multicentric controlled phase I/IIb study evaluating the safety and the efficacy of in vitro expanded peripheral blood CD34 + stem cells output by the StemXpand Automated Process, and injected in patients with an acute myocardial infarction and a LVEF remaining below 50% versus standard of care (ClinicalTrials.gov Identifier: NCT02669810). The clinical study was approved by the Comité de Protection des Personnes du Sud-Ouest et Outre-Mer IV ethics committee on 11th of December 2015 (reference number# 14.00115.201428). The study was conducted according to the guidelines of the Declaration of Helsinki.
Data availability
All the data is provided within the manuscript.
References
-
Hénon, P., Bischoff, N. & Dallemand, R. Transforming perspectives in cardiac cell therapy: hypothesis and commentary following updated results of a pilot study investigating very Long-Term clinical outcomes in severe AMI patients following Trans-Epicardial injection of peripheral blood CD34 + cells. Stem Cell. Rev. Rep. 20, 247–257 (2024).
-
Saucourt, C. et al. Design and validation of an automated process for the expansion of peripheral Blood-Derived CD34 + Cells for clinical use after myocardial infarction. Stem Cells Transl Med. 8, 822–832 (2019).
-
Aries, A. et al. Development of a potency assay for CD34 + cell-based therapy. Sci. Rep. 13, 19665 (2023).
-
Garitaonandia, I. Regenerative medicine for cardiovascular disease: characterization and clinical success. Bioprocess Int. 22 (4), 24–29 (2024).
-
Salmikangas, P., Carlsson, B., Klumb, C., Reimer, T. & Thirstrup, S. Potency testing of cell and gene therapy products. Front. Med. (Lausanne). 10, 1190016 (2023).
-
EMA_Guideline on human cell-based medicinal products. Ref. EMEA/CHMP/410869/2006, London, September (2008).
-
ICH Q6B & Specifications Test Procedures and Acceptance Criteria for Biotechnological/Biological Product, CPMP/ICH/365/96, September (1999).
-
ICH, Q2(R2) Guideline on validation of analytical procedures, step 5, EMA/CHMP/ICH/82072/2006, December (2023).
-
FDA – Guidance for Industry Potency Tests for Cellular and Gene Therapy Products. January (2011).
-
Bravery, C. A. et al. Potency assay development for cellular therapy products: an ISCT review of the requirements and experiences in the industry. Cytotherapy 15, 9–19 (2013).
-
Leung, D. W., Cachianes, G., Kuang, W. J., Goeddel, D. V. & Ferrara, N. Vascular endothelial growth factor is a secreted angiogenic mitogen. Science 246, 1306–1309 (1989).
-
Byrne, A. M., Bouchier-Hayes, D. J. & Harmey, J. H. Angiogenic and cell survival functions of vascular endothelial growth factor (VEGF). J. Cell. Mol. Med. 9, 777–794 (2005).
-
Lehman, N. et al. Development of a surrogate angiogenic potency assay for clinical-grade stem cell production. Cytotherapy 14, 994–1004 (2012).
-
Thej, C., Ramadasse, B., Walvekar, A., Majumdar, A. S. & Balasubramanian, S. Development of a surrogate potency assay to determine the angiogenic activity of Stempeucel®, a pooled, ex-vivo expanded, allogeneic human bone marrow mesenchymal stromal cell product. Stem Cell. Res. Ther. 8, 47 (2017).
-
Asahara, T. et al. Isolation of putative progenitor endothelial cells for angiogenesis. Science 275, 964–967 (1997).
Acknowledgements
The authors thank Aktheom (64, avenue du Général Leclerc, 69007 Lyon, France) for support and analytical expertise.
Ethics declarations
Competing interests
H.S. is an employee and C.V., A.C., A.G., S.B., E.G., J.H., P.H., M.D., and I.G. are employees and stockholders of CellProthera SAS.
Additional information
Publisher’s note
Springer Nature remains neutral with regard to jurisdictional claims in published maps and institutional affiliations.
Supplementary Information
Rights and permissions
Open Access This article is licensed under a Creative Commons Attribution-NonCommercial-NoDerivatives 4.0 International License, which permits any non-commercial use, sharing, distribution and reproduction in any medium or format, as long as you give appropriate credit to the original author(s) and the source, provide a link to the Creative Commons licence, and indicate if you modified the licensed material. You do not have permission under this licence to share adapted material derived from this article or parts of it. The images or other third party material in this article are included in the article’s Creative Commons licence, unless indicated otherwise in a credit line to the material. If material is not included in the article’s Creative Commons licence and your intended use is not permitted by statutory regulation or exceeds the permitted use, you will need to obtain permission directly from the copyright holder. To view a copy of this licence, visit http://creativecommons.org/licenses/by-nc-nd/4.0/.
About this article

Cite this article
Vignon, C., Cormier, A., Goubaud, A. et al. Validation of a potency assay for CD34 + cell based therapy. Sci Rep 15, 29409 (2025). https://doi.org/10.1038/s41598-025-14828-w
-
Received:
-
Accepted:
-
Published:
-
DOI: https://doi.org/10.1038/s41598-025-14828-w