Introduction
Antisense oligonucleotides (ASOs), first described by Zamecnik and Stephenson in 1978, were used to inhibit the translation of viral proteins1. Despite the temporary disappearance of ASOs due to the challenges in the field, various advances in chemistry have led to a comeback in recent years. The stability, specificity, and potency of ASOs have evolved progressively, with advancements in chemistry addressing the limitations of previous versions.
Locked nucleic acids (LNAs) are third-generation ASOs that were first described by Obika et. al (1997), Singh, Koshkin, Wengel, and Nielsen (1998), and consist of a bridge between the 2nd and 4th Carbons of the furanose ring via an Oxymethylene link2. LNAs possess high binding affinity and specificity for complementary nucleic acids. While beneficial in many contexts, this affinity can lead to unintended stable complexes in biological systems, potentially causing off-target effects and altered gene expression profiles3. Another issue stems from their structural features, i.e., the structural rigidity of LNAs can impact cellular uptake and distribution. Furthermore, while beneficial for solubility, their negative charge may limit effective membrane penetration4,5. These problems could be solved by using a delivery vehicle to transport the LNAs to the target organ in an efficient and precise manner. This work suggests lipid nanoparticles (LNPs) can serve this purpose.
LNPs are the most advanced and clinically validated non-viral nucleic acid delivery vehicle. The key building block in LNPs is the ionizable lipid, which is complemented with other lipids, i.e., cholesterol, PEG-lipids to provide colloidal stability and “stealth” properties, and a helper lipid (e.g., DSPC) in the currently available commercial formulations6. Ionizable lipids are pH-sensitive, neutrally charged compounds at physiological pH, which can become positively charged in an acidic environment. During the assembly of LNPs in acidic conditions, the positive charge of the lipid helps to promote the interactions with the negatively charged nucleic acid to maximize their encapsulation. At physiological pH, the neutral charge is advantageous as it reduces interactions with the anionic membranes of cells, thereby enhancing the LNPs’ biocompatibility7. When LNPs are internalized and reach the endo/lysosomal intracellular compartment, the pH becomes acidic, leading to the protonation of the ionizable lipid, and its positive charge helps to destabilize the endosomal membrane and facilitate endosomal escape8,9,10. We hypothesize LNPs will uniform the delivery of ASOs so that, independent of the chemical modifications of the ASO, it will have the same absorption, distribution, metabolism, and excretion (ADME) based on the physicochemical properties of the LNP, such as size, charge, hydrophobicity, and morphology11,12.
Herein, novel ionizable lipids were applied to generate LNPs with LNA payload. To this end, we selected LNAs specific for the Tumor Necrosis Factor-α (TNFα) that showed improved therapeutic outcomes in an Inflammatory Bowel Disease murine model using LNPs as delivery vehicles. A 30-fold dose reduction was achieved when using LNPs to encapsulate LNAs compared to unformulated free LNAs, without any safety findings.
Results
Synthesis of ionizable lipids
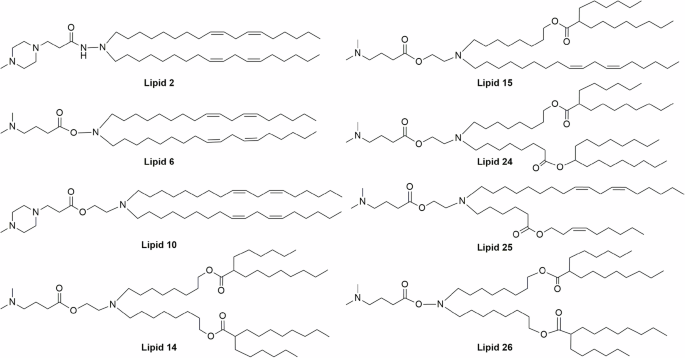
This work aimed to develop LNA-LNP formulations that result in improved in vivo activity, through lowering of therapeutic doses. Here, a library of 8 structurally distinct ionizable lipids was chosen to test the LNAs delivery efficiency. In our previous studies, it was observed that linoleyl chain tails (herein, lipid 2, lipid 6, and lipid 10) show good delivery efficiency for siRNA payloads, while biodegradable branched ester tails (lipid 14) exhibit better delivery efficiency for mRNA payloads (Fig. 1)8,9. Hence, the lipids were rationally chosen to consist of linoleyl tails, biodegradable esters, and a combination of both linoleyl and ester bonds. These lipids were synthesized using ethanolamine, hydroxylamine, and hydrazine linkers, with dimethylamine and piperazine head groups (supplementary Fig. 1). All the lipids were prepared following standard organic synthesis procedures and were characterized by NMR spectroscopy and mass spectrometric techniques (Supplementary Figs. 2 and 3).

The lipids were synthesized using different hydrophobic tails, with ethanolamine/hydroxylamine/hydrazine linkers and dimethylamine/piperazine head groups. Lipids 2, 6 & 10 consist of a linoleyl chain, and lipids 14 & 26 consist of a branched ester chain as hydrophobic tails. For Lipid 15, a linoleyl chain and a branched ester chain were included as hydrophobic tails, whereas a linoleyl chain and a non-branched ester chain were used as hydrophobic tails for Lipid 25. For Lipid 24, two different branched ester chains were used as hydrophobic tails.
Physicochemical characterization of LNPs
LNPs were prepared according to the previously described methods9,13,14 (Fig. 2a) using ionizable Lipid: Cholesterol: DSPC:PEG-DMG 50:38.5:10:1.5 molar ratios, respectively. Dynamic light scattering revealed a uniform nano-size distribution of the particles, with a diameter between 50 and 70 nm in most LNPs except lipid 10 and 25, which were larger (Fig. 2c). Polydispersity index (PDI) measurements of the LNPs varied between 0.03 and 0.2 (Fig. 2d). The ζ -potential average measured between −6 and 10 mV (Fig. 2e). The encapsulation efficiency was above 85% for all the formulations as determined by the RiboGreen assay (Fig. 2f). The pKa of LNPs was measured using a 6-(p-toluidino)−2-naphthalenesulfonic acid (TNS)-based fluorimetric assay. All LNPs had a pKa between 6.0 and 6.9, which is considered suitable for most ionizable lipid-based LNPs formulations (supplementary Fig. 4)15. Notably, we did not observe a significant difference between the pKa values of LNPs and their corresponding free ionizable lipids.

In vitro screening of ionizable amino lipids in LNPs; a Schematic illustration of LNPs preparation using microfluidic mixers, created in BioRender. Hazan-halevy (2025) https://BioRender.com/r4vmcxs. b Representative CryoEM images of LNPs. The scale bars are 50 nm. c mean diameter ± SD (nm); d polydispersity index (PDI) ± SD. e ζ potential ± SD (mV), as measured by Zeta Sizer. f Percentage of encapsulation efficiency as measured by a RiboGreen assay. Bars in panels c-f show consist of n = 2 independent LNP preparations with at least n = 3 technical repeats for each. g Viability test measured by XTT to establish in vitro toxicity 96 h post-transfection (n = 3 independent biological repeats for cells that were treated with LNPs). The bars in (c–g) represent means with error bars that represent the standard deviation. One-way ANOVA was conducted, followed by two-sided Dunnett’s multiple comparison. P-values are indicated whenever significant.
Next, LNPs were encapsulated with a control LNA devoid of biological activity to assess the LNP’s potential cytotoxicity. RAW 264.7 cells were seeded overnight, and LNPs were then added and incubated for 96 h. The results were normalized to the untreated control, and the formulations were compared to lipid 10 as a benchmark formulation, due to its safety profile both in vivo and in vitro, as previously demonstrated in our previous work9,14. Cell viability remained above 80% in all formulations (Fig. 2g), highlighting the low toxicity of the LNP formulations.
Assessing LNA-LNPs splicing efficiency in vitro
Following the characterization of the LNPs, the next step was to measure the in vitro activity of the LNAs16. For this purpose, hypoxia-inducible factor 1 subunit alpha (Hif1α) was used as a surrogate marker. Hif1α is a transcription factor that plays an important role in the cellular response to systemic oxygen levels in mammals. The mouse gene encoding Hif1α may go through alternative splicing, resulting in two different Hif1α mRNA isoforms. While composed of 15 exons, the difference between the two isoforms lies within the first exon, allowing for expression in a tissue-dependent manner17,18. Accordingly, a change in other exons does not naturally occur but may be synthetically induced.
To assess the activity of the formulations of interest, a well-established locked nucleic acid modified-ASO sequence was used to cause exon 14 skipping in the Hif1α pre-mRNA, resulting in a completely exogenous isoform. Consequently, cells that were not exposed to said sequence will have 100% wild-type mRNA of Hif1α; conversely, cells that were successfully transfected with it will express the mutated mRNA lacking exon 14 alongside WT Hif1α mRNA (Fig. 3a). The percentage of mutated Hif1α mRNA copy number from total Hif1α (termed %splice switching; %SpSw) correlates directly to the transfection efficiency of the tested formulation (Eq. 1). The creation of an exogenous synthetic copy makes this method highly sensitive and specific, as opposed to measuring mRNA knockdown.
$$,%{Splice; switching}=%{MutHif}1alpha =frac{{MutHif}1alpha }{{WTHif}1alpha +{MutHif}1alpha }$$
(1)

a schematic illustration of an LNA that causes exon 14 skipping in the Hif1α pre-mRNA, resulting in a completely exogenous isoform of the Hif1α mRNA and shifting the balance from a wild-type Hif1a mRNA to a “synthetic” isoform, created in BioRender. Hazan-halevy (2025) https://BioRender.com/4hcx0py. Splice-switching efficacy as a function of ascending concentration of aHα-loaded LNPs prepared with lipids 10 (b), lipid 15 (c), and lipid 2 (d), tested on three cell lines. Each graph represents a curve obtained from n = 2 independent biological repeats, and each point is composed of n = 2 technical repeats. Error bars represent the standard deviation of the mean. In points where the error bar is missing, the error bars are smaller than the symbols and are therefore not displayed.
For this assessment, three IBD-relevant cell lines were used; RAW 264.7 (mouse-derived monocyte/macrophage-like cells), MC38 (colon carcinoma mouse-derived epithelial cells), and NIH/3T3 (mouse embryo fibroblasts). The previously chosen formulations were encapsulated with anti-Hif1α (aHα) LNAs and found to be uniform with an acceptable size. Here, lipid 10 was chosen as the control lipid, given that its in vitro efficacy has been previously established8,9,14. All formulations were added in different ascending concentrations to each of the 3 different cell lines, and the efficiency of transfection was assessed by measuring the levels of exon 14 skipping using digital droplet PCR (ddPCR). Among all lipids, lipid 15 showed a higher efficacy across all three cell lines compared to control lipid 10 (Fig. 3b, c). Lipid 2 showed mediocre activity like the other screened lipids (supplementary Fig. 5) and thus was chosen as a control of suboptimal activity in the following in vivo experiments (Fig. 3d).
Assessing LNA-LNPs splicing efficiency in vivo
To assess the activity and efficiency of the chosen lipids in vivo, aHα or negative control LNAs were formulated in each of the chosen lipids. Wild-type C57BL/6 mice (N = 3 / group) received a 1 mg/kg retro-orbital injection of LNPs prepared with lipids 10, 15, or 2, and loaded with either aHα or negative control LNAs. For comparison, mice were injected with unformulated LNAs (aHα or negative control) at a high dose of 30 mg/kg or a low dose of 1 mg/kg, or PBS. Livers and spleens were collected at different time points of the experiment from the treatment groups; total RNA was extracted, and splice-switching (SpSw) efficiency was examined via ddPCR (Fig. 4a).

a Experimental design, created in BioRender. Hazan-halevy (2025) https://BioRender.com/ka9d8uib lipid 10, c lipid 15, and d lipid 2, Hif1a SpSw efficiency was measured in the liver and spleen of mice. Each column represents the mean splice-switching % of a group of n = 3 mice, with error bars that represent the standard deviation.
The unformulated LNA (free aHα) at 30 mg/kg displayed a near 80% SpSw efficiency in the liver but was not active in the spleen. Conversely, the low dose (1 mg/kg) of free aHα SpSw efficiency was below 5% in both the liver and the spleen, a result within the error margins of the method, thus correlating to zero activity (Fig. 4).
Unlike the free aHα, 1 mg/kg of LNPs formulated with benchmark lipid 10 and loaded with aHα gave a peak activity in the liver 48 h post-injection, averaging around 60% splice switching, and was reduced to an average of 30% at 72 h. In the spleen, the effect with just above 10% at 24 h was minor (Fig. 4b). Notably, the best lipid (lipid 15), yielded a near 100% SpSw efficiency at all tested time points in the liver, while performing significantly better than both unformulated LNAs and Lipid 10 in the spleen (Fig. 4c). Lipid 2, which exhibited suboptimal activity in vitro, showed diminished activity in both the liver and the spleen (Fig. 4d).
Following these results, we hypothesized that Lipid 15, which outperformed our benchmark lipid, has the highest potential of successfully delivering LNAs and achieving clinical results in the disease model.
LNPs biodistribution to the inflamed colon
Following the initial assessment of the LNPs’ activities in the liver and spleen, we were keen to assess the possibility of the chosen LNP formulation (lipid 15-based LNPs) reaching extra-hepatic tissues. For this purpose, a model of inflammatory colitis induced by Dextran Sodium Sulfate (DSS) was chosen as a disease model. To confirm that the LNPs indeed reach the colon, 10-week-old female C57BL/6 mice were fed for 7 days with 2% (wt/vol) DSS in the drinking water ad libitum. On the morning of day 7, the mice were injected with lipid 15-based LNPs that contain 50:50 (w/w) LNA: Cyanine 5 (Cy5) labeled negative control siRNA, sacrificed 2 h after the injection, and analyzed via IVIS to detect the Cy5 fluorescence. Figure 5a displays a relevant LNPs signal in the colon, as well as in the mice’s livers, spleens, kidneys, and lungs (Fig. 5a, b).

a IVIS images of 50% CY5 lipid 15 LNPs in DSS-treated mice, b quantified as Avg Net Radiance, obtained from n = 3 independent biological repeats, c flow cytometry of LNPs’ association to different cell populations isolated from the colonic lamina propria obtained from n = 2 for UT and n = 3 for LNPs-treated independent biological repeats. For (b) and (c), data is represented as scattered dots, with lines representing mean and standard deviation. d Hif1a SpSw was measured in the colons of DSS-bearing mice versus healthy ones that received either unformulated aHα at two doses (1 mg/kg; n = 2, 3 mice in healthy and DSS-treated groups, respectively, and 30 mg/kg; n = 1, 2 mice in healthy and colitis-bearing groups, respectively), 1 mg/kg of aHα-loaded lipid 15 LNPs (n = 3 biological repeats for healthy, and n = 10 biological repeats for colitis-bearing), or PBS (n = 2 biological repeats). Hif1a SpSw was also measured in the e kidneys (n = 1 PBS-treated mice, n = 2 healthy ASO or LNPs-treated mice, n = 3 colitis-bearing free ASO-treated mice, n = 4 colitis-bearing LNPs-treated mice) and, f lungs (n = 1 PBS-treated mice, n = 2 healthy ASO or LNPs-treated mice, n = 3 colitis-bearing free ASO-treated mice, n = 4 colitis-bearing LNPs-treated mice) of DSS-bearing mice versus healthy ones that received either unformulated 30 mg/kg aHα, 1 mg/kg of aHα-loaded lipid 15 LNPs, or PBS. Data is represented as scattered dots with columns for the average, and error bars representing the standard deviation. For graphs in (d–f), Two-way ANOVA was conducted, followed by two-sided Sidak’s multiple comparison. P-values are indicated.
Next, we evaluated the cellular distribution of LNPs within the inflamed colon and elucidated which cell types were significantly associated with LNPs-Cy5. To do so, we harvested the colons of the sacrificed mice, after which we isolated cells from the Lamina Propria and analyzed them via flow cytometry. For the sake of gating, biological markers and fluorophores were selected, considering a compensation matrix. As negative control for markers’ staining, we used unstained samples, while as negative control for LNPs uptake, we used samples from mice untreated with LNPs (Untreated, UT), and that were stained using the same fluorophores as the treated samples (Supplementary Figs. 6 and 7).
Our results indicate that 47.55 ± 0.25% of endothelial cells and 53.06 ± 5.06% of myeloid cells were positive for Cy5-LNPs. Among lymphocytes, 24.87 ± 4.52% of B cells exhibited Cy5-LNPs association. Within the myeloid population, 46.91 ± 5.38% of macrophages and 64.60 ± 3.15% of neutrophils were positive for LNPs (Fig. 5c). These results suggest that systemic administration of Lipid 15-based-ASOs-LNPs can reach colon’s cell populations that are pivotal in driving inflammation in colitis-bearing mice.
Splicing efficiency in vivo with LNA (AHα)-LNPs in Colitis induced mice
After confirming that the LNPs indeed reached the inflamed colon, we were keen to assess whether the chosen LNP formulation (lipid 15-based LNPs) has a noticeable activity in the colon, rather than mere arrival at the inflamed site. For this purpose, colitis was induced in mice as described above, while in parallel, a healthy control group was given normal water throughout the experiment. The colitis-bearing mice group was switched back to normal water on day 8. Mice from each group were injected with PBS, 1 mg/kg aHα-loaded lipid 15-based LNPs, or unformulated aHα in either 1 mg/kg or 30 mg/kg, and SpSw was examined accordingly.
The free aHα arm showed a nearly 100% SpSw with a dose of 30 mg/kg, but no effect was observed in the lower dose of 1 mg/kg. The LNA-loaded LNPs (lipid 15), however, demonstrated SpSw efficiency of ~40% at 1 mg/kg (Fig. 5d).
Furthermore, a comparison between healthy and inflamed colons revealed that, within both free aHα arms, no difference was observed, possibly indicating that in the 30 mg/kg arm there is an excess of LNAs in the system, while in the 1 mg/kg arm, LNAs are being diluted to the extent of not reaching the colon in relevant amounts. In the case of aHα-loaded LNPs however, a 10-fold difference was observed in diseased versus healthy colons (Fig. 5d). The same comparison was done for the kidneys (Fig. 5e) and the lungs (Fig. 5f), which also displayed significant LNPs accumulation through IVIS imaging (Fig. 5a). In the kidneys, the splice-switching efficiency was around 70% with no difference between DSS-treated vs. healthy mice, while in the lungs, while it’s possible to see a difference, this is not statistically significant. SpSw was also checked in the small intestine; however, no Hif1a expression was detected in the healthy animals, making a comparison impossible.
Gene silencing of LNA (TNFα)-LNPs improves therapeutic outcomes
Demonstrating that lipid 15-based LNPs reached the colon in the diseased mice, the next step was to test whether they could ameliorate colitis with the previously shown reduced dose. For this purpose, we used an LNA specific for the mRNA of tumor necrosis factor-α (TNFα), a cytokine that plays a major role in the pathogenesis of IBD19,20,21,22. Reducing the expression of TNFα is expected to alleviate colitis symptoms in treated animals19,20,22,23.
To this end, DSS colitis was induced in mice as described previously. The colitic mice were treated on days 3 and 5 with PBS (n = 10), 2 mg/kg of unformulated anti-TNFα LNAs (n = 10), 2 mg/kg of anti-TNFα (aTα) LNAs-loaded Lipid 15 LNPs (n = 10), or 2 mg/kg of NC-loaded Lipid 15 LNPs (n = 10) (Fig. 6a).

a Experimental design, created in BioRender. Hazan-halevy (2025) https://BioRender.com/ri51v9d. b Percentage weight change in all treated groups. c Colon length was measured at the end of the experiment. Expression levels of pro-inflammatory cytokines; d TNFα, e IL-6, f IL-β. For graphs in (b–f). n = 5, 7, 10, 10, 10 mice for healthy, DSS-bearing, NC LNPs, Free Anti-TNF ASO, Anti-TNFα-loaded LNPs, respectively. Liver enzyme levels were measured as an assessment for toxicity (n = 7 mice); g ALP [IU/L], h ALT [IU/L], i AST [IU/L]. j Histological scoring of colon tissue sections (n = 10 mice). The center values represent the average, while the error bars represent the standard deviation of the mean. For the graph in (a), a Two-way ANOVA was conducted, followed by a two-sided Dunnett’s multiple comparison. For the rest of the graphs, a one-way ANOVA was conducted, followed by a two-sided Bonferroni’s multiple comparison. P-values are indicated.
Global indicators of colitis, i.e., weight loss, and length of the colon were assessed. To assess the significance of disease-related weight loss and the effect of different treatments on it, we compared the rate from day 4, the point at which this decline typically begins in the DSS model, as observed in numerous studies24,25. DSS-treated mice lost significant weight compared to the healthy group, thus confirming the development of the disease. The TNFα-loaded LNPs showed a significant difference at the end of the monitoring period (Day 7), compared to both the NC-loaded LNPs and the free anti-TNFα LNAs (Fig. 6b).
In addition to weight loss, DSS colitis leads to shortening of the inflamed colon19,20,22. Indeed, colon shortening was significantly reduced in the group that received LNPs loaded with anti-TNFα LNAs. In this group, no significant difference was observed compared to healthy mice. In contrast, the other control groups showed significant colon shortening (Fig. 6c).
A similar pattern was observed on the molecular level, anti-TNFα LNAs-loaded lipid 15-formulated LNPs clearly reduced TNFα protein expression in the large intestine of mice by approximately threefold (Fig. 6d). IL-6 and IL-1β, both important mediators of the gut inflammatory response26,27, were also drastically reduced compared to the untreated group, unformulated (LNP-free), anti-TNFα LNAs, and NC-loaded lipid 15-formulated LNPs (Figs. 6e, 5f). The integrity of the crypts and villi structure and leukocytes infiltration were also used to assess the extent of the disease. Histological analysis revealed the same trend as cytokines, with the tissue showing improved epithelial integrity and reduced leukocyte infiltration (Fig. 6j). Taken together, these results indicate that LNA-loaded LNPs can potentially serve as a novel treatment for IBD.
In vivo safety profile of LNAs-LNPs upon systemic administration
One of this study’s goals was to develop a safe and efficient system that allows for lowering the required LNAs’ effective dose, nevertheless, one can argue that toxicity may also rise from the delivery system itself. To this end, we performed a toxicological study to ensure the lipid 15-formulated LNPs’ biocompatibility.
It is well known that certain LNAs can lead to hepatotoxicity28. Therefore, to assess safety in the hepatic context, liver enzyme levels in the blood were measured. The enzymes ALP, ALT, and AST, remained at the same level in all treated groups when compared to the healthy group (Fig. 6g–i), indicating the absence of inflammation and liver toxicity. In addition, changes in lymphocyte, monocyte, or platelet counts weren’t observed, indicating the treatment has no adverse effects (supplementary Fig. 9).
Discussion
Continuous developments in the field have shown the potential of ASOs as therapeutic molecules12; however, many issues still need to be tackled, with both the high dose needed for therapeutic efficacy and safety concerns. Although ASOs’ chemical modifications aim to address challenges in delivery and targeting, persistent issues like limited efficacy, off-target effects, and toxicity continue to hinder broader application in clinical practice.
Drug delivery systems were developed to regulate the distribution of therapeutic agents within the body. Various nano-scale delivery systems can be customized by adjusting their physical and chemical properties, such as size, charge, hydrophobicity, and morphology. These systems can act as carriers to deliver nucleic acid cargo effectively.
The uptake of LNPs is driven by their natural biodistribution profile and can be enhanced into specific cell types by active targeting20 by functionalizing their surfaces with active targeting moieties such as antibodies and other receptor-specific ligands for specific cell types on which the respective receptor is expressed19,20.
The use of LNPs to deliver ASOs could open new avenues in therapeutics by increasing their therapeutic index and improving the safety profile of systemic administration of ASOs for the treatment of inflammatory and other diseases that currently require high doses of ASOs.
The success of a therapeutic agent is measured by its risk-benefit ratio, i.e., achieving an adequate therapeutic effect while having minimal to no adverse effects. To exert an on-target pharmacological effect, ASOs need to withstand degradation by nucleases in the bloodstream, reach the site of action, get internalized via a productive pathway, and hybridize with their target mRNA to exert activity12. While stable in the bloodstream, it seems that efficient cellular uptake tends to come at the expense of affinity to the target and vice versa (e.g., the phosphorothioate (PS) group improves cell uptake but reduces RNA target affinity). Efforts to mitigate these issues are still ongoing, with many yielding encouraging results29,30,31. Nevertheless, we hypothesized that for ASOs to reach their full potential, delivery systems, such as LNPs, should be explored12.
In the present work, several LNP-based formulations were prepared with different ionizable lipids and screened to identify the best one for the successful delivery of ASO-LNAs into an inflamed gut. The chosen formulation achieved similar SpSw efficacy to unmodified ASOs while dramatically decreasing the required dose in the liver and the spleen. In this study, we chose to test our LNP delivery system for ASO-LNAs in a mouse model of acute DSS-induced colitis. First, we tested the LNPs’ accumulation in the gut and whether the cell populations associated with the LNPs were disease-relevant. Our flow cytometry data demonstrate a notable association of LNPs with endothelial cells and myeloid populations, particularly macrophages and neutrophils, cells that are closely associated with IBD pathophysiology32.
Importantly, LNAs-loaded LNPs showed 10-fold enhanced activity in the inflamed colons compared to healthy tissue, while these trends were not observed in the lungs and kidneys, demonstrating a disease-related activity.
Finally, an in vivo study was carried out to test the therapeutic efficacy of the ASOs-LNPs while maintaining a dose reduction in the anti-TNFα ASOs-loaded LNPs. The results showed a significant decrease in TNFα expression alongside other inflammatory cytokines such as IL-6 and IL-1β, and all clinical symptoms of the disease were alleviated in the treated group. The activity shown did not come at the expense of safety, as demonstrated by the normal liver enzyme levels and unaltered leukocyte levels. Taken together, these results highlight the therapeutic potential of LNPs as a delivery vehicle for ASOs in inflammatory diseases, and potentially in other diseases.
To our knowledge, this is the first study to show efficacy in vivo using LNPs as carriers for LNA-ASOs. It should be noted that our findings were made using uncoated LNPs utilizing their natural distribution to the inflamed gut as part of a broad distribution profile. Despite their efficacy in a murine model of colitis, LNAs-loaded LNPs still displayed significant off-target accumulation in other organs, leading to potential off-target effects.
Given the diversity of LNPs and the realm of active targeting, many avenues, such as targeting specific gut populations, can and should be explored in the continuation of our study, using ASOs as cargo. Furthermore, the adoption of more translational models of colitis would elucidate the viability of LNA-LNPs formulation as a novel tool for the treatment of IBDs in the clinical setting.
Methods
Lipids
Cholesterol, DSPC, and DMG-PEG were purchased from Avanti Polar Lipids, USA. The ionizable lipids, Lipid 2, Lipid 6, Lipid 10, Lipid 14, and Lipid 15, were synthesized following our previously reported procedures8,9,33. Lipid 24, Lipid 25, and Lipid 26 were synthesized as represented in supplementary Fig. 1 (see Supporting Information).
Synthesis of Lipid 24
The 8-Bromooctanoic acid 1 (1.13 g, 5.08 mmol, 1.3 equiv.), Heptadecan-9-ol 2 (1.0 g, 3.90 mmol, 1 equiv.), EDC.HCl (1.50 g, 7.80 mmol, 2 equiv.), and DMAP (95 mg, 0.78 mmol, 20 mol%) were dissolved in dry CH2Cl2 (30 mL) under an argon atmosphere and stirred overnight at room temperature. After that, the reaction was quenched with sat. NaHCO3 followed by extraction with CH2Cl2 (3 times). Then the organic portion was washed with brine solution and dried over anhydrous Na2SO4. The solvent was evaporated and the residue was purified by column chromatography using 0–5% EtOAc in hexane to get the desired bromide 3 (1.3 g, 72%) as a colorless liquid. 1H NMR (400 MHz, CDCl3): δ 4.86 (1 H, quint, J = 4.8 Hz), 3.52 (1 H, t, J = 6.8 Hz), 3.40 (1 H, t, J = 6.8 Hz), 2.28 (2 H, t, J = 7.6 Hz), 1.85 (1 H, quint, J = 7.6 Hz), 1.77 (1 H, quint, J = 7.6 Hz), 1.71–1.38 (10 H, m), 1.38–1.14 (26 H, m), 0.88 (6 H, t, J = 7.2 Hz).
The above bromide 3 (1.26 g, 2.73 mmol, 1 equiv.), ethanolamine (4.95 mL, 82 mmol, 30 equiv.) were dissolved in ethanol (5 mL) and stirred for overnight at 65 °C. After that, the solvent was evaporated under reduced pressure, then the reaction mixture was poured into water and extracted with ethyl acetate (3 times). The organic portion was washed with brine solution and dried with anhydrous Na2SO4. The solvent was evaporated, and the residue was purified by column chromatography using 0–15% Methanol (0.5% triethylamine) in Chloroform to get the desired ethanolamine 4 (1.0 g, 83%) as a colorless liquid. 1H NMR (400 MHz, CDCl3): δ 4.86 (1 H, quint, J = 6.4 Hz), 3.64 (2 H, t, J = 5.2 Hz), 2.78 (2 H, t, J = 5.2 Hz), 2.62 (2 H, t, J = 7.2 Hz), 2.28 (2 H, t, J = 7.6 Hz), 1.69–1.56 (4 m, H), 1.55–1.42 (8 H, m), 1.40–1.16 (26 H, m), 0.88 (6 H, t, J = 7.2 Hz). ESI-MS: m/z 442.7 [M + 1]+.
To the above ethanolamine 4 (340 mg, 0.77 mmol, 1 equiv.), a solution of 8-oxooctyl 2-hexyldecanoate 5 (353 mg, 0.92 mmol, 1.2 equiv.) in dry CH2Cl2 (20 mL) was added under an argon atmosphere and stirred for 2 h at room temperature. Later, sodium triacetoxyborohydride (325 mg, 1.54 mmol, 2.0 equiv.) was added and stirred overnight at the same temperature. Then the reaction was quenched with sat.NaHCO3 solution followed by extraction with CH2Cl2 (3 times). The organic layer was washed with brine solution and dried over anhydrous Na2SO4. The solvent was evaporated on a rotary evaporator, and the residue was purified by column chromatography using 0–5% Isopropanol in CHCl3 to obtain the desired product 6 (600 mg, 92%) as a colorless liquid. 1H NMR (400 MHz, CDCl3): δ 4.86 (1 H, quint, J = 6.4 Hz), 4.06 (2 H, t, J = 6.8 Hz), 3.60–3.43 (2 H, br), 2.67–2.53 (2 H, br), 2.52–2.36 (4 H, br), 2.36–2.31 (1 H, m), 2.27 (2 H, t, J = 7.6 Hz), 1.77–1.38 (22 H, m), 1.38–1.11 (52 H, m), 0.88 (12 H, t, J = 7.2 Hz). ESI-MS: m/z 809.2 [M + 1]+.
The above alcohol 6 (600 mg, 0.74 mmol, 1.0 equiv.), N, N-dimethyl aminobutyric acid hydrochloride (248 mg, 1.48 mmol, 2.0 equiv.), EDC.HCl (283 mg, 1.48 mmol, 2.0 equiv.) and DMAP (18 mg, 0.15 mmol, 20 mol%) were dissolved in dry CH2Cl2 (20 mL) under argon atmosphere and stirred overnight at room temperature. After that, the reaction was quenched with sat. NaHCO3 followed by extract with CH2Cl2 (3 times). Then the organic portion was washed with brine solution and dried over anhydrous Na2SO4. The solvent was evaporated, and the residue was purified by column chromatography using 0–10% Isopropanol in CHCl3 to bestow Lipid 24 (540 mg, 79%) as colorless oil. 1H NMR (400 MHz, CDCl3): δ 4.86 (1 H, quint, J = 6.4 Hz), 4.11 (2 H, t, J = 6.4 Hz), 4.06 (2 H, t, J = 6.8 Hz), 2.67 (2 H, t, J = 6.4 Hz), 2.43 (4 H, t, J = 7.6 Hz), 2.37–2.24 (3 H, m), 2.34 (2 H, t, J = 7.6 Hz), 2.27 (2 H, t, J = 7.6 Hz), 2.24 (6 H, s), 1.80 (2 H, quint, J = 7.2 Hz), 1.74–1.54 (10 H, m), 1.54–1.46 (4 H, m), 1.46–1.36 (6 H, m), 1.36–1.11 (54 H, m), 0.88 (12 H, t, J = 7.2 Hz). ESI-MS: m/z 922.2 [M + 1]+; 462.0 [M/2 + 1]+.
Synthesis of Lipid 25
Linoleyl aldehyde 7 (3.2 g, 12.12 mmol, 1 equiv.) and ethanolamine (0.89 ml, 14.54 mmol, 1.2 equiv.) were dissolved in dry CH2Cl2 (60 mL) under nitrogen atmosphere and stirred for 2 hr at room temperature. Then sodium triacetoxyborohydride (5.1 g, 24.24 mmol, 2 equiv.) was added portion-wise and stirred for overnight at the same temperature. After that, the reaction was quenched with sat. NaHCO3 solution followed by extract with CH2Cl2 (3 times). The organic layer was washed with brine solution and dried over anhydrous Na2SO4. The solvent was evaporated and the residue was purified by column chromatography using 0–10% MeOH in CHCl3 to obtain linoleyl ethanolamine 8 (2.0 g, 54%) as a pale yellowish liquid. 1H NMR (400 MHz, CDCl3): δ 5.40–5.30 (4 H, m), 3.64 (2 H, t, J = 5.2 Hz), 2.83–2.73 (4 H, m), 2.62 (2 H, t, J = 7.2 Hz), 2.04 (4 H, q, J = 6.8 Hz), 1.54–1.43 (2 H, m), 1.41–1.21 (16 H, m), 0.88 (3 H, t, J = 6.8 Hz). ESI-MS: m/z 310.5 [M + 1]+.
To linoleyl ethanolamine 8 (350 mg, 1.13 mmol, 1.0 equiv.), a solution of (Z)-non-3-en-1-yl 6-oxohexanoate 9 (374 mg, 1.47 mmol, 1.3 equiv.) in dry CH2Cl2 (20 mL) under argon atmosphere and stirred for 2 h at room temperature. Then sodium triacetoxyborohydride (477 mg, 2.26 mmol, 2.0 equiv.) was added portion-wise and stirred for overnight at the same temperature. The reaction was quenched with sat. NaHCO3 solution followed by extraction with CH2Cl2 (3 times). The organic layer was washed with brine solution and dried over anhydrous Na2SO4. The solvent was evaporated on a rotary evaporator, and the residue was purified by column chromatography using 0-2% MeOH in CHCl3 to provide lipid 10 (515 mg, 83%) as a pale yellowish oil. 1H NMR (400 MHz, CDCl3): δ 5.55–5.45 (1 H, m), 5.43–5.25 (5 H, m), 4.06 (2 H, t, J = 6.8 Hz), 3.55 (2 H, t, J = 5.2 Hz), 2.77 (2 H, t, J = 6.4 Hz), 2.61 (2 H, t, J = 5.4 Hz), 2.49 (4 H, q, J = 7.2 Hz), 2.37 (2 H, q, J = 6.8 Hz), 2.30 (2 H, t, J = 7.6 Hz), 2.04 (6 H, quint, J = 6.8 Hz), 1.63 (4 H, quint, J = 7.6 Hz), 1.54–1.40 (6 H, m), 1.40–1.17 (20 H, m), 0.89 (6 H, t, J = 6.4 Hz). ESI-MS: m/z 548.6 [M + 1]+.
The above ethanolamine 10 (508 mg, 0.93 mmol, 1.0 equiv.), 4-(dimethylamino) butyricacid hydrochloride (310 mg, 1.86 mmol, 2.0 equiv.), EDC.HCl (354 mg, 1.86 mmol, 2.0 equiv.) and DMAP (22 mg, 0.18 mmol, 0.2 equiv.) were dissolved in dry CH2Cl2 (20 mL) under an argon atmosphere and stirred overnight at room temperature. Then the reaction was quenched with sat. NaHCO3 followed by extraction with CH2Cl2 (3 times) and washed with brine solution, and dried with anhydrous Na2SO4. The solvent was evaporated, and the residue was purified by column chromatography using 0–10% IPA in CHCl3 to obtain Lipid 25 (530 mg, 87%) as a pale yellow color oil. 1H NMR (400 MHz, CDCl3): δ 5.54–5.45 (1 H, m), 5.42–5.27 (5 H, m), 4.11 (2 H, t, J = 6.4 Hz), 4.06 (2 H, t, J = 6.8 Hz), 2.77 (2 H, t, J = 6.8 Hz), 2.67 (2 H, t, J = 6.4 Hz), 2.48–2.40 (4 H, m), 2.40–2.26 (8 H, m), 2.24 (6 H, s), 2.04 (6 H, quint, J = 6.8 Hz), 1.80 (2 H, quint, J = 7.6 Hz), 1.63 (4 H, quint, J = 7.6 Hz), 1.51–1.15 (26 H, m), 0.89 (6 H, t, J = 6.4 Hz). ESI-MS: m/z 661.8 [M + 1]+; 331.4 [M/2 + 1]+.
Synthesis of Lipid 26
To a suspension of hydroxylamine hydrochloride (163 mg, 2.35 mmol, 0.5 equiv.) in dry CH2Cl2 (10 mL), anhydrous triethylamine (0.33 mL, 2.35 mmol, 0.5 equiv.) was added under argon atmosphere and stirred for 10 min at room temperature. Then, a solution of 8-oxooctyl 2-hexyldecanoate 5 (1.8 g, 4.71 mmol, 1 equiv.) in dry CH2Cl2 (20 mL) was added and stirred for 2 h. After that, the reaction was diluted with another 20 mL of dry CH2Cl2, and sodium triacetoxyborohydride (2.0 g, 9.42 mmol, 2 equiv.) was added portion-wise over a period of 10 min and stirred for 6 h. at room temperature. Then, the reaction was quenched with sat. NaHCO3 solution and extracted with CH2Cl2 (3 times). The organic portion was washed with brine solution and dried over anhydrous Na2SO4. The solvent was evaporated, and the residue was purified by column chromatography using 0–10% EtOAc in hexane to obtain 1.54 g of desired hydroxylamine 11 (85%) as a pale yellow liquid. 1H NMR (400 MHz, CDCl3): δ 4.06 (4 H, t, J = 6.8 Hz), 2.65 (4 H, t, J = 7.2 Hz), 2.35–2.24 (2 H, m), 1.66–1.52 (12 H, m), 1.48–1.15 (60 H, m), 0.87 (12 H, t, J = 6.8 Hz). ESI-MS: m/z 767.0 [M + 1]+.
The above hydroxylamine 11 (1.53 g, 2.0 mmol, 1.0 equiv.), 4-(Dimethylamino) butyricacid hydrochloride (0.67 g, 4.0 mmol, 2.0 equiv.), EDC.HCl (0.76 g, 4.0 mmol, 2.0 equiv.) and DMAP (0.048 g, 0.4 mmol, 0.2 equiv.) were dissolved in dry CH2Cl2 (40 mL) under an argon atmosphere and stirred for 6 h. at room temperature. Then the reaction mixture was quenched with sat. NaHCO3 followed by extraction with CH2Cl2 (3 times) and washed with brine solution, and dried over anhydrous Na2SO4. The solvent was evaporated, and the residue was purified by column chromatography using 0–10% IPA in CHCl3 to obtain Lipid 26 (1.3 g, 74%) as a pale yellowish liquid. 1H NMR (400 MHz, CDCl3): δ 4.05 (4 H, t, J = 6.8 Hz), 2.79 (4 H, t, J = 7.6 Hz), 2.36–2.24 (6 H, m), 2.21 (6 H, s), 1.80 (2 H, quint, J = 7.2 Hz), 1.64–1.37 (20 H, m), 1.36–1.09 (52 H, m), 0.87 (12 H, t, J = 6.8 Hz). ESI-MS: m/z 880.2 [M + 1]+.
Locked nucleic acid sequences
HIF1a splicer 5’CCTTTCACTCGTTTCCAG-3’. TNFa downregulater 5’-CCAAATAAATACATTCATA-3’. Negative control 5’-CCAAATCTTATAATAACTAC-3’.
Cell lines
RAW 264.7 cells (ATCC, TIB-71), NIH/3T3 (ATCC CRL-1658), and MC38 (Kerafast, ENH204-FP) were used. All cells were routinely checked every two months for Mycoplasma contamination using EZ-PCR Mycoplasma Test Kit (Biological Industries) according to the manufacturer’s protocol.
Preparation of LNP entrapping ASOs
LNPs were synthesized by mixing one volume of lipid mixture of [Ionizable Lipid: Cholesterol: PEG-DMG: DSPC] molar ratio of [50: 38.5: 1.5:10] in ethanol and three volumes of ASO (i.e., splice-switcher LNA anti-Hif1α, or ASO anti-TNFα) in acetate buffer. Both were injected into a microfluidic mixing device, Nanoassemblr® (Precision Nanosystems, Vancouver, BC), at a combined flow rate of 2 mL/min (0.5 mL/min for ethanol and 1.5 mL/min for aqueous buffer). The resulting LNPs were dialyzed against PBS for 24 h to remove the ethanol and restore the pH to neutral. The hydrodynamic diameter and zeta potential of the LNPs were measured by dynamic light scattering using disposable cuvettes in the Malvern Zetasizer (Malvern Instruments). Encapsulation was quantified by Quant-it™ RiboGreen RNA Assay Kit (Thermo Fisher).
Cell viability assay
Cell viability was assessed by 2,3-Bis-(2-methoxy-4-nitro-5-sulfophenyl)-2H-tetrazolium-5-carboxanilide salt (XTT) assay (Cell Proliferation Kit, Biological Industries, Israel). 50 μL of reaction mixture was added per well after each time point and incubated for another 2 h. The plate is gently shaken to dissolve the orange-formazan crystals, and measurements and calculations were performed as recommended by the manufacturer.
pKa measurement
As previously described the pKa values of LNPs were measured using the 2-(p-toluidino)-6-naphthalenesulfonic acid (TNS) assay.8 Briefly, the master buffer was prepared using 10 mM 4-(2-hydroxyethyl)-1-piperazineethanesulfonic acid (HEPES), 10 mM 4-morpholineethanesulfonic acid (MES), 10 mM ammonium acetate, and 130 mM sodium chloride (NaCl). Sixteen buffers with pH ranging from 2.5 to 10 were prepared using 1.0 M sodium hydroxide and 1.0 M hydrochloric acid based on the master buffer. The TNS reagent was prepared as a 0.1 mM stock solution in MilliQ water. 90 µL of each buffer was added in triplicate to a black 96-well plate, and then 6 µL of 0.1 mM lipid in ethanol/total lipid LNPs were added to each well. Then, 5 µL of TNS stock solution was added to each well and kept on the shaker to mix properly for 10 min by covering the plate with aluminum foil. Fluorescence intensity was measured using excitation and emission wavelengths of 322 nm and 431 nm, respectively. pKa curves were prepared by plotting the pH values on the x-axis and the normalized fluorescence values on the y-axis. Estimation of the pKa values was performed using GraphPad Prism to perform non-linear regression with variable slope.
In vitro activity
RAW 264.7 cells (ATCC, TIB-71), NIH/3T3 (ATCC, CRL-1658), and MC38 (Kerafast, ENH204-FP) were seeded in a 24-well plate, at a density (cells/well) of 15,000, 20,000, and 20,000, respectively, according to their doubling time, and allowed to reach the linear phase overnight. The cells were treated with ascending concentrations of LNPs containing ASO splice-switcher LNA anti-Hif1〈 To establish the curves. After 96 h, cells were harvested, and mRNA was isolated using EZ-RNA (Biological Industries), and cDNA was prepared using a cDNA synthesis kit (Quanta Biosciences).
Digital Droplet PCR
QX200 Droplet Digital PCR System was used to quantify Hif1α splice-switching percentage according to the manufacturer’s protocol. Wild-type Hif1α and mutated were quantified using the following primers and probs sequences:
Wild-type Hif1α primer 1: GTGGTAATCCACTCTCATCC; Wild-type Hif1α primer 2: CAAGGAGCCTTAACCTGTC; Wild-type Hif1α probe: /5HEX/AGCAGCAGG/ZEN/AATTGGAACATTATTGCAG/3IABkFQ/
Mutated Hif1α primer 1: GTGGTAATCCACTCTCATCC; Mutated Hif1α primer 2: CAAGGAGCCTTAACCTGTC; Mutated Hif1α probe: /56-FAM/AGCAGCAGG/ZEN/AATTATTTAGCATGCAGAC/3IABkFQ/.
Animal experiments
All animal protocols were approved by Tel Aviv University Institutional Animal Care and Usage Committee and by current regulations and standards of the Israel Ministry of Health, Permit number TAU-LS-IL-2301-109-5. All animal experiments were conducted in a double-blinded fashion; the researchers were blinded to group allocation and administered treatments. Mice were randomly divided in a blinded fashion at the beginning of each experiment. The animals were housed under standard Specific Pathogen-Free (SPF) conditions, with a 12-h light/dark cycle, ambient temperature maintained at 20–24 °C, and relative humidity of 45–65%. Food and water were provided ad libitum.
In vivo splice switching in the liver and the spleen
Wild-type C57BL/6 mice (n = 3) received a 1 mg/kg retro-orbital injection of LNPs prepared with lipids 10, 15, or 2, and loaded with either Ahα or negative control ASOs. In control groups, mice were injected with unformulated ASOs (AHα or negative control) at a high dose of 30 mg/kg or a low dose of 1 mg/kg, or PBS (200 μl in volume). Livers and spleens were extracted at 24, 48, or 72 h, depending on the group. Total RNA was extracted and processed using the gentleMACS™ Dissociator with Program RNA_01 while using EZ-RNA (Biological Industries) and Splice-switching (SpSw) efficiency was examined via ddPCR as previously described.
IBD model
Colitis was induced in 9-week-old female C57BL/6 mice (Harlan laboratories) using dextran sodium sulfate (DSS) as previously described24. Mice were fed for 7 days with 2% (wt/vol) DSS in the drinking water, for a period of time as applicable per each experiment.
Assessment of LNPs biodistribution in vivo
DSS colitis-bearing C57BL/6 mice (n = 4) were injected retro-orbitally with a dose of 1 mg/kg of LNPs prepared using 50:50 (w/w) Cy5-labeled noncoding siRNA and Hif1a-ASO. After 18 h from injection, mice were sacrificed, their hearts, lungs, livers, spleens, kidneys, small intestines, and colons were harvested, and the Cy5 fluorescence was assessed via IVIS. The Cy5 radiance was then analyzed through the Living Image 4.1 Software using ad hoc ROIs. Then the colons were processed to dissociate immune cells from their lamina propria. For this, the colons were cut longitudinally and washed in 1X PBS. Then, epithelial cells were removed using DTT and EDTA washes. Subsequently, the tissue was digested enzymatically using a mix of Collagenase D (Roche), Dispase (Worthington), and DNAse (Sigma), strained, and immune cells isolated using a Percoll gradient. Cells were counted, and a volume equal to 1 million cells was transferred to FACS tubes. The isolated cells were then treated with FcR blocker (Miltenyi Biotech), and labeled with the following antibody panels according to the producer’s instructions:
-
Panel 1: CD31-FITC (Cat# 102413, Biolegend), CD11b-PE (Cat# 101207, Biolegend), F/480-PE-Cy7 (Cat# 1123113, Biolegend), CD11c-AlexaFluor 700 (Cat# 117319, Biolegend), CD45 APC-Fire750 (Cat# 147713, Biolegend).
-
Panel 2: CD19-FITC (Cat# 152404, Biolegend), Ly6G-PE (Cat# 127608, Biolegend), CD3ε-PerCP (Cat# 100326, Biolegend), Ly6C-APC-Cy7 (Cat# 128026, Biolegend), CD11b-PE-Cy7 (Cat# 101215, Biolegend).
Cells were then analyzed using a Cytoflex Flow cytometer (Beckman Coulter). The gating strategies for flow cytometry panels were selected as follows: after establishing the biological markers and the fluorophores to be tested, we performed the experiment on the colon samples as described above. As negative control for markers’ staining, we used unstained samples, while as negative control for LNPs uptake, we used samples coming from mice that were not treated with LNPs (Untreated, UT), and that were stained using the same fluorophores as the treated samples. This allowed us to carefully define the gate for Cy5 uptake across all different cell populations without changing any other setting (Supplementary Figs. 6 and 7).
Splice-switching efficiency in a colitis model
Colitis was induced in 9-week-old female C57BL/6 mice as described. The colitis-bearing mice group was switched to normal water on day 8 and injected retro-orbitally with PBS, 1 mg/kg aHα-loaded Lipid 15, or unformulated Ahα in either 1 mg/kg or 30 mg/kg. The mice were sacrificed on day 9, the colons were extracted, and small segments were processed as previously described.
Therapeutic efficacy study
Colitis was induced in 9-week-old female C57BL/6 mice as described (n = 10, per treatment group), and a healthy group (n = 5) ran in parallel. On days 3 and 5, DSS-treated mice received a retro-orbital injection of PBS, 2 mpk Free ASOs Anti-TNFα, 2 mpk Lipid Nanoparticles Anti-TNFα, or 2 mpk Lipid Nanoparticles Negative Control. Weight was measured on days 0, 3, 4, 5, and 7. On day 7, the length of the entire colon from cecum to anus was measured. Small segments of the colon were taken for histologic and immunohistochemistry evaluation as well as pathological scoring. Colon samples were homogenized to assess cytokines by TNFα, IL-6, and IL-1® ELISA kits (R&D Systems).
In vivo safety study
Colitis was induced in 9-week-old female C57BL/6 mice as described n = 7 per group. In parallel to the healthy group, the DSS-treated mice received a retro-orbital injection of PBS, 2 mpk Free ASOs Anti-TNFα, 2 mpk Lipid Nanoparticles Anti-TNFα, or 2 mpk Lipid Nanoparticles Negative Control and were killed 24 h later. Blood was collected and analyzed for Liver enzymes, lymphocytes, monocytes, and platelets.
Statistical analysis
Data in the bar charts are expressed as mean ± standard deviation unless otherwise indicated. Dot plots are expressed as the mean. Error bars represent the standard error of the mean. In points where the error bar is missing, the error bars are smaller than the symbols and are therefore not displayed. Statistical analysis was performed in GraphPad Prism. Generally, a one-way ANOVA with Bonferroni’s correction was used when comparing three or more groups. More specifically, for the experiment testing splice-switching in colitis, two-way ANOVA with Šidák’s correction was used, while for the weight follow-up, two-way ANOVA with Dunnett’s correction was used. A value of P < 0.05 was considered statistically significant. Analyses were performed with Prism 10 (GraphPad Software). Differences are labeled n.s. for not significant, * for P ≤ 0.05, ** for P ≤ 0.01, *** for P ≤ 0.001, and **** for P ≤ 0.0001. The sample size of each experiment was determined to be the minimum necessary for statistical significance by the common practice in the field. Pre-established criteria for the removal of animals from experiments were based on animal health, behavior, and well-being as required by ethical guidelines; no animals were excluded from the experiments.
Inclusion and ethics statement
All collaborators of this study have fulfilled the criteria for authorship required by Nature Portfolio journals and have been included as authors, as their participation was essential for the design and implementation of the study. Roles and responsibilities were agreed upon among collaborators ahead of the research. This research was not severely restricted or prohibited in the setting of the researchers. Animal studies have been approved by a local ethics review committee.
Reporting summary
Further information on research design is available in the Nature Portfolio Reporting Summary linked to this article.