Data availability
The sample information and read counts for 3,407 genes across 2 cell lines (MDA-MB-231 and HEK293T cells) subjected to perturbation by 13,221 compounds in this study are available for download at https://cigs.iomicscloud.com/. Raw sequencing data are available from the corresponding author on reasonable request. The RNA-seq data generated during the current study are available at the GEO (GSE294293). Source data are provided with this paper. All other data generated during this study are included in this published article and its Supplementary Information.
Code availability
The source code used for the analyses presented in this study is available at https://github.com/Wang-lab302/CIGS/.
References
-
DeRisi, J. L., Iyer, V. R. & Brown, P. O. Exploring the metabolic and genetic control of gene expression on a genomic scale. Science 278, 680–686 (1997).
-
Chandrasekaran, S. N. et al. Three million images and morphological profiles of cells treated with matched chemical and genetic perturbations. Nat. Methods 21, 1114–1121 (2024).
-
Lamb, J. et al. The Connectivity Map: using gene-expression signatures to connect small molecules, genes, and disease. Science 313, 1929–1935 (2006).
-
Subramanian, A. et al. A next generation connectivity map: L1000 platform and the first 1,000,000 profiles. Cell 171, 1437–1452 (2017).
-
Tian, S. et al. Exploring pharmacological active ingredients of traditional Chinese medicine by pharmacotranscriptomic map in ITCM. Brief. Bioinform. 24, bbad027 (2023).
-
Stathias, V. et al. Drug and disease signature integration identifies synergistic combinations in glioblastoma. Nat. Commun. 9, 5315 (2018).
-
Li, H. et al. Versatile pathway-centric approach based on high-throughput sequencing to anticancer drug discovery. Proc. Natl Acad. Sci. USA 109, 4609–4614 (2012).
-
Shao, W. et al. Chemical genomics reveals inhibition of breast cancer lung metastasis by ponatinib via c-Jun. Protein Cell 10, 161–177 (2019).
-
Wang, H. et al. Tumor immunological phenotype signature-based high-throughput screening for the discovery of combination immunotherapy compounds. Sci. Adv. 7, eabd7851 (2021).
-
Xing, F. et al. Activation of the c-met pathway mobilizes an inflammatory network in the brain microenvironment to promote brain metastasis of breast cancer. Cancer Res. 76, 4970–4980 (2016).
-
Giusto, E. et al. Graphene oxide nanoplatforms to enhance cisplatin-based drug delivery in anticancer therapy. Nanomaterials 12, 2372 (2022).
-
Abegglen, L. M. et al. Potential mechanisms for cancer resistance in elephants and comparative cellular response to DNA damage in humans. JAMA 314, 1850–1860 (2015).
-
Moreno, V. et al. Phase I study of CC-90010, a reversible, oral BET inhibitor in patients with advanced solid tumors and relapsed/refractory non-Hodgkin’s lymphoma. Ann. Oncol. 31, 780–788 (2020).
-
Stubbs, M. C. et al. The novel bromodomain and extraterminal domain inhibitor INCB054329 induces vulnerabilities in myeloma cells that inform rational combination strategies. Clin. Cancer Res. 25, 300–311 (2019).
-
Picaud, S. et al. Promiscuous targeting of bromodomains by bromosporine identifies BET proteins as master regulators of primary transcription response in leukemia. Sci. Adv. 2, e1600760 (2016).
-
Gao, Y. et al. Overcoming resistance to the THZ series of covalent transcriptional CDK inhibitors. Cell Chem. Biol. 25, 135–142 (2018).
-
Lücking, U. et al. Identification of atuveciclib (BAY1143572), the first highly selective, clinical PTEFb/CDK9 inhibitor for the treatment of cancer. ChemMedChem 12, 1776–1793 (2017).
-
Rzymski, T. et al. SEL120-34A is a novel CDK8 inhibitor active in AML cells with high levels of serine phosphorylation of STAT1 and STAT5 transactivation domains. Oncotarget 8, 33779–33795 (2017).
-
Pang, Y. et al. The BRD4 inhibitor JQ1 suppresses tumor growth by reducing c-Myc expression in endometrial cancer. J. Transl. Med. 20, 336 (2022).
-
Lovén, J. et al. Selective inhibition of tumor oncogenes by disruption of super-enhancers. Cell 153, 320–334 (2013).
-
Hu, J., Gu, W., Ma, N., Fan, X. & Ci, X. Leonurine alleviates ferroptosis in cisplatin-induced acute kidney injury by activating the Nrf2 signalling pathway. Br. J. Pharmacol. 179, 3991–4009 (2022).
-
Fan, Z. et al. Nrf2-Keap1 pathway promotes cell proliferation and diminishes ferroptosis. Oncogenesis 6, e371 (2017).
-
Qiu, W. et al. Asiatic acid alleviates LPS-induced acute kidney injury in broilers by inhibiting oxidative stress and ferroptosis via activation of the Nrf2 pathway. Food Chem. Toxicol. 170, 113468 (2022).
-
Li, J. et al. PHDs-seq: a large-scale phenotypic screening method for drug discovery through parallel multi-readout quantification. Cell Regen. 12, 22 (2023).
-
Teder, H. et al. TAC-seq: targeted DNA and RNA sequencing for precise biomarker molecule counting. NPJ Genom. Med. 3, 34 (2018).
-
Ye, C. et al. DRUG-seq for miniaturized high-throughput transcriptome profiling in drug discovery. Nat. Commun. 9, 4307 (2018).
-
Li, J. et al. DRUG-seq provides unbiased biological activity readouts for neuroscience drug discovery. ACS Chem. Biol. 17, 1401–1414 (2022).
-
Bush, E. C. et al. PLATE-Seq for genome-wide regulatory network analysis of high-throughput screens. Nat. Commun. 8, 105 (2017).
-
Yeakley, J. M. et al. A trichostatin A expression signature identified by TempO-Seq targeted whole transcriptome profiling. PLoS ONE 12, e0178302 (2017).
-
Peck, D. et al. A method for high-throughput gene expression signature analysis. Genome Biol. 7, R61 (2006).
-
Guo, Y. et al. YeastFab: the design and construction of standard biological parts for metabolic engineering in Saccharomyces cerevisiae. Nucleic Acids Res. 43, e88 (2015).
-
Matsuo, K. et al. Efficient use of a crude drug/herb library reveals ephedra herb as a specific antagonist for TH2-specific chemokine receptors CCR3, CCR4, and CCR8. Front. Cell Dev. Biol. 4, 54 (2016).
-
Feng, R. et al. Protective effects of ligustroflavone, an active compound from ligustrum lucidum, on diabetes-induced osteoporosis in mice: a potential candidate as calcium-sensing receptor antagonist. Am. J. Chin. Med. 47, 457–476 (2019).
-
Haghighi, M., Caicedo, J. C., Cimini, B. A., Carpenter, A. E. & Singh, S. High-dimensional gene expression and morphology profiles of cells across 28,000 genetic and chemical perturbations. Nat. Methods 19, 1550–1557 (2022).
-
Moshkov, N. et al. Predicting compound activity from phenotypic profiles and chemical structures. Nat. Commun. 14, 1967 (2023).
-
Lotfollahi, M. Toward learning a foundational representation of cells and genes. Nat. Methods 21, 1416–1417 (2024).
-
Fan, J. L., Nazaret, A. & Azizi, E. A thousand and one tumors: the promise of AI for cancer biology. Nat. Methods 21, 1403–1406 (2024).
-
Yuan, B. et al. CellBox: interpretable machine learning for perturbation biology with application to the design of cancer combination therapy. Cell Syst. 12, 128–140 (2021).
-
Lotfollahi, M. et al. Predicting cellular responses to complex perturbations in high-throughput screens. Mol. Syst. Biol. 19, e11517 (2023).
-
Smith, T., Heger, A. & Sudbery, I. UMI-tools: modeling sequencing errors in unique molecular identifiers to improve quantification accuracy. Genome Res. 27, 491–499 (2017).
-
Langmead, B. & Salzberg, S. L. Fast gapped-read alignment with Bowtie 2. Nat. Methods 9, 357–359 (2012).
-
Love, M. I., Huber, W. & Anders, S. Moderated estimation of fold change and dispersion for RNA-seq data with DESeq2. Genome Biol. 15, 550 (2014).
-
Kim, D., Paggi, J. M., Park, C., Bennett, C. & Salzberg, S. L. Graph-based genome alignment and genotyping with HISAT2 and HISAT-genotype. Nat. Biotechnol. 37, 907–915 (2019).
-
Anders, S., Pyl, P. T. & Huber, W. HTSeq–a Python framework to work with high-throughput sequencing data. Bioinformatics 31, 166–169 (2015).
-
Zhang, S.-D. & Gant, T. W. A simple and robust method for connecting small-molecule drugs using gene-expression signatures. BMC Bioinformatics 9, 258 (2008).
-
Lin, K. et al. A comprehensive evaluation of connectivity methods for L1000 data. Brief. Bioinform. 21, 2194–2205 (2020).
-
Berman, H. M. et al. The Protein Data Bank. Acta Crystallogr. D. Biol. Crystallogr. 58, 899–907 (2002).
-
Dai, Y. et al. Guizhi fuling decoction inhibiting the PI3K and MAPK pathways in breast cancer cells revealed by HTS2 technology and systems pharmacology. Comput. Struct. Biotechnol. J. 18, 1121–1136 (2020).
-
Liao, Y. et al. Ethyl acetate extract of Antenoron Filiforme inhibits the proliferation of triple negative breast cancer cells via suppressing Skp2/p21 signaling axis. Phytomedicine 116, 154856 (2023).
-
Wang, Y. et al. Large-scale loss-of-function perturbations reveal a comprehensive epigenetic regulatory network in breast cancer. Cancer Biol. Med. 21, 83–103 (2023).
-
Jafari, R. et al. The cellular thermal shift assay for evaluating drug target interactions in cells. Nat. Protoc. 9, 2100–2122 (2014).
Acknowledgements
We thank X.-D. Fu (Westlake University) for valuable advice. We thank Y. Gao, J. Yang, J. Li, Y. Tian and R. Jia (Iomics Biosciences) for their assistance with the website building and drug screening. We thank H. Xu and C. Sun (Chengdu University of Traditional Chinese Medicine) for their assistance with flow cytometry experiments and pathological slide scanning. We thank G. Wang (Chengdu University of Traditional Chinese Medicine) for assistance with the CETSA analysis. D.W. received support from the National Key R&D Program of China (no. 2023YFF0720300), the National Natural Science Foundation of China (no. 82172723) and the Innovation Team and Talents Cultivation Program of National Administration of Traditional Chinese Medicine (no. ZYYCXTD-D-202209).
Ethics declarations
Competing interests
Patent applications were filed based on the results of this study. D.W. is a consultant for Iomics Biosciences. W.S., J.W., Y. Li and J.X. were employed by Iomics Biosciences during the time they contributed to this paper. The other authors declare no competing interests.
Peer review
Peer review information
Nature Methods thanks the anonymous reviewers for their contribution to the peer review of this work. Primary Handling Editor: Madhura Mukhopadhyay, in collaboration with the Nature Methods team.
Additional information
Publisher’s note Springer Nature remains neutral with regard to jurisdictional claims in published maps and institutional affiliations.
Extended data
Extended Data Fig. 1 HTS2 evaluation.
a, Comparison of the expression levels of the 3,407 genes selected in this study with random 3,407 genes. The gene expression profiles used for analysis were obtained from the GEO database (GSE204790 and GSE249322) and in-house bulk RNA-seq data (GSE294293). Box plots show the median (center line), 25th and 75th percentiles (box bounds), and full data range. From left to right, the medians are: 8.73, 1.58, 9.42, 0, 8.63, and 3.81, respectively. The interquartile ranges are: 4.86-10.09, 0-7.99, 4.46-11.04, 0-7.33, 4.33-10.27, and 0-8.41, respectively. The minimum and maximum values are: 0-15.46, 0-13.63, 0-16.98, 0-15.45, 0-16.26, and 0-17.97, respectively. n = 3 per group. b, The scheme of HTS2. Image generated in BioRender. c, Mapping rate of HTS2 results (n=5,639). The median is 43.86; the interquartile range is 26.87-59.90, with a minimum of 0.20 and a maximum of 100. d and e, Comparison of HTS2 with RNA-seq and qPCR. Pearson correlation (two-sided) of mRNA quantification between RNA-seq and HTS2 (d) and Pearson correlation (two-sided) of mRNA quantification between qPCR and HTS2 (e). f, Evaluation of reproducibility. Pearson correlation of gene expression between DMSO samples or JQ1 samples in different sequencing library construction batches. Gene expression (read counts) was scale-normalized and transformed into log2(read counts+1). Box plots show the median (center line), 25th and 75th percentiles (box bounds), and full data range. From left to right, the medians are 0.92, 0.91, 0.90, and 0.90, with interquartile ranges of 0.88-0.94, 0.87-0.94, 0.89-0.92, and 0.88-0.92, respectively. The minima and maxima are: 0.60-1, 0.60-1, 0.57-1, and 0.61-1, respectively. Sample sizes (n) are: 803, 810, 833, and 698, respectively.
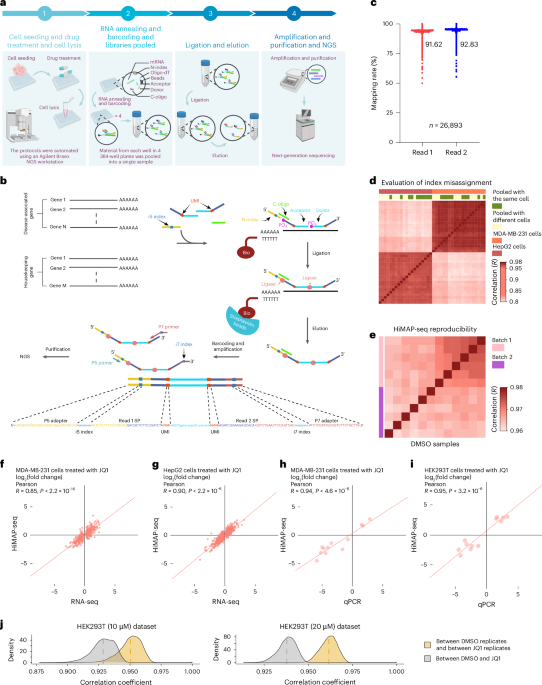
Extended Data Fig. 2 Evaluating HiMAP-seq for index misassignment, UMI correction, and technical reproducibility.
a-c, Evaluation of index misassignment. Pearson correlation (two-sided) was calculated for gene expression between MDA-MB-231 cell sample (pooled with MDA-MB-231 cells) and HepG2 cell sample (pooled with HepG2 cells) (a). Pearson correlation (two-sided) of gene expression was calculated between pairs of samples: two samples of MDA-MB-231 cells pooled with MDA-MB-231 cells (left panel), and one sample of MDA-MB-231 cells pooled with both MDA-MB-231 cells and HepG2 cells compared with another sample of MDA-MB-231 cells pooled with MDA-MB-231 cells (right panel) (b). Pearson correlation (two-sided) of gene expression was calculated between pairs of samples: two samples of HepG2 cells pooled with HepG2 cells (left panel), and one sample of HepG2 cells pooled with both MDA-MB-231 cells and HepG2 cells compared with another sample of HepG2 cells pooled with HepG2 cells (right panel) (c). Gene expression (read counts) was scale-normalized and transformed into log2(read counts+1). d-f, Evaluation of UMI error correction. Pearson correlation and dendrogram of hierarchical clustering were performed to analyze the gene expression values of 12 MDA-MB-231 cells samples treated with DMSO. Gene expression data (read counts) were scale-normalized and transformed into log2(read counts+1) for the left panel. Similarly, gene expression (UMI counts) was scale-normalized and transformed into log2(UMI counts+1) for the right panel (d). Correlation analysis (two-sided) was performed between 2 random samples from the above 12 samples. Panel (e) represents the analysis based on read counts, while panel (f) represents the analysis based on UMI counts. g and h, Evaluation of reproducibility. Pearson correlation (two-sided) of gene expression between DMSO samples prepared within the same sequencing library construction batch (g) and across different sequencing library construction batches (h). Gene expression (UMI counts) was scale-normalized and transformed into log2(UMI counts+1).
Extended Data Fig. 3 Evaluating HiMAP-seq for sensitivity and accuracy.
a, Distribution of detected gene counts within samples of MDA-MB-231 cells, each comprising varying cell numbers (n = 16 for each group). Sequencing data from pooled samples amounted to 16,221 Mbp, with genes classified as ‘detected’ if their read count in the sample exceeded 0. The average number of detected genes within each group was computed based on data collected from the 16 samples. b, Distribution of detected gene counts in samples of MDA-MB-231 cells with varying sequencing depths. Reads from the MDA-MB-231 cells sample containing 3,500 cells were randomly selected, and the number of detectable genes was recorded at various read depths. c and d, Comparison of HiMAP-seq with RNA-seq. Heat maps displaying the log2(fold change) of genes in MDA-MB-231 cells (c) and HepG2 cells (d) both treated with 10 μM JQ1. The log2(fold change) values were determined using either HiMAP-seq or RNA-seq. e and f, Comparison of HiMAP-seq with qPCR. Heat maps displaying the log2(fold change) of genes in MDA-MB-231 cells (e) and HEK293T cells (f) both treated with 10 μM JQ1. The log2(fold change) values were detected using HiMAP-seq or qPCR. g and h, The Pearson correlation (two-sided) between DMSO and JQ1 treated samples. For MDA-MB-231 cells, the treatment concentrations were 10 μM and 20 μM, respectively (g). The boxplot displays the Pearson correlation between identically perturbed samples and the correlation between two random samples. Self-samples represent biological replicate samples. Box plots show the median (center line), 25th and 75th percentiles (box bounds), and full data range. From left to right, the medians are: 0.94, 0.95, 0.97, 0.97, 0.96, 0.96, 0.96, and 0.97, respectively. The interquartile ranges are: 0.94-0.95, 0.95-0.96, 0.96-0.97, 0.967-0.970, 0.94-0.96, 0.96-0.97, 0.96-0.97, and 0.96-0.97, respectively. The minimum and maximum values are: 0.84-0.97, 0.91-0.97, 0.89-0.97, 0.95-0.97, 0.91-0.97, 0.95-0.97, 0.89-0.97, and 0.93-0.98, respectively. Sample sizes (n) are: 5,538, 1,846, 5,289, 1,763, 5,463, 1,821, 5,259, and 1,753, respectively (h). Comparisons were made using Student’s t-test. i, Comparison of HiMAP-seq with RNA-seq from public datasets. Pearson correlation coefficients (two-sided) were calculated to evaluate mRNA quantification consistency between RNA-seq and HiMAP-seq in MDA-MB-231 cells. For HiMAP-seq and RNA-seq (GSE236250) samples, the perturbation concentration was 20 μM and 25 μM, respectively. Genes with |fold change | ≥ 1.5 were included in this analysis, and the results are presented as log2(fold change).
Extended Data Fig. 4 Generation of CIGS.
a and b, TSNE plot of all compounds in MDA-MB-231 cells (a) and HEK293T (b). JQ1 treatment serves as a positive control in both HiMAP-seq and HTS2 experiments. Each dot represents a compound. c, Comparison of HiMAP-seq with HTS2. Heat maps displaying the log2(fold change) of genes in MDA-MB-231 cells treated with 10 μM JQ1. The log2(fold change) were detected using HiMAP-seq or HTS2. d, Schematic diagram illustrating the data composition of CIGS.
Extended Data Fig. 5 Identification of ligustroflavone’s MOA.
a, Overlap among the top 30 compounds based on ZhangScore in two cell lines using the JQ1 signature. b and c, Analysis of Pearson correlation (two-sided) of gene expression profiles between JQ1 and ligustroflavone in HEK293T cells (b) and MDA-MB-231 cells (c). d and e, Heat map illustrating the differential expression of genes in HEK293T cells (d) or MDA-MB-231 cells (e) treated with either ligustroflavone or JQ1. f and g, Molecular dynamics simulation of ligustroflavone binding to the BRD4 protein. RMSF of residues respect to their time-averaged positions during the docking process of ligustroflavone and key target BRD4 (f). Percentage occupancy of different amino acid residues of BRD4 with ligustroflavone (g). h, Western blotting showing the BRD4 CETSA binding assay in the presence or absence of 50 μM ligustroflavone at different temperatures. i, The BRD4 band intensities in the CETSA were quantified. Data represent mean ± SEM (n = 3 biological replicates). j and k, Gene Set Enrichment Analysis (GSEA) of HTS2 results from siBRD4 knockdown in MDA-MB-231 cells, showing the normalized enrichment score (NES). The statistical analysis for GSEA used a one-sided permutation-based enrichment test with adjusted P values (p-adjust) to account for multiple comparisons.
Extended Data Fig. 6 Identification of ferroptosis-resistant cell states perturbed by 2,4-DIH.
a-c, Cell viability of HK-2 cells after treatment with ERA (a), cisplatin (b) and 2,4-DIH (c) for 48 h (n = 3 biological replicates). d-f, HK-2 cells were treated with 2,4-DIH (250 μM) and ERA (panel d: 10 μM, panel e: 30 μM, panel f: 15 μM) for 24 h. Subsequently, the cellular ROS was tested by flow cytometry (d). HK-2 cells were labeled with FerroOrange fluorescent probes to measure intracellular Fe2+ concentrations using flow cytometry (e). Lipid peroxidation in HK-2 cells was detected using flow cytometry (n = 3 biological replicates, one-way ANOVA) (f). g, Representative photomicrographs of transmission electron microscopy in HK-2 cells. HK-2 cells were treated with 2,4-DIH (250 μM) and ERA (20 μM) for 24 h. Blue arrows indicate normal mitochondria. Red arrows indicate abnormal mitochondrial morphology typical of ferroptosis, including shrunken mitochondria, increased density and rupture of membranous structure, and decreased mitochondrial cristae. Yellow arrows indicate mildly abnormal mitochondria. Data shown represent mean ± SD. 2,4-DIH, 2,4-dihydroxybenzaldehyde. ERA, erastin. DCFH-DA, 2,7-dichlorofluorescein diacetate. C11-BODIPY581/591, 4,4-difluoro-5-(4-phenyl-1,3-butadienyl)-4-bora-3a,4a-diaza-s-indacene-3- propionic acid.
Extended Data Fig. 7 Evaluation of 2,4-DIH’s potential to attenuate cisplatin-induced acute kidney injury.
a, Body weight changes of mice in each group during treatment (n = 10 for each group, one-way ANOVA). b, The effects of cisplatin and 2,4-DIH on kidney coefficient. The kidney coefficient was calculated as the ratio of the kidney weight to the total body weight of KM mice (n = 10 per group, one-way ANOVA). c, Quantitative analysis of iron deposition in kidney (n = 6 per group, one-way ANOVA). The treatment dosage of 2,4-DIH is 100 mg/kg, while that of cisplatin is 25 mg/kg. d, Representative IHC staining for Nrf2 expression in kidney tissues (n = 3 for each group). Scale bar, 200 µm (upper panel) and 50 µm (lower panel). e, Quantitative analysis of Nrf2 expression in kidney tissues (n = 3 for each group, two-sided Student’s t-test). All data are denoted as mean ± SD. 2,4-DIH, 2,4-dihydroxybenzaldehyde.
Supplementary information
Source data
Rights and permissions
Springer Nature or its licensor (e.g. a society or other partner) holds exclusive rights to this article under a publishing agreement with the author(s) or other rightsholder(s); author self-archiving of the accepted manuscript version of this article is solely governed by the terms of such publishing agreement and applicable law.
About this article

Cite this article
Xiang, L., Wang, Y., Shao, W. et al. High-throughput profiling of chemical-induced gene expression across 93,644 perturbations. Nat Methods (2025). https://doi.org/10.1038/s41592-025-02781-5
-
Received:
-
Accepted:
-
Published:
-
DOI: https://doi.org/10.1038/s41592-025-02781-5