
Introduction
Early detection is vital for all cancers to prevent metastasis, reduce morbidity and mortality, and improve outcomes1. This is especially true for melanoma, a highly lethal skin cancer that is difficult to detect in concealed areas. Despite therapeutic advancements, melanoma accounts for most skin cancer deaths, though it represents only 3% of cases2. While early-stage melanoma (Stage 0/I) has a 5-year survival rate of ~ 98% with surgery alone, survival drops to 63% in Stage III and 15–20% in Stage IV 3,4. Early detection improves outcomes and reduces the need for invasive systemic treatments, such as targeted therapy and immunotherapy5.
Melanoma screening typically involves dermatologic skin exams, dermoscopy, and biopsies, and, for advanced cases, imaging (ultrasound, MRI, PET)6,7.
While no standardized melanoma screening exists, high-risk individuals (e.g., those with a family history or numerous moles) undergo regular skin checks. Molecular biomarkers, such as LDH for metastatic melanoma prognosis and BRAF mutations for targeted therapy, offer potential for improved detection and treatment8,9. Biomarker testing also helps predict response to immune checkpoint inhibitors (ICIs), which have significantly improved outcomes in advanced melanoma. Recent 10-year follow-ups from the KEYNOTE-006 and CheckMate 067 trials report overall survival rates of 43–44% for patients treated with nivolumab plus ipilimumab or pembrolizumab, underscoring the durable benefit of ICIs10,11. Despite this progress, predicting response remains critical due to variability in efficacy and increased toxicity with combination therapies like ipilimumab and nivolumab12,13. Identifying predictive markers for ICI response remains essential for optimizing treatment strategies.
Aberrant DNA methylation is a hallmark of cancer14, and it plays a key role in melanoma progression and offers promise for diagnosis and treatment15. Several methylation changes have been linked to melanoma, with some distinguishing malignant melanoma from benign lesions. Hypermethylation of tumor suppressor genes (SOCS1/2, RASSF1A, MGMT, and CDKN2A) in melanoma patient serum suggests utility for non-invasive diagnosis16,17. However, their lack of melanoma specificity raises concerns about false positives. A diagnostic algorithm using CLDN11, CDH11, PPP1R3C, MAPL13, and GNMT methylation shows promise in differentiating melanoma from dysplastic nevi18. A CpG island methylator phenotype (CIMP) signature, including WIF1, TFPI2, RASSF1A, and SOCS1, is associated with advanced melanoma19. Promoter hypermethylation frequently downregulates tumor suppressors like PTEN, p16/14, and RASSF1A, while LINE-1 hypomethylation correlates with lower survival in stage III melanoma15. These findings highlight the potential of DNA methylation markers to improve the accuracy of melanoma diagnosis, prognosis, and treatment monitoring.
While these studies demonstrate the potential of DNA methylation for melanoma detection, they primarily relied on tumor tissues or qualitative assays using serum DNA. In contrast, epiMelanoma was developed specifically for plasma-derived cfDNA and applies targeted bisulfite next-generation sequencing (NGS) to enable quantitative, single-molecule methylation analysis. Additionally, by combining pan-cancer detection CpGs with a melanocyte-specific marker (SPTBN1), epiMelanoma not only detects cancer-derived cfDNA but also infers its tissue of origin, addressing a key limitation of previous approaches.
Results
Developing pan-cancer markers: a universal methylation identifier for 36 distinct cancers
We employed a method detailed in our previous study20, to identify CpG sites unmethylated in normal tissues and consistently methylated in tumors. This process involved generating and overlapping lists of CpG sites, hypomethylated across 17 different somatic tissues and unmethylated in blood DNA from a large cohort, resulting in a robust list of methylation-resistant sites across different tissues, individuals, and conditions.
We randomly selected ten samples from each of the following cancer types: BLCA, BRCA, COAD, CESC, ESCA, GBM, HNSC, LGG, LICH, LUAD, LUSC, OVA, PANC, PRAD, and STAD in the TCGA database (for a detailed list of TCGA abbreviations, cancer names, and the number of samples analyzed, refer to Supplementary Table S1), along with ten samples from healthy blood (GSE40279).
We then selected the top 10 CpG sites, methylated at an average of > 10% in each cancer type, and further refined this list to 4 CpG sites using penalized regression. The selected CpG sites and their associated genes are as follows: cg10723962, located in the 1st exon of the Histone Cluster 1, H4 Family Member F (HIST1H4F) gene; cg15759056, located in the 5’ UTR region of the ATP Binding Cassette Subfamily B Member 1 (ABCB1) gene, also known as MDR1 (Multi-Drug Resistance Protein 1); cg24427504, located in the N-Shelf region closest to the Checkpoint With Forkhead And Ring Finger Domain (CHFR) gene; and cg25024074, located in the 1st exon of the Integrin Subunit Alpha 4 (ITGA4) gene. To compute the weighted polygenic score for cancer classification, 169 healthy samples from the GSE40279 cohort were added to balance group sizes. The score was calculated using a multivariable linear regression on methylation beta values for the four CpG sites in the training data (Supplementary Table S2).
We then validated the ‘Pan-cancer’ polygenic biomarker using a total of 5,006 healthy blood samples from the following datasets: GSE30870, GSE40279, GSE61496, GSE123914, GSE157131, and GSE55763 (Supplementary Table S3) and 9,010 cancer samples from 33 different cancer types in TCGA. For the full list of cancers in TCGA, refer to Supplementary Table S1.
To evaluate the Pan-cancer polygenic score, we used ROC analysis to calculate AUC, sensitivity, and specificity associated with the highest likelihood ratio, emphasizing evidence strength and Youden index21, optimizing sensitivity–specificity balance (Supplementary Table S4).
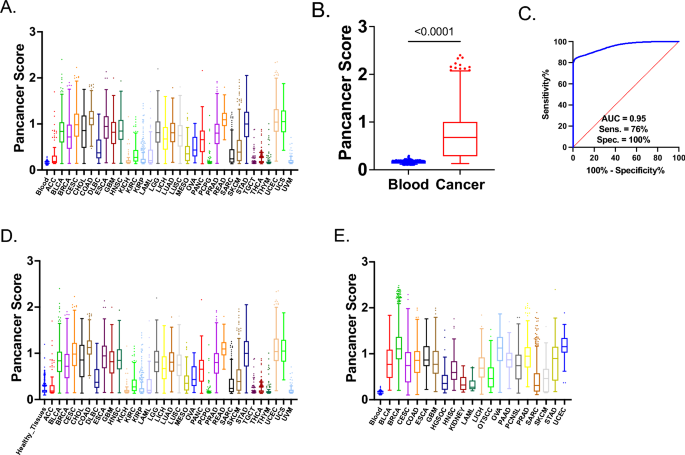
Overall, the Pan-cancer score demonstrated strong performance, with the AUC exceeding 0.9 for more than 75% of the cancer types (Fig. 1A). Specifically, the AUC for detecting melanoma was 0.937, supporting our approach for detecting robust markers for melanoma. Using the highest likelihood ratio, specificity remained consistently high at 99.98% across all cancers. While more than half demonstrated exceptional sensitivity above 90%, we note that these reflect classification performance on tumor tissue samples rather than cfDNA. Using the highest Youden index, 23 out of 33 cancer types showed sensitivity greater than 90%, and 26 out of 33 demonstrated specificity above 90% (Supplementary Table S4).

Performance of the Pan-Cancer Methylation Score Across Blood, Tissues, and Tumor Samples. A Pan-cancer Score (Axe Y) profile in 5,006 healthy blood samples (GSE30870, GSE40279, GSE61496, GSE123914, GSE157131, and GSE55763) and 9,010 cancer samples from 33 different cancer types (ACC, BLCA, BRCA, CESC, CHOL, COAD, DLBC, ESCA, GBM, HNSC, KICH, KIRC, KIRP, LAML, LGG, LIHC, LUAD, LUSC, MESO, OVA, PAAD, PCPG, PRAD, READ, SARC, SKCM, STAD, TGCT, THCA, THYM, UCEC, UCS, UVM) (Table S1, S2). B Comparison of Pan-cancer Score between 5,006 healthy blood samples and 9,010 cancer samples from TCGA. Non-parametric Mann–Whitney U tests were conducted due to the non-normal distribution of the data. Significance level is indicated as p < 0.0001. C ROC analysis of 5,006 healthy blood samples and 9,010 cancer samples from TCGA. Sensitivity and specificity values were selected based on the highest likelihood ratio. The AUC value is shown in the figure. D Pan-cancer Score (Y-axis) profile in 1,695 healthy tissues from NCBI GEO (Table S2), including brain, fallopian tube, breast, cervical mucosa, cervix, colon, endometrium, esophagus, liver, melanocytes, nasopharynx, ovaries, and stomach, as well as 9,010 cancer samples from 33 different cancer types in TCGA. E Pan-cancer Score (Y-axis) profile of 5,006 healthy blood samples and 5,348 cancer samples from NCBI GEO (Table S2), including bladder urothelial carcinoma (BLCA), breast invasive carcinoma (BRCA), cervical squamous cell carcinoma and endocervical adenocarcinoma (CESC), colon adenocarcinoma (COAD), esophageal carcinoma (ESCA), glioblastoma multiforme (GBM), high-grade serous ovarian carcinoma (HGSOC), head and neck squamous cell carcinoma (HNSC), kidney cancers (KIDNEY), acute myeloid leukemia (LAML), liver hepatocellular carcinoma (LIHC), oral tongue squamous cell carcinoma (OTSCC), ovarian serous cystadenocarcinoma (OVA), pancreatic adenocarcinoma (PAAD), primary central nervous system lymphoma (PCNSL), prostate adenocarcinoma (PRAD), sarcoma (SARC), skin cutaneous melanoma (SKCM), stomach adenocarcinoma (STAD), and uterine corpus endometrial carcinoma (UCEC).
The combined “Overall Cancer” analysis (Supplementary Table S4, Fig. 1B) showed an AUC of 0.9549 (Fig. 1C), with a sensitivity of 83.4% and specificity of 98.22% (Youden index). Sensitivity was 75.89%, and specificity was 99.98% using the highest likelihood ratio. These findings highlight the robustness of the Pan-cancer polygenic score as a comprehensive tool for distinguishing cancerous from non-cancerous samples across various cancer types.
As discussed, Pan-cancer markers were selected to remain unmethylated in healthy tissues and blood. To validate their effectiveness in detecting cancerous cfDNA, we evaluated their performance across additional tissue types, including the brain, reproductive organs (fallopian tube, cervix), gastrointestinal organs (colon, esophagus, liver, stomach), and others such as breast, endometrium, melanocytes, nasopharynx, and ovaries. The Pan-cancer score, when comparing 1695 healthy tissues to various cancer types, showed strong discriminatory power, with AUC > 0.9 for cancers like COAD, CESC, ESCA, GBM, LUAD, and STAD. Specificity remained consistently high, nearing 99.94% with the highest likelihood ratio (Supplementary Table S5, Fig. 1D).
Next, we evaluated the performance of our Pan-cancer score with ROC by comparing the same blood cohort from 5006 individuals with our Pan-cancer score using various cancer types from the NCBI GEO repository, including BLCA, BRCA, CESC, COAD, ESCA, GBM, HGSOC, HNSC, KIDNEY, LAML, LIHC, OTSCC, OVA, PAAD, PCNSL, PRAD, SARC, SKCM, STAD, and UCEC (Fig. 1E, Supplementary Table S6). We divided the validation process into two datasets, one from TCGA, analyzed above, and the other from NCBI GEO repositories. This approach minimized platform-specific biases, ensuring robust, reproducible results across diverse datasets and technologies.
Overall, the Pan-cancer score demonstrated excellent performance across various cancer types. Notably, BRCA, ESCA, PAAD, PRAD, and UCEC achieved an AUC of 1.000. Melanoma also showed strong performance, with a sensitivity of 91.89% and a specificity of 81.8%. Sensitivity and specificity were high across various cancers, particularly for BRCA, PAAD, and PRAD (Supplementary Table S6, Fig. 1E).
Therefore, the Pan-cancer score can correctly classify 36 distinct cancer types, covering both common and rare malignancies with high accuracy.
Development of melanoma-specific methylation markers
While the pan-cancer marker effectively identifies the presence of tumor-derived cfDNA, it does not provide information about the tissue of origin. To address this, we aimed to identify CpG sites methylated in Skin Cutaneous Melanoma (SKCM) but not in other tumors. We randomly selected ten samples from 32 TCGA cancer types (Supplementary Table S1) and ten samples from healthy blood (GSE40279). We used the following criteria: the CpG site had to have a beta value > 0.10 in SKCM samples and remain hypomethylated (beta < 0.10) in all other cancer types and blood. Clinical characteristics of these ten, along with the remaining SKCM samples used in marker validation, are provided in Supplementary Table S7. Among 305 CpG sites that met these criteria, we ranked candidates by tissue specificity. Notably, five of the top candidates, including cg04652957, cg12593303, cg07850967, cg12677436, and cg25954914, mapped to the same gene locus (SPTBN1). The top-performing site, cg04652957, showed the highest AUC, sensitivity, and specificity (Fig. 2A, 2B) and was selected for downstream assay development, and the closely ranked cg12593303 has been incorporated in future assay iterations. As cg12593303 is located just 69 nucleotides away and showed similar performance, it was also covered by the same amplicon in the targeted next-generation sequencing assay. ROC analysis between the 10 SKCM samples and other cancers and blood revealed an AUC of 0.98, with a specificity of 90% and a sensitivity of 95%, corresponding to a maximum likelihood ratio (Fig. 2B).

Specificity and Performance of the SPTBN1 Marker for Melanoma Classification. A Box-and-whisker plot using Tukey’s method, comparing cg04652957 (SPTBN1) methylation levels between 10 SKCM samples and a combined set of 10 samples from each TCGA cancer type plus ten blood samples. The middle line in each box represents the median methylation level. A parametric t-test was used to assess the differences between the groups due to the normal distribution of the data. The significance level (p < 0.0001) is shown on the plot. B ROC analysis of 10 SKCM samples and a combined set of 10 samples from each TCGA cancer type, plus ten blood samples. Sensitivity and specificity values were selected based on the highest likelihood ratio. The AUC value is shown in the figure. C DNA methylation profile of cg04652957 (SPTBN1) across 473 SKCM samples from TCGA, 5006 healthy blood samples, and 8536 tumor samples representing 32 other TCGA cancer types. D DNA methylation profile of cg04652957 (SPTBN1) in normal melanocytes and 31 other healthy tissues. The dataset includes eight healthy melanocyte samples from the GSE122909 cohort and 5323 samples from the EWAS Atlas. The number of samples for each tissue type is as follows (number of samples in parentheses): whole blood (300), brain (300), adipose tissue (300), colon (238), skeletal muscle (211), fallopian tube (182), pancreas (75), stomach (145), prostate (153), thyroid (152), esophagus (125), placenta (300), visceral adipose tissue (142), skin (117), the nasal epithelium (99), testis (87), bone marrow (65), cartilage (59), bone (53), adrenal gland (26), tongue (25), cord blood (286), bladder (26), nasopharynx (25), spleen (15), saliva (300), liver (300), breast (261), lung (298), kidney (299), sperm (300), and normal melanocytes (8). E Comparison of methylation levels across 8 normal melanocyte samples (GSE122909), 195 melanoma samples (GSE144487), and healthy skin samples from GSE51954, GSE90124, GSE115797, and GSE142439. Ordinary ANOVA was used to compare the groups, followed by Tukey’s multiple comparison test to assess differences between each pair of groups. P-values between group pairs are shown on the plot.
The SPTBN1 gene, encoding β-spectrin II, plays a critical role in various cellular functions, particularly in maintaining cytoskeletal integrity and regulating cell signaling pathways. This gene is integral to the organization of the cytoskeleton, which is essential for cellular shape, motility, and adhesion. It is also involved in actin crosslinking, which is crucial for cellular architecture and function22,23,24. We validated cg04652957 in a dataset of 14,015 samples, which included 8,536 cancer samples from TCGA, 5,006 blood samples, and 473 SKCM samples (Fig. 2C). We performed ROC analysis on cg04652957 in TCGA (Supplementary Table S8), achieving > 90% sensitivity in 30/33 cancers and > 90% specificity in 29/33, all at the highest Youden’s index. Interestingly, the marker showed the least discrimination with brain tumors (glioblastoma multiforme and brain lower-grade glioma). This is likely because melanocytes and gliomas are the only tissue types in the TCGA that share a related neuroectodermal origin, distinguishing them from other cancer types in the dataset25.
Specificity of the SPTBN1 marker for melanocytes associated with melanoma
We next determined whether SPTBN1 is uniquely methylated compared to other tissues. We examined epigenome-wide datasets curated from the EWAS Atlas26, examining 5323 samples from 31 different tissues. Additionally, we incorporated DNA methylation Illumina 450K data from 8 normal melanocyte samples from the GSE122909 cohort (Fig. 2C). Importantly, the average methylation across all healthy samples was approximately 0.03, with a median of 0.026, whereas normal melanocytes exhibited an average and median methylation level of over 0.5. Out of 5323 samples from 31 different tissues, only 45 exhibited methylation levels exceeding 0.1, representing less than 1% of all samples. ROC analysis comparing normal melanocytes to healthy tissues further confirmed the discriminatory power of the SPTBN1 marker, revealing an AUC of 0.944, with the highest ratio likelihood and highest Youden’s Index sensitivity of 99.94% and specificity of 87.5%. The analysis indicated that most tissues showed significant differences in methylation compared to normal melanocytes.
We then compared eight normal melanocytes from the GSE122909 cohort to 195 melanoma samples from the GSE144487 dataset, as well as healthy normal skin samples from GSE51954, GSE90124, GSE115797, and GSE142439. Ordinary ANOVA was used to compare the groups (Fig. 2E), and Tukey’s multiple comparison test was applied to compare each group to another. There was a statistically significant difference in methylation between normal melanocytes and tumor samples (adjusted p-value of 0.0220). However, the difference between both normal melanocytes and skin, as well as between tumor samples and skin, was not only highly significant (adjusted p-values < 0.0001) but also substantially larger in magnitude, as shown in Fig. 2E. The results show that cg04652957 is specifically methylated in normal and cancerous melanocytes but not in other tissues, including skin or uveal melanocytes. Specifically, the average methylation in normal melanocytes is 0.52, with a median of 0.55; in cancerous melanocytes, the average is 0.40, and the median is 0.42. In contrast, skin samples show an average methylation of 0.064 and a median of 0.06 (Fig. 2D). Thus, the Pan-cancer set of 4 CpGs detects cancer DNA, while the melanoma-specific CpG, cg04652957, identifies melanocytes as the tissue of origin.
We developed a model to classify melanoma based on the DNA methylation levels of the 5 CG IDs using published EWAS data26. We used 124 non-cancerous skin or lymph node samples as controls and 327 melanoma samples from various tissues, including skin, lymph nodes, and soft tissues (Supplementary Table S9). We applied a linear regression model in which control samples were labelled as zero and cancerous samples as one, and calculated the weight for each CpG site, including cg04652957 (SPTBN1). This constitutes our Melanoma detection Model (Fig. 3A, B). Separately, we created a Melanoma Confirmation Model to confirm that the cancer is indeed melanoma by performing linear regression with the same dataset but using only melanocyte-specific CpG, cg04652957 (SPTBN1) (Fig. 3C, D).


Analytical Performance and Tumor Tissue Validation of Methylation-Based Models for Melanoma Detection. A Box and whisker Tukey plot comparing the Pan-Cancer with Melanoma Specificity score between control and melanoma samples. The boxes represent the interquartile range (IQR), with whiskers extending to 1.5 times the IQR. Outliers beyond this range are indicated as individual points. For both panels, we used 124 skin or lymph node samples from the EWAS dataset with no known diagnosis of cancer and 327 melanoma samples sourced from connective, subcutaneous, and other soft tissues, lymph nodes, or skin, also from the EWAS dataset. P-values between group pairs are shown on the plot. B ROC curve evaluating the performance of the Pan-Cancer with Melanoma Specificity Model in distinguishing control from melanoma samples. Sensitivity and specificity values were selected based on the highest likelihood ratio. The AUC value is shown in the figure. C Box and whisker Tukey plot comparing methylation levels between the same 124 control samples and 327 melanoma samples using the Melanoma Specific Model. The boxes represent the interquartile range (IQR), with whiskers extending to 1.5 times the IQR. Outliers beyond this range are indicated as individual points. Statistical significance between the groups is denoted by a p-value on the plot. D ROC curve evaluating the performance of the Melanoma Specific Model in distinguishing control from melanoma samples, with the remaining details the same as in the Pan-Cancer analysis. Sensitivity and specificity values were selected based on the highest likelihood ratio. The AUC value is shown in the figure. E and F The heatmaps represent the methylation levels of 35 individual CpG sites (F) and average methylation levels per gene (F) across cancer biopsy samples. Each row corresponds to a unique CpG site (E) or the average methylation level of all CpG sites within a gene (F), while each column represents a cancer biopsy sample. The samples include cancers from stages I–IV. The color intensity indicates the methylation status, with darker shades signifying higher methylation levels and cooler shades representing lower. This visual comparison allows for an in-depth assessment of methylation patterns both at the CpG site level and the gene level.
epiMelanoma: a targeted next-generation bisulfite sequencing (NGBS) assay for melanoma classification and validation in biopsy sample
We subsequently developed a bisulfite sequencing assay that involved two rounds of amplification followed by multiplexed next-generation sequencing and bioinformatics analysis of the methylation states across all sequenced amplicons. Initially, we evaluated the methylation profiles in 35 melanoma cancer biopsy samples (we did not have data from healthy normal melanocyte biopsies) (Supplementary Table S10, Fig. 3E, F). These samples were collected at various stages of cancer progression, ranging from stage I to IV: I (n = 3), II (n = 2), III (n = 12), and IV (n = 18). The methylation levels of each CpG site in all 35 samples are shown in the heatmap in Fig. 3E, and the average methylation levels per gene are presented in Fig. 3F.
Based on our approach of selecting markers that are methylated in cancer but not in healthy tissue, we set arbitrary thresholds of > 10%, > 15%, and > 20% methylation to indicate potential cancer tissue. Subsequently, we estimated the percentage of CpG sites with more than 10%, 15%, or 20% methylation for each sample. We found that 34 out of 35 samples had at least one CpG site methylated above either 10% or 15%, and 29 out of 35 samples had at least one CpG site methylated above 20%. Importantly, in the SPTBN1 gene, which is associated with melanoma, 32 out of 35 samples had all CpG sites methylated above either 10% or 15%, and 26 out of 35 samples had all CpG sites methylated above 20%. This finding supports the conclusion that not only the identified CpG sites in the array but also the surrounding CpGs are methylated in melanoma. Our study confirmed the presence of fully methylated regions in tumors, suggesting that if DNA from these tumors leaks into the bloodstream and appears as cfDNA, it is also likely to be methylated.
Comparative analysis of methylation levels between biopsy and cfDNA
We analyzed median methylation across all CpG sites in five genes from 22 melanoma patients with both biopsy and plasma-derived cfDNA. Biopsy methylation levels were significantly higher than cfDNA, suggesting that only a fraction of plasma cfDNA originates from tumors. Except for ITGA4, all genes showed significant differences in methylation levels between biopsy samples and cfDNA, with biopsy samples generally exhibiting higher methylation levels (Fig. 4A–E). To explore this further, we investigated whether methylation levels in biopsies and cfDNA were directly linked. We also tested whether methylation levels in biopsy and matched cfDNA samples were correlated across individual genes. Spearman correlation analysis did not identify any statistically significant associations (all p > 0.05), indicating that biopsy methylation levels did not predict cfDNA methylation within individual patients.

Comparative analysis of median methylation levels in biopsies and cfDNA across five genes. Panels A–E show paired methylation levels for each individual (n = 22) for genes ABCB1 (A), CHFR (B), HIST1H4F (C), ITGA4 (D), and SPTBN1 (E). Each line connects an individual’s biopsy and cfDNA methylation values. A one-tailed non-parametric Wilcoxon signed-rank test was used to assess whether cfDNA methylation levels were significantly lower than those in biopsies, based on the biological expectation of tumor-derived cfDNA being diluted in plasma. P-values are indicated above each comparison.
Detection of circulating tumor DNA in plasma from melanoma patients with the epiMelanoma biomarker
Using a logistic regression–based classifier trained on 57 melanoma and control samples (See Methods), we generated a combined methylation probability score across five target regions: ABCB1, CHFR, HIST1H4F, ITGA4, and SPTBN1. Classifier performance was evaluated in both the training and independent validation cohorts using two detection thresholds: the 95th and 99th percentiles of scores from healthy controls.
In the training dataset, sensitivity for stage III and stage IV melanoma was 47.37% and 45.83%, respectively, at the 95th percentile threshold. These values declined to 36.84% and 34.78%, respectively, at the 99th percentile threshold.
We validated the model on an independent cohort of 54 healthy individuals, 15 early-stage (Stage I-II), and 15 late-stage (Stage III-IV) melanoma patients, as well as 31 ICI-treated melanoma stages III and IV melanoma patients showing partial or complete response (Supplementary Table S11). We hypothesized that analyzing the methylation profiles of this treatment-responsive melanoma cohort could provide valuable insights into DNA methylation association with positive ICI treatment response.
Sensitivity for early-stage melanoma was 26.67% (4/15) at the 95th percentile and 13.33% (2/15) at the 99th percentile. For late-stage melanoma, sensitivity was 60.00% (9/15) at the 95th percentile and 53.33% (8/15) at the 99th percentile. Among patients who had previously responded to ICIs, sensitivity remained unchanged at 25.81% under both thresholds (Supplementary Table S11).
To further explore model simplification, we performed model selection using Akaike Information Criterion (AIC) and Bayesian Information Criterion (BIC) scores. We tested all CpGs associated with genes ABCB1, CHFR, HIST1H4F, ITGA4, and SPTBN1 in logistic regression models. The best reduced model included HIST1H4F, ITGA4, and SPTBN1, selected based on the lowest AIC/BIC (Supplementary Table S12). This model was then validated on the independent cohort. At the 95th percentile threshold, sensitivity for late-stage melanoma was 53.33%, with 26.67% sensitivity for early-stage and 22.58% for ICI-responsive cases. Specificity among healthy controls was 98.15%. At the 99th percentile threshold, late-stage sensitivity remained 53.33%, with early-stage at 13.33% and ICI-responsive at 22.58%, while specificity was 100% (Supplementary Table S11).
Comparative analysis of methylation levels with patient response to treatment and survival outcomes
The relationship between the clinical information of our patients and their associated epiMelanoma signature was explored. To provide a representative evaluation of treatment response and overall survival and their correlation to calculated methylation scores, we excluded patients whose sample was collected following initiation of ICI therapy, as well as those who died from causes unrelated to melanoma in the study. We investigated the correlation between our epiMelanoma signature and patient response to ICIs (Fig. 5A). For this cohort of patients, most received combination ICI therapy, very few were treated with ICI monotherapy (i.e., nivolumab or ipilimumab alone). The list of 67 patients and their treatment regimen is provided in Supplementary Table S13. The mean M-score of the three treatment response groups, complete (n = 38), partial (n = 10), and non-responders (n = 19), was assessed. A significant statistical difference (p = 0.012) was found between the mean M-scores of complete responders and non-responders. No significant difference was observed between the partial responder group and the other two groups. The observed negative correlation between higher M-scores and lack of response to treatment suggests that epiMelanoma may have potential value as a predictive biomarker for ICI response, although further validation is needed.

Methylation Score Analysis and Its Association with ICI Treatment Response and Survival. A Comparison of the mean M-score (Y-axis) across the five genes: ABCB1, CHFR, HIST1H4F, ITGA4, and SPTBN1 in the baseline plasma-extracted cfDNA of patients (n = 67) prior to their treatment with ICIs. An ordinary one-way ANOVA was used to evaluate the differences between the three treatment response groups (X-axis): complete responders (n = 38), partial responders (PR) (n = 10), and non-responders (NR) (n = 19). Tukey’s multiple comparison test was applied post hoc to compare the mean of each group with the mean of every other group. Plotted are the mean ± SEM of the M-score values of each response group. The corresponding p-values are presented as numeric values. B Spearman’s rank correlation test was conducted to measure the relationship between the M-score of the baseline plasma-extracted cfDNA of patients (n = 67) prior to their treatment with ICIs and their overall survival (OS) (months). A Spearman’s correlation coefficient of r = − 0.3282, with a p-value of 0.0067, was obtained. C The determined M-score categories (Low/High) were plotted against the overall survival (OS) (months) of patients (n = 67) treated with ICIs. Patients who were still alive at the study endpoint are censored—depicted by tick marks on their respective lines. Outliers removed include those who died from other unrelated causes (n = 5) and samples collected following ICI treatment start date (n = 14). Statistical significance was determined using the Log-rank (Mantel-Cox) test, and a p-value of 0.001 was obtained. A number of patients at risk table below the Kaplan–Meier includes censored patients who are still alive but have reached the end of our observation period.
Furthermore, the relationship between the methylation values of our five-gene signature in cfDNA and the overall survival of patients treated with ICIs was explored. We first conducted a Spearman’s rank correlation test to measure the correlation between the two variables. We obtained a significant correlation between the M-score values and overall survival (Fig. 5B). Given this strong correlation, we identified the optimal threshold using the highest Youden’s index (0.360) in our dataset, specifically at an M-score of 3.2421. This categorized our treated patient population into low and high M-score groups. Figure 5C portrays the Kaplan–Meier plot of the two M-score groups against their overall survival in months. We performed a Log-rank (Mantel-Cox) analysis, and a statistically significant difference was obtained between the patient groups (p = 0.001). At 12 months, the low M-score cohort has a survival rate of 88%, whereas the high M-score group has a survival rate of 61%. For the high M-score group, the median overall survival was reached at 33.8 months; however, in the low M-score group, it has not been reached, with the majority of patients still alive by the observation endpoint.
Discussion
We developed DNA methylation biomarkers to detect melanoma in plasma cfDNA using a two-tiered approach. First, we identified four highly methylated CpG sites associated with ABCB1, CHFR, HIST1H4F, and ITGA4 genes across cancers while unmethylated in normal tissues, allowing the classification of 33 cancer types (SKCM was not included in the initial pan-cancer discovery set, as the classifier was originally developed for general tumor detection, and melanoma was analyzed separately during the validation phase). However, detecting cancer DNA per se is insufficient without determining its tissue of origin. To address this, we selected the CpG site linked to the SPTBN1 gene methylated in melanocytes but not in other tissues or cancers, ensuring the detected cancer originates from melanoma. This modular framework enables adaptation to other cancer types by substituting the tissue-specific CpG while retaining the universal pan-cancer detection core.
While our current assay uses a melanocyte-specific CpG to establish tissue of origin, it does not distinguish between benign and malignant melanocytic DNA. Previous studies have identified methylation changes associated specifically with melanoma progression and malignancy19,27,28, which may be valuable for enhancing diagnostic specificity in future versions of the assay.
In-silico validation demonstrated strong performance of these markers, with AUC values exceeding 0.9 for most cancers. The melanoma-specific SPTBN1 marker effectively differentiates melanoma from other cancers, including uveal melanoma, highlighting its diagnostic utility. Next, we developed the epiMelanoma assay using targeted methylation next-generation sequencing to assess the methylation status of these CpG sites. The epiMelanoma assay successfully classified melanoma biopsies, with 16 of 17 samples showing highly methylated DNA spanning entire amplicons.
In plasma cfDNA, sensitivity decreased compared to biopsies but remained detectable at 26.67% for early-stage and 60% for late-stage melanoma. This discrepancy likely stems from the low abundance of melanoma-derived cfDNA in plasma, particularly in early disease. Other studies have faced similar issues with sensitivity. For instance, Lee et al.29 and Tan et al.30 reported ctDNA detection rates of 34% and 37%, respectively, in resected stage III patients, while Lee et al. 31 detected ctDNA in only 28% of high-risk stage III cases. These studies relied on droplet digital PCR (ddPCR) targeting common melanoma mutations such as BRAF and NRAS but were not designed for early-stage detection. Moreover, a large-scale targeted methylation study by Klein et al.32 reported 0% sensitivity in stage I–III melanoma using a multi-cancer panel applied to plasma cfDNA, with detection limited to stage IV (100%, 6/6 cases). While this assay demonstrated high specificity (99.5% overall), its performance underscores the challenge of detecting early-stage melanoma in circulation, as shown in Table 1. In contrast, the epiMelanoma test is based on targeted methylation profiling of melanoma-associated markers. It detects almost 27% of early-stage melanoma plasma samples. Unlike ddPCR, which is constrained to known point mutations, our method captures broader epigenetic changes and may be better suited for early detection when tumor DNA is both scarce and genetically heterogeneous. To further improve the sensitivity of the epiMelanoma assay, particularly in early stages of melanoma, future studies should evaluate the integration of additional clinical or molecular features such as LDH levels, BRAF mutation status, or tumor mutational burden alongside methylation data.
Similar challenges have been observed with cancer-specific mutations in cfDNA33. Consistent with this, our analysis of BRAF V600E mutations in cfDNA did not detect any mutations in patient samples. This suggests that mutation-based approaches may lack sensitivity not only in early stages but at late stages as well. Higher detection rates in late-stage melanoma likely result from increased tumor-derived cfDNA due to greater tumor mass and vascularization rather than changes in methylation patterns.
Vascularization influences ctDNA shedding, with highly perfused organs (e.g., liver, lungs, kidneys) releasing more cfDNA than less vascularized tissues like skin34,35. While melanoma cfDNA detection remains challenging, tumors near blood vessels or highly vascularized skin regions may enhance shedding. Advances in cfDNA detection methods and understanding tumor vascularization could improve diagnostic accuracy.
Our study highlights the importance of applying multiple logistic regression models to capture the unique contributions of each CpG site. By using this method, we could retain the individual effects of each marker, leading to a more accurate and nuanced prediction model.
It is worth noting that plasma samples from patients who responded to ICI therapy displayed, on average, a lower abundance of methylated cancer-derived cfDNA before treatment. This suggests that the epiMelanoma signature, by way of assessing the abundance of cancer-specific methylated DNA, may be associated with response to ICI therapy. While prior work has shown that predictive features may vary by ICI setting36, most patients received combination therapy, thus limiting our ability to perform a stratified analysis by treatment type. Supporting our findings, previous studies measuring the quantity of baseline ctDNA levels in patients with metastatic melanoma, by digital droplet PCR or NGS, have also demonstrated associations with response to immunotherapy, irrespective of treatment type37,38,39.
It is important to note, however, that our epiMelanoma classifier was not trained to distinguish between immunotherapy response types. Therefore, the observed association is likely reflective of underlying differences in disease burden, which may in turn reflect biological differences between tumors that respond to ICIs and those that do not. The causes for these differences are not yet understood, but are nevertheless intriguing and require further examination. Future studies should focus on incorporating CpG sites specifically associated with resistance mechanisms to better identify epigenetic features more directly linked to treatment response outcomes. Given these observations, we suggest that the levels of methylated cancer cfDNA in plasma warrant continued investigation as a potential predictive biomarker for monitoring ICI treatment response.
Additionally, patients with a lower abundance of methylated cancer-derived DNA at baseline, thus M-score, appear to have better treatment outcomes and longer overall survival following treatment with ICIs, as shown in the Kaplan–Meier by the dramatic separation in survival curves between the high and low M-score groups. These findings suggest that the M-score provided by the signature may be associated with patient prognosis. This supports further investigation into epiMelanoma’s potential utility in informing appropriate treatment regimens for patients, furthering the deployment of personalized treatment strategies. Future studies using larger patient cohorts are required to confirm the clinical applicability of our determined cutoff.
Our findings align with other studies indicating that high levels of methylation markers (e.g., CHFR, SOX11) in plasma cfDNA are associated with worse outcomes in cancers like colorectal cancer, further supporting the role of cfDNA methylation as both a diagnostic and prognostic tool40. Further research is needed to explore the functional roles of these CpG sites and their relevance to ICI response. The correlation between the epiMelanoma ‘M-score’ and patient clinical outcomes presents the potential for clinical application in the management of patients with advanced and metastatic melanoma. As a pre-treatment assessment, it identifies patients who will respond to ICI therapy and can classify these patients by survival outcomes, selecting poor responders upfront. For non-responders, this will allow the use of alternate treatment options earlier and avoid their exposure to potentially unnecessary toxicities associated with ICIs.
In addition to the benefits to non-ICI responders, this has significant implications for reducing the burdens on the healthcare system, in terms of both the costs associated with the administration of the treatment and potential serious adverse events brought on by ICIs. Given that epiMelanoma may be able to determine which patients will respond to ICI therapy, its usefulness might also extend to patients with stage II and III melanoma by identifying those that will benefit from adjuvant ICI therapy following surgery and, by extension, which patients will recur. However, this application has its limitations, notably the reduction in disease burden may lead to lower levels of detectable melanoma cfDNA, and the reduced sensitivity of our assay in lower stages could limit its utility in this setting. It should be emphasized that our ICI response analysis was based only on a small cohort of 67 patients with no external validation. Thus, further longitudinal studies with larger patient cohorts are required for additional validation of epiMelanoma as a prognostic and predictive biomarker for response to immunotherapy. This could have a direct impact on melanoma-associated mortality.
Materials and methods
Study populations
The study design was approved and conducted in accordance with the ethical guidelines set by the McGill University Health Center Research Institute (MUHC-RI) Ethics Board, under the approved local REB number (#2021-7036). All experiments were performed in accordance with the relevant guidelines and regulations. Informed written consent was obtained from all participants (n = 199). All ethical regulations and confidentiality guidelines relevant to human research participants were strictly followed. Peripheral blood samples were obtained from melanoma patients (n = 109) at the oncology clinic of the MUHC, with varying stages of disease. Subjects’ ages ranged from 27 to 92 (mean 67.4, SD 13.4), and the sex ratio was 74 males:35 females, reflective of the sex bias seen for melanoma. Melanoma tumor biopsies (n = 17) and formalin-fixed paraffin-embedded melanoma tissue biopsy samples were collected from patients (n = 18) with varying stages of disease from the MUHC, aged from 29 to 89 (mean 65.3, SD 15.0), with 21 males and 14 females. Peripheral blood samples and tumor biopsies were eligible for inclusion in the study if the patients had a confirmed melanoma diagnosis by histology. Additionally, samples were obtained from healthy donors (n = 28), who were eligible if they had no history of cancer and a visibly healthy Eastern Cooperative Oncology Group (ECOG) performance status score between 0–1 (https://ecog-acrin.org/resources/ecog-performance-status/). An additional 50 healthy plasma samples were obtained from Innovative™ Research, Novi, MI. Control subjects’ ages varied from 19 to 84 (mean 45.1, SD 14.6), with 44 males and 34 females. Demographic data for all study participants are summarized in Supplementary Table S14, classified by those who had plasma samples collected and those who had tissue biopsies. There was no attrition; all enrolled participants’ samples were used in the study.
Preparation of cfDNA plasma
Whole blood was prospectively collected from study participants using 10-ml BD K2-EDTA tubes (cat. #366,634, Mississauga, ON) and processed within 1h. Samples were centrifuged at 1300 g for 10 min at room temperature. Plasma was collected from the liquid phase above the cellular components of the separated blood. The collected plasma was aliquoted into tubes and stored at -80ºC until cfDNA extraction.
Cell-free DNA (cfDNA) was extracted using a previously described guanidine isothiocyanate method involving binding to silica magnetic beads, followed by 80% ethanol washes and elution in water41. This method is part of a proprietary cfDNA extraction protocol developed by the company, and while the general approach is provided, the exact procedural details remain undisclosed due to confidentiality agreements.
Biopsy DNA collection
Fresh melanoma tumor samples (n = 17) were acquired fresh from the MUHC pathology department and then flash-frozen at − 80 °C within 30 min of collection. DNA was extracted using the Qiagen DNeasy® Blood & Tissue Kit (cat. #69,504, Toronto, ON) and eluted in Tris–EDTA buffer. Additional formalin-fixed paraffin-embedded melanoma tissue biopsy samples (n = 18) were acquired from the MUHC pathology department. DNA was extracted using the QiAamp® DNA FFPE advanced kit (cat. #56,604) and eluted in ATE buffer. DNA concentration and purity of the samples were measured using the BioDrop spectrophotometer (Montreal Biotech Inc., QC, CA), and samples were stored at − 20 °C until further downstream processing.
Data collection
We conducted a comprehensive retrospective review of electronic medical records (EMR) of all study participants. The following data were collected from the EMR: demographics, diagnosis, staging, treatment timelines, and response to therapy based on clinical and medical imaging evaluations. Data was extracted independently by two investigators using a standardized form. In case of disagreement between reviewers, the assistance of a third investigator was sought for resolution.
Objective response to ICI therapy was evaluated using RECIST (version 1.1) and/or PERCIST (version 1.0) criteria depending on the imaging modality used for a given patient42,43. A patient was considered to have a complete response (CR) after the disappearance of all target lesion(s) and/or by resolution of hypermetabolic activity in the case of FDG-PET/CT. Partial response (PR) was defined as a reduction of at least 30% in tumor size(s) and/or metabolic activity without full resolution. Non-responders (NR) included patients with progressive disease (PD) who had at least a 20% or 5mm increase in the sum of diameters of target lesion(s) and the appearance of new lesions and/or an increase of more than 30% in metabolic activity for FDG-PET/CT. Patients with stable disease have neither a sufficient decrease in tumor size to qualify for PR nor a sufficient increase to qualify for NR. Overall survival (OS) is defined as the time interval between the start of treatment for those with metastatic or unresectable disease until the end of the observation period or death of the patient.
Bisulfite conversion, library preparation and methylation analysis
Bisulfite conversion was performed using the EZ-96 DNA Methylation MagPrep kit (D5041, Zymo Research). This was followed by two rounds of polymerase chain reaction (PCR). The first round utilized primers containing an anchoring sequence and sequences targeting 100 to 200 bp regions of five genes: cg10723962 (HIST1H4F), cg25024074 (ITGA4), cg24427504 (CHFR), cg15759056 (ABCB1), and cg04652957 (SPTBN1). This process was conducted using a Bio-Rad C1000 Touch Thermal Cycler (Bio-Rad Laboratories, CA, USA). Primer sequences are available upon request and will be provided for research purposes only upon signing a Material Transfer Agreement (MTA).
Indexing and library preparation
Five microliters of the first PCR reaction were subjected to a second round of PCR amplification with primers containing indexes for sample barcoding (primer sequences are available upon reasonable request). The second PCR was carried out in a total volume of 25 µL using a high-fidelity polymerase. The thermocycling conditions were as follows: initial denaturation at 98 °C for 30 s, followed by 12 cycles of 98 °C for 10 s, 60 °C for 30 s, and 72 °C for 30 s, with a final extension at 72 °C for 5 min. The resulting PCR products were pooled, and the pooled library was purified twice using AMPure XP Beads (Beckman Coulter Life Sciences, CA, USA) at a 1.0 × bead-to-sample ratio.
Quantification of the purified library was performed using RealTime PCR with the NEBNext® Library Quant Kit for Illumina (New England Biolabs, MA, USA).
Sequencing and data processing
Barcoded libraries from all samples were sequenced on the Illumina MiSeq platform using the MiSeq Reagent Nano Kit V2 with a 250 × 2 paired-end sequencing protocol (Illumina, CA, USA). For our targeted bisulfite sequencing experiments, we used Trim-galore (parameters: trim_galore –illumina –paired –fastqc) (https://zenodo.org/record/5127899#.Y7RxfOzMJqs) to trim sequencing adapters and remove low-quality data from the raw paired-end reads, obtaining clean data for subsequent analysis.
Alignment and methylation analysis
The clean data were aligned to five reference genomes: cg10723962 (HIST1H4F), cg25024074 (ITGA4), cg24427504 (CHFR), cg15759056 (ABCB1), and cg04652957 (SPTBN1) using Bismark (https://www.ncbi.nlm.nih.gov/pmc/articles/PMC3102221/). Methylation levels at each CpG site were calculated using Bismark’s methylation extractor (bismark_methylation_extractor –p –bedGraph –counts –scaffolds –no_overlap), which extracts methylation information from the aligned reads.
Classifier development and threshold determination
We applied the epiMelanoma targeted next-generation bisulfite sequencing assay on a training set of plasma-extracted DNA from n = 58 melanoma patients and unaffected controls and trained a classifier of melanoma using the methylation data for all CG in the five amplified regions. First, we determined the correlation of each CpG position at the five targeted regions ABCB1, CHFR, HIST1H4F, ITGA4, and SPTBN1 with cancer. Each CG correlated differently with melanoma cancer status (Supplementary Table S15). Hereafter, we evaluated the performance of individual CpG sites based on either the highest likelihood ratio, which provides an optimal balance between sensitivity and specificity, or the highest Youden index, which maximizes the sum of sensitivity and specificity. The AUC, specificity, and sensitivity computed for the different CGs exhibited a wide range (Supplementary Table S15). We applied multivariable logistic regression models using either (i) all CpG sites from the five targeted regions in ABCB1, CHFR, HIST1H4F, ITGA4, and SPTBN1, or (ii) a simplified model including only CpG sites from HIST1H4F and SPTBN1, to compute weighted scores for each CpG site and generate combined predictions for each sample in the training cohort (see Supplementary Table S16). The odds of melanoma were calculated from the log odds; the Combined Predictor was computed by the logistic regression equation. The odds were computed using the exponential function of the log odds:
The probability of a sample being melanoma was derived from the odds using the following formula:
$$Probability = frac{Odds}{{1 + Odds}}$$
We set the melanoma detection threshold at either the 95th or 99th percentile of probabilities from healthy individuals in the training cohort. The threshold was determined by calculating the probabilities for all healthy individuals in the training cohort, derived from the Combined Predictor described above. Samples exceeding this threshold were classified as melanoma positive.
Logistic regression model generation
To generate the coefficients for the logistic regression models, methylation data from all CpG sites in the five targeted regions (ABCB1, CHFR, HIST1H4F, ITGA4, and SPTBN1) were used as input features for the Pan-Cancer with Melanoma Specificity Model. For the Melanoma Confirmation Model only CpG sites corresponding to SPTBN1 gene were used. A logistic regression classifier was trained using the LogisticRegression function from the scikit-learn Python library (version 1.3.2), where the goal was to distinguish melanoma samples from controls. After training the model on the methylation dataset, we extracted the weight (coefficient) assigned to each CpG site, along with the model intercept. A log odds score for each sample, was calculated by multiplying the methylation level (beta value) of each CpG by its corresponding weight, then summing all values with the intercept. The full list of coefficients used in the model is provided in Supplementary Table S16. The Python script used to generate the model is available at: https://doi.org/10.5281/zenodo.15554328. We also performed model selection using Akaike Information Criterion (AIC) and Bayesian Information Criterion (BIC) scores. Median methylation values for ABCB1, CHFR, HIST1H4F, ITGA4, and SPTBN1 were computed per sample, and all feature combinations were tested in logistic regression. The best-performing reduced model was selected based on the lowest AIC/BIC scores. The AIC/BIC model selection script is available at: https://doi.org/10.5281/zenodo.15885408.
M-score calculation
The M-score was used to evaluate the relationship between cfDNA methylation levels, treatment response to ICIs, and overall survival. It was calculated by first determining the median methylation level for each of the five target genes (ABCB1, CHFR, HIST1H4F, ITGA4, and SPTBN1) based on CpG-level data. The sum of these five medians was multiplied by 100, and the M-score was then calculated using the base-2 logarithm of this value:
$$M – score = log2left(sum Median left( {gene} right) times 100right)$$
The M-score was compared across response groups (complete responders, partial responders, non-responders), and used to assess differences in overall survival.