
Introduction
The ribosome is an intricate macromolecular complex that synthesizes proteins in the cell and is essential for viability, growth, and proliferation. Ribosomes are assembled using a multi-step process that must compromise efficiency, fidelity, and velocity. In bacteria, the 70S ribosome consists of a large 50S and a small 30S subunit. The 50S subunit is composed of the 23S and 5S ribosomal RNAs (rRNAs) and 34 ribosomal proteins, while the 30S subunit is composed of the 16S rRNA and 21 proteins1,2,3. All these elements are involved in a controlled and dynamic choreography where ribosomal proteins are assembled on the three pre-rRNA transcripts, which are processed and modified during transcription4,5. Errors in this process could compromise translation fidelity, impair ribosome function, and activate quality control mechanisms to degrade defective ribosomes6,7. Thus, ribosome assembly is an energy-intensive and tightly regulated process that requires assembly factors to ensure proper function in vivo5.
Ribosome associated GTPases (RA-GTPases) function as molecular switches, cycling between GTP-bound (active) and GDP-bound (inactive) states8. Active RA-GTPases bind to immature ribosomal subunits, facilitating their maturation. RbgA, HflX and Obg act on the 50S subunit, stabilizing critical helices and functioning as a GTPase/ATPase for large subunit maturation9,10. RsgA and ERA, meanwhile, target the 30S subunit, helping in final subunit processing11. Once maturation is achieved, GTP is hydrolyzed to GDP, leading to the RA-GTPase dissociating from the ribosome. The importance of this GTPase activity is observed in the cell’s ability to adapt under stringent conditions. During starvation, levels of the cellular signaling nucleotide (p)ppGpp rise and GTP concentrations fall12. (p)ppGpp can then outcompete GTP for RA-GTPase binding, which destabilizes the association of RA-GTPases with the ribosome subunits, negatively impacting ribosome biogenesis13,14,15. Therefore, RA-GTPases are molecular sensors of bacterial stress in addition to essential structural modulators of ribosome biogenesis.
The GTPase ERA is an assembly factor involved in the biogenesis of the 30S ribosomal subunit in bacteria, playing a crucial role in ribosome availability and cell viability16. ERA is an essential protein in a number of bacterial species and its depletion is associated with severe pleiotropic phenotypes17,18. The protein’s structure has an N-terminal GTPase and a C-terminal KH domain. The NTD works as a molecular switch by GTP hydrolysis and GDP/GTP exchange19,20 and binds to Protein S18 and helix h26 of the 16S rRNA on the 30S subunit. The KH domain, a distinct structural and functional unit of 85 amino acids is responsible for RNA binding and association with ribosomes by interacting with the 3′ end of the 16S rRNA21. This region is characterized by helix h45, the conserved ERA recognition motif 1530 GAUCA 1534, and the anti-Shine-Dalgarno sequence. Particularly, nucleotides G1530 and A1531 appear essential for ERA anchoring to the 30S22. ERA acts as an RNA chaperone, ensuring proper folding and maturation of the 16S rRNA and the assembly of the 30S subunit. GTPase activity appears to be essential for these processes, although it remains unclear whether GTP hydrolysis directly stimulates RNA processing or unlocks cycling between active and inactive states of the factor. Inhibiting ERA disrupts ribosome formation, making it a key target for studying ribosome assembly in bacteria and a potential target for drug development.
Aptamers are short oligonucleotides that fold into unique three-dimensional structures and bind specifically and with high affinity to a given target molecule. Aptamers are selected by the SELEX (Systematic Evolution of Ligands by Exponential enrichment) method23. They are chemically synthesized and can be modified to enhance their stability, binding affinity, and specificity. In this work, we use SELEX coupled to next generation sequencing (NGS) and advanced bioinformatic tools to identify aptamers that bind specifically to the RA-GTPase ERA from S. aureus. We show that AptERA 2 binds the KH domain of ERA and leads to a significant reduction of 30S-dependent GTP hydrolysis, indicative of allosteric modulation of the enzyme activity or limiting ERA binding or the KH domain interaction with the 3’ end of the 16S rRNA rather than directly blocking GTP binding. Altogether, this work highlights the versatility of aptamers as tools to understand the complex processes of ribosome biogenesis further, offering new insights into bacterial protein synthesis mechanisms.
Results
Aptamers against the ERA GTPase
Selection and computational analysis
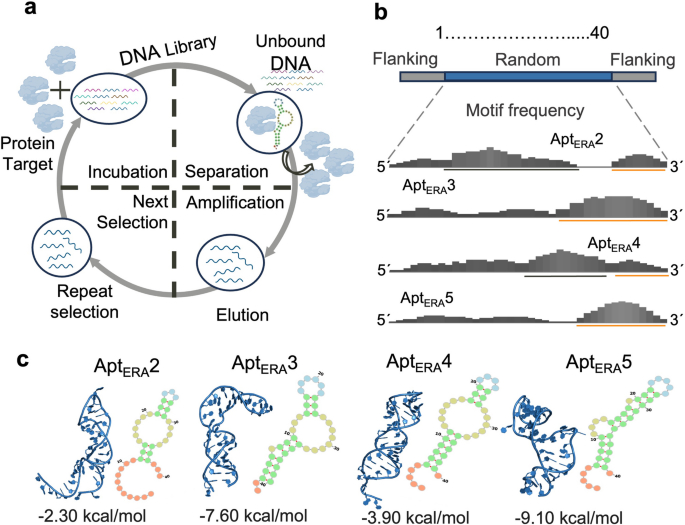
SELEX was utilized to select aptamer candidates with high affinity for the ribosome assembly factor ERA from Staphylococcus aureus, an RA-GTPase of 35 kDa recombinantly produced as per Bennison et al.24 (Supplementary Fig. 1). The ssDNA library consisted of a 40-nucleotide randomized region flanked by two 17 nucleotides constant regions complementary to PCR primers (Fig. 1b). The SELEX workflow involved one negative selection, followed by two positive selections that allowed the separation of binders from non-interacting ssDNA fragments, progressively isolating aptamers (Fig. 1a) (Supplementary Fig. 2). In the first positive selection, ssDNA binders were selected using magnetic beads and recovered as the Start Pool (SP) library. This pool was used in the second selection with different concentrations of free ERA: a high protein concentration (HP, 200 nM), a low protein concentration (LP, 40 nM) or no protein (NEG, negative control). ERA-bound aptamers were recovered using magnetic beads. Four final Enriched libraries were obtained, amplified, and sequenced by NGS (Next Generation Sequencing): SP, HP, LP, NEG.

Aptamer selection and computational screening. (a) Diagram of the SELEX methodology illustrating the DNA aptamer enrichment process. (b) Schematic representation of the most prevalent localization of motifs in the 4 aptamer candidates. G-rich motifs are indicated with an orange line, while AT-rich motifs are marked with a black line. Top: DNA library used, with 17 nt flanking regions complementary to primers for PCR amplification and a 40 nt central random region. (c) 2D and 3D structures of aptamer candidates, delta G values are shown. Secondary structures were predicted with RNAfold while 3D structures used a modified pipeline from Jeddi & Saiz, 201725 and Joseph et al., 201926. Images were generated using Forna (ViennaRNA Web Services; http://rna.tbi.univie.ac.at/forna/) and PyMOL version 3 (Schrödinger, LLC, https://www.pymol.org/), respectively.
The raw sets of sequences were curated using Galaxy project tools to discard reads showing amplification and sequencing artifacts. They were also filtered by size to focus on the 40-nt central region corresponding to unique sequences. A comparison of enrichment analysis between curated and non-curated sequences showed a lower unique/total reads ratio after processing with Galaxy, suggesting better enrichment ratios (Supplementary Fig. 3). Following this, a bioinformatic analysis of the aptamer libraries was conducted using FASTAptamer27 to identify abundant and enriched sequences that could be considered aptamer candidates. For this purpose, the libraries were first normalized to RPM (Reads Per Million), and individual and cluster analyses were performed comparing SP, HP, and LP conditions. Sequences that appeared in the negative control (without ERA) were discarded as being potential unspecific binders. Individual analysis of each selection condition proved non-productive, with low enrichment ratios across libraries. Albeit, AptERA 1 appeared as the most abundant sequence in both the HP and LP selections, it also ranked high in the start pool selection, suggesting no enrichment occurred in the second round; thus, it was excluded. As expected, SP showed poor sequence cluster formation, indicating heterogeneous sequence variety and it was excluded from further analysis. The HP and LP selection were then analyzed by cluster formation using the Levenshtein edit distance criteria, revealing 91 clusters for HP and 81 clusters for LP. The most represented clusters by abundance were inspected in each library. The most abundant aptamer (highest RPM) was selected for Cluster 2 and Cluster 3 in each of the HP and LP selection conditions, respectively. Using this procedure, AptERA 2 (from cluster 2) and AptERA 3 (from cluster 3) were identified for the HP condition and AptERA 4 (from cluster 2) and AptERA 5 (from cluster 3) were found for the LP condition (Table 1). Enrichment analysis of clusters between the SP and LP or HP conditions showed that the ratios (LP/SP and HP/SP) were poor or not significantly different between clusters to be used as a selecting criterion.
Sequence characterization of the four candidate aptamers revealed differential motifs patterns within each library (supplementary Table S1). Motifs alignments against aptamers showed a general higher distribution of T-rich central motifs for AptERA 2 and AptERA 4, and G-rich motifs localized to the 3′ end for AptERA 3 and AptERA 5 (Fig 1b) (Supplementary Figs. 4 and 5). Nucleotide pairing analysis among the AptERA candidates showed that AptERA 2 was the most different between the candidates, while AptERA 4 exhibits the highest conservation at 67.5%, AptERA 5 at 60%, and AptERA 3 at 55% (Supplementary Fig. 6a). Nucleotide composition analysis also revealed a predominance of pyrimidines in AptERA 2, 3, and 4, with a content of 60%, 62.5%, and 67.5%, respectively. AptERA 2 and 4 also have higher AT content, at 52.5% and 60%, respectively (Supplementary Fig. 6b). All AptERA aptamers showed minimal conservation of their primary sequence compared with the 16S rRNA (Supplementary Fig. 6c and d).
Secondary structures of AptERA 2–5 were predicted using RNAfold and the best models were selected based on the lowest minimum free energy (ΔG) values, ranging from − 2.30 to − 9.10 kcal/mol. These selected models were then analyzed structurally by visualization in Forna28. Predicted key structural elements that included stems, hairpins, interior loops, and unpaired nucleotides, showing distinct stem-loop and hairpin formations in all aptamers (Fig. 1c). All aptamers contained an interior loop and a central hairpin, with AptERA 3, 4 and 5 having prominent stem regions. AptERA 2, exhibited the shortest structured region from positions 12–37, and AptERA 3 the longest from positions 3–40 (Fig. 1c) (Supplementary Fig. 7a). All candidates had similar 2D and 3D structures to the helix 45 (H45) of the 16S rRNA, with AptERA 2 and 4 being the most similar (Supplementary Fig. 7a and b).
Aptamer binding and GTPase activity screening
The binding capacities of the four aptamer candidates to the GTPase ERA were analyzed by a three-step screening process. All four aptamers were initially screened for their binding to the ERA protein using Label-free microscale thermophoresis (MST) under saturating conditions. A negative control from the initial selection library (SP) was used to set the MST signal cutoff in the absence of specific binders, determined as the mean MST plus two standard errors of the mean (s.e.m.). All four aptamers exhibited binding signals above the cutoff, indicating binding to the GTPase ERA (Fig. 2a). This result led us to further perform testing of all the aptamers, evaluating their capacity to inhibit GTP hydrolysis, detected and quantified by Thin Layer Chromatography (TLC) using α32P-labeled GTP (Fig. 2b) (Supplementary Fig. 8). The GTPase activity of ERA was normalized to a known GTPase activity inhibitor, ppGpp. In addition, the results were compared to a positive signal control of ERA in the absence of any GTPase inhibitor. AptERA 3 and AptERA 5 showed similar inhibitory activity as a random ssDNA control, dismissing them as possible GTPase activity inhibitors. However, AptERA 2 (P = 0.0001) and AptERA 4 (P = 0.0004) significantly reduced GTPase activity, showing a similar inhibitory effect as the positive control (ppGpp) (Fig. 2b). To further confirm the binding of AptERA 2 and AptERA 4 to ERA, an Enzyme-Linked Oligonucleotide Assay (ELONA) assay was performed (Fig. 2c). Both aptamers exhibited significantly (P ≤ 0.0001) higher binding signals to the ERA protein when compared to the negative control (biotinylated probe). Notably, AptERA 2 demonstrated the highest binding activity, correlating with its highest inhibition of GTPase hydrolysis. As such, AptERA 2 was selected for further characterization and evaluation.

Screening and binding analysis of aptamer candidates. (a) Binding screening of four aptamer candidates to purified ERA (0.45 µM) using Label-free MST under saturating conditions (3 μM). MST measures shifts in fluorescence signal upon differential thermal migration out from the observation spot as a function of the bound to unbound states of ligands, assessing aptamer-protein interactions. The binding cutoff (dash line) was determined as the mean of the negative controls plus 2 s.e.m. (b) GTP hydrolysis inhibition by aptamers. The assay allows the quantification of hydrolyzed and unhydrolyzed GTP. Activity was assessed by TLC (Thin Layer Chromatography) after incubation of 1 µM ERA with α32P-labeled GTP in the presence of aptamers and controls. Controls included ppGpp (positive control for inhibition), a random oligo (negative control for inhibition), and ERA in the absence of any inhibitor (Positive signal control). The Y-axis shows relative activity to the positive control for inhibition (ppGpp). (c) Verification of binding of AptERA 2 and AptERA 4 to ERA using the ELONA assay. In this assay, 1 µM ERA was immobilized onto a solid surface, and aptamer binding was detected through a streptavidin-HRP enzymatic reaction with TMB (3,3′,5,5′-tetramethylbenzidine) as the substrate. Signal was measured by absorbance at 450 nm after stopping the reaction at 30 min. In this assay, extended versions of AptERA2 and AptERA4 with flanking regions were used, and both aptamers were indirectly biotinylated through a 5′ complementary probe. Two negative controls were used, biotinylated probe complementary to the 5´ end of the aptamer (Probe) and in the absence of any nucleic acid (Blank). 1 µM Bovine Serum Albumin (BSA) was used as negative control of protein in the assay in the same conditions used for ERA, Data represent mean ± sem from duplicate experiments (a, c) and mean ± sd from triplicate experiments for (b). Statistical analysis was performed using one-way ANOVA (****P ≤ 0.0001, ***P ≤ 0.001).
Characterization of AptERA2
The specificity of AptERA 2 for the GTPase ERA was first evaluated under denaturing and native conditions to assess its dependence on the 3D conformation of the target protein. As shown in Fig. 3a, AptERA 2 exhibited a strong binding signal to the native ERA protein, which was drastically reduced if ERA was exposed to 2% SDS prior to the Elona test. Additionally, the binding signal to unrelated proteins, such as BSA and 1F8 (Chagas antigenic protein), was relatively lower (P ≤ 0.0001), indicating a high specificity for the correctly folded ERA protein. These results confirm that AptERA 2’s binding is highly dependent on the intact 3D structure of ERA, with no significant interaction with unrelated proteins. The binding affinity of AptERA 2 to ERA was further characterized through various assays, including the ELONA assay and Label-free MST. These methods allowed for the determination of the dissociation constant (Kd) and the binding behavior across a range of aptamer concentrations. Using an ELONA assay, AptERA 2’s binding affinity for ERA was assessed by titrating the aptamer concentrations from 62.5 nM to 2 µM. The results, depicted in Fig. 3b, revealed a Kd value of 243 ± 16 nM using non-linear regression analysis with a hyperbolic function for one site binding model. When titration experiment was performed with ERA, the ELONA signal displayed sigmoidal dependance on protein concentration. Thus, a dose-response analysis indicated an EC50 value of 185 ± 3 nM, showing a clear concentration dependence of AptERA 2 binding to ERA (Fig. 3c). With the aim to complement the ELONA results, an MST analysis was performed to independently verify AptERA 2’s affinity for ERA, using an extended version of the aptamer that included selection flanking regions as indicated in Table 1. As shown in Fig. 3d, non-linear fitting using a sigmoidal function yielded an EC50 value of 117 ± 28 nM, despite the higher variability of label-free MST, it was consistent with the strong affinity of the aptamer for the ERA protein. Furthermore, this data ruled out a possible contribution/interference of the two flanking sequences used for the SELEX procedure.

Analysis of AptERA 2 binding specificity and affinity. (a) AptERA 2 binding specificity on ERA structure. Binding of ERA was compared to BSA, 1F8 (Chagas antigenic protein) and to ERA under denaturing conditions (2% SDS). (b) Dissociation constant (Kd) determination for AptERA 2 using the ELONA assay. ERA was used at a constant concentration of 1 µM, and the aptamer was titrated from 62.5 nM to 2 µM. The continuous line shows fitting with a hyperbolic non-linear regression function (Kd = 243 ± 16 nM). (c) Concentration dependence for ERA protein using ELONA assay. The continuous line shows a dose–response sigmoidal fitting (EC50 = 185 ± 3 nM). ERA was titrated from 78 nM to 1 µM. (d) Kd determination using Label-free MST. The aptamer was titrated from 1.6 nM to 3.4 µM. Continuous line shows a non-linear fitting using a sigmoidal function (EC50 = 117 ± 28 nM). Error bars represent the standard error of the mean (s.e.m.) from duplicates. Error bars in (b, c) represent standard deviations (s.d.) from triplicates.
To assess AptERA 2’s performance in more complex environments, its binding specificity and affinity to ERA were evaluated in E. coli lysates expressing recombinant ERA protein from S. aureus (Supplementary Fig. 9). Here, we show that the aptamer maintains its binding capacity for ERA under ex-vivo conditions and also shows 3D structure dependence of ERA binding (Fig. 4a). AptERA 2’s specificity was tested alongside the related GTPase RbgA, which showed a low ELONA signal, similar to that obtained with an unrelated negative control protein (1F8) (Fig. 4b). Additionally, AptERA 2 was tested against the KH- and G-domain only from ERA using the Elona test. Binding was observed only of the KH-domain was present as the entire ERA protein or in the isolated form, indicating specificity towards the KH-domain (Supplementary Fig. 9). AptERA 2’s binding behavior in lysates was also assessed through titration (Fig. 4c). Lysates expressing the GTPases ERA and RbgA, the unrelated protein 1F8, and an empty vector induced in E. coli BL21 lysate were immobilized in 96 plates and tested against the aptamer for binding. When ERA was overexpressed, the measured absorbance increased with aptamer concentration as compared to negative controls and blanks. These controls showed a linear increase of absorbance with different slopes as obtained with a linear regression. Uninduced E. coli BL21 lysates showed a slope of 27 ± 1 nM−1, while for lysates containing overexpressed RbgA or 1F8 the slope was 34 ± 1 nM−1. Subtracting these backgrounds to the ERA data yielded a hyperbola consistent with a one-binding site model and a Kd = 884 ± 58 nM.

AptERA 2 binding analysis under ex vivo conditions. (a) Structural dependence for AptERA 2 binding to S. aureus ERA in E. coli lysates expressing the protein. Native and 2% SDS-treated lysates were compared. Mean ± s.d. from triplicate experiments are shown. Statistical analysis was performed using T-test (**P = 0,017). (b) Binding specificity of AptERA 2 to ERA, RbgA, and 1F8 using total lysates of overexpressing E. coli BL21 strains. Mean ± s.d. from triplicate experiments are shown. Statistical analysis was performed using one-way ANOVA (****P ≤ 0.0001). (c) Binding signal dependence on AptERA 2 concentration in E. coli lysates. The absorbance signal (450 nm) in the Y axis was corrected by subtracting a non-aptamer blank for all measurements. The continuous line shows the fitting with hyperbolic function for binding (Kd = 884 ± 58 nM).
Overall, our work reveals that AptERA 2 binds specifically to both purified recombinant ERA, the isolated KH domain or ERA-containing total cell lysates and shows very weak interactions with unrelated proteins or even with another RA-GTPase. Finally, the binding specificity is highly dependent on the 3D structure of ERA. The affinity of the aptamer-ERA interaction was consistent using two different methods, showing binding values ranging between 100 and 800 nM, depending on the complexity of the reaction. Both the specificity and binding affinity properties establish AptERA 2 as an aptamer against the GTPase ERA.
AptERA 2 activity and interaction model
To confirm the inhibitory activity of AptERA 2 on ERA’s GTPase function, a dose-response GTPase hydrolysis activity assay was performed. The GTPase activity in the presence of AptERA 2, ppGpp, and a random oligo control was compared in a range of 100 to 6.25 µM. As shown in Fig. 5a, AptERA 2 significantly reduced the GTPase activity, compared to the random oligo control, supporting its inhibitory effect. While the inhibition curve displayed weaker inhibitory activity as compared to the positive inhibitory control ppGpp, AptERA 2 still demonstrated a notable reduction in GTPase activity. The findings confirm that AptERA 2 effectively limits ERA’s GTPase activity, making it a potentially useful tool for investigating GTP hydrolysis mechanisms and the function of ERA. To gain insights into the structural basis for AptERA 2’s specificity and affinity for ERA, a computational 3D structural model of the aptamer-ERA complex was developed using HDOCK29 molecular docking. Potential protein-ligand interactions were suggested by PLIP, which predicts molecular contact points based on docking poses30. The resulting model, illustrated in Fig. 5b, highlights the interface between AptERA 2 (blue) and the ERA protein (gray). The model shows the aptamer embracing the protein through contact with the KH-domain (Yellow) (supplementary Fig. 10). Docking shows key residues within ERA, particularly the sequence motif ‘V–L–L W V K V’, as possible contact points (Fig. 5b). In comparison, AptERA 4 shows fewer possible contact points in this area (Fig. 5b, comparison below the structure). This interaction could explain the aptamer’s specificity and affinity towards ERA while its inhibitory activity suggests an allosteric mechanism.

Inhibition of GTP hydrolysis and structural model of AptERA 2 with ERA protein. (a) Evaluation of GTP hydrolysis inhibition of ERA. AptERA 2 (blue), ppGpp (black, positive control for inhibition), and a random oligo (orange, negative control for inhibition) are compared at increasing concentrations Mean values ± s.d. from 5 independent measurements are shown. (b) The 3D molecular model illustrates ERA, where the G-domain is shown in gray, residues interacting with GTP in red, the KH domain in yellow, and AptERA 2 in blue. Potential amino acids contacting AptERA 2 as compared to AptERA 4 are indicated below the structure. The 3D model of the complex was generated using HDOCK molecular docking and Protein–ligand interactions were analyzed using PLIP29,30. Structures were drawn with PyMOL version 3.0 (Schrödinger, LLC; https://pymol.org).
Discussion
Aptamers are versatile molecules with a variety of applications, mostly used as molecular sensors or therapeutic agents31. Here we discuss the potential use of aptamers as molecular tools to further understand intra- and intermolecular interactions of the GTPase ERA and ribosome biogenesis. Our results show that AptERA 2 is a strong (Kd ~200 nM, Fig. 3) and specific binder of ERA. Once bound, the aptamer significantly reduces ERAs GTP hydrolysis activity on the 70S ribosome from S. aureus. Different inhibitory mechanisms may explain how AptERA 2 functions. For instance, the aptamer could block the guanosine nucleoside binding site, clash with the 30S subunit precluding ERA binding, or allosterically compromise ERA rearrangements that lead to GTP hydrolysis activation. Our data argues for an allosteric model since our structural analysis and experimental results indicate that AptERA 2 interacts with the KH domain of ERA (Fig. 5). Additionally, AptERA 2 shows no cross-reaction with the related protein RbgA, or to ERA lacking the KH domain. Both proteins, ERA and RbgA, have a very conserved G-domain, however, RbgA lacks a KH domain. Altogether, our data supports that AptERA 2 binds the KH-domain. On the other hand, GTPase inhibition by blocking the KH domain may suggest that the AptERA 2 mechanism does not involve precluding GTP binding to the factor.
AptERA 2 contains a motif near the 3’ end, positions 37GATC40, which appears minimally structured in our 2D and 3D models (Supplementary Fig. 7). Although not identical to the 1530 GAUCA 1534 sequence found in 16S rRNA, the presence of 1530 GA 1531, known to be crucial for ERA interaction with the 30S, suggests that AptERA 2 may use a similar interaction32. This GA duplet, though important, does not seem to directly influence GTPase inhibition, as not all aptamers were able to inhibit the activity. This indicates that the dinucleotide GA is likely involved in ERA binding rather than in modulating its enzymatic function. Co-crystal structures show that ERA binds G1530 and interacts with helix 45 (h45) of the 16S rRNA21,22. Notably, G1530 does not stimulate GTPase activity, while A1531 and A1534 are essential for this stimulation, with position A1531 tolerating substitutions and A1534 being indispensable22. In our aptamers, the A at the second position of the consensus motif (1530 GAUCA 1534) is absent, similar to A1534 mutant (A1534U) that fails to stimulate ERA’s GTPase activity22.
The presence of 2D structural motifs could mediate the interaction between the aptamer and the GTPase ERA. Hairpins are commonly associated with molecular recognition sites, while stems provide structural stability, which are crucial for effective binding33,34. The 2D structures of the aptamers show a characteristic hairpin loop, similar to h45, although the loop size varies and the double A repetition of h45 is absent in the aptamers. Additionally, h45 is known to stimulate ERA´s GTPase activity unlike the aptamer. The aptamers display loops of differing chemical composition and sizes. AptERA 2 and 4 show a tri- and tetraloops, respectively, while AptERA 3 and 5 have hexa- and pentaloops. 3D alignments of the AptERA aptamers with 16S rRNA show structural similarities to h45, with AptERA 2 and 4—the most active aptamers—showing the highest resemblance. Comparing the aptamer sequences with the 16S rRNA shows conservation of positions 3, 15, 19, 22, 23, and 36 in AptERA 2. Notably, positions 3, 19, 22, and 23 are involved in key contact points with ERA. Altogether, AptERA 2 may use a 3D structure similar to h45 for efficient binding yet preventing GTP hydrolysis rather than activating it.
Aptamers like AptERA 2 show promise as versatile tools for probing the molecular mechanisms of ribosome biogenesis, especially by targeting key enzymes such as RA-GTPases. Proof of this are previous works where aptamers have been developed to target ribosomal proteins S8 and pepocin as well as small GTPases35,36,37. Moving forward, a structural investigation, such as cryo-EM or X-ray crystallography, could provide critical insights into the AptERA 2-ERA interaction, confirming the suggested KH domain binding and further clarifying the mechanism of inhibition38. Future research should also explore the adaptability of aptamers in modulating the function of other GTPases involved in ribosome assembly, providing a broader understanding of bacterial protein synthesis. The specific targeting and modulation capabilities of aptamers highlight their potential both as research tools and as a platform for developing new antimicrobial agents or “vehicles” to carry drugs to their specific target.
Overall, our findings support a model in which AptERA 2 binds to the KH domain of the GTPase ERA and allosterically interferes with its 30S-dependent GTP hydrolysis—without directly blocking the GTP-binding site. By mimicking key rRNA elements, this aptamer effectively compromises ERA–ribosome interactions, thereby highlighting the importance of KH domain contacts for ERA’s GTPase activity. Beyond uncovering a novel mechanism for ERA inhibition, our study underscores the broader potential of aptamers as versatile molecular probes. Their high specificity, chemical versatility, and adaptability to complex molecular systems make them powerful tools for dissecting protein–protein, protein–RNA interactions, and modulating essential macromolecular assemblies—such as the bacterial ribosome—for both basic research and therapeutic innovation.
Methods
Aptamer selection
The X-Aptamer Selection Kit (AM Biotechnologies, LLC)39 was used to select high-affinity aptamers. Selection buffers were prepared as follows: Buffer A: 1x PBS (pH 7.4) (524650-1EA, Sigma,USA) with 1 mM MgCl₂ (M8266-1KG, Sigma, USA), 0.05% Tween-20 (#P1379, Sigma,USA), and 0.5% BSA (#5000206, Biorad, USA); Buffer B: 1x PBS (pH 7.4) with 1 mM MgCl2 and 0.05% Tween-20. The ssDNA library linked to polystyrene beads was rehydrated in 1.3 mL of Buffer B and activated by heating at 95 °C for 5 min, followed by slow annealing at room temperature (RT) for 30 min. The negative selection was performed by incubating the aptamer library with pre-washed Ni-NTA-coated magnetic beads (#10103D, Invitrogen, USA) to remove nonspecific binders. The beads were resuspended in Buffer B and incubated with the library at RT for 1 h with gentle rotation. The supernatant containing unbound aptamers was recovered and centrifuged to collect the library. The first positive selection involved coupling 20 µg of ERA to 25 µL of magnetic beads and incubating this with the library for 90 min at RT with rotation. The beads were then washed with Buffer A until the supernatant was clear, and the aptamer-polystyrene bead/ERA-magnetic bead complexes were separated using a magnetic stand. Selected bead-bound aptamers were eluted using 1 N NaOH (106469, Merck, USA) at 65 °C for 30 min, followed by neutralization with 2 M Tris-HCl (#T5941, Sigma, USA). Eluted aptamers underwent a buffer exchange using columns, and the aptamer pool (Starting Pool, SP) was then used in a secondary pull-down selection with different ERA concentrations: 200 nM (High Protein, HP), 20 nM (Low Protein, LP), and 0 nM (SP and Negative control). For this selection, 15 µL of SP was distributed into four tubes in a final volume of 150 µL in Buffer A and incubated with the corresponding ERA concentrations. After 1 h at RT, 5 µL of Ni-NTA-coated magnetic beads were added (except for the SP tube), incubated for 30 min with gentle rotation, and collected with a magnetic stand. After the final selection, magnetic beads were washed three times with 200 µL Buffer B and resuspended in 100 µL. The bound aptamers were amplified via PCR in a total volume of 100 µL containing 1x PCR buffer, 2.5 mM MgCl₂, 0.2 mM dNTPs, 1 U of Taq DNA polymerase (#M0320, NEB, USA), 0.4 µM of each primer, and 10 µL of the protein sample. The PCR conditions were as follows: an initial denaturation at 94 °C for 1 minute, followed by 30 cycles of 94 °C for 30 sec, 50 °C for 30 sec, and 72 °C for 1 min, with a final extension at 72 °C for 3 min. An initial analytic amplification was performed at 10, 14, 18, and 22 cycles to determine the optimal cycle number for each library, followed by final amplification using the selected cycle number. The PCR products were visualized on an 8-10% TBE polyacrylamide gel. After the first amplification, the libraries were prepared for high-throughput sequencing using the 16S Metagenomic Sequencing Library Preparation Kit (Illumina, USA) and sequenced on the MiSeq 2000 platform (Illumina, USA) for four libraries: SP, HP, LP, and the negative control.
Bioinformatic analysis
Following the SELEX process, a comprehensive in silico workflow was employed to identify and characterize aptamers targeting the GTPase ERA. First, the High-Throughput Sequencing (HTS) data from the four libraries was curated using the Galaxy platform40, using tools for quality control (FASTQC-quality), adapter trimming (FASTQ Trimmer), and sequence filtering (Filter FASTQ). This process included cutting primers forward and reverse from all libraries and applying a sequence length filter (30–60 nt) to exclude shorter or longer sequences, artifacts of amplification and sequencing. To finalize sequencing reads (R1) and (R2) were merged to increase enrichment and the whole process was evaluated by unique/total sequences ratio. The curated libraries were then analyzed using FASTAptamer27. The commands count (to normalize to RPM, Reads per Million), enrich, compare and cluster were used to identify both individual and clustered enriched sequences. For clustering the fastaptamer_cluster command was used with the following parameters: edit distance of 4 (− d 4) and a minimum filter of RPM ≥ 9 (− f 9) to retain sequences with sufficient representation. Each cluster was analyzed by enrichment and abundance analysis, finally selecting candidates by ranking. Motif analysis was performed using FASTAptamer 2.041, and the results were visualized through GraphPad Prism (Version 10; GraphPad Software, San Diego, CA, USA), plotting Z-scores (ZZ) for enrichment and P-values for statistical significance. Motif localization was assessed using a custom Python script (https://github.com/nspereirab/APTs_Motifs), and Clustal Omega (EMBL-EBI, UK)42, which mapped motifs from HP and LP within candidate aptamers. Alignments between aptamers and 16S rRNA were done through MAFFT v743. All alignments were visualized by Jalview v244.
Oligonucleotide synthesis and modifications
Selected aptamers were synthesized by Macrogen (USA) with and without 5´biotin-TEG (triethylene glycol spacer) for binding evaluation in ELONA and MST, respectively. Additionally, non-modified aptamers were synthetized in an extended version, that included the flanking Forward 5´CAG GGG ACG CAC CAA GG 3´ and Reverse 5´CCA TGA CCC GCG TGC TG 3´ annealing regions. This extended version was used in label free-MST assays and ELONA initial screening using a 5´complementary biotinylated probe.
Preparation of E. coli lysates
The plasmids pET-28b for ERA and pET-24a for 1F8 were used for protein expression in E. coli BL21 (DE3) cultures. For each protein, a 1–2 liter LB culture was grown at 37 °C until an OD600 of 0.5–0.7 was reached. Protein expression was induced by adding IPTG (#R0392, Thermo Scientific, USA) to a final concentration of 0.5 mM, followed by overnight incubation at 18 °C. Cells were harvested by centrifugation at 5,000 x g for 10 min at 4 °C. The resulting cell pellets were resuspended in lysis buffer TAKM 7 containing 20 mM Tris-HCl (pH 7.5), 30 mM KCl, 7 mM MgCl₂, 70 mM NH₄Cl, and 0.2 mM Benzamidine (#12072, Merck, USA), and stored at − 80 °C until sonication. Cell resuspensions were thawed and kept in an ice bath to prevent overheating. Sonication was performed using a Pulse 150 Ultrasonic Homogenizer Sonicator (Benchmark Scientific, USA) with a microtube probe at the following conditions: power setting of 50%. 2 sec sonication, 3-sec intervals for a total of 10 min. After this, the lysates were centrifuged at 8500 × g for 30 min at 4 °C to remove cell debris. The supernatant was collected, aliquoted, and stored at − 80 °C until further use. SDS-PAGE and ELONA confirmed the presence of ERA, RbgA, and 1F8 in the lysate with His-tag aptamers, while the overall protein concentration was determined using the Bradford assay.
Production of recombinant proteins
ERA was purified by nickel affinity chromatography using a 1 mL HisTrap HP column (#17524701, GE Healthcare, USA) as previously described45. The column was washed with wash buffer 50 mM Tris-HCl, pH 7.5, 150 mM NaCl, 5% glycerol, 10 mM imidazole, and the bound protein was eluted with a gradient of the elution buffer (50 mM Tris-HCl, pH 7.5, 200 mM NaCl, 5% glycerol, 500 mM imidazole). The gradient was run from 0 to 100% over 25 min to facilitate protein release. The eluted fractions were analyzed by SDS-PAGE, and the protein-containing fractions were pooled and dialyzed against storage buffer (50 mM Tris-HCl, pH 7.5, 200 mM NaCl, 5% glycerol). 1F8 purification was performed using a 1 mL HisTrap column, following the standard protocol provided by the manufacturer.
Enzyme-linked oligonucleotide assay (ELONA)
For ELONA, pure proteins (1 µM) or lysates (2 µg/well) were immobilized on a 96-well plate using a carbonate/bicarbonate coating buffer (pH 9.6, #C3041, Sigma, USA) overnight at 4 °C. Each well was then blocked with 200 µL of blocking buffer (1X PBS, 0.05% Tween, 5% milk powder) for 2 h at room temperature (RT) with gentle agitation. For assays involving the anti-HisTag aptamer (6H5, Patent US10,934,856.), the aptamer was activated by heating at 95 °C for 3 min, followed by immediate cooling on ice for 5 min. It was then incubated with the wells in binding buffer (1X PBS, 0.05% Tween, 0.1% milk, 1 mM MgCl2) using 100 pmol/well for 1 h. For AptERA aptamers, heating was followed by 15 min of cooling at RT and incubation in binding buffer (1X PBS, 0.05% Tween, 5% milk powder, 1 mM MgCl₂). After biotinylated-aptamer binding, 100 µL of streptavidin-HRP enzyme conjugate (1:1000 dilution, #N100, Thermo Scientific, USA) was added and incubated for 1 h at RT. The signal was developed with 100 µL of One Step Slow TMB substrate (#34024, Thermo Scientific, USA), and the plate was read continuously at 620 nm for 30 min. The 100 uL reaction was then stopped with 50 µL of 2M sulfuric acid, and the final absorbance was measured at 450 nm. Positive and negative controls included 1F8 and BSA . Between each incubation step, wells were washed four times with 200 µL/well of 1X PBS + 0.05% Tween. ELONA assays were performed to assess AptERA aptamer binding and specificity and to verify the presence of His-tagged proteins in lysates. All assays were performed in triplicate to ensure statistical reliability. One-way ANOVA with Dunnett’s test was used for group comparisons, and an unpaired T-test for specific conditions. Hyperbolic non-linear regression and sigmoidal fitting were applied to dose-response curves.
MST
Label-free Microscale Thermophoresis (MST) assays were done using a Monolith NT.LabelFree instrument (NanoTemper Technologies, Munich, Germany) with LabelFree Capillaries (#MO-Z022, NanoTemper Technologies, Germany). The interaction between ERA (0.45 µM) and AptERA aptamers (3 µM) was assessed. Also, a 12-point titration of AptERA 2 was performed, with concentrations ranging from 3.4 µM to 1.66 nM. Experiments were conducted at 25 °C with MST Power set to Medium and Excitation Power at 40% and data was collected from a cold region − 1 to 0 s and a hot region from 14 to 15 s. Data was analyzed using GraphPad software to determine binding affinities.
GTPase activity assay
The ability of ERA to hydrolyze GTP in the presence or absence of aptamers was determined by incubating 1 μM ERA with 1 μM S. aureus 70S ribosomes, 2.78 nM α-32P-GTP and 50 μM aptamer (or ppGpp) in 40 mM Tris (pH 7.5), 100 mM NaCl, 10 mM MgCl2 at 37°C for 1 h. For GTPase dose response experiments, reactions were set up as described above but with increasing concentrations of ppGpp, AptEra 2 or a control ssDNA oligo with concentrations ranging from 1.56 to 100 μM for 15 min at 37 °C. All reactions were also set up in the absence or enzymes to monitor spontaneous GTP hydrolysis. Reactions were heat inactivated at 95 °C for 5 min to precipitate proteins and release bound nucleotides. Proteins were pelleted by centrifugation at 17,000 × g for 10 min. Reaction products were visualized by TLC in PEI cellulose TLC plates (Macherey-Nagel) and separated using a 0.75 M KH2PO4 (pH 3.6) buffer. The radioactive spots were exposed to a BAS-MS imaging plate (Fujifilm) and visualized using an LA7000 Typhoon PhosphoImager (GE Healthcare). Images were quantified using ImageQuant (GE Healthcare).
Domain-specific binding assay
DNA templates for the full-length ERA, ΔKH variant, and isolated G- and KH-domains were transcribed in vitro using the TranscriptAid T7 High Yield Transcription Kit (Thermo Fisher Scientific, Cat. No. K0441, USA) for 4 h at 37 °C. Resulting mRNAs (2.5 μg per construct) were used for in vitro translation using the PURExpress® In Vitro Protein Synthesis Kit (NEB, Cat. No. E6800, USA) for 5 h at 37 °C. Translation products were fixed on plates and detection of AptERA 2 binding was performed as previously described in the ELONA section.
Computational modeling
The structures of the aptamers were predicted using a multi-step approach. First, the secondary structures of the aptamers were predicted using the RNAfold web server46 and further visualized using Forna28 to identify different structural motifs. After, RNAComposer47,48 was employed for the tertiary structure predictions to generate initial models which were then converted into DNA replacing uridine for thymidine. Validation of aptamer sequences was done by the Webserver Xiaolab49. The structure of the GTPase ERA (UniProt ID: Q2FY06) was retrieved from the AlphaFold Protein Structure Database50. These predicted structures served as the foundation for subsequent docking simulations. Molecular docking simulations were done using the HDOCK server29, allowing for flexible docking of the aptamers with the target protein. Docking poses were ranked based on their docking scores, and the top poses were compared to a negative (BSA) and positive control (16S rRNA). These selected poses were then examined to identify potential interactions and binding motifs. Domain architecture and RNA-biding zones in the ERA GTPase (Q2FY06) were analyzed using the InterPro database51, while detailed protein-ligand interaction data were obtained through the Protein-Ligand Interaction Profiler (PLIP)30.PLIP identifies eight types of non-covalent molecular interactions from 3D docking poses: hydrogen bonds, hydrophobic contacts, salt bridges, water bridges, metal complexes, π-stacking, π-cation interactions, and halogen bonds. Predicted aptamer–protein complexes obtained from docking simulations were analyzed with PLIP to map and quantify potential interaction residues and nucleotide bases. This profiling supported the KH-domain of ERA as the primary binding site for AptERA 2, outputs were visualized and inspected using PyMOL.
Data analysis
Statistical analysis was performed using one-way ANOVA with Dunnett’s multiple comparison test. P values are represented as follows: < 0.0001 (****, extremely significant), 0.0001 to 0.001 (***, extremely significant), 0.001 to 0.01 (**, very significant), 0.01 to 0.05 (*, significant), and ≥ 0.05 (ns, not significant). Results were visualized nad illustrated using GraphPad (Version 10; GraphPad Software, San Diego, CA, USA).
Data availability
All relevant data supporting the findings of this study are included in the manuscript and its Supplementary Information. Sequencing data have been deposited in the European Nucleotide Archive (ENA) at EMBL-EBI under accession number PRJEB86790. The motif localization analysis was performed using a custom Python script, available at https://github.com/nspereirab/APTs_Motifs. Additional methodological details are available upon request from the corresponding author.
References
-
Traub, P. & Nomura, M. Structure and function of Escherichia coli ribosomes. I. Partial fractionation of the functionally active ribosomal proteins and reconstitution of artificial subribosomal particles. J. Mol. Biol. 34, 575–593 (1968).
-
Traub, P. & Nomura, M. Structure and function of E. coli ribosomes. V. Reconstitution of functionally active 30S ribosomal particles from RNA and proteins. Proc. Natl. Acad. Sci. USA 59, 777–784 (1968).
-
Jomaa, A. et al. Understanding ribosome assembly: the structure of in vivo assembled immature 30S subunits revealed by cryo-electron microscopy. RNA 17, 697 (2011).
-
Gor, K. & Duss, O. Emerging quantitative biochemical, structural, and biophysical methods for studying ribosome and protein-RNA complex assembly. Biomolecules 13, 866 (2023).
-
Davis, J. H. et al. Modular assembly of the bacterial large ribosomal subunit. Cell 167, 1610-1622.e15 (2016).
-
Maiväli, Ü., Paier, A. & Tenson, T. When stable RNA becomes unstable: the degradation of ribosomes in bacteria and beyond. Biol. Chem. 394, 845–855 (2013).
-
Sharma, H. & Anand, B. Ribosome assembly defects subvert initiation Factor3 mediated scrutiny of bona fide start signal. Nucleic. Acids Res. 47, 11368–11386 (2019).
-
Bennison, D. J., Irving, S. E. & Corrigan, R. M. The impact of the stringent response on TRAFAC GTPases and prokaryotic ribosome assembly. Cells 8, 1313 (2019).
-
Karbstein, K. Role of GTPases in ribosome assembly. Biopolymers 87, 1–11 (2007).
-
Feng, B. et al. Structural and functional insights into the mode of action of a universally conserved Obg GTPase. PLoS Biol. 12, e1001866 (2014).
-
Strunk, B. S. & Karbstein, K. Powering through ribosome assembly. RNA 15, 2083–2104 (2009).
-
Vinogradova, D. S. et al. How the initiating ribosome copes with ppGpp to translate mRNAs. PLoS Biol. 18, e3000593 (2020).
-
Milon, P. et al. The nucleotide-binding site of bacterial translation initiation factor 2 (IF2) as a metabolic sensor. Proc. Natl. Acad. Sci. USA 103, 13962–13967 (2006).
-
Diez, S., Ryu, J., Caban, K., Gonzalez, R. L. & Dworkin, J. The alarmones (p)ppGpp directly regulate translation initiation during entry into quiescence. Proc. Natl. Acad. Sci. USA 117, 15565–15572 (2020).
-
Wood, A., Irving, S. E., Bennison, D. J. & Corrigan, R. M. The (p)ppGpp-binding GTPase Era promotes rRNA processing and cold adaptation in Staphylococcus aureus. PLoS Genet 15, e1008346 (2019).
-
Gruffaz, C. & Smirnov, A. GTPase Era at the heart of ribosome assembly. Front Mol Biosci 10, 1263433 (2023).
-
Inada, T. et al. Temperature-sensitive lethal mutant of era, a G protein in Escherichia coli. J Bacteriol 171, 5017–5024 (1989).
-
Minkovsky, N. et al. Bex, the Bacillus subtilis homolog of the essential Escherichia coli GTPase Era, is required for normal cell division and spore formation. J. Bacteriol. 184, 6389–6394 (2002).
-
Bourne, H. R., Sanders, D. A. & McCormick, F. The GTPase superfamily: conserved structure and molecular mechanism. Nature 349, 117–127 (1991).
-
Paduch, M., Jeleń, F. & Otlewski, J. Structure of small G proteins and their regulators. Acta Biochim. Pol. 48, 829–850 (2001).
-
Sharma, M. R. et al. Interaction of Era with the 30S ribosomal subunit implications for 30S subunit assembly. Mol. Cell 18, 319–329 (2005).
-
Tu, C. et al. The Era GTPase recognizes the GAUCACCUCC sequence and binds helix 45 near the 3′ end of 16S rRNA. Proc. Natl. Acad. Sci. USA 108, 10156–10161 (2011).
-
Tuerk, C. & Gold, L. Systematic evolution of ligands by exponential enrichment: RNA ligands to bacteriophage T4 DNA polymerase. Science 249, 505–510 (1990).
-
Bennison, D. J. et al. The stringent response inhibits 70S ribosome formation in staphylococcus aureus by impeding GTPase-ribosome interactions. MBio 12, e02679-e2721 (2021).
-
Jeddi, I. & Saiz, L. Three-dimensional modeling of single stranded DNA hairpins for aptamer-based biosensors. Sci. Rep. 7, 1–13 (2017).
-
Joseph, D. F. et al. DNA aptamers for the recognition of HMGB1 from Plasmodium falciparum. PLoS ONE 14, e0211756 (2019).
-
Alam, K. K., Chang, J. L. & Burke, D. H. FASTAptamer: A bioinformatic toolkit for high-throughput sequence analysis of combinatorial selections. Mol. Ther. Nucleic Acids 4, e230 (2015).
-
Kerpedjiev, P., Hammer, S. & Hofacker, I. L. Forna (force-directed RNA): Simple and effective online RNA secondary structure diagrams. Bioinformatics 31, 3377 (2015).
-
Yan, Y., Zhang, D., Zhou, P., Li, B. & Huang, S. Y. HDOCK: A web server for protein–protein and protein–DNA/RNA docking based on a hybrid strategy. Nucleic Acids Res. 45, W365 (2017).
-
Adasme, M. F. et al. PLIP 2021: expanding the scope of the protein–ligand interaction profiler to DNA and RNA. Nucleic Acids Res. 49, W530–W534 (2021).
-
Sujith, S. et al. Aptamers: precision tools for diagnosing and treating infectious diseases. Front Cell Infect Microbiol 14, 1402932 (2024).
-
Firpo, M. A., Connelly, M. B., Goss, D. J. & Dahlberg, A. E. Mutations at two invariant nucleotides in the 3’-minor domain of Escherichia coli 16 S rRNA affecting translational initiation and initiation factor 3 function. J Biol Chem 271, 4693–4698 (1996).
-
Svoboda, P. & Di Cara, A. Hairpin RNA: A secondary structure of primary importance. Cell. Mol. Life Sci. 63, 901–918 (2006).
-
Bikard, D., Loot, C., Baharoglu, Z. & Mazel, D. Folded DNA in action: hairpin formation and biological functions in prokaryotes. Microbiol. Mol. Biol. Rev. 74, 570–588 (2010).
-
Hirao, I., Madin, K., Endo, Y., Yokoyama, S. & Ellington, A. D. RNA aptamers that bind to and inhibit the ribosome-inactivating protein, pepocin. J. Biol. Chem. 275, 4943–4948 (2000).
-
Pant, P. Flexible RNA aptamers as inhibitors of Bacillus anthracis ribosomal protein S8: Insights from molecular dynamics simulations. Biophys. Chem. 312, 107273 (2024).
-
Hons, M., Niebel, B., Karnowski, N., Weiche, B. & Famulok, M. Pan-selective aptamers for the family of small GTPases. ChemBioChem 13, 1433–1437 (2012).
-
Zhang, N. et al. Structural biology for the molecular insight between aptamers and target proteins. Int. J. Mol. Sci. 22, 4093 (2021).
-
Lokesh, G. L. et al. X-aptamer selection and validation. Methods Mol. Biol. 1632, 151–174 (2017).
-
Afgan, E. et al. The Galaxy platform for accessible, reproducible and collaborative biomedical analyses: 2018 update. Nucleic Acids Res. 46, W537–W544 (2018).
-
Kramer, S. T., Gruenke, P. R., Alam, K. K., Xu, D. & Burke, D. H. FASTAptameR 2.0: A web tool for combinatorial sequence selections. Mol. Ther. Nucleic Acids 29, 862–870 (2022).
-
Madeira, F. et al. The EMBL-EBI job dispatcher sequence analysis tools framework in 2024. Nucleic Acids Res. 52, W521–W525 (2024).
-
Katoh, K. & Standley, D. M. MAFFT multiple sequence alignment software version 7: improvements in performance and usability. Mol. Biol. Evol. 30, 772–780 (2013).
-
Waterhouse, A. M., Procter, J. B., Martin, D. M. A., Clamp, M. & Barton, G. J. Jalview version 2—a multiple sequence alignment editor and analysis workbench. Bioinformatics 25, 1189–1191 (2009).
-
Corrigan, R. M., Bellows, L. E., Wood, A. & Gründling, A. PpGpp negatively impacts ribosome assembly affecting growth and antimicrobial tolerance in Grampositive bacteria. Proc. Natl. Acad. Sci. USA 113, E1710–E1719 (2016).
-
Gruber, A. R., Lorenz, R., Bernhart, S. H., Neuböck, R. & Hofacker, I. L. The vienna RNA websuite. Nucleic Acids Res. 36, W70–W74 (2008).
-
Popenda, M. et al. Automated 3D structure composition for large RNAs. Nucleic Acids Res. 40, e112–e112 (2012).
-
Sarzynska, J., Popenda, M., Antczak, M. & Szachniuk, M. RNA tertiary structure prediction using RNAComposer in CASP15. Prot.: Struct., Funct., Bioinf. 91, 1790–1799 (2023).
-
Zhang, Y., Xiong, Y. & Xiao, Y. 3dDNA: A computational method of building DNA 3D structures. Molecules 27, 5936 (2022).
-
Jumper, J. et al. Highly accurate protein structure prediction with AlphaFold. Nature 596, 583–589 (2021).
-
Paysan-Lafosse, T. et al. InterPro in 2022. Nucleic Acids Res. 51, D418–D427 (2023).
Acknowledgements
We are thankful to the Milon, Spurio, and Corrigan laboratories for their scientific climate. This research was supported by the Concytec Prociencia program grant PE501079419-2022 (to P.M.). This work has received funding from the European Union’s Horizon 2020 research and innovation programme under the Marie Sklodowska-Curie Grant Agreement No. 872869 (to P.M. and R.S.). The work was also supported by a Sir Henry Dale Fellowship jointly funded by the Wellcome Trust and the Royal Society, grant number (104110/Z/14/A) (to R.M.C.); a Lister Institute Research Prize 2018 (to R.M.C.); and O.S. is funded by a BBSRC DTP studentship (grant BB/T007222/1). Open access costs are funded by the Universidad Peruana de Ciencias Aplicadas (UPC) to K.P.
Ethics declarations
Competing interests
The authors declare no competing interests.
Additional information
Publisher’s note
Springer Nature remains neutral with regard to jurisdictional claims in published maps and institutional affiliations.
Supplementary Information
Rights and permissions
Open Access This article is licensed under a Creative Commons Attribution-NonCommercial-NoDerivatives 4.0 International License, which permits any non-commercial use, sharing, distribution and reproduction in any medium or format, as long as you give appropriate credit to the original author(s) and the source, provide a link to the Creative Commons licence, and indicate if you modified the licensed material. You do not have permission under this licence to share adapted material derived from this article or parts of it. The images or other third party material in this article are included in the article’s Creative Commons licence, unless indicated otherwise in a credit line to the material. If material is not included in the article’s Creative Commons licence and your intended use is not permitted by statutory regulation or exceeds the permitted use, you will need to obtain permission directly from the copyright holder. To view a copy of this licence, visit http://creativecommons.org/licenses/by-nc-nd/4.0/.
About this article

Cite this article
Peñaranda, K., Pereira, N., Savva, O. et al. DNA aptamer AptERA 2 targets ERA from Staphylococcus aureus and limits GTP hydrolysis. Sci Rep 15, 30879 (2025). https://doi.org/10.1038/s41598-025-15180-9
-
Received:
-
Accepted:
-
Published:
-
DOI: https://doi.org/10.1038/s41598-025-15180-9