
Introduction
The interaction between mitochondria and lysosomes regulates multiple cellular life activities such as organelle dynamics and cellular metabolism1,2,3. Under physiological and pathological conditions, mitochondria and lysosomes frequently establish transient contacts, which are also known as mitochondrial-lysosomal contacts (MLCs), enabling the inter-organelle exchange of lipids, proteins, ions and other molecules, as well as triggering mitochondrial fission4,5,6.
The interaction between mitochondria and lysosomes confers not only determinant factors that affects cellular functions, but also associate with many diseases. Defective mitochondria-lysosome interplay is often related to the dysfunction of both organelles, which bring about various human diseases7,8, including Charcot Marie Tooth Type 29, neurodegenerative diseases10,11,12, lysosomal storage disease13 and cancer14. Therefore, it is important for cell regulation and disease therapy that develop a method to manipulate mitochondria-lysosome interactions in a controllable manner in living cells15,16. As a typical example, Qiu et al. developed a light-induced MLCs system by using optogenetic tool17. The blue-light-sensitive heterodimerizer, cryptochrome (CRY2) and the N-terminal cryptochrome-interacting basic-helix-loop-helix (CIB), were fused to lysosome-associated membrane protein and outer mitochondrial membrane, respectively. Blue light illumination triggers CRY2-CIB dimer formation and MLCs, which could be used to restore the mitochondrial functions in mutant cells. However, this optogenetic ensemble requires in vivo expression of the recombinant light-sensitive protein, which is a complicated, time-consuming and uncontrollable process. While the recombinant light-sensitive proteins exhibit exceptional precision and conformational stability, the large molecular weight may potentially disturb the structures and functions of mitochondria and lysosome18. In this report, we will introduce a kind of DNA regulator to fill in this gap.
DNA possesses programmability, addressability and near-atomic structural accuracy19. By employing the simple principle of base complementary pairing, DNA nanostructures with diverse morphologies, sizes and dynamic response can be constructed20, showing superior stability under physiological environments21,22. These advantages, in conjunction with the inherent biocompatibility and biodegradability of DNA materials23, confer advantages over other materials for in vivo applications. The modification with targeting units enables them to precisely localize in subcellular organelles for application in cell regulation and therapy24,25,26. For example, a series of DNA nanostructures with mitochondria-targeting units have been designed in vitro for mitochondrial regulation in living cells and precise therapy27,28,29. Nevertheless, so far the DNA nanostructures have limited for just one type of organelle regulation, which have not been used for manipulating two or more kinds of organelle interactions.
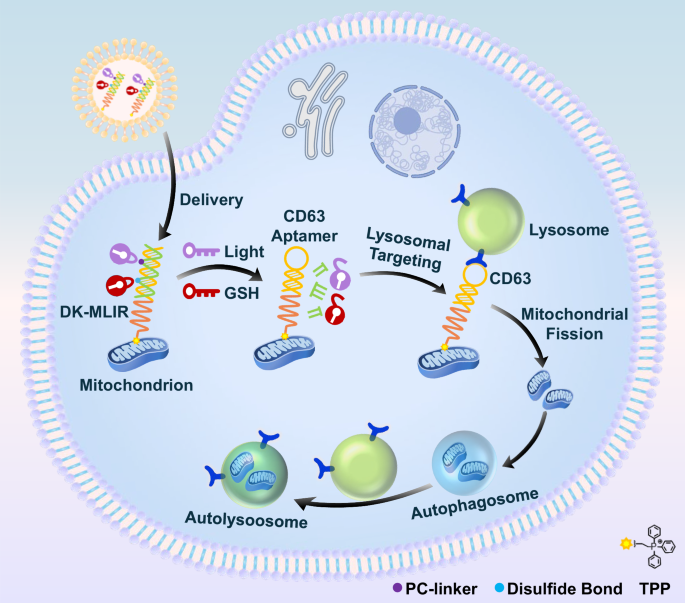
In this study, we designed a series of DNA regulators that can target both lysosomes and mitochondria to control their contact and interaction in living cells. One Key-activated Mitochondria-Lysosome Interactions Regulator (OK-MLIR) was developed through the integration of DNA nanoswitch with a mitochondrial targeting unit (TPP), and a blocked aptamer (CD63 aptamer) for triggering mitochondria and lysosome association after ultraviolet irradiation cleavage of the photocleavable nitrobenzyl linker (PC-Linker). By further introducing disulfide bond structure into OK-MLIR, the Dual Key-activated Mitochondria-Lysosome Interactions Regulator (DK-MLIR) was achieved, which could be cooperatively activated by UV light and endogenous glutathione (GSH) to release CD63 aptamer for lysosomal targeting and and mitochondria-lysosome interactions regulation (Fig. 1). In addition, we have demonstrated the DNA regulators system can be used for cell metabolism manipulation and precise treatment.

After cellular internalization, the mitochondria-lysosome interaction regulator (DK-MLIR) binds mitochondria via TPP moiety. Then the DK-MLIR was cooperatively activated by light and endogenous glutathione (GSH) to form CD63 aptamer for lysosomal targeting and mitochondria-lysosome interactions regulation, resulting in mitochondrial fission and autophagy.
Results
Design and characterization of OK-MLIR system
CD63 that widely expressed on lysosomal membranes has been used as a special receptor for mediating lysosomal targeting30. The lipophilic triphenylphosphonium (TPP) cation has been extensively applied for specifically targeting and binding mitochondria31,32. A DNA strand (CD63APT) modified with an azide group on one end was comprised by DNA aptamer sequences against CD63 and repeated Thymine sequences, which was applying to construct Mitochondria-Lysosome Interactions Regulator (OK-MLIR). CD63APT was chemically conjugated with alkynyl modified TPP (alkynyl-TPP) through a copper-catalyzed azide-alkyne cycloaddition reaction (Supplementary Fig. 1). The sequence of CD63 aptamer could be locked by a pair of partially complementary single-stranded DNA (B1, B2 modified with a PC-Linker). Upon UV light illumination, the PC-Linker was cleaved, resulting in the B2 break into two short DNA fragments and disassociation from CD63 aptamer. Then, the activity of CD63 aptamer was recovered for binding CD63 due to the reduction of blocked DNA sequences, leading to the B1 release and lysosomal targeting (Fig. 2a).

a Schematic illustration of the structure and light triggered OK-MLIR binding with mitochondrion. b Native PAGE (10 wt%) analysis of the assembly and light-triggered activation of OK-MLIR. Lanes 1–6 represent: DNA ladder marker, B1, B2, CD63APT-TPP, OK-MLIR, and OK-MLIR with 10-min UV light treatment, respectively. c Confocal fluorescence images of HeLa cells transfected without (Blank) and with CD63APT-TPP, CD63APT or R1-TPP (180 nM). MitoRed and FAM were excited with 579 nm and 494 nm lasers, respectively. Scale bar: 25 µm. d Pearson Correlation analysis of (c) by investigating the fluorescence signals of FAM and mitochondria (MitoRed). Shown are mean ± standard error the mean (SEM) from ten individual cells. (CD63APT-TPP vs CD63APT, P = 6.01 × 10⁻¹³ and CD63APT vs R1-TPP, P = 8.44 × 10⁻¹², ****P < 0.0001, two-tailed Student’s t test). e Confocal fluorescence images of HeLa cells treated without (Blank), and with CD63APT, OK-MLIR, or OK-MLIR (180 nM) in presence of 10-min UV irradiation. LysoTracker and FAM were excited with 580 nm and 494 nm lasers, respectively. Scale bar: 10 µm. f Pearson Correlation analysis of (e) by investigating the fluorescence signals of LysoTracker and FAM. Shown are mean ± SEM from ten individual cells. (OK-MLIR vs OK-MLIR (UV), P = 9.74 × 10⁻¹¹, ****P < 0.0001, two-tailed Student’s t test). Image representation of 3 experiments. Source data are provided as a Source Data file.
The nuclear magnetic resonance spectra demonstrated that TPP was successfully modified with alkynyl (Supplementary Figs. 2, 3). We then verified the successful synthesis of TPP modified CD63APT (CD63APT-TPP) by using mass spectrometry (MS, Supplementary Fig. 4) and native polyacrylamide gel electrophoresis (PAGE, Supplementary Fig. 5), and the yield nearly reach to 80%. After mixture of CD63APT-TPP, B1 and B2 with equal ratio, the OK-MLIR was assembled, which can be activated and dissociated apart with the B2 sequences upon UV light irradiation (Fig. 2b).
Confocal laser scanning microscopy imaging was used to verify the UV light activated mitochondrial targeting ability of the OK-MLIR system. We assessed the mitochondrial targeting of TPP. The CD63APT was labeled with 6-carboxyfluorescein (FAM) and mitochondria were stained with MitoRed. After modification of CD63APT with TPP (CD63APT-TPP), the value of Pearson’s correlation (or Manders’ coefficient) was increased from 0.23 to 0.68 (or from 0.32 to 0.86), indicating that the colocalization between MitoRed and FAM was enhanced. Furthermore, R1-TPP that synthesized by a random DNA sequence (R1) with the same base number of CD63APT displayed the similar mitochondrial targeting efficacy as CD63APT-TPP (Pearson’s correlation: 0.60; Manders’ coefficient: 0.76 (Fig. 2c, d; Supplementary Fig. 6). All these results demonstrated that TPP cation can specifically bind to mitochondria without interference by DNA sequences33,34. Furthermore, the higher signal overlaps were found between CD63 aptamer and lysosomes, indicating the specificity of CD63 for lysosomal targeting (Supplementary Fig. 7). To further confirm the targeting capacity of the CD63 aptamer, we used the antibodies EEA1 and RAB7 to recognize the early and late endosomes, respectively. Immunofluorescence analysis demonstrated that the CD63 aptamer exhibited the higher recognization ability for late endosomes than early endosomes (Supplementary Fig. 8). This is because the higher CD63 protein expression on late endosomes and lysosomes than on early endosomes35,36. To investigate weather the transfected DNA probes could be sequestrated and degraded within lysosomes, the chloroquine that can disrupt the lysosomal acidification and enzymatic activity was used to treat cells for inhibiting the lysosomal degradation of DNA probes37,38. Quantitative Real-time polymerase chain reaction (Qpcr) analysis revealed that no significance change of CD63 content was observed in cells upon treatment with chloroquine (Supplementary Fig. 9), indicating there is no DNA sequestration and degradation within lysosomes. Then the FAM-labeled CD63APT-TPP was used to construct the OK-MLIR. After the lysosomes were stained with LysoTracker, the poor colocalization between FAM and LysoTracker with a value of Pearson’s Correlation less than 0.4 was observed in cells transfected with OK-MLIR. The coefficient was increased to 0.7 when the transfected cell was subjected to 10-min UV irradiation, indicating the effective lock of CD63APT by B1 and B2, and the optically controlled activation of OK-MLIR for lysosomal targeting (Fig. 2e, f). With the increasing OK-MLIR concentrations, the lysosomal targeting capability of photo-activated OK-MLIR was enhanced, which was saturated until OK-MLIR at 180 nM (Supplementary Fig. 10), suggesting the optimal OK-MLIR concentration for cell incubation.
Performance evaluation of OK-MLIR system in living cells
Next, we evaluated the OK-MLIR system for mediating the interaction between lysosomes and mitochondria in Human cervix carcinoma (HeLa) cells. Compared to the cells transfected with (OK-MLIR) and without OK-MLIR (Blank), the former then illuminated with UV-light exhibited a higher overlap of MitoTracker Green and LysoTracker signals, which is similar with the cells transfected with unlocked CD63APT-TPP (Supplementary Fig. 11). In addition, the colocalization between mitochondria and lysosomes was increased with extended irradiation time, with maximum value of Pearson’s Correlation and Manders’ coefficient observed after 10 min (Supplementary Fig. 12). We have studied the effect of incubation time on the mitochondria-lysosome interacting regulation. The optimal colocalization was achieved at 12 h incubation after UV light irradiation (Supplementary Fig. 13).
To further verify the interactions of mitochondria and lysosome induced by photo-activated OK-MLIR, co-staining experiment was performed by staining lysosomes with LysoBlue and mitochondria with MitoRed. The OK-MLIR only activated with UV light was co-localized well with lysosomes and mitochondria respectively, which is consistent with the colocalization of mitochondria and lysosome, certifying the controllability and effectiveness of OK-MLIR for regulating mitochondria and lysosome interactions (Fig. 3a, b; Supplementary Fig. 14). By using super-resolution structured illumination microscopy (SIM), we found that the percentage of mitochondria and lysosomes contacts (MLCs) in OK-MLIR transfected cells increased from 20 to 50% (Fig. 3c; Supplementary Fig. 15), while almost on change was observed in cells only treated with 10-min UV irradiation (Supplementary Fig. 16). In addition, the percentage of fragmented mitochondria was also enhanced (Supplementary Fig. 17) in OK-MLIR transfected cells under light illumination, certifying that the direct contacts between mitochondria and lysosome promoted mitochondrial fission17. We also observed that most of MLCs were not merely membrane touches but mutual fusion (Fig. 3c), indicative of the mitochondrial autophagy39. Bio-TEM imaging further revealed that the mitochondrial fragment and mitophagosome were increased in cells after transfected with OK-MLIR and light irradiation (Fig. 3d). All these results suggested that the photo-activated OK-MLIR system was enabled to modulate mitochondrial fission and autophagy.

a Confocal fluorescence images of HeLa cells transfected without (Blank), and with 180 nM CD63APT-TPP, OK-MLIR and OK-MLIR in presence of 10-min UV irradiation. Scale bar: 30 µm. MitoRed, LysoBlue and FAM were excited with 579, 373 and 494 nm lasers, respectively. b Pearson Correlation analysis of (a) by investigating the fluorescence signals of MitoRed and LysoBlue. Shown are mean ± SEM from ten individual cells. (Blank vs CD63APT-TPP, P = 5.45 × 10⁻¹⁶ and OK-MLIR vs OK-MLIR (UV), P = 3.00 × 10⁻¹¹, ****P < 0.0001, two-tailed Student’s t test). c Super-resolution images of HeLa cells transfected without (Blank), and with 180 nM CD63APT-TPP, OK-MLIR and OK-MLIR in presence of 10-min UV irradiation. MitoTracker Green and LysoTracker were excited with 490 and 580 nm lasers, respectively. Scale bar: 10 µm. d TEM images of HeLa cells (Blank) and HeLa cells treated with 180 nM CD63APT-TPP, OK-MLIR and OK-MLIR in presence of 10-min UV irradiation. Scale bar: 5 µm. e Confocal images of HeLa cells (Blank) and HeLa cells treated with 180 nM CD63APT-TPP, OK-MLIR, and OK-MLIR in presence of 10-min UV irradiation. MtphagyDye, LysoDye and MitoBright DeepRed were used for staining mitochondrial autophagy, lysosomes, and mitochondria, respectively. Scale bar: 50 µm. f Confocal immunofluorescence staining images of HeLa cells treated without (Blank) and with 180 nM CD63APT-TPP, OK-MLIR and OK-MLIR in presence of 10-min UV irradiation., then labeled with COXIV antibody (green) and DAPI (blue). Scale bar: 100 µm. g Corresponding green fluorescence intensities were extracted from (f) for quantitative analysis. Shown are mean ± SEM from ten individual cells. (Blank vs CD63APT-TPP, P = 6.70 × 10⁻⁹ and OK-MLIR vs OK-MLIR (UV), P = 7.31 × 10⁻⁷, ****P < 0.0001, two-tailed Student’s t test). h Western blot map of TOMM20 protein in HeLa cells treated without (Lane 1) and with CD63APT-TPP (2), OK-MLIR (3), and OK-MLIR in presence of 10-min UV irradiation (4). Image representation of 3 experiments. Source data are provided as a Source Data file.
Next, we utilized the mitochondrial autophagy dye (MtphagyDye) to confirm that the contacts of lysosomes and mitochondria could give rise to mitophagy. After 10-min light irradiation, the obvious red fluorescence signal from MtphagyDye was observed in cells transfected with OK-MLIR. As a control, the cell transfected with OK-MLIR in absence of light irradiation demonstrated little signal of mitophagy dye, which is similar to cells without the transfection (Blank) (Fig. 3e; Supplementary Fig. 18a). The fluorescence signals of MtphagyDye were consistent with the colocalization of lysosomes (stained with LysoDye) and mitochondria (stained with MitoBright DeepRed) (Supplementary Fig. 18b, c). Together, these results indicated that OK-MLIR can be used for facilitating mitophagy upon UV light exposure in transfected cells. We used immunofluorescence imaging to monitor mitophagy in the absence or presence of light illumination (Fig. 3f, g). The fluorescence signal of outer mitochondrial membrane protein (TOMM20) in vivo with OK-MLIR was decreased after light illumination, which is consistent with the Western blot assay (Fig. 3h; Supplementary Fig. 19), indicating the light-activated OK-MLIR induced mitophagy. Immunofluorescence analysis revealed that the autophagosomal membrane marker of LC3B was redistributed from a diffuse distribution into a punctate pattern after cells treatment with the photo-activated OK-MLIR or CD63APT-TPP (Supplementary Fig. 20a). Western blot assay showed that the ratio of LC3B-II to LC3B-I in cell treated with photo-activated OK-MLIR or CD63APT-TPP was significantly increased, confirming the occurrence of autophagy (Supplementary Fig. 20b).
Performance evaluation of DK-MLIR system in living cells
To achieve more precise regulation of mitochondria and lysosome interactions, we utilized PC-Linker and disulfide modified single-stranded DNA (ssDNA, B3, Supplementary Table 1) to lock CD63APT-TPP for constructing DK-MLIR, which only could be synergistically activated in presence of dual keys of UV light and GSH (Fig. 4a). PAGE confirmed the successful construction of DK-MLIR. Notably, B3 could be completely degraded only upon dual keys (UV light and GSH) cooperative cleavage, which induced the release of CD63APT-TPP (Supplementary Fig. 21). The DK-MLIR displayed good stability with 64% remained after incubation in 10 wt% fetal bovine serum (FBS) for 24 h (Supplementary Fig. 22).

a Schematic illustration of the structure and dual keys triggered DK-MLIR activation for mitochondrial binding. b Confocal images of lysosomes (LysoTracker) and mitochondria (MitoTracker Green) in HeLa cells treated without (Blank) and with 180 nM DK-MLIR (the DK-MLIR row), 180 nM DK-MLIR in presence of 100 µM BSO and 10-min UV irradiation (BSO + UV), 180 nM DK-MLIR in presence of 100 µM BSO (BSO), and DK-MLIR in presence of 10-min UV irradiation (UV). MitoTracker Green and LysoTracker were excited with 490 and 580 nm lasers, respectively. Scale bar: 50 µm. c Pearson Correlation analysis was performed on the red and green fluorescence in (b). Shown are mean ± SEM from ten individual cells. (Blank vs UV, P = 1.72 × 10⁻¹³, ****P < 0.0001, two-tailed Student’s t test). d Confocal immunofluorescence images of HeLa cells treated without (Blank) and with 180 nM DK-MLIR (DK-MLIR), 180 nM DK-MLIR in presence of 100 µM BSO and 10-min UV irradiation (BSO + UV), 180 nM DK-MLIR in presence of 100 µM BSO (BSO), and DK-MLIR in presence of 10-min UV irradiation (UV); and then labeled with COXIV antibody (green) and DAPI (blue). Scale bar: 60 µm. e Green fluorescence intensity was extracted from (d) for quantitative analysis. Shown are mean ± SEM from ten individual cells. (Blank vs UV, P = 6.90 × 10⁻¹⁶, ****P < 0.0001, two-tailed Student’s t test). f Western Blot map of TOMM20 and COXIV proteins in HeLa cells treated with 180 nM DK-MLIR in presence of 100 µM BSO (Lane 1), 180 nM DK-MLIR (2), 180 nM DK-MLIR in presence of 10-min UV irradiation (3), and 180 nM DK-MLIR in presence of 100 µM BSO and 10-min UV irradiation (4). Image representation of 3 experiments. Source data are provided as a Source Data file.
We then assessed the feasibility of the DK-MLIR system in living cells. Confocal microscopy revealed that the strongest fluorescence overlaps of LysoTracker Red and MitoTracker Green could be observed only when the UV irradiation was applied in DK-MLIR transfected cells, indicating enhanced mitochondria and lysosome interactions. In contrast, the poor colocalization was exhibited in cells activated with only GSH, or UV-irradiated but GSH was inhibited with BSO (Fig. 4b, c). The interactions of mitochondria and lysosome were closely correlated with the colocalization of DK-MLIR and lysosomes, indicating DK-MLIR could be only activated in presence of both UV irradiation and GSH for lysosomal targeting, as well as mitochondria-lysosomes interacting regulation (Supplementary Fig. 23). We subsequently tested the expression level of TOMM20 protein and mitochondrial matrix protein (i.e., cytochrome c oxidase subunit 4, COXIV) by immunofluorescence. Compared with the situations under either UV light or GSH treatment, the cell transfected with DK-MLIR demonstrated significant reduction of TOMM20 (Supplementary Fig. 24) and COXIV expression (Figs. 4d, e) upon UV exposure and GSH treatment, similar to the results from Western blotting (Fig. 4f; Supplementary Fig. 25), suggesting DK-MLIR could only be cooperatively activated by UV light and GSH for precisely regulating mitophagy, leading to the elimination of damaged mitochondria and decrease in TOMM20 and COXIV expression levels40,41,42.
Precise manipulation of target cells by DK-MLIR
Reactive oxygen species (ROS) are mainly generated within mitochondria, and their levels in cells are affected by the mitochondrial morphology and dynamics43. Therefore, we tested the influences of DK-MLIR system on ROS production. As shown in Fig. 5a, a marked enhancement of ROS was observed in DK-MLIR transfected HeLa cell in presence of UV radiation and GSH treatment. As a control, there are no noticeable changes of ROS in DK-MLIR transfected HeLa cells upon activation only with UV (BSO + UV) or GSH (DK-MLIR), verifying the high precise of DK-MLIR for controlling ROS generation. Flow cytometric analysis also confirmed that DK-MLIR could be cooperatively activated with dual keys for regulating intracellular ROS levels (Fig. 5b). We also measured the mitochondrial membrane potential (MMP) by using the JC-1 dye. The fluorescence signals of JC-1 aggregate and JC-1 monomer were respectively decreased and increased upon the activation of DK-MLIR treated HeLa cells by UV and GSH. This phenomena is similar to cells treated with carbonyl cyanide m-chlorophenylhydrazone (CCCP) that could induce mitochondrial fragmentation (Fig. 5c), suggesting the activated DK-MLIR induced the fragmented mitochondrial augmentation and MMP reduction. In addition, the ATP contents were reduced only when the DK-MLIR transfected HeLa treated with both UV and GSH (Fig. 5d). We also found that the transfection reagents and UV-irradiation have negligible effects on MMP and ROS in HeLa cells compared with cells without treatment (Blank) (Supplementary Fig. 26). In contrast, there is almost no change in the ROS (Supplementary Fig. 27), MMP (Supplementary Fig. 28) and ATP (Fig. 5e) from the DK-MLIR transfected normal mouse liver cells (AML-12) that expressed low concentration of GSH. These results together demonstrated that DK-MLIR can be used for precisely manipulating metabolism of target cells.

a, b Confocal images and flow cytometric assay of intracellular ROS levels in HeLa cells treated without (Blank) and with 180 nM DK-MLIR (DK-MLIR), 180 nM DK-MLIR in presence of 100 µM BSO and 10-min UV irradiation (BSO + UV), 180 nM DK-MLIR in presence of 100 µM BSO (BSO), and DK-MLIR in presence of 10-min UV irradiation (UV). Scale bar: 100 µm. c Mitochondrial membrane potential of HeLa cells treated without (Blank) and with 10 μM CCCP (CCCP), 180 nM DK-MLIR, 180 nM DK-MLIR in presence of 100 µM BSO and 10-min UV irradiation (BSO + UV), 180 nM DK-MLIR in presence of 100 µM BSO (BSO), and DK-MLIR in presence of 10-min UV irradiation (UV). Scale bar: 50 µm. d, e ATP levels in HeLa cells and AML-12 cells treated without (Blank) and with 180 nM CD63APT-TPP (CD63APT-TPP), 180 nM DK-MLIR (DK-MLIR), 180 nM DK-MLIR in presence of 100 µM BSO and 10-min UV irradiation (BSO + UV), 180 nM DK-MLIR in presence of 100 µM BSO (BSO), and DK-MLIR in presence of 10-min UV irradiation (UV). Shown are mean ± SEM (n = 3 biologically independent samples). (HeLa, Blank vs CD63APT-TPP, P = 1.86 × 10⁻⁵ and Blank vs UV, P = 6.35 × 10⁻⁵; AML-12, Blank vs CD63APT-TPP, P = 0.00846 and Blank vs UV, P = 0.291; ****P < 0.0001, **P < 0.01, NS: not significant, two-tailed Student’s t test). f, g The viability assays of HeLa cells and AML-12 cells treated without (Blank) and with 180 nM CD63APT-TPP (CD63APT-TPP), 180 nM DK-MLIR (DK-MLIR), 180 nM DK-MLIR in presence of 100 µM BSO and 10-min UV irradiation (BSO + UV), 180 nM DK-MLIR in presence of 100 µM BSO (BSO), and DK-MLIR in presence of 10-min UV irradiation (UV). Shown are mean ± SEM (n = 3 biologically independent samples). (HeLa, Blank vs UV, P = 0.0004; AML-12, Blank vs UV, P = 0.0101; ***P < 0.001, *P < 0.1, two-tailed Student’s t test). Image representation of 3 experiments. Source data are provided as a Source Data file.
Because enhancement of MLCs affected mitochondrial metabolism and dynamics, we hypothesized that the DK-MLIR system could be used for regulating cell migration. To address this, we treated the DK-MLIR transfected HeLa cells with light irradiation and GSH prior to the migration assay. As shown in Supplementary Fig. 29, the Hela cell migration was markedly suppressed upon DK-MLIR activation with dual keys for 24 h, demonstrating the feasibility of DK-MLIR for cytokinetic regulation. We next conducted MTT assays and found that after activation of DK-MLIR system for 24 h, the HeLa cell proliferation decreased about 50% at 180 nM DK-MLIR (Fig. 5f), and the cell proliferation inhibition was dose-dependent (Supplementary Fig. 30a). In contrast, the proliferation of AML-12 cells was almost unaffected (Fig. 5g; Supplementary Fig. 30b), suggesting that the DK-MLIR system could be cooperatively activated by dual keys and used for inhibiting target cancer cell proliferation.
Discussion
Here, we described a serial DNA-based programmable regulators to precisely regulate the interaction between lysosomes and mitochondria in living cells. One unique feature of this DNA-based platform is that, it could be modularly designed and activated by various endogenous and exogenous stimuli. In this study, we have constructed the One Key-activated Mitochondria-Lysosome Interactions Regulator (OK-MLIR) and Dual Key-activated Mitochondria-Lysosome Interactions Regulator (DK-MLIR), and showed that both of them can be spatiotemporal controlled to perform MLCs manipulation. Similarly, based on aptamer switches and DNA logic circuits44,45, RNAs, proteins and small molecular metabolites can also be incorporated as the stimuli to operate logic analysis and then make a regulation decision.
The contacts of mitochondria and lysosomes mediate mitochondrial fission4. We have also demonstrated that these DNA-based regulators can be used for modulating mitochondrial fission. Compared with the genetically encoded proteins based optogenetic strategy17, the OK-MLIR and DK-MLIR have high programmability, facile bioavailability, and lower interference to organelle. In addition, our results further verified the ability of DNA-based regulators in manipulating mitochondrial metabolism and autophagy (Figs. 3 and 4), which provide potential tools for studying the functions and interactions of organelles.
Mitochondrial morphology and dynamics are closely related to cellular metabolism, dynamics and functions46,47,48. Mitophagy that can remove damaged or dysfunctional mitochondria is fundamental to maintain mitochondrial and cellular homeostasis49. Mitophagy impairment may led to several of diseases, such as cancers, cardiovascular and neurodegenerative diseases50,51, etc. Therefore, the modulation of mitophagy has become a promising approach for diseases treatment7. We also have validated the effectiveness of applying DK-MLIR for regulating the metabolism (Fig. 5a–d), migration (Supplementary Fig. 29) and proliferation (Fig. 5f) of target cancer cells, whereas the normal cells were unaffected (Fig. 5e, g and Supplementary Figs. 27, 28). Compared with small-molecule mitophagy activators52, the DK-MLIR has better biocompatibility and specificity, which offers a potential tool for pertinent precision disease treatment.
In summary, we have developed a general platform for controlling mitochondria-lysosome interactions in living cells by use of activatable DNA-based regulators. These DNA-based regulators could be applied for facilitating mitochondrial fission and autophagy, as well as manipulating cell migration and proliferation. We envision that the modular, programmable, and spatiotemporal controlled DNA-based regulators can be widely used for studying organelle interactions, regulating cellular metabolism, and treating mitophagy dysfunction-related diseases.
Methods
Reagents
All chemicals were purchased from Sigma unless otherwise noted. Commercial reagents are used as-received without further purification. Mitophagy Detection Kit was purchased from Tonne Chemical Co., LTD. (Kyushu, Japan). ATP assay kit, mitochondrial membrane potential assay kit, as well as MTT cell proliferation, cytotoxicity assay kit, LC3B Rabbit Polyclonal Antibody, RAB7 Rabbit Monoclonal Antibody and Alexa Fluor 647 labeling goat anti rabbit IgG (H + L) were purchased from Biyun Tian Biotechnology Co., LTD. (Shanghai, China). Lipofectamine 3000 were purchased from Thermo Fisher Scientific Co., LTD. (Shanghai, China). COXIV polyclonal antibody was purchased from Sanying Biotechnology Co., LTD. (Wuhan, China). TOMM20 polyclonal antibody was obtained from Zhengneng Biology (Chengdu, China). Electrochemiluminescence (ECL) Plus hypersensitive luminescent solution, goat anti-rabbit immunoglobulin (IgG, H + L) and FITC-labeled goat anti-rabbit IgG (H + L) antibodies were purchased from Yfxbio Biotech. Co., LTD. (Nanjing, China). FBS, glucose, agarose, 40% polyacrylamide, N,N,N’,N’-Tetramethylethylenediamine, Ammonium Persulfate, QPCR reagent kit and all DNA were from Sangon Biotechnology Co., LTD. (Shanghai, China). EEA1 Rabbit mAb were purchased from Cell Signaling Technology (Boston, USA). Chloroquine were purchased from Macklin Biochemical Co., Ltd. (Shanghai, China). The detailed DNA sequences were shown in Supplementary Table 1. All aqueous solutions were prepared by ultra-pure water (18.2 MU cm, Milli-Q, Millipore).
Apparatus
The concentrations of nucleic acids were measured with a NanoDrop one UV-vis spectrophotometer. The gel electrophoresis was performed on a Tanon EPS-300 Electrophoresis Analyser (Tanon Science & Technology Company, China) and imaged on a Bio-rad ChemDoc XRS (Bio-Rad, USA). All the intracellular images were taken by a Nikon A1 & SIM-S & STORM super-resolution microscope (Tokyo, Japan). Cell migration was photographed using Nikon ECLIPSE Ti2-A (Tokyo, Japan). Matrix-Assisted Laser Desorption/Ionization Time-of-Flight Mass Spectrometry (MALDI-TOF MS) was carried out by ABSCIEX MALDI TOF-TOF 4800 plus. MTT assays were measured with a Safire microplate Analyzer (Molecular Devices, America). Bio-TEM Tecnai G2 Spirit Biotwin (Hillsboro, America).
Synthesis of alkynyl TPP cation (but-3-yn-1-yltriphenylphosphonium)
Triphenylphosphine (520 mg, 2 mmol) and 4-bromobutyne (400 mg, 3 mmol) were dissolved in acetonitrile (20 ml). The reaction mixture was heated to 80 °C for 72 h under nitrogen. The solvent was removed at room temperature followed by addition of benzene (80 ml). The resulting mixture was cooled to −20 °C for 0.5 h and the product was filtered off as white solid.
Synthesis of CD63APT-TPP and R1-TPP
50 μl of 100 mM CD63APT (or R1) and 2 μl of 5 mM alkynyl TPP cation (dissolved in dimethyl sulfoxide, DMSO) were mixed in a lightproof 1 ml PVC tube. Then 74 μl of DMSO and 12 μl of ultrapure water were added. After addition of 10 μl of 50 mM sodium ascorbate and 12 μl of 10 mM CuSO4 to initiate cycloaddition reaction and incubation for 12 h at room temperature, the unreacted alkynyl TPP cation was removed by ultrafiltration (100,000 MWCO membrane, Millipore) to obtain CD63APT-TPP (or R1-TPP).
Synthesis of DNA based regulators
CD63APT-TPP, B1 and B2 were mixed together to 1 μmol in PBS solution. After heating at 95 °C for 5 min, the mixture was slowly cooled to 25 °C at a rate of 1 °C/min to obtain OK-MLIR. The DK-MLIR was obtained by using CD63APT-TPP and B3 following the same protocol.
Polyacrylamide gel electrophoresis analysis (PAGE)
Native polyacrylamide gel (10–20 wt%) was prepared using 1× TBE buffer. The loading samples were obtained by mixing 7.5 μl DNA samples with 1.5 μl 6× loading buffer and placed for 3 min before injected into the native polyacrylamide gel. The PAGE was run at 100 V in 1× TBE buffer for 50 min, stained with 1× SYBR Gold, and scanned with a Molecular Imager Gel Doc XR.
Serum stability experiment
DNA samples were incubated with 10% FBS at 37 °C for 0, 3, 6, 9, 12, and 24 h, respectively. Following the reaction, 10% PAGE was performed. The loading samples were obtained by mixing 7.5 μL DNA samples with 1.5 μL 6× loading buffer and placed for 3 min before injected into the native polyacrylamide gel. The PAGE was run at 100 V in 1× TBE buffer for 50 min, stained with 1× SYBR Gold, and scanned with a Molecular Imager Gel Doc XR, and grayscale analysis of gel images was performed using ImageJ software.
Cell culture
The Alpha Mouse Liver 12 (AML-12) cells (Procell Life Science & Technology, Wuhan, China) was cultured in Dulbecco’s modified Eagle’s medium (DMEM) containing 10% FBS, 100 μg ∙ mL−1 streptomycin, 100 U/ml penicillin, 0.5% ITS-G (100×) and 40 ng/ml Dexamethasone. The HeLa cell (Procell Life Science &Technology, Wuhan, China) was cultured in DMEM supplemented with 10% FBS, 100 μg/mL streptomycin and 100 U/mL penicillin. All cells were cultured at 37 °C in a humidified incubator containing 5 vol.% CO2 and 95 vol.% air. Short tandem repeat (STR) analysis and mycoplasma detection were performed for each cell line prior to use. Cell counts were measured with the Petroff-Hausser cell counter (USA).
Confocal imaging assay
For DNA probe concentration optimization: HeLa cells were seeded at a density of 1 × 10⁴ cells per well in single-well confocal dishes. The cells were transfected with 0, 90, 180, or 360 nM DNA probes by using Lipo3000 for 6 h, followed by 365 nm UV irradiation at 3 mW/cm² for 10 min. Afterward, the medium was replaced with complete culture medium, and the cells were further cultured for 24 h. Then the cells were stained with 100 nM LysoTracker Red for 30 min, washed three times with PBS, and imaged using a 100× oil immersion objective. FAM and LysoTracker Red were excited by lasers at 494 nm and 580 nm, respectively.
For UV irradiation times optimization: After the cells transfected with 180 nM DNA probes and illuminated with UV light for 0, 5, 10, or 15 min, the culture medium was placed and incubated for an additional 24 h. Subsequently, the cells were stained with 100 nM MitoTracker Green and LysoTracker Red for 30 min, and imaged using a 100× oil immersion objective. MitoTracker Green and LysoTracker Red were excited by lasers at 490 nm and 580 nm, respectively.
For incubation time optimization after HeLa cells transfected with DNA probes: After the cells transfected with 180 nM DNA probes and illuminated with UV light, the culture medium was placed and incubated for an additional 0, 1, 3, 6, 12, or 24 h. Subsequently, the cells were stained with 100 nM MitoTracker Green and LysoTracker Red for 30 min, and imaged by using a 100× oil immersion objective. MitoTracker Green and LysoTracker Red were excited by lasers at 490 nm and 580 nm, respectively.
For cellular imaging analysis of mitochondria-lysosome contacts: mitochondria-lysosome contacts were defined as inter-organelle membrane distances ≤100 nm. The percentage of lysosomes in contact with mitochondria was calculated as the number of lysosome-associated vesicles forming contacts divided by the total lysosomal vesicles within the region of interest. We randomly selected ten cells and then randomly picked 100 lysosomes. The background fluorescence was subtracted using the “Rolling Ball” function in ImageJ. The distance between the membranes was measured from SIM images by using ImageJ, and the number of mitochondria-lysosome contacts was counted. GraphPad Prism software was used for plotting4,53.
Measurement of ROS generation
HeLa cells were seeded in single-well confocal dishes at a density of 1 × 10⁴ cells per well and cultured overnight at 37 °C. Then, incubated with 180 nM K-MLIR (Lipo3000 transfection) in absence and presence of glutathione inhibitor BSO (10 mM) for 6 h. After illuminating with or without 365-nm light (3 mW cm−2) for 10 min, and washing with PBS for three times, the cells were stained with 2′,7′-dichlorodihydrofluorescein diacetate (DCFH-DA) and measured with the super-resolution microscope or flow cytometry. DCFH-DA was excited with 502 nm lasers. A 100× oil immersion objective was used for imaging cells. Image analysis was performed with NiS-Elements AR Analysis software.
Detection of mitochondrial membrane potential
HeLa cells were seeded in single-well confocal dishes at a density of 1 × 10⁴ cells per well and cultured overnight at 37 °C. Then the cells treated with and without BSO (10 mM) were transfected with180 nM DK-MLIR (Lipo3000 transfection) for 6 h. As positive control, the cells were treated with CCCP (10 μM) for 20-min. After addition of the serum-free medium (MEM), the cell samples were treated with and without 10-min of 365 nm light (3 mW cm−2), and stained with JC-1 dye (1 mg/l) for 20 min at 37 °C. Then the cells were washed 3 times with PBS and observed by fluorescence confocal microscope. JC-1 aggregate and JC-1 monomer were excited with 585 nm and 514 nm lasers, respectively. A 100× oil immersion objective was used for imaging cells. Image analysis was performed with NiS-Elements AR Analysis software.
Intracellular ATP level measurement
The cellular ATP levels were detected with an ATP assay kit. Briefly, HeLa and AML-12 were seeded in 6-well plates to a density of 2 × 10⁵ per well and incubated at 37 °C for 24 h. Then, the cells were incubated with180 nM DK-MLIR (Lipo3000 transfection) in absence and presence of BSO (10 mM) for 6 h. After discarding the medium, MEM was added and the cells was illuminated with 365-nm light (3 mW cm−2) for 10 min. Upon 24-h incubation, the cells were collected and lysed for ATP measurement with ATP assay kit.
Quantitative real-time polymerase chain reaction analysis
HeLa cells were seeded in a 6-well plate at a density of 2 × 10⁵ cells per well and incubated at 37 °C for 24 h. Then, the cells were incubated with 180 nM DK-MLIR (transfected with Lipo3000) in the presence and absence of chloroquine (100 μM) for 6 h, and then cultured with complete medium for 12 h. Subsequently, the total DNA was extracted using a DNA extraction kit, amplified using a qPCR kit, and the number of amplifications was detected using a Real-Time Fluorescence Quantitative PCR Analyzer.
Immunofluorescence staining
HeLa cells were seeded in single-well confocal dishes at a density of 1 × 10⁴ cells per well and cultured overnight at 37 °C. Then, incubated with K-MLIR (180 nM) in absence and presence of BSO (10 mM) for 6 h. After illuminating with or without 365-nm light (3 mW cm−2) for 10 min and incubating for another 24 h, the cells were fixed by 4% paraformaldehyde for 10 min. Then the cells were blocked with 10% FBS (v/v) and 5% BSA bovine serum albumin (w/v) in PBS solution for 1 h, and incubated with TOMM20 (or COXIV) antibody for 2 h at 25 °C. After incubation with FITC goat anti-rabbit IgG for 1 h at room temperature, the cells were stained with 5 mg/mL DAPI for 15 min and observed under super-resolution microscope. FITC and DAPI were excited with 488 nm and 405 nm lasers, respectively.
HeLa cells were seeded in single-well confocal dishes at a density of 1 × 10⁴ cells per well and cultured overnight at 37 °C. The cells were transfected with 180 nM CD63ATP by using Lipo3000 for 6 h. After incubation with complete medium for 24 h, the cells were fixed with 4% paraformaldehyde for 10 min, treated with 0.2% Triton X-100 for 5 min, and then blocked with a PBS solution containing 10% FBS (v/v) and 5% bovine serum albumin (BSA, w/v) for 1 h. The cells were incubated with EEA1 (or RAB7) antibody at 37 °C for 2 h. After incubation with Alexa Fluor 647-labeled goat anti-rabbit IgG (H + L) at room temperature for 1 h, the cells were observed under a super-resolution microscope. FAM and Alexa Fluor were excited by lasers at 495 nm and 651 nm, respectively.
HeLa cells were seeded in single-well confocal dishes at a density of 1 × 10⁴ cells per well and cultured overnight at 37 °C. The cells were transfected with 180 nM CD63ATP-TPP and DK-MLIR by using Lipo3000 for 6 h. After illuminating with or without 365-nm light (3 mW cm−2) for 10 min and incubating for another 24 h, the cells were fixed with 4% paraformaldehyde for 10 min, treated with 0.2% Triton X-100 for 5 min. Then, the cells were blocked with a PBS solution containing 10% FBS (v/v) and 5% bovine serum albumin (BSA, w/v) for 1 h, and incubated with LC3B antibody at 37 °C for 2 h. After incubation with Alexa Fluor 647-labeled goat anti-rabbit IgG (H + L) at room temperature for 1 h, the cells were observed under a super-resolution microscope. FAM and the fluorescent secondary antibody were excited by lasers at 495 nm and 651 nm respectively.
Western blotting analysis
HeLa cells were seeded in 6-well microplate to a density of 2 × 10⁵ per well for 24 h. Then, HeLa cells were incubated with OK-MLIR (180 nM) or DK-MLIR (180 nM) in absence and presence of BSO (10 mM) for 6 h, and illuminated with or without 365-nm light (3 mW cm−2) for 10 min. After incubation for 24 h, cells were collected and followed by adding sodium dodecyl sulfate loading buffer for Western blot. The levels of TOMM20 and COXIV were analyzed by immunoblotting using antibodies against TOMM20 and COXIV, respectively.
HeLa cells were seeded in 6-well microplate to a density of 2 × 10⁵ per well for 24 h. The cells were transfected with 180 nM CD63ATP-TPP and DK-MLIR by using Lipo3000 for 6 h. After illuminating with or without 365-nm light (3 mW cm−2) for 10 min and incubating for another 24 h, cells were collected and followed by adding sodium dodecyl sulfate loading buffer for Western blot. The levels of LC3B-I and LC3B-II were analyzed by immunoblotting using antibodies against LC3B.
Wound healing assay
To perform cell migration assays, HeLa cells were seeded in 6-well plates to a density of 2 × 10⁵ per well, and incubated at 37 °C for 24 h. Then HeLa cells were incubated with DK-MLIR (180 nM) in absence and presence of BSO (10 mM) for 6 h, and illuminated with or without 365-nm light (3 mW cm−2) for 10 min. After incubation for 24 h, an empty gap was created by scraping the cell monolayer in a straight line. The cell debris were removed by washing with PBS, and the fresh culture medium was added. Then the cells were cultured at 37 °C and imaged at different incubation time.
Cell viability assay
HeLa or AML-12 cells were incubated in 96-well plates at a density of 1 × 10⁴ cells/compartment and cultured at 37 °C for 24 h. The serial concentrations of DNA-based regulators were transfected with Lipo3000 transfection reagent for 6 h, and the cells were treated with or without 365-nm light (3 mW cm−2) for 10 min, then the DMEM medium was replaced, and the cells were incubated for 24 h. After washing twice with PBS, 50 μL MTT (5 mg/mL) solution was added and incubated for 4 h. Then the remaining MTT solution was removed, and 100 μl DMSO was added for 10 min to dissolve formylsulfoxide crystals and precipitates. The optical density at 490 nm was measured by a Safire microplate analyzer.
Statistics and reproducibility
All experiments were repeated three times. All microscope and gel image experiments were repeated three times independently, and the images presented represented the data obtained. All grayscale, colocalization, and fluorescence intensity analyses were conducted using ImageJ. Statistical analysis was performed using GraphPad Prism 10.1.2, and all data were expressed as mean ± standard deviation. Statistical significance (*P < 0.1, **P < 0.01, ***P < 0.001, ****P < 0.0001) was evaluated using a two-sided Student’s t test when two groups were compared. Detailed statistical results with p values are provided in the Source data file.
Reporting summary
Further information on research design is available in the Nature Portfolio Reporting Summary linked to this article.
Data availability
All data supporting the findings of the study are available within the main text, the Supplementary Information and the Source Data files are provided with this paper. Source data are provided with this paper. Source data is available for Figs. 2b, d, f, 3b, g, h, 4c, e, f, 5d, e, f, g and Supplementary Figs. 2, 3, 4, 5, 6a, b, 7b, c, 8b, c, 9, 10b, c, 11b, c, 12b, c, 13b, c, 14, 15, 16b, 17b, 18, 19, 20b, c, 21, 22a, b, 23b, c, d, e, 24b, 25, 26b, d, e, 29b, and 30 in the associated source data file. Source data are provided with this paper.
References
-
Prashar, A. et al. Lysosomes drive the piecemeal removal of mitochondrial inner membrane. Nature 632, 1110–1117 (2024).
-
Lim, C. Y. et al. ER−lysosome contacts enable cholesterol sensing by mTORC1 and drive aberrant growth signalling in Niemann−Pick type C. Nat. Cell Biol. 21, 1206–1218 (2019).
-
Peng, W. et al. Mitochondria-lysosome contacts regulate mitochondrial Ca2+ dynamics via lysosomal TRPML1. Proc. Natl. Acad. Sci. USA 117, 19266–19275 (2020).
-
Wong, Y. et al. Mitochondria–lysosome contacts regulate mitochondrial fission via RAB7 GTP hydrolysis. Nature 554, 382–386 (2018).
-
Sun, T. et al. Ion monitoring at nanoscale sites of interorganelle membrane contact in living cells. Small Struct. 5, 2300350 (2024).
-
Peng, W. et al. Parkin regulates amino acid homeostasis at mitochondria-lysosome (M/L) contact sites in Parkinson’s disease. Sci. Adv. 9, eadh3347 (2023).
-
Picca, A. et al. Mitophagy in human health, ageing and disease. Nat. Metab. 5, 2047–2061 (2023).
-
Uoselis, L. et al. Mitochondrial degradation: mitophagy and beyond. Mol. Cell 83, 3404–3420 (2023).
-
Wang, M. et al. A new Strategy to fight metallodrug resistance: mitochondria-relevant treatment through mitophagy to lnhibit metabolic adaptations of cancer cells. Angew. Chem. Int. Ed. 61, e202203843 (2022).
-
Ziegler, P. K. et al. Mitophagy in intestinal epithelial cells triggers adaptive immunity during tumorigenesis. Cell 174, 88–101 (2018).
-
Cisneros, J. et al. Mitochondria-lysosome contact site dynamics and misregulation in neurodegenerative diseases. Trends Neurosci. 45, 312–322 (2022).
-
Nixon, R. The role of autophagy in neurodegenerative disease. Nat. Med. 19, 983–997 (2013).
-
Ji, M. et al. RN0D, a galactoglucan from Panax notoginseng flower induces cancer cell death via PINK1/Parkin mitophagy. Carbohyd. Polym. 332, 121889 (2024).
-
Levine, B. Autophagy and cancer. Nature 446, 745–747 (2007).
-
Chen, Q. et al. Quantitative analysis of interactive behavior of mitochondria and lysosomes using structured illumination microscopy. Biomaterials 250, 120059 (2020).
-
Chen, Q. et al. A dual-labeling molecular probe to track functional mitochondria-lysosome interactions in live cells. Nat. Commun. 11, 6290 (2020).
-
Qiu, K. et al. Light-activated mitochondrial fission through optogenetic control of mitochondria-lysosome contacts. Nat. Commun. 13, 4303 (2022).
-
Anastasiia, D. V. et al. Intracellular microbial rhodopsin-based optogenetics to control metabolism and cell signaling. Chem. Soc. Rev. 53, 3327–3349 (2024).
-
Shen, X. et al. Advances of fluorescent DNA nanostructures in biomedical applications. Innov. Mater. 2, 100064 (2024).
-
Zheng, M. et al. Kinetic DNA self-assembly: simultaneously co-folding complementary DNA strands into identical nanostructures. J. Am. Chem. Soc. 143, 20363–20367 (2021).
-
Chandrasekaran, A. R. Nuclease resistance of DNA nanostructures. Nat. Rev. Chem. 5, 225–239 (2021).
-
Mathur, D. et al. Determining the cytosolic stability of small DNA nanostructures in cellula. Nano lett. 22, 5037–5045 (2022).
-
Huang, X. et al. DNA scaffolds enable efficient and tunable functionalization of biomaterials for immune cell modulation. Nat. Nanotechnol. 16, 214–223 (2021).
-
Zhen, W. et al. Precise subcellular organelle targeting for boosting endogenous-stimuli-mediated tumor therapy. Adv. Mater. 33, 2101572 (2021).
-
Chang, X. et al. Synergistic regulation of targeted organelles in tumor cells to promote photothermal-immunotherapy using intelligent core-satellite-like nanoparticles for effective treatment of breast cancer. Small 20, 2400069 (2024).
-
Liu, C. et al. Discovery of subcellular-targeted aza-BODIPY photosensitizers for efficient photodynamic antitumor therapy. J. Med. Chem. 66, 7205–7220 (2023).
-
Li, F. et al. Dynamic assembly of DNA nanostructures in living cells for mitochondrial interference. J. Am. Chem. Soc. 144, 4667–4677 (2022).
-
Guo, Y. et al. Telomerase-mediated self-assembly of DNA network in cancer cells enabling mitochondrial interference. J. Am. Chem. Soc. 145, 23859 (2023).
-
Zhu, L. et al. Controllable mitochondrial aggregation and fusion by a programmable DNA binder. Chem. Sci. 14, 8084–8094 (2023).
-
Zhao, Q. et al. Target reprogramming lysosomes of CD8+ T cells by a mineralized metal-organic framework for cancer immunotherapy. Adv. Mater. 33, 2100616 (2021).
-
Shao, Y. et al. Organelle-specific photoactivation of DNA nanosensors for precise profiling of subcellular enzymatic activity. Angew. Chem. Int. Ed. 60, 8923–8931 (2021).
-
Murphy, M. P. Selective targeting of bioactive compounds to mitochondria. Trends Biotechnol. 15, 326–330 (1997).
-
Rhee, W. J. & Bao, G. Slow non-specific accumulation of 2’-deoxy and 2’-O-methyl oligonucleotide probes at mitochondria in live cells. Nucleic Acids Res. 38, e109 (2010).
-
Jiang, Z. et al. Anionic polymers promote mitochondrial targeting of delocalized lipophilic cations. Bioconjug. Chem. 31, 1344–1353 (2020).
-
Mathieu, M. et al. Specificities of exosome versus small ectosome secretion revealed by live intracellular tracking of CD63 and CD9. Nat. Commun. 12, 4389 (2021).
-
Palmulli, R. et al. CD63 sorts cholesterol into endosomes for storage and distribution via exosomes. Nat. Cell Biol. 26, 1093–1109 (2024).
-
Schrezenmeier, E. & Dörner, T. Mechanisms of action of hydroxychloroquine and chloroquine: implications for rheumatology. Nat. Rev. Rheumatol. 16, 155–166 (2020).
-
Gallagher, L. et al. Lysosomotropism depends on glucose: a chloroquine resistance mechanism. Cell Death Dis. 8, e3014 (2017).
-
Youle, R. & Narendra, D. Mechanisms of mitophagy. Nat. Rev. Mol. Cell Biol. 12, 9–14 (2011).
-
Kim, H. J. et al. Carbon monoxide-induced TFEB nuclear translocation enhances mitophagy/mitochondrial biogenesis in hepatocytes and ameliorates inflammatory liver injury. Cell Death Dis. 9, 1060 (2018).
-
Wen, H. et al. Hypoxic postconditioning promotes mitophagy against transient global cerebral ischemia via PINK1/Parkin-induced mitochondrial ubiquitination in adult rats. Cell Death Dis. 12, 630 (2021).
-
Pickles, S. et al. Mitophagy and quality control mechanisms in mitochondrial maintenance. Curr. Biol. 28, R170–R185 (2018).
-
Humphries, B. A. et al. Enhanced mitochondrial fission inhibits triple-negative breast cancer cell migration through an ROS-dependent mechanism. iScience 26, 106788 (2023).
-
Ji, C. et al. Aptamer–protein interactions: from regulation to biomolecular detection. Chem. Rev. 123, 12471–12506 (2023).
-
Chen, L. et al. Nucleic acid-based molecular computation heads towards cellular applications. Chem. Soc. Rev. 50, 12551–12575 (2021).
-
Tábara, L. C. et al. Molecular mechanisms of mitochondrial dynamics. Nat. Rev. Mol. Cell Biol. 26, 123–146 (2025).
-
Kraus, F. et al. Function and regulation of the divisome for mitochondrial fission. Nature 590, 57–66 (2021).
-
Giacomello, M. et al. The cell biology of mitochondrial membrane dynamics. Nat. Rev. Mol. Cell Biol. 21, 204–224 (2020).
-
Palikaras, K. et al. Mechanisms of mitophagy in cellular homeostasis, physiology, and pathology. Nat. Cell Biol. 20, 1013–1022 (2018).
-
Redmann, M. et al. Mitophagy mechanisms and role in human diseases. Int. J. Biochem. Cell Biol. 53, 127–133 (2014).
-
Antico, O. et al. Targeting mitophagy in neurodegenerative diseases. Nat. Rev. Drug Discov. 14, 1–25 (2025).
-
Georgakopoulos, N. et al. The pharmacological regulation of cellular mitophagy. Nat. Chem. Biol. 13, 136–146 (2017).
-
Juhl, A. D. et al. Quantitative imaging of membrane contact sites for sterol transfer between endo-lysosomes and mitochondria in living cells. Sci. Rep. 11, 8927 (2021).
Acknowledgements
The authors gratefully acknowledge the National Natural Science Foundation of China (22174066, K.W.R; 22104058, L.Y.Z; 22374076, S.Y.D (Shengyuan Deng)), the Natural Science Foundation of Jiangsu Province (BK20200459, L.Y.Z; BK20231455, S.Y.D (Shengyuan Deng)), the Program of Jiangsu Specially-Appointed Professor, Fundamental Research Funds for the Central Universities (30922010501, S.Y.D (Shengyuan Deng); 30924010809, K.W.R).
Ethics declarations
Competing interests
The authors declare no competing interests.
Peer review
Peer review information
Nature Communications thanks the anonymous reviewers for their contribution to the peer review of this work. A peer review file is available.
Additional information
Publisher’s note Springer Nature remains neutral with regard to jurisdictional claims in published maps and institutional affiliations.
Supplementary information
Source data
Rights and permissions
Open Access This article is licensed under a Creative Commons Attribution-NonCommercial-NoDerivatives 4.0 International License, which permits any non-commercial use, sharing, distribution and reproduction in any medium or format, as long as you give appropriate credit to the original author(s) and the source, provide a link to the Creative Commons licence, and indicate if you modified the licensed material. You do not have permission under this licence to share adapted material derived from this article or parts of it. The images or other third party material in this article are included in the article’s Creative Commons licence, unless indicated otherwise in a credit line to the material. If material is not included in the article’s Creative Commons licence and your intended use is not permitted by statutory regulation or exceeds the permitted use, you will need to obtain permission directly from the copyright holder. To view a copy of this licence, visit http://creativecommons.org/licenses/by-nc-nd/4.0/.
About this article

Cite this article
Xiao, Y., Zhu, L., Du, S. et al. Dual-key cooperatively activated DNA regulator for controlling mitochondria-lysosome interactions. Nat Commun 16, 7811 (2025). https://doi.org/10.1038/s41467-025-63040-x
-
Received:
-
Accepted:
-
Published:
-
DOI: https://doi.org/10.1038/s41467-025-63040-x