Introduction
Flexibility refers to the range of motion or series of joints. This is usually determined by measuring angles of movement using a goniometer or flexometer, or by assessing the distance the body can reach through a given range of motion. Various tests are commonly used to assess flexibility, the most well-known of which is the sit-and-reach test (SRT), which measures hamstring and lumbar flexibility1,2. The classic SRT, first developed by3, has become an important part of sport-related physical fitness test batteries and is widely practiced4,5.
Flexibility enables healthy movements to be performed in a comfortable and controlled manner and contributes to the prevention of sports injuries6,7. It has been stated that insufficient flexibility can cause injuries related to various sports branches8,9,10. Many studies have been conducted on the joint angles determined manually in the sit-and-reach test, which is one of the flexibility tests1,2,11,12,13.
Flexibility assessments performed with Kinect and other computer-based tools have lately become more common. These systems advance joint angle characterization and measurement precision14,15,16. Using 3D kinematic analysis tools, angular motion in joint areas including the knee, hip, and spine can be rapidly and precisely recorded, generating findings that over time surpass the accuracy and speed of hand measurement techniques17,18,19.
Because of its cost and portability, the Kinect V2 stands out as a device that is easily used in settings including rehabilitation hospitals. In medical rehabilitation and patient care, this device is an active instrument that greatly helps to design patient exercise plans20. Kinect V2 has been successfully applied in applications including chair sit and reach tests for assessing flexibility21 and shown dependability in physical fitness evaluations for older individuals. The statistics show that Kinect V2 can be a useful tool for assessing joint angles and range of motion.
Although Kinect essentially measures total movements, it has shown differences in joint angle readings relative to gold standard systems like Vicon22. Moreover, studies on knee, hip, and spine angles show that Kinect is relevant in rehabilitation programs and provide results compatible with hand approaches23,24.
One important point underlined in this literature is as following: Within the field of sport sciences, Microsoft Kinect shows great promise for dependability and validity. The lack of studies examining sit-and-reach tests and range of motion in weightlifting athletes suggests that Kinect-based assessments call for more comprehensive and detailed research across many facets of sports science.
Young elite female weightlifters were specifically selected for the population of this study. Because, young elite female weightlifters were athletes who regularly trained at an athletic level and achieved international success. Furthermore, elite female weightlifters at this level represented a limited accessible sample. This choice allows the potential of Microsoft Kinect Azure to be evaluated in a highly disciplined and consistent athletic population, while providing insights focused on its applicability in sports science. This study aimed to compare the range of motion (ROM) measurements of the shoulder, elbow, wrist, and trunk joints of elite female weightlifting athletes using Microsoft Kinect Azure and a digital goniometer during the sit-and-reach test (SRT), as well as the flexibility values obtained in centimeters (cm) from the SRT device, while analyzing the accuracy, consistency, and repeatability of both methods. The subsequent assumptions were evaluated during the study: The hypothesis posits that the range of motion (ROM) and flexibility values acquired using Microsoft Kinect Azure will exhibit a significant correlation and reproducibility with those measured through digitizing tools and manual techniques, as well as that Kinect Azure will serve as a more expedient and practical alternative to digitizing tools and manual measurements.
Materials and methods
Participants
This study included 21 elite female athletes from the Turkish Women’s Weightlifting National Team. The athletes won medals in European and World championships and Youth Olympic Games in the categories of senior, junior, youth and U15.
28.5% of the participants (6 athletes) won medals at the senior European Championships and 4.8% (1 athlete) won medals at the senior World Championships. In the junior category, 14.3% (3 athletes) won a medal at the World Championships and 4.8% (1 athlete) won a medal at the Youth Olympics. In addition, 4.8% (1 athlete) of the participants took part in the Junior European Championships. 42.8% (9 athletes) of the athletes in the youth and U15 categories have achieved success in European and World championships. The athletes are participating in the preparation camp for the junior, senior and U23 European Championships to be held in Poland in 2024 and train 6 days a week, 2 times a day.
Before engaging in the study, none of the athletes reported any illness or injury; they were all in good health. The athletes have as their inclusion criteria: Not having any health issues and competing in active events, being an active athlete in the Turkish Women’s Weightlifting National Team for at least 3 years, preparing for championships by training 6 days a week and two times a day.
Inclusion and exclusion criteria were determined by a verbal medical assessment of the athletes by a specialist physician experienced in sports practice. During this evaluation, the athletes’ health history, menstrual cycles and possible movement limitations were questioned. Athletes were included in the study during the follicular phase of the menstrual cycle. The demographic data, weekly training times and athletic history of the participants are presented in Table 1.
This study complied with the Helsinki Declaration (2013) of the World Medical Association. The Ethics Committee of Karamanoğlu Mehmetbey University Medicine Faculty (permission date: 23.09.2024 and number: 10-2024/09) granted ethical approval. In this study, participants were informed about the study and a signed informed consent form was obtained from the participants. Additionally, the necessary written and signed informed consents for the participants whose personal or clinical details along with any identifying images included to be taken and published were obtained from them and their parent/legal guardian. The inquiry was funded by the Karamanoğlu Mehmetbey University Scientific Research Projects Coordinating Unit (Projects No: 14-M-24 & 51-M-24). In addition, the study was carried out by obtaining the necessary permissions from the Turkish Weightlifting Federation.
Sample size calculation
Based on the SRT distance covered data obtained from this study, it was calculated that 20 participants were needed for 80% power at a significance level of α = 0.05 and a medium effect level for the difference between the two dependent groups. In light of this information, the study included 21 elite female weightlifters, which was the maximum number that could be reached. Because the total number of accessible athletes in the National Team was 21 participants. At the end of this study, according to the Distince Covered (final) values in Table 8 (meankinect: 36.10 ± 6.66 cm, meanmanual: 37.43 ± 7.18 cm and r = 0.939), a medium effect of 0.538 (by Cohen’s d) was calculated at 0.05 significance and 77% power levels.
Instruments and procedures
Flexibility test procedures
Before the sit-and-reach test (SRT), participants were permitted a 5-min warm-up time during which they executed static stretching exercises focused on the lower back and hamstring muscles. This warm-up was conducted to alleviate tension in the hamstring muscles and to mitigate the consequences of muscular elongation resulting from repeated trials.
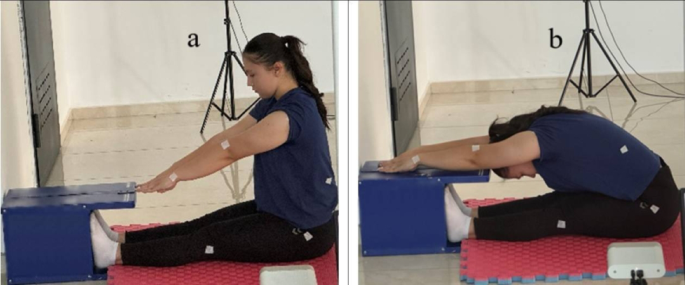
Participants were seated without shoes, leaning against the end of the board of the test apparatus with their legs in adduction position, knees in full extension and ankles in neutral dorsiflexion (Fig. 1a).

Performance of the sit-and-reach test, (a) Initial position with normal back and shoulder flexibility, (b) Final position showing increased flexibility.
Each participant was instructed to flex the trunk along the measurement scale with the hands in the pronated position, bending as far as possible without bending the knees. Participants were asked to remain in this position for 1–2 s and were not allowed to flex forward or backward (Fig. 1b).
Each participant made a total of three attempts and the best results were recorded in centimeters according to the final position on the ruler reached by the fingertips. If the fingers did not reach the zero point, this measurement was recorded as negative. If they went above the zero point, it was recorded as a positive value2,12,25. During the test, under the supervision of the test supervisor, it was ensured that: a) the feet were in full contact with the test apparatus and b) the knees were in full extension.
Goniometric measurement
There are several kinds of goniometers, with basic mechanisms or more sophisticated electronic components. Available in both analog and digital forms, they are reasonably priced and straight forward for use. Digital goniometers offer more accurate measurements and show the findings on a liquid crystal display; analog goniometers read measurement data from angle scales26. In this study, the range of motion (ROM) of the athletes was measured with the Baseline Digital Goniometer (USA) by a specialist physician experienced in sports (Fig. 2). The test positions selected for goniometric measurement, axis placements and reference points for the measurements are given in Table 1. The best scores of the measurements repeated three times for each joint were used in the analyses.

Positions and axis placements used in ROM measurements with Baseline Digital Goniometer.
Maintaining the same posture, goniometric measurements were done without interfering with the athletes’ start and finish locations noted using the Kinect Azure device. Several steps were done to guarantee the measurement accuracy. To guarantee that the athletes stayed steady in their starting and finishing positions, first tiny sticker marks were placed on some anatomical reference points. The stickers ensured accurate axis placement of the goniometer during the measurement and helped the athletes to maintain their position. The anatomical marking points were: acromion process located on the upper outer part of the shoulder joint, trochanter major which is the large prominence on the outer side of the femur, lateral epicondyle of the humerus which is the outer lateral prominence of the elbow joint, triquetrum located on the ulnar side at the wrist level and thoracic region located on the upper part of the trunk at the spine level.
The sticker maintained the athletes in their places during measurement and marked reduced axis placement mistakes. Once the athletes’ locations were fixed after the Kinect Azure measurement, measurements were taken with a digital goniometer. Little physical assistance and spoken signals were given to guarantee the subjects had perfect posture during the measurement. Participants kept proper posture during the measurement thanks to little physical help and vocal indications. To improve measuring accuracy, athletes firmly set their feet on the instrument and fully extended their knees on a secure, non-slip platform.
The study consisted on the most exact data from three-fold measurements for every joint. Carefully examined were the accurate alignment of the moving arm and the axis setting of the goniometer, that is, on the acromion for shoulder measurement. Between the goniometric and Kinect Azure outputs, this precise measuring method guaranteed comparability and consistency.
Kinect features and operating basics
Azure Kinect, released by Microsoft in 2020, is a state-of-the-art sensor for environmental sensing, body tracking and object recognition. As shown in Table 2, this sensor is optimized for computer vision and artificial intelligence applications. Azure Kinect offers a wide range of applications in various fields such as gaming, robotics, healthcare and industrial automation27,28.
Table 2 lists Azure Kinect’s technical characteristics. This sensor comprises of components including an RGB Camera that gathers high-quality color images with a resolution of 12 MP, a Depth Sensor that may measure distance, an IMU (Inertial Measurement Unit) that gathers device position and motion data, and a Microphone Array used to record voice commands and audio data29.
These elements taken together make Azure Kinect a useful tool for machine vision applications. Let simultaneous monitoring of large areas through synchronizing of many devices30,31 so successfully applied in human motion analysis applications as well as in environmental tracking.
Azure Kinect, designed to enable accurate, real-time tracking of environments, objects and human movements by capturing 3D spatial data, has also been reported to be very important in augmented reality (AR), health diagnostics and industrial automation by providing high-precision spatial data32,33,34.
This sensor exactly measures object distances and creates 3D depth maps29,35 based on Time-of-Flight (ToF) technology. It is therefore used in 3D mapping and telepresence applications36 combining RGB (color) data with depth information to produce comprehensive 3D environment reconstructions by means of which extensive 3D environment reconstruction is created. Thanks to its capacity to detect human body motions using sophisticated artificial intelligence models that identify skeletal features, Azure Kinect has evolved into a favored tool in applications needing motion analysis37,38.
Advanced studies employing Azure Kinect also involve motion tracking and biomechanical analysis to examine athletes’ performances, track physical rehabilitation treatments, and conduct ergonomic investigations39. In addition, Kinect can be used in robotic and autonomous systems such as object recognition and obstacle detection to increase the environmental awareness of robots40, human–machine interaction to increase user interaction in motion-based games and virtual reality applications41,42, and industrial applications such as quality control, process automation, and logistics management on the production line43,44.
With its depth camera, Azure Kinect precisely measures the distance of objects in its surroundings using TOF (Time of Flight) technology45 The depth camera generates an infrared (IR) light signal in this measurement; the time it takes for the signal to contact an item and return (t) is computed as stated in Eq. (1).
Equation (1) has d as the distance of the object from the sensor, c as the speed of light, and t as the total time the signal spends being transmitted and returned. Using a partition coefficient 1/2 one considers the signal’s travel and return times.
The distance data of every pixel from the depth camera creates a whole depth map of the objects in the area of view46. This depth map detects every pixel with a given distance value using a three-dimensional data matrix. Equations (2) and (3) show real-time three-dimensional modeling of the surrounding objects this 3D matrix makes accessible.
$$Z=left[begin{array}{cccc}Z(1, 1)& Zleft(text{1,2}right)& dots & Z(1,n)\ Z(2, 1)& Zleft(2, 2right)& dots & Z(2, n)\ vdots & vdots & ddots & vdots \ Z(m, 1)& Z(m, 2)& ddots & Z(m, n)end{array}right]$$
(2)
$$Zleft(i, jright)=frac{c.t(i, j)}{2}$$
(3)
Equation (2) provides Z the depth map and Z(m,nz) the depth data of every pixel at every location (m,n). The distance of the pixel at point (i,j; t(i,j) is the time the signal travels to pixel (i,j) and returns; Eq. (3) has m and n as the number of pixels on the horizontal and vertical axes.
Kinect’s deep learning system discovers the joint locations of the human body using depth map data. This model is tuned to segment the depth data depending on a pre-trained dataset so separating the human body from the backdrop and identify the human skeleton47,48.
Essential for tracking human movements, this method generates and presents three-dimensional data of thirty-two joint points in the depth data, therefore shown in Fig. 349.

Distribution of 3D anatomical joint points in Azure Kinect.
Each joint point received with Azure Kinect is thus displayed in Eq. (4)50 as X, Y and Z coordinates in 3D space.
$${P}_{i}left(tright)=left[begin{array}{c}{x}_{i}(t)\ {y}_{i}(t)\ {z}_{i}(t)end{array}right]$$
(4)
Exponentially smoothed weighted average (ESWA) filter
In image processing, the ESWA filter is a commonly used noise reduction filter. Applied in our work to lower the salt-and-pepper noise that may particularly occur especially at the junction points in the depth map, this filter which operates on the weighted averaging principle helps to minimize the noise in the image while keeping the image features51.
Giving each observation data a specific weight, the ESWA filter averages past data using a 3D coordinate time series for each tracked joint. These weights, however, diminish exponentially with time, so fresh data has more relevance and gradually decreasing influence of older data (5).
$${S}_{t}=alpha {X}_{t}+(1-alpha ){S}_{t-1}$$
(5)
In (5), St stands for the 3D joint coordinates estimated at time t, Xt stands for the 3D joint coordinates obtained from Azure Kinect at time t, α stands for the weighting coefficient and St−1 stands for the 3D joint coordinates calculated in the previous step. However, instead of data pairs of consecutive 3D joint coordinates, this process is performed on a sliding data window consisting of these coordinates in the form of First In First Out.
$${X}_{window}={{text{X}}_{text{t}-text{n}+1} ,{text{X}}_{text{t}-text{n}+2} ,{text{X}}_{text{t}}}$$
(6)
Xwindow, in (6), is the data window; each time fresh data X(t+1) is added, the old data X(t−n+1) is deleted. As said previously, α weights the data in this data window; so, the total weight is computed by converging to 1 as depicted in (7).
$$sumlimits_{{i = 0}}^{{n – 1}} {alpha (1 – alpha )^{i} = 1}$$
(7)
This ensures a uniform distribution of the total weights across the data window of 3D joint coordinates. Finally, applying the window structure shown in (6) and the weighting shown in (7) to (5) yields (8).
$$S_{t} = sumlimits_{{i = 0}}^{{n – 1}} {alpha (1 – alpha )^{i} X_{{t – i}} }$$
(8)
Equation (8) represents the weighted sum of all data in the window and these weights decrease exponentially with respect to the parameter αalpha α.
Structure and usage of the designed system
During the Sit and Reach test, the participant is seated on a flat mat with legs fully extended, feet placed against a standardized box, and arms reaching forward as far as possible as in Fig. 4. Figure 4A illustrates the physical layout of the participant, the sensor, and ambient light, while Fig. 4B presents the system architecture and data flow. The Azure Kinect sensor is mounted on a tripod positioned 250 cm directly in front of the participant at a height of 100 cm from the ground to ensure full body coverage in the sagittal plane as shown in Fig. 4A. This positioning allows the sensor to capture both the trunk and limbs within its field of view. The participant remains centered within the field of view throughout the test, and both RGB and depth data are used to track sagittal-plane motion. All measurements were conducted in a controlled indoor environment. The tests were performed on a stable, hard, tile-covered floor. The Azure Kinect sensor was aligned with the center of the testing area and fixed in position using a tripod. This configuration was kept constant for all participants to ensure consistency and repeatability. Ambient lighting was maintained within indoor limits that would not interfere with sensor performance. Ceiling-mounted lights were used to minimize shadows and infrared signal interference. The illumination level was measured using a CEM DT-8820 digital luxmeter (China-made device) and recorded at approximately 200 lx, which did not cause any degradation in sensor data quality as shown in Fig. 4A.

Experimental setup illustrating the positioning of the Azure Kinect sensor and the participant during the Sit and Reach test under standardized conditions with ambient lights (A). System architecture and data flow (B): (a) Experimental setup illustrating the positioning of the Azure Kinect sensor and the participant during the Sit and Reach test under standardized conditions; (b) Block diagram of the designed system showing data acquisition, processing, and user interface flow [(a) Receiving raw data from the Azure Kinect sensor and extracting it into frames. (b) Parallel processing of RGB and depth data streams. (c) Filtering of 3D joint coordinates and calculation of Sit and Reach angles and distance (cm). (d) User interface displaying real-time test movements, calculated angles [degrees (°)], and measurement results].
The designed system was developed with C# programming language using Visual Studio as shown in Fig. 4B. The system was compiled on a computer with an i9 processor running, 32 GB RAM and 8 GB-RTX 4060 graphics card. The Azure Kinect sensor is connected to the computer running the designed system via a USB 3.0 interface, collects data at 15 FPS (1280 × 720 pixels RGB and 1024 × 1024 pixels depth), and runs on the GPU as described by Zhu et al.48. To follow the athlete’s motions and joint positions throughout the Sit and Reach test, Azure Kinect records both RGB (color) and depth data. Various parameters, including joint angles and distance travelled in the test, are computed from this data and shown on a user interface (UI) a coach or experienced physiologist can follow.
To explain the working details of the designed system, in step (a) indicated by the yellow frame, firstly, the raw data from the Azure Kinect sensor is received with the help of a gripper. This grabber scans the environment using both the RGB camera and the depth sensor and creates a snapshot of the raw data in the camera’s field of view. This process allows the RGB and depth images to be captured simultaneously in a single frame. The RGB and depth images from the grabber are then decomposed and sent to stage (b), indicated by the red frame.
In this section, the data sent from the previous stage is processed in threads running in parallel. The first of these threads is the area indicated by the green frame where the RGB image is processed. Here, first, a Bitmap object is created according to the width and height of the image obtained from the RGB camera. The camera’s picture data then gets replicated into the secured memory area of the Bitmap utilizing a 32-bit color depth and Alpha, Red, Green, Blue channels. At last, this Bitmap object is delivered to the concurrently monitored user interface depicted in section (d).
In the second thread, a tracker is used to determine the joint points in 3D space of the person being tracked in the depth map. Then, from the joint points shown in Fig. 4B, the left hand, left wrist, left elbow, left shoulder, spine chest, spin naval, pelvis and left knee joints are extracted for the sit-and-reach test. These joint points are sent to section (c) indicated by the purple frame.
The first operation performed in part (c) is filtering. In this process, each joint point is filtered using the ESWA filter mentioned above and described in material and methods. The reason for using a filter is that Azure Kinect can sometimes make inaccurate measurements of 3D joint points, called “noise”, due to lighting changes, background complexity and so on. For this reason, a filter was used in the designed system to make the data smoother and more stable. The first operation after filtering is to calculate the wrist flexion, elbow extension, shoulder flexion and trunk flexion angles. Table 3 shows which angles were calculated using which joints.
In angle measurements using these joints, the points A = (x1, y1, z1), B = (x2, y2, z2) and C = (x3, y3, z3) represent the 3D coordinates of the joints to be measured. As a first step, the norms of the vectors obtained from these joints are defined as shown in Eq. (9).
$$left|overrightarrow{AB}right|=sqrt{{{(x}_{2}-{x}_{1})}^{2}+{{(y}_{2}-{y}_{1})}^{2}+{{(z}_{2}-{z}_{1})}^{2}}$$
(9)
$$left|overrightarrow{BC}right|=sqrt{{{(x}_{3}-{x}_{2})}^{2}+{{(y}_{3}-{y}_{2})}^{2}+{{(z}_{3}-{z}_{2})}^{2}}$$
The area between these vectors is then calculated using the cross product of the vectors obtained from (9) as shown in (10).
$$overrightarrow{AB}xoverrightarrow{BC}=left[begin{array}{ccc}i& j& k\ {x}_{2}-{x}_{1}& {y}_{2}-{y}_{1}& {z}_{2}-{z}_{1}\ {x}_{3}-{x}_{2}& {y}_{3}-{y}_{2}& {z}_{3}-{z}_{2}end{array}right]$$
(10)
Next, the area obtained from (10) is used in (11) to calculate the angle “θ” between the two vectors.
$$theta =left{begin{array}{c}Wrist Flexion, 180-{text{sin}}^{-1}left(frac{2*overrightarrow{AB}*overrightarrow{BC}}{overrightarrow{AB}xoverrightarrow{BC}}right)\ others, {text{sin}}^{-1}left(frac{2*overrightarrow{AB}*overrightarrow{BC}}{overrightarrow{AB}xoverrightarrow{BC}}right)end{array}right.$$
(11)
In (11), the angle θ was calculated for wrist flexion only and used as a complement to the wrist angle. The angles calculated separately above were sent to the relevant department to be displayed on the user interface (UI). The last process in the calculation part was the calculation of the distance reached by the user during the test. Two steps comprised this process. The 3D start coordinates of the user’s wrist were noted at the start of the test in the first phase; in the second step, the end coordinates acquired at the end of the test were noted. Then, the distance on the horizontal axis between both coordinates was calculated using only the x- and y-axis data as shown in (12).
$${d}_{xy}=sqrt{{({x}_{2}-{x}_{1})}^{2}+{({y}_{2}-y)}^{2}}$$
(12)
In (12), A = (x1,y1) and B = (x1,y1) represent the coordinates of the wrist joint recorded at the start and end, respectively, and the distance between these two points is calculated with dxy. This calculated distance is sent to the user interface (UI) and displayed in the distance measurement section. The interface of the designed system is shown in Fig. 5 and a brief explanation of its use is given.

User interface of the designed system.
When the system is run, the continuous stream of images from Azure Kinect is displayed in a picture box as shown in Fig. 5. In addition, the user’s name, age, height, weight, best grade, sport age, maximum snatch and maximum clean and jerk data are also collected for future analysis. When the “Create” button is pressed, a “dat” file is created in the “measurements” folder on the C drive of the computer, using the person’s name and surname and the current date.
Pressing the “Create” button generates a “dat” file under the “measurements” folder on the computer’s C drive using the person’s name and surname and the current date. The test angles at the start of the user’s test are computed when the “Start” button is hit, and the wrist position is recorded and shown both on the labels in the “BEGINNING” panel and transferred to the data grid view. Pressing the stop button computes the test angles at the end of the test by means of wrist final position recording, therefore determining the distance covered. This information imported into the data grid view as well as shown on the labels in the “END” panel Pressing the Save button at last records the data in the data grid view to the matching “dat” file.
Statistical analysis
IBM Statistical Package for Social Sciences 25.0 (SPSS, Chicago, IL, USA) software and Python 3.9.12 (Delaware, USA) were used for statistical analyses and graphics. Descriptive statistics, mean, standard deviation (SD), median, quartile 1 (Q1), quartile 3 (Q3) and interquartile difference (IQR) were calculated for all variables. Measurements were performed with two different methods and at two different times. A Mann–Whitney U test was performed to assess whether there was a difference between Kinect Azure and manual method measurements before movement. Likewise, Mann–Whitney U test was applied to evaluate the differences between Kinect Azure and manual method measurements after the movement. The Wilcoxon Signed-Rank Test was applied to evaluate the difference between the Kinect Azure method’s pre- and post-movement measurements.
Wilcoxon Signed-Rank Test was used to compare pre- and post-movement measurements for the hand method. R, the Spearman correlation coefficient, let one investigate linear relationships between measurements. The interpretation of correlation coefficients was guided by the criteria proposed by Schober et al., (2018): 0.00–0.09: no relationship; 0.10–0.39: mild association; 0.40–0.69: moderate association; 0.70–0.89: significant association; > 0.90: extremely high association52. Calculation of the Intraclass Correlation Coefficient (ICC) helped to evaluate agreement between measurements. ICC interpretation drew on53 suggested criteria: low agreement; 0.5–0.75: moderate agreement; 0.75–0.9: fair agreement; > 0.90: excellent agreement. Measurement method agreement was evaluated using Bland–Altman graphs. Data analysis computed Coefficient of Variation (CV) and Coefficient of Repeatability (CR) to evaluate the two measurement techniques’ variation and repeatability respectively. For all analyses, statistical significance level was approved at p < 0.05.
Results
Demographic and performance characteristics
Demographic, anthropometric and weightlifting performance data of elite female weightlifters (n = 21) are presented in Table 4.
Joint angle and distance measurements
The mean, standard deviation, median, 1st quartile, 3rd quartile, IQR and min–max values obtained at baseline and after the wrist, elbow, shoulder, trunk and distance traveled measurements performed with Kinect Azure and manual methods are presented in Table 5. The results of statistical analysis of the differences related to the measurements of the same method at different times are given in Table 6. The results of the statistical significance analysis of the measurements made by different methods in the same time period are shown in Table 7.
Within-method comparisons (Wilcoxon Signed-Rank test)
According to the Wilcoxon Signed-Rank test results, statistically significant differences were found between the baseline and post-movement values for the elbow (p = 0.004), shoulder, and trunk (p < 0.001) using both Kinect Azure and manual methods. No statistically significant difference was observed in wrist measurements (p = 0.154 and p = 0.125, respectively). These results suggest that Kinect Azure and manual methods produced similar outcomes for most joint measurements under the conditions tested (Table 6).
Between-method comparisons (Mann–Whitney U test)
According to the Mann–Whitney U test results, no statistically significant differences were found between the Kinect Azure and manual methods in terms of post-movement values for wrist, elbow, shoulder, and trunk joint angles (all p > 0.05). Since both methods yielded a zero value for the distance traveled parameter at baseline, this comparison was excluded. For post-movement distance measurements, the two methods produced comparable results (p = 0.385). These findings suggest that, under the conditions of this study, Kinect Azure may yield similar joint angle and distance measurements to manual methods (Table 7).
Agreement assessment using intraclass and correlation coefficients
According to the results in Table 7, the agreement between measurements obtained using Kinect Azure and manual methods was further assessed and summarized in Table 8. The data in Table 8 indicate that there was strong agreement between the two methods across all variables wrist, elbow, shoulder, trunk, and distance covered with Intraclass Correlation Coefficients (ICC) exceeding 0.90. This level of agreement was observed both before and after the movement under the specific testing conditions applied in this study.
The results showed that Kinect Azure and manual measurements demonstrated a strong positive correlation across all joint angles and distance parameters, with Spearman correlation coefficients exceeding 0.90 in most cases. The wrist measurements showed slightly lower but still high correlations (r > 0.85). Additionally, Kinect Azure yielded lower measurement variation than the manual method in most parameters, with the exception of elbow and trunk angles after movement.
However, it was observed that the Kinect Azure method had higher variation in the post-movement elbow and trunk measurements compared to the manual method (CV; 3.40 vs. 2.78 and 21.90 vs. 21.44, respectively). Similarly, the coefficient of repeatability (CR) for Kinect Azure was slightly higher in these parameters (elbow: 16.10 vs. 13.14; trunk: 34.40 vs. 33.59), indicating more variability. In contrast, for all other measurements, the Kinect Azure method demonstrated lower or comparable variation and repeatability, supporting its overall reliability in measuring joint movements.
Agreement assessment using Bland–Altman analysis
A Bland–Altman analysis was conducted to assess the agreement and variability between Kinect Azure and manual measurement methods. Figure 6 presents the mean differences and corresponding 95% confidence intervals for each variable. For wrist measurements at baseline, the Kinect method showed values ranging from 4.120 lower to 4.600 higher than those obtained manually, with the differences appearing randomly distributed around zero. This suggests no systematic bias and a generally good level of agreement between the two methods under the conditions tested. Similar agreement patterns were observed across other joint parameters. However, in the post-movement distance covered measurements, a relatively consistent difference was noted (mean difference = − 1.32 cm), with Kinect Azure tending to yield slightly higher values than the manual method. These results indicate that, while some variation exists, Kinect Azure provides broadly comparable measurements to the manual approach for most variables evaluated.

Bland–Altman plots demonstrating agreement between Kinect Azure and manual measurements for kinematic variable analysis.
Discussion
In this study, range of motion (ROM) results obtained during the Sit-and-Reach (SRT) test were compared using Microsoft Kinect Azure and manual measurement methods. The manual measurement method used in this study was not considered the most appropriate method. There are certainly significant limitations to both manual and Microsoft Kinect Azure measurement methods. For example, in the manual measurement method, the problems are more related to the personal performing the measurement. In the measurement method with Microsoft Kinect Azure, the factors related to the environment and standardization are more prominent. It is absolutely necessary not to overlook the positive and negative factors in the evaluation of the data belonging to both measurement methods. Wrist, elbow, shoulder and trunk angles and distance traveled measurements were analyzed and it was determined that both methods provided a high level of agreement and reliability under the specific conditions of this study. In the shoulder angle measurements, the baseline and post-movement Intraclass Correlation Coefficient values were found to be 0.994 and 0.996, respectively, exceeding 0.90, which is considered as a high agreement threshold in the literature, demonstrating a strong reliability. In elbow angle measurements, too much consistency was noted; ICC values came out as 0.961 and 0.965. The Bland–Altman analysis showed that the measurements fell within reasonable limits and that there was no systematic difference between the Kinect Azure and manual methods. A strong linear association was also observed for the distance travelled measurements, with a Spearman correlation coefficient of r = 0.939.
In the literature, it was not possible to find studies directly on SRT with Kinect sensors. This study aimed to test the hypothesis that ROM and SRT test results obtained with Microsoft Kinect Azure will show high agreement and repeatability with manual methods, especially with digital goniometer measurements. Especially in relation to joint angles and distance covered, the data suggest that Kinect Azure may be a reliable tool for flexibility measurements under the specific conditions tested. Using Kinect in flexibility tests like SRT is a novel contribution to the literature, suggesting it may complement or serve as a practical alternative to traditional testing methods.
Previous studies have verified Kinect’s constant movement analysis and adaptability. Ejupi et al. (2015), claim that Kinect’s stand-to-seat and sit-to-stand tests were rather accurate and dependable54. Kaewkaen et al. (2019) also noted good reliability with ICC = 0.664 in arms crossed posture and ICC = 0.843 in free position when using Kinect in their work with senior citizens55. In our study, Kinect Azure showed good agreement with the digital goniometer in key joint measurements such as wrist, elbow, shoulder, and trunk during the SRT test, with ICC values exceeding 0.90 (Table 8). These findings suggest that Kinect Azure may serve as a reliable measurement tool for static flexibility assessment under the specific conditions tested.
Cross-correlation coefficients (CCR) and Root Mean Square Error (RMSE) values let Napoli et al. (2017) determine that Kinect provides low accuracy in joint angle readings but remarkable accuracy in joint displacements in sit-to- stand motions56.
The ICC values of 0.921 and 0.937 and r values of 0.851 and 0.854 for the wrist angle acquired in our study suggest relatively lower agreement in this parameter and are consistent with the results of Napoli et al. (2017)56. This relatively lower agreement may be due to the small range of motion in the wrist, making it more sensitive to minor tracking errors and sensor noise. Moreover, during trunk flexion in the sit-and-reach test, the wrist is more prone to occlusion, especially when using a single front-facing Kinect sensor. These limitations can hinder precise tracking of the wrist joint. Future implementations could benefit from the integration of additional camera perspectives or multi-angle Kinect setups to reduce occlusion-related error. Additionally, employing more advanced filtering techniques may enhance the stability and accuracy of wrist joint signal data. While error rates increased in frontal plane measurements, Eltoukhy et al. (2017) reported that Kinect assessed lower limb kinematics with high accuracy during the Star Excursion Balance Test57. These findings indicate that, although Kinect shows good potential across different movement assessments, caution should be exercised when interpreting joint angle measurements. In our study, small differences were observed in various angles, and agreement was acceptable in measurements such as shoulder and trunk flexion, aligning with previous findings.
In addition, sensor-based technologies, such as the DOCTOR’S EYE system used in the study by Adachi et al. (2015), stand out with their ability to accurately measure range of motion (ROM) and speed of movement in rehabilitation processes23. Kinect’s reported accuracy in assessing movement velocity and ROM indicates that it may be a useful tool in sports performance monitoring and rehabilitation. The results obtained in our study, particularly in smaller joint measurements such as the elbow and wrist, suggest that Kinect Azure can provide consistent outputs not only for large joints but also for smaller ones under the specific conditions tested.
Suriyaamarit and Boonyong (2019), in their study on children with spastic diplegic cerebral palsy, found that Kinect offered high reliability in the Sit-to-Stand test58. In this context, the second hypothesis of our study was that Kinect Azure may offer a faster and more practical alternative to digital goniometry. In measurements with elite-level female weightlifting athletes, Kinect Azure demonstrated good agreement with the digital goniometer and acceptable reliability in terms of ICC values (e.g., 0.961–0.965 for the elbow) under the specific conditions of this study. These results are consistent with those reported by Hong et al. (2023) and suggest that the low cost and portability of Kinect Azure may make it suitable for various field, sports, and rehabilitation applications21. These characteristics support the potential for Kinect Azure to serve as a practical substitute in flexibility tests such as the SRT.
With the measurements taken using a digital goniometer, the resulting SRT findings revealed a high level of reproducibility and consistency. The strong ICC values found in important joints including shoulder, trunk, and elbow suggest that Microsoft Kinect Azure may serve as a reliable alternative for flexibility testing within the scope of this study. These findings coincide with those of Hong et al. (2023), who claimed that Kinect V2 offered excellent dependability as compared to hand approaches in a research assessing lower body flexibility in senior adults (e.g., ICC = 0.938 for the Chair Sit and Reach Test)21. This concordance supports the possibility that Kinect may provide consistent measurements over a wide spectrum of people, from the elderly to professional athletes, indicating potential for broader applications, notably in clinical and outdoor situations.
The Wilcoxon Signed-Rank Test results showed no substantial difference between Kinect and hand methods (p > 0.05), therefore suggesting that Kinect is compatible with manual measurements and may offer an acceptable replacement for conventional methods under the tested conditions. In line with the high ICC values obtained in shoulder and trunk measurements in our study, Napoli et al. (2017) showed that Kinect 2.0 offers good agreement in joint displacements in sit-to-stand movements56. In the Star Excursion Balance Test reported by Eltoukhy et al. (2017), it was stated that Kinect accurately assessed lower extremity kinematics and provided high consistency with traditional measurement systems57. These results suggest that Kinect Azure, which offers a wide range of uses in sports science, rehabilitation and functional movement analysis, has the potential to serve as a reliable measurement tool with its portability and low cost in field and clinical settings. This study specifically focused on young female weightlifters due to their regular training programs and significant international athletic achievements. Additionally, unlike previous studies conducted on the general human population, this study compared data obtained from athletic female weightlifters. Furthermore, future research should investigate the applicability of Kinect Azure to different athletic populations to reveal more specific features and restrictions.
Large joint movement accuracy of Kinect has been extensively recorded in the literature; the device has been found to be quite dependable in analyses encompassing major muscle groups22,54,59. Ejupi et al. (2015) reported Kinect’s high accuracy in sit-to-stand movements54, while Guess et al. (2017) reported Kinect 2.0’s strong compatibility with marker-based systems in the analysis of hip and knee joint movements24. Faity et al. (2022) also reported that Kinect was reliable in upper extremity kinematic measurements, especially in evaluating shoulder and elbow angles during reaching movements from a sitting position, but it was also emphasized that there was a certain variability in these measurements59. In our study, comparable results were obtained with the digital goniometer for large joints such as the shoulder and trunk in the SRT test. These findings suggest that Kinect may serve as a reliable measurement tool for large joints, especially in sports science and clinical applications.
Furthermore, our investigation found that Kinect gave consistent performance in smaller joint motions including elbow and wrist. The ICC values obtained in the wrist angle were computed as 0.937 for baseline and 0.921 for post-movement; these values show strong agreement. Apart from the results of Faity et al. (2022), which confirmed the dependability of Kinect for upper extremity joints like the shoulder and elbow59, our study yielded reasonably consistent results for minor joints like the wrist in addition to the others. The limited data available on small joint measurements such as the wrist in the existing literature suggests that this study contributes useful insights in this area. Our study’s Bland–Altman analysis also showed that the observed differences between Kinect and manual approaches had minimal impact on overall agreement, supporting the potential use of the device for a range of measurement purposes. These results support the potential applicability of Kinect Azure in sports science, rehabilitation, and other movement studies, given its generally consistent performance across both large and small joints.
Many studies published in the literature have confirmed that Kinect produces generally consistent findings in various populations and types of movement analysis22,54,59. Our study highlights Kinect’s potential applicability in sports performance analysis, as it demonstrated good agreement in flexibility measurements among elite-level female weightlifting athletes. These findings suggest that, for flexibility testing, Kinect may serve as a viable alternative to manual techniques. Its low cost, portability, and marker-free nature make it a practical option in both field and laboratory settings.
The capacity of Azure Kinect to assess kinematic and temporal factors was explored by Thomas et al. (2022), who also noted a strong association with marker-based systems including Vicon20. In our study, a high level of agreement was observed between Kinect and the digital goniometer, which supports the device’s potential utility for movement analysis and flexibility assessments. These results suggest that Kinect may be applicable in various areas, including performance analysis and rehabilitation, and holds promise for broader use in sports science and therapeutic settings.
Investigating Azure Kinect’s capacity to evaluate kinematic and temporal parameters, Thomas et al. (2022) also observed a good level of agreement with marker-based systems such as Vicon20. Similarly, our findings indicated a strong agreement between Kinect and the digital goniometer, suggesting that the system may be suitable for both general movement analysis and flexibility assessment. These results imply that Kinect has potential for use in various domains, including performance analysis and rehabilitation, and could be valuable in sports science and therapeutic applications.
When compared to digital goniometer readings, this experiment suggests that SRT measurements obtained with Microsoft Kinect Azure demonstrate reproducibility and consistency. These findings support our main research hypothesis and indicate that Kinect Azure may serve as a practical and reliable alternative to digital goniometry under the specific conditions examined. The findings suggest that Kinect provides acceptable measurement agreement and consistency in the context of the SRT, and may serve as a suitable alternative in flexibility assessments under similar conditions. These results are generally in line with findings from other flexibility assessment studies.
The second hypothesis of our study, that Kinect Azure offers a faster and more practical alternative to the digital goniometer, was supported by our findings. Especially in field applications, Kinect’s mobility and marker-free character may contribute to its potential appeal and usability.
Future studies should gather information from several age groups and sports disciplines to further explore Kinect’s potential in flexibility testing. In addition, the development of calibration processes to increase the measurement accuracy of the device could enhance its evaluation across different joint movements. Thus, the effectiveness and application areas of Kinect in both clinical and field settings may be better understood.
Limitations
This study has some technical limitations. Although Kinect Azure provides high accuracy, especially in static and basic joint movements, it may show performance limitations in dynamic and fast movements. Future studies should comprehensively investigate the accuracy of the device in complex and fast movements.
Moreover, one should take into account how environmental elements (such as field width or lighting conditions) affect the device’s and data accuracy’s calibrating. More thorough research should probe these possible consequences in great detail. It may be said that the results are accurate for this particular population since the group of athletes included in our study comprised elite level athletes.
However, this may limit the generalizability of the results; similar studies should be conducted in individuals of different age groups, sports branches and performance levels. Additionally, the homogeneity of the participant group elite-level female weightlifters with highly consistent training routines and physical profiles may reduce inter-subject variability and artificially inflate agreement measures such as ICC. These athletes likely have stable joint control, limiting variability in flexibility performance compared to recreational or untrained populations. As a result, the high reliability observed in our study may not directly translate to other groups. Future research should include broader and more heterogeneous populations to better evaluate the generalizability and robustness of Kinect Azure in flexibility assessments.
Practical applications
This study suggests that Microsoft Kinect Azure may serve as a consistent measuring instrument in flexibility testing. For sports scientists and coaches, its low cost and portability make it a potentially practical tool for field applications. The data provided by Kinect may assist in assessing the flexibility and mobility of athletes and could contribute to the development of personalized training programs. It has potential to be used as a tool for monitoring young athletes’ development and optimizing training strategies. Future studies could assess the use of the device in team sports and competitive settings to better understand its applicability across various sports disciplines. Moreover, software upgrades and additional hardware may help improve the performance and expand the potential use cases of the system.
Future directions
Future research may broaden the application areas by investigating the use of Microsoft Kinect Azure with athletes from various sports and performance levels (e.g., amateur and professional). Such studies could help assess the device’s validity across different populations, including youth, older individuals, and those with a history of injury. Evaluating Kinect’s accuracy in complex and dynamic movements may also provide insights into its potential for improving measurement precision in sports techniques. In addition, software updates and device integrations might enhance data collection efficiency. Integrating Kinect into training and performance monitoring programs could support the development of athlete-specific training strategies and potentially contribute to sports performance enhancement.
Data availability
Data available on request from the authors (The raw dataset that support the findings of this study are available from the corresponding author upon reasonable request).
Abbreviations
- AR:
-
Augmented reality
- CCR:
-
Cross-correlation coefficients
- Cm:
-
Centimeter
- CV:
-
Coefficient of variation
- CR:
-
Coefficient of repeatability
- (°):
-
Degree
- ESWA:
-
Exponentially smoothed weighted average
- ICC:
-
Intraclass correlation coefficient
- IMU:
-
Inertial measurement unit
- IQR:
-
Interquartile difference
- IR:
-
Infrared
- Kg:
-
Kilogram
- Q1:
-
Quartile 1
- Q3:
-
Quartile 3
- RMSE:
-
Root mean square error
- ROM:
-
Range of motion
- SD:
-
Standard deviation
- SRT:
-
Sit-and-reach test
- ToF:
-
Time-of-Flight
- UI:
-
User interface
References
-
Chu, D. P. K., Luk, T. C. & Hong, Y. EMG activities between sit-and-reach and stand-and-reach: A pilot study. In Proceedings of the 20th Annual International Conference of the IEEE Engineering in Medicine and Biology Society. Vol.20 Biomedical Engineering Towards the Year 2000 and Beyond (Cat. No.98CH36286) https://doi.org/10.1109/iembs.1998.744929
-
Evans, S. A., Housh, T. J., Johnson, G. O., Beaird, J. & Housh, D. J. Age-specific differences in the flexibility of high school wrestlers. J. Strength. Condition. Res. 7 (1), 39–42 (1993).
-
Wells, K. F. & Dillon, E. K. The sit and reach-a test of back and leg flexibility. Res. Q. Am. Assoc. Health Phys. Educ. Recreat. 23(1), 115–118 https://doi.org/10.1080/10671188.1952.10761965 (1952).
-
AAHPERD & Dance Health Released Physical Fitness Test Manual (American Alliance of Health, Physical Education, Recreation and Dance, 1986).
-
Council of Europe Committee for the Development of Sport. EUROFIT: Handbook for the EUROFIT Tests of Physical Fitness (Council of Europe, 1993).
-
Cross, K. M. & Worreli, T. W. Effects of a static stretching program on the incidence of lower extremity musculotendinous strains. J. Athl Train. 34, 11–14 (1999).
-
Hartig, D. E. & Henderson, J. M. Increasing hamstring flexibility decreases lower extremity overuse injuries in military basic trainees. Am. J. Sports Med. 27 (2), 173–176 (1999).
-
Ciullo, J. V. & Zarins, B. Biomechanics of the musculotendinous unit: Relation to athletic performance and injury. Clin. Sports Med. 2 (1), 71–86 (1983).
-
Hage, P. Hamstring inflexibility may predispose to injury. Phys. Sportsmed. 11, 48.
-
Utter, A. C., O’Bryant, H. S., Haff, G. G. & Trone, G. A. Physiological profile of an elite freestyle wrestler preparing for competition: a case study. J. Strength. Conditioning Res. 16 (2), 308–315 (2002).
-
Cornbleet, S. L. & Woolsey, N. B. Assessment of hamstring muscle length in School-aged children using the Sit-and-Reach test and the inclinometer measure of hip joint angle. Phys. Ther. 76 (8), 850–855. https://doi.org/10.1093/ptj/76.8.850 (1996).
-
Chertman, C. et al. A comparative study of lumbar range of movement in healthy athletes and non-athletes. Revista Brasileira De Ortop. (English Edition). 45 (4), 389–394. https://doi.org/10.1016/S2255-4971(15)30385-2 (2010).
-
Ayala, F., Sainz de Baranda, P., De Ste Croix, M. & Santonja, F. Reproducibility and criterion-related validity of the sit and reach test and toe touch test for estimating hamstring flexibility in recreationally active young adults. Phys. Ther. Sport 13 (4), 219–226. https://doi.org/10.1016/j.ptsp.2011.11.001 (2012).
-
Clark, R. A. et al. Validity of the Microsoft kinect for assessment of postural control. Gait Posture 36 (3), 372–377. https://doi.org/10.1016/j.gaitpost.2012.03.033 (2012).
-
Chang, C. Y. et al. Towards pervasive physical rehabilitation using Microsoft Kinect. In 2012 6th International Conference on Pervasive Computing Technologies for Healthcare (PervasiveHealth) and Workshops 159–162 (IEEE).
-
Otte, K. et al. Accuracy and reliability of the kinect version 2 for clinical measurement of motor function. PLoS ONE. 11 (11), e0166532. https://doi.org/10.1371/journal.pone.0166532 (2016).
-
Stone, E. E. & Skubic, M. Fall detection in homes of older adults using the Microsoft kinect. IEEE J. Biomed. Health Inf. 19 (1), 290–301. https://doi.org/10.1109/JBHI.2014.2312180 (2015).
-
Schmitz, A., Ye, M., Shapiro, R., Yang, R. & Noehren, B. Accuracy and repeatability of joint angles measured using a single camera markerless motion capture system. J. Biomech. 47 (2), 587–591. https://doi.org/10.1016/j.jbiomech.2013.11.031 (2014).
-
Xu, X. & McGorry, R. W. The validity of the first and second generation Microsoft kinect™ for identifying joint center locations during static postures. Appl. Ergon. 49, 47–54. https://doi.org/10.1016/j.apergo.2015.01.005 (2015).
-
Thomas, J., Hall, J. B., Bliss, R. & Guess, T. M. Comparison of Azure kinect and optical retroreflective motion capture for kinematic and Spatiotemporal evaluation of the sit-to-stand test. Gait Posture. 94, 153–159. https://doi.org/10.1016/j.gaitpost.2022.03.011 (2022).
-
Hong, J., Joo, H., An, K. O. & Kong, H. J. Developing an augmented Reality-Based ‘senior fitness test’system for elderly individuals with frailty. Asian J. Kinesiol. 25 (2), 36–42 (2023).
-
Galna, B. et al. Accuracy of the Microsoft kinect sensor for measuring movement in people with parkinson’s disease. Gait Posture. 39 (4), 1062–1068. https://doi.org/10.1016/j.gaitpost.2014.01.008 (2014).
-
Adachi, H. & Adachi, E. Using KINECT to measure joint movement for standing up and sitting down. In 2015 9th International Symposium on Medical Information and Communication Technology (ISMICT) 68–72 (IEEE).
-
Guess, T. M., Razu, S., Jahandar, A., Skubic, M. & Huo, Z. Comparison of 3D joint angles measured with the kinect 2.0 skeletal tracker versus a marker-based motion capture system. J. Appl. Biomech. 33 (2), 176–181. https://doi.org/10.1123/jab.2016-0107 (2017).
-
Mahler, D. A., Froelicher, V. F., Moller, N. H. & York, T. D. ACSM’s Guidelines for exercise testing and prescription Fifth edn (William & Wilkins, 1995).
-
KlinichKD & ReedMP Pediatric anthropometry. Pediatr. Injury Biomech. 1–31. https://doi.org/10.1007/978-1-4614-4154-0_1 (2012).
-
Chen, W. & Goyal, S. B. Application of gesture estimation method based on computer. Int. J. Adv. Res. Technol. Innov. 4 (2), 10–17 (2022).
-
Sardari, S. et al. Artificial intelligence for skeleton-based physical rehabilitation action evaluation: A systematic review. Comput. Biol. Med. 158, 106835. https://doi.org/10.1016/j.compbiomed.2023.106835 (2023).
-
Qiu, Z., Martínez-Sánchez, J., Brea, V. M., López, P. & Arias, P. Low-cost mobile mapping system solution for traffic sign segmentation using Azure kinect. Int. J. Appl. Earth Obs. Geoinf. 112, 102895. https://doi.org/10.1016/j.jag.2022.102895 (2022).
-
Eichler, N., Hel-Or, H. & Shimshoni, I. Spatio-temporal calibration of multiple kinect cameras using 3d human pose. Sensors 22 (22), 8900. https://doi.org/10.3390/s22228900 (2022).
-
Wang, B. et al. G-robot: An intelligent greenhouse seedling height inspection robot. J. Rob. 2022 (1), 9355234. https://doi.org/10.1155/2022/9355234 (2022).
-
Bertram, J. et al. Accuracy and repeatability of the Microsoft Azure kinect for clinical measurement of motor function. PLoS ONE 18 (1), e0279697. https://doi.org/10.1371/journal.pone.0279697 (2023).
-
Büker, L., Hackbarth, M., Quinten, V., Hein, A. & Hellmers, S. Towards comparable quality-assured Azure kinect body tracking results in a study setting—influence of light. PLoS ONE 19 (8), e0308416. https://doi.org/10.1371/journal.pone.0308416 (2024).
-
Delasse, C., Lafkiri, H., Hajji, R., Rached, I. & Landes, T. Indoor 3d reconstruction of buildings via Azure kinectrgb-d camera. Sensors 22 (23), 9222. https://doi.org/10.3390/s22239222 (2022).
-
Tölgyessy, M., Dekan, M. & Chovanec, Ľ. Skeleton tracking accuracy and precision evaluation of kinect v1, kinect v2, and the Azure kinect. Appl. Sci. 11 (12), 5756. https://doi.org/10.3390/app11125756 (2021).
-
Romeo, L., Marani, R., Malosio, M., Perri, A. G. & D’Orazio, T. 22–25 June 2021). Performance analysis of body tracking with the microsoft azure kinect. In Paper presented at the 2021 29th Mediterranean Conference on Control and Automation (MED). (2021).
-
Ma, Y., Sheng, B., Hart, R. & Zhang, Y. 7–10 Dec. 2020). The validity of a dual azure kinect-based motion capture system for gait analysis: A preliminary study. In Paper presented at the 2020 Asia-Pacific Signal and Information Processing Association Annual Summit and Conference (APSIPA ASC). (2020).
-
Wei, F. et al. Azure kinect calibration and parameter recommendation in different scenarios. IEEE Sens. J. 22 (10), 9733–9742. https://doi.org/10.1109/JSEN.2022.3166540 (2022).
-
Brambilla, C. et al. Azure kinect performance evaluation for human motion and upper limb Biomechanical analysis. Heliyon 9 (11), e21606. https://doi.org/10.1016/j.heliyon.2023.e21606 (2023).
-
Sayour, M. H., Kozhaya, S. E. & Saab, S. S. Autonomous robotic manipulation: Real-time, deep-learning approach for grasping of unknown objects. J. Rob. https://doi.org/10.1155/2022/2585656 (2022).
-
Wang, F., Sun, S. & Liu, Y. 6–8 Dec. 2019). A bi-directional interactive system of sign language and visual speech based on portable devices. In Paper presented at the 2019 IEEE International Conference on Robotics and Biomimetics (ROBIO). (2019).
-
Wang, G. et al. Design and evaluation of an exergame system of knee with the azure kinect. In Paper presented at the Data Science, Singapore. (2021).
-
Mühlenbrock, A., Fischer, R., Schröder-Dering, C., Weller, R. & Zachmann, G. Fast, accurate and robust registration of multiple depth sensors without need for Rgb and Ir images. Visual Comput. 38 (12), 3995–4008. https://doi.org/10.1007/s00371-022-02505-2 (2022).
-
Niedermayr, D. & Wolfartsberger, J. Analyzing the potential of a time-of-flight depth sensor for assembly assistance. Procedia Comput. Sci. 200, 648–659. https://doi.org/10.1016/j.procs.2022.01.263 (2022).
-
Minárik, I., Vančo, M. & Rozinaj, G. Advanced scene sensing for virtual teleconference. In Paper presented at the Systems, Signals and Image Processing, Cham. (2022).
-
Xing, Q. J. et al. Functional movement screen dataset collected with two Azure kinect depth sensors. Sci. Data. 9 (1), 104. https://doi.org/10.1038/s41597-022-01188-7 (2022).
-
Terven, J. R. & Córdova-Esparza, D. M. Kinz an Azure kinect toolkit for python and matlab. Sci. Comput. Program. 211, 102702. https://doi.org/10.1016/j.scico.2021.102702 (2021).
-
Zhu, Y., Lu, W., Gan, W. & Hou, W. A contactless method to measure real-time finger motion using depth-based pose estimation. Comput. Biol. Med. 131, 104282. https://doi.org/10.1016/j.compbiomed.2021.104282 (2021).
-
Microsoft 06/26/2019). Azure kinect body tracking joints. (2024). Retrieved from https://learn.microsoft.com/en-us/previous-versions/azure/kinect-dk/body-joints#joint-hierarchy
-
Saputra, A. A., Besari, A. R. A. & Kubota, N. Human joint skeleton tracking using multiple kinect azure. In Paper presented at the 2022 International Electronics Symposium (IES). (2022).
-
Schleer, P., Körner, D., Vossel, M., Drobinsky, S. & Radermacher, K. Conceptual design of force reflection control for teleoperated bone surgery. 6(1), 20200014 (2020). https://doi.org/10.1515/cdbme-2020-0014
-
Schober, P. M. D. et al. Correlation coefficients: Appropriate use and interpretation. Anesthesia Analgesia 126(5), 1763–1768 (2018). https://doi.org/10.1213/ANE.0000000000002864
-
Koo, T. K. & Li, M. Y. A guideline of selecting and reporting intraclass correlation coefficients for reliability research. J. Chiropr. Med. 15 (2), 155–163. https://doi.org/10.1016/j.jcm.2016.02.012 (2016).
-
Ejupi, A. et al. Kinect-based five-times-sit-to-stand test for clinical and in-home assessment of fall risk in older people. Gerontology 62 (1), 118–124. https://doi.org/10.1159/000381804 (2015).
-
Kaewkaen, K., Uttama, S., Rueangsirarak, W. & Kaewkaen, P. Test-retest reliability of the five times Sit-to-Stand test measured using the kinect in older adults. J. Assoc. Med. Sci. 52 (2), 138–144 (2019).
-
Napoli, A., Glass, S., Ward, C., Tucker, C. & Obeid, I. Performance analysis of a generalized motion capture system using Microsoftkinect 2.0. Biomed. Signal Process. Control. 38, 265–280. https://doi.org/10.1016/j.bspc.2017.06.006 (2017).
-
Eltoukhy, M., Kuenze, C., Oh, J., Wooten, S. & Signorile, J. Kinect-based assessment of lower limb kinematics and dynamic postural control during the star excursion balance test. Gait Posture. 58, 421–427. https://doi.org/10.1016/j.gaitpost.2017.09.01 (2017).
-
Suriyaamarit, D. & Boonyong, S. Mechanical work, kinematics, and kinetics during Sit-to-Stand in children with and without spastic diplegic cerebral palsy. Gait Posture. 67, 85–90. https://doi.org/10.1016/j.gaitpost.2018.09.03 (2018).
-
Faity, G., Mottet, D. & Froger, J. Validity and reliability of kinect v2 for quantifying upper body kinematics during seated reaching. Sensors 22 (7), 2735. https://doi.org/10.3390/s22072735 (2022).
Acknowledgements
We thank the Turkish Weightlifting Federation and its officials as well as the female weightlifting athletes who participated in the study.
Funding
Karamanoğlu Mehmetbey University Scientific Research Projects Coordination Unit, Projects No: 14-M-24 & 51-M-24.
Ethics declarations
Competing interests
The authors declare no competing interests.
Ethics approval and consent to participate
Our research was performed in accordance with the principles of the 2013 Helsinki Declaration, and approval was obtained from the Local scientific medical research ethics committee of Karamanoğlu Mehmetbey University Medicine Faculty (permission date: 23.09.2024 and number: 10-2024/09). In the study, participants were informed about the study and a signed informed consent form was obtained from the participants. Additionally, the necessary written and signed informed consents for the participants whose personal or clinical details along with any identifying images included to be taken and published were obtained from them and their parent/legal guardian.
Consent for publication
Written consents for publication were obtained from the participants and their parent/legal guardian shown in Figs. 1, 2, 4 and 5, separately.
Additional information
Publisher’s note
Springer Nature remains neutral with regard to jurisdictional claims in published maps and institutional affiliations.
Rights and permissions
Open Access This article is licensed under a Creative Commons Attribution-NonCommercial-NoDerivatives 4.0 International License, which permits any non-commercial use, sharing, distribution and reproduction in any medium or format, as long as you give appropriate credit to the original author(s) and the source, provide a link to the Creative Commons licence, and indicate if you modified the licensed material. You do not have permission under this licence to share adapted material derived from this article or parts of it. The images or other third party material in this article are included in the article’s Creative Commons licence, unless indicated otherwise in a credit line to the material. If material is not included in the article’s Creative Commons licence and your intended use is not permitted by statutory regulation or exceeds the permitted use, you will need to obtain permission directly from the copyright holder. To view a copy of this licence, visit http://creativecommons.org/licenses/by-nc-nd/4.0/.
About this article

Cite this article
Osmanoğlu, U.Ö., Erdaği, K., IŞIK, B. et al. Comparative analysis of Microsoft Kinect Azure and manual measurement methods in the sit and reach test among elite female weightlifters. Sci Rep 15, 24636 (2025). https://doi.org/10.1038/s41598-025-09754-w
-
Received:
-
Accepted:
-
Published:
-
DOI: https://doi.org/10.1038/s41598-025-09754-w