Introduction
The increase in the prevalence of Metabolic-associated steatotic liver disease (MASLD) constitutes a major public health problem. Historically, it was defined as non-alcoholic fatty liver disease (NAFLD) and diagnosed by exclusion of other causes of chronic liver disease. In 2023, a multi-society consensus statement introduced the term MASLD1, which includes adults with excessive fat accumulation in the liver (hepatic steatosis) in the presence of at least one cardiometabolic risk factor and the absence of excessive alcoholic intake. Because of the global epidemic of metabolic disorders2 MASLD has surged to be the most common cause of chronic liver diseases, posing significant challenges in healthcare management. Progression of MASLD leads to liver fibrosis, characterized by abnormal accumulation of extracellular matrix proteins, which triggers liver scarring and functional degradation3. Its escalation could lead to more severe complications, including cirrhosis, liver failure, and hepatocellular carcinoma4. Fibrosis caused by MASLD combines metabolic dysregulation and pathologic tissue remodeling; thus, timely intervention is needed to stop disease progression.
The gold standard for diagnosing and monitoring liver fibrosis is liver biopsy. Although informative, it is an invasive procedure that carries risks such as pain, bleeding, and infection. For this reason, significant effort was made to discover accurate, noninvasive diagnostic tools for liver fibrosis to enhance patient safety and clinical management5. These methods, including blood-based biomarkers and elastography, provide valuable tools. Still, they have limitations, particularly in their efficiency for screening and early detection of liver fibrosis in the general population6. Their use is particularly challenging in the context of an aging population. Aging impacts metabolic homeostasis and complicates MASLD’s pathophysiology, making treatment and management more difficult7. It was recently shown that existing fibrosis scores have lower accuracy in elderly patients, leading to the need for revised or new scoring systems that can more accurately predict fibrosis without being skewed by age-related factors8. Existing noninvasive fibrosis scores, such as the Fibrosis-4 (FIB-4) index9, tend to have lower specificity and higher false-positive rates in elderly patients, as they were primarily validated in younger populations. More recently, the Fibrosis-3 (FIB-3) index was developed to overcome this limitation by excluding age from the formula10. This index, together with others presented previously11,12, highlights the importance of creating scores that exclude age. This is crucial because age is not linearly correlated with the extent of liver fibrosis, leading to potential inaccuracies when using age-dependent indices across various age groups.
In this context, we aimed to develop an age-independent MASLD-related liver fibrosis index using a comprehensive inflammatory, hematological, and metabolic marker panel. The analysis of hemogram features, such as platelet count and mean corpuscular volume, can provide valuable insights into the extent of liver damage and potential complications like thrombocytopenia13. Inflammation is important in advancing liver fibrosis, with inflammatory mediators triggering fibrogenesis14. Metabolic markers can potentially reveal disruptions in metabolic functions that commonly accompany liver fibrosis15. Using such a broad source of blood-based markers increases the chances of finding variables related to different physiological aspects of the disease that can be combined into a more efficient score that can be applied to patients regardless of age.
Results
Study participants
This study included 63 adults diagnosed with MASLD and 22 controls. Transient elastography analysis showed that out of 63 subjects with steatosis, 38 had no/mild fibrosis (F0-1), and 25 had significant fibrosis (consisting of F2 = 10, F3 = 7, F4 = 8). The characteristics of the study participants are summarized in Table 1. There were no significant differences among the groups regarding triglyceride levels. Groups with substantial fibrosis (F2, F3, F4) were more likely males, which may impact the identification of potential markers associated with liver fibrosis, potentially leading to a higher proportion of biases toward male characteristics in the responses. Patients with advanced fibrosis (F3) had more frequent Type 2 diabetes.
A comprehensive inflammatory and hematological-metabolic panel (IHMP)
We tracked the progression of liver fibrosis related to MASLD by measuring a wide range of potential markers. We gathered data on circulating cell types and physical characteristics through a comprehensive blood test analysis. In addition, we evaluated the levels of 13 inflammatory cytokines. Additionally, we identified and quantified 52 blood-circulating metabolites in a single experiment using NMR. They belong to different chemical classes, including hydroxy, keto-, carboxylic-, amino acids, amine derivatives, carbohydrates, and organic nitrogen compounds. Table 2 presents the complete list of variables investigated for their association with the level of liver fibrosis. These variables constitute an Inflammatory and Hematological-Metabolic Panel (IHMP) encompassing 84 variables. The complete dataset is available in Table S1.
The IHMP-based profile of liver fibrosis
In the initial analysis stage, we utilized the levels of the 84 features in the IHMP as dependent variables to examine their correlation with liver fibrosis based on the F0-F4 scale, as described in Materials and Methods. According to Eq. (1), fibrosis, age, diabetes, hypertension, dyslipidemia, and the interaction term between age and fibrosis were considered the independent variables. With this approach, we sought the linear combination of conditions that best explains the distribution of each IHMP feature’s levels. The analysis output included coefficients displaying the strength and direction of the relationship between each independent and dependent variable. Their associated p-values were utilized to determine the significance of these relationships. The comprehensive results of this analysis are listed in Table S2.
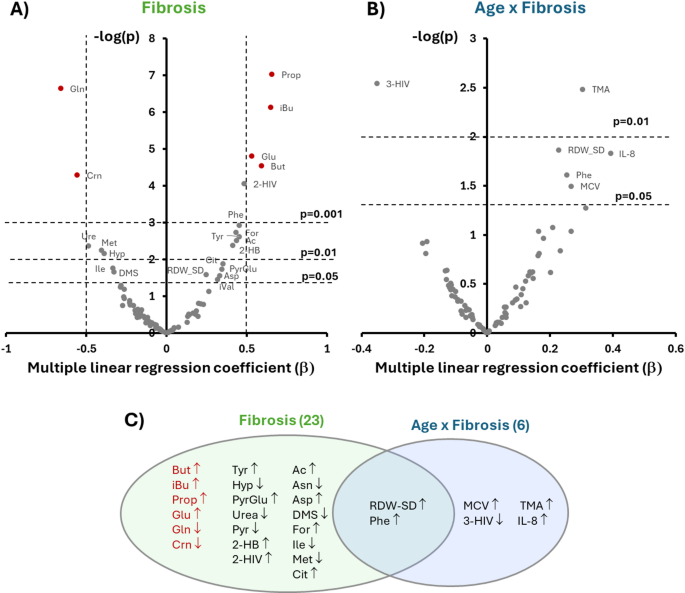
Then, we generated plots16 to concurrently evaluate the effect size, direction, and statistical significance of the association of each IHMP feature with liver fibrosis and the interaction term age x fibrosis (Fig. 1A–B). Figure 1C summarizes the findings of this evaluation. We could classify the variables into three groups according to their associations.

Multiple linear regression coefficient (b) and regression p-value in logarithmic scale of the 83 variables with liver fibrosis (A) and age x fibrosis interaction (B). Variables with labels are the only ones that show a significant correlation. Variables in red show a significant association with fibrosis even after a Bonferroni correction. Venn diagram of the variables significantly correlated with the three conditions (C). The variables in red in (A) and (C) significantly correlate with fibrosis progression independently of age. Abbreviations are defined in Table 2.
The first group comprises 21 variables correlating only with fibrosis, i.e., sensitive to disease progression but not to age. Pathways analysis of the fibrosis-related metabolite changes reflects a broad involvement of energy production pathways (Pyr, Ac, For, 2-HB, Cit), increased amino acid turnover (Glu, Gln, Tyr, Ile, Asn, Asp, Met, 2-HIV), extracellular matrix remodeling (Hyp, PyrGlu), urea cycle function (Urea, Asn, Asp), sulfur metabolism (DMS, Met), alterations in gut microbiome activity (But, iBu, Prop), and systemic responses to liver injury (Crn).
A second group comprises six variables correlating only with the interaction term age x fibrosis. The identity of these features suggests that the combined or synergistic effect of aging and fibrosis may exacerbate systemic inflammation (IL-8), impact amino acid metabolism (3-HIV), influence gut microbiota composition or function (TMA), and alter the RBC turnover (MCV).
Finally, we found two variables (Phe and RDW-CV) associated with fibrosis and age x fibrosis that are related to amino acid metabolism (Phe) and dysfunctional RBC turnover (RDW-CV).
To derive an index that scores liver fibrosis independent of age, we concentrated our attention only on variables of the first group. Based on Fig. 1A, the metabolites that exhibit the most significant association within this group are Crn, Glu, Gln, and three Short-Chain Fatty Acids (SCFAs): But, iBu, and Prop. Their association with fibrosis remains significant after accounting for multiple comparisons, with corrected p-values less than 0.001 for all the metabolites, as determined using a Bonferroni correction.
Figure 2 shows their concentration changes as a function of the liver fibrosis index. We observed an increase in circulating levels of Glu and SCFAs and a decrease in Gln and Crn as a function of fibrosis severity.

Concentrations of metabolites significantly correlated with fibrosis progression independently of age and already proposed with their average and standard deviation values [mM] measured as a function of the fibrosis scale. The change in metabolite concentrations was compared to the previous value on the scale to determine its significance. *p < 0.05, **p < 0.01.
A combined metabolic score to stage liver fibrosis associated with MASLD: the GP index
To minimize the risk of overfitting and to provide an internal validation closer to an independent cohort, we randomly divided the 63 MASLD serum samples into a training set (n = 48) and a validation set (n = 15). The GP index was developed exclusively on the training set, using the six metabolites most strongly correlated with fibrosis. We generated all potential combinations of these six variables to extract the best combination and employed various metrics, such as pseudo-R2, AIC, BIC, CVA, and AUC, for candidate comparison. Higher pseudo-R2 values signify a more comprehensive explanation of outcome variance, while lower AIC and BIC values suggest improved model fit and simplicity. CVA estimates predictive capability, while AUC measures class distinguishability. We excluded the control group to perform these calculations and divided individuals with MASLD into two groups based on their fibrosis level: none/mild (F = 0,1) and severe (F = 2–4). We assessed all 63 possible combinations, with Table 3 showcasing the top 5 performers in terms of a combined index (CI) that merges all the metrics defined in Materials and Methods.
Among the combinations tested on the training set, the model including Gln + Prop achieved the best balance of fit and predictive performance, showing the lowest AIC and BIC values, the highest CVA, and the highest CI score. This combination was therefore selected to construct the GP index. Other three-variable models, such as Crn + Gln + Prop or Crn + Gln + iBu, reached comparable AUC values. Still, their higher AIC and BIC indicated added complexity without a corresponding improvement in overall performance.
The coefficients of this index, called GP, are shown in Table 4.
We then investigated whether adding age or age and sex as covariates improves the predictive performance of the GP model for liver fibrosis. The analysis involved comparing the base model against two other models. Table 5 summarizes the metrics used for the comparisons.
Given the minimal improvement in metrics such as Pseudo-R2, AIC, and AUC, coupled with the non-significant LRT p-values, we can conclude that the inclusion of age as a covariate does not significantly enhance the performance of the GP model in distinguishing MASLD patients with different levels of fibrosis. In addition, while sex can be included in the model, it does not appear to be a crucial factor, and the GP model can perform effectively without it. We cannot consider this last result as definitive because of the low presence of females with advanced fibrosis or cirrhosis in our cohort (Table 1).
Statistical evaluation of FIB-3, FIB-4, and GP performance in predicting liver fibrosis
To evaluate the GP index against established clinical scores, we focused the validation analysis on the FIB-4 index, which includes age in its formula, and the more recently proposed FIB-3 index, designed to avoid age-related bias by excluding age. This comparison was performed exclusively on the 15-sample validation set, using the GP coefficients derived from the training subset. Table 6 reports the performance metrics (AUC, sensitivity, specificity) for the GP index alongside FIB-4 and FIB-3, providing an internal test of generalizability on previously unseen data.
When applied to the independent validation subset, the GP index maintained a superior discriminative ability compared to both FIB-4 and FIB-3, supporting its robustness despite being derived from a limited cohort. In this validation set, FIB-4 achieved a slightly higher AUC than FIB-3, indicating that the age-independent design of FIB-3 did not confer an advantage in this small internal validation subset. Notably, the GP index exhibited higher sensitivity than both FIB scores, a desirable property for an index intended to track the progression of fibrosis stages over time. Conversely, its specificity was lower, while FIB-4 and FIB-3 maintained higher specificity, a critical feature for diagnosing advanced fibrosis and minimizing false positives. This complementary profile suggests that while FIB-4 and FIB-3 are useful as diagnostic thresholds, the GP index may offer an advantage in tracking the continuum of fibrosis progression. In fact, compared to other metabolite-based scores derived from our dataset, such as the BCAAs-to-Tyrosine ratio (BTR)17,18,19,20, the combined SCFAs index21, and the Glu/Gln ratio22, GP demonstrated the most consistent and progressive variation along the entire fibrosis scale (Fig. 3). This behavior indicates that GP captures metabolic changes that evolve gradually with disease severity, making it particularly suitable for longitudinal monitoring of MASLD patients. In contrast, other indices tended to discriminate mainly at the extremes of the fibrosis spectrum, which limits their utility for staging intermediate phases of the disease.

Scatter plots of the measured values of three MASLD-related Liver Fibrosis prognostic indexes: BTR, Glu/Gln, SCFA s, and the new proposed MASLD-related liver fibrosis index (GP) scatter plot. The change in index values was compared to the previous value on the scale to determine its significance. *p < 0.05, **p < 0.01.
Discussion
Our investigation sought to assess a range of potential biomarkers suitable for developing a composite index for the independent detection of severe fibrosis, irrespective of age-related factors. Recent guidelines recommend using noninvasive blood-based biomarkers for fibrosis evaluation in metabolic liver disease patients23. To improve the chances of discovering reliable markers, we merged data from three sources: the hemogram, the inflammation panel, and the metabolic panel, collectively named the IHMP. At first, we utilized a multiple linear regression model similar to the one we recently developed to investigate the metabolic crosstalk in multimorbidity24. It included the level of liver fibrosis, age, sex, BMI, diabetes, dyslipidemia, and hypertension as independent variables and the 84 feature levels from the IHMP as dependent variables. Including comorbidities such as diabetes, dyslipidemia, and hypertension in the linear regression model enhances the model’s accuracy and specificity by accounting for the potential confounding effects of these metabolic conditions on liver health, thereby allowing for more precise isolation of the direct markers of fibrosis. We also incorporated the interaction term between age and fibrosis to identify markers that exhibit distinct changes in different age groups.
We divided the variables into three groups. The first group comprises 21 variables correlating only with fibrosis, not with the interaction term age x fibrosis. These variables are sensitive to disease progression independently of age. The second group consists of variables correlating only with the interaction term, reflecting the combined effects of aging and fibrosis. The third group includes variables associated with both fibrosis and age x fibrosis and factors sensitive to disease progression but dependent on age.
The last group of variables showed increased IL-8 concentration, a cytokine linked to liver fibrosis. Our findings suggest that aging and fibrosis together have a more significant effect on IL-8 levels, exacerbating inflammation and liver fibrosis in older individuals25,26. This interaction aligns with the “inflammaging” concept, contributing to age-related diseases27. Our study, together with others28,29,30, indicates that interleukin levels may serve as noninvasive markers for liver fibrosis, but their relationship with fibrosis is conditional upon age.
The correlation between RDW-SD and the age-fibrosis interaction is due to a link between erythropoiesis and the inflammatory response. Inflammation increases oxidative stress and leads to dysregulation and increased iron and vitamin B12 utilization, resulting in reduced erythropoiesis and elevated RDW31. RDW has been proposed as an indicator for patients with MASLD and MASH, showing high specificity and sensitivity32,33. It is also independently associated with advanced fibrosis in patients with MASLD34. However, its increase is age-dependent, as indicated in our results by its correlation with the age x fibrosis interaction term.
To develop a new age-independent index to detect liver fibrosis non-invasively, we focused on the first group, which included markers associated with fibrosis but not influenced by age. We selected six features (Crn, Glu, Gln, Prop, iBu, and But) based on their strong correlation with fibrosis regarding effect size and statistical significance. Despite the limited cohort size, our analysis has confirmed several connections between IHMP markers and liver fibrosis observed in recent investigations involving larger groups of subjects. A study of 296 patients with MASLD revealed that a reduced serum Crn predicted moderate to severe fibrosis in Chinese Americans35. Analysis of serum samples from 200 biopsy-proven MASLD patients across different fibrosis stages demonstrated that an elevation in Glu and a decrease in Gln were strongly associated with fibrosis progression22. In addition, targeted metabolomics on samples from 100 MASLD patients and 50 healthy controls exhibited increased SCFA plasma concentrations attributable to the disease compared to the control group21. These metabolites are associated with three distinct physiological aspects: the relationship between sarcopenia and liver fibrosis (Crn), the increased glutaminolysis in fibrogenic cells (Glu, Gln), and gut dysbiosis (Prop, But, iBu).
In chronic liver diseases such as MASLD, common pathogenetic mechanisms, including insulin resistance, hormonal imbalance, systemic inflammation, and changes in physical activity, contribute to the development and exacerbation of both liver fibrosis and sarcopenia36. Research indicates that assessing skeletal muscle mass can serve as a valuable noninvasive method to monitor the progression of liver fibrosis37. Physiologically, muscular atrophy reduces insulin activity targets, leading to glucose intolerance and increased gluconeogenesis, subsequently accelerating muscle wasting and protein breakdown, resulting in decreased Crn levels. With the progression of insulin resistance, rates of lipolysis increase, leading to higher free fatty acid generation stored in muscle and liver tissues35.
On the other hand, during the progression of MASLD, glutaminolysis is increased, particularly in hepatic stellate cells (HSCs)38. This metabolic shift is driven by the enhanced bioenergetic and biosynthetic demands of activated HSCs, which play a central role in fibrogenesis. Specifically, the liver experiences a transition from the expression of Gls2 (liver-type glutaminase) in healthy livers to Gls1 (kidney-type glutaminase) in fibrotic livers. The heightened glutaminase activity leads to increased conversion of glutamine to glutamate, which fuels the TCA cycle and supports succinate production. Succinate, in turn, activates its receptor GPR91 to promote fibrogenic pathways, including the upregulation of α-SMA and collagen type I, contributing to the progression of liver fibrosis39. Consequently, there is a change in the Glu/Gln ratio that can be used as a marker to assess liver fibrosis22.
Finally, our results and those of Thing et al.21 have indicated a positive correlation between liver fibrosis and the circulating levels of SCFAs. The mechanisms connecting SCFAs to liver fibrosis and MASLD progression might involve direct and systemic metabolic effects on the liver. The gut microbiota mainly produces SCFAs through the fermentation of dietary fibers. SCFAs have been shown to influence the activity of AMP-activated protein kinase (AMPK)40, a crucial regulator of cellular energy balance. Inhibition of AMPK by excessive SCFAs, particularly in conditions of dysbiosis where SCFA levels may be unusually high, can result in reduced fatty acid oxidation and increased lipogenesis, thereby contributing to hepatic fat accumulation40. The role of these metabolites in fibrogenesis is still being investigated, and additional research is required to fully understand their impact on disease progression.
To derive a combined metabolic score for staging MASLD-related liver fibrosis, we focused on the six metabolites most strongly associated with fibrosis independent of age. To avoid overfitting and provide an unbiased index-performance estimate, we randomly divided the 63 MASLD samples into a training set (n = 48) and a validation set (n = 15). The GP index was derived using only the training set, where all possible combinations of the six candidate metabolites were evaluated using pseudo-R2, AIC, BIC, CVA, and AUC metrics. Among these, the combination of glutamine (Gln) and propionate (Prop) emerged as the most robust model, leading to the definition of the GP index.
The predictive ability of the GP index was then compared to established clinical scores using the independent validation set composed of unseen samples. We focused on FIB-4, a well-established and guideline-endorsed non-invasive score that is widely used in clinical practice for MASLD and other chronic liver diseases41, and on the more recently proposed FIB-3 index10, designed to reduce age-related bias and validated in several independent cohorts. In the validation cohort, the GP index demonstrated higher sensitivity than FIB-4 and FIB-3, a desirable feature for an index that tracks disease stages. Conversely, FIB-4 and FIB-3 showed higher specificity, which is more relevant for diagnostic purposes. Importantly, GP maintained good discriminatory power when applied to data not used for its derivation, supporting its potential utility as a metabolic staging tool. The comparison with other metabolite-based scores (BTR, SCFAs index, Glu/Gln ratio) was performed on the full dataset of 63 samples, confirming that GP provided the most consistent variation across the entire fibrosis scale (Fig. 3).
While liver biopsy remains the gold standard for MASH diagnosis, when it comes to only liver fibrosis assessment, its invasive nature and associated risks make it unsuitable when noninvasive alternatives are available. Fibroscan was employed in this study as the primary reference standard due to its widespread clinical acceptance and alignment with current ethical guidelines. Although Fibroscan is highly reliable for detecting advanced fibrosis (≥ F3) and cirrhosis (F4), it is less effective at distinguishing between earlier stages, such as F1 and F2 fibrosis, due to overlapping liver stiffness values42.
Our study has limitations: a small number of subjects was included, and a sex imbalance was noted in the groups with advanced fibrosis. The small number of subjects limits the study’s statistical power, even though the GP index is based on two known alterations proposed in previous studies21,22. However, larger cohorts will be necessary to determine the real accuracy and predictability of the GP index. The unbalanced sex ratio makes it difficult to assess its influence on the disease’s pathophysiology, potentially leading to biased outcomes. In addition, the inclusion of only a small proportion of patients over 65 (10 out of 63 participants) represents a limitation in assessing the age-independent effectiveness of the proposed index. It is possible that studying larger and more diverse populations could help validate the GP index, and conducting prospective studies in real-world clinical settings could demonstrate its applicability in routine practice.
Another limitation of this study is the absence of quantitative data regarding the amount of steatosis across the full patient cohort. Although we confirmed whether steatosis was present or absent in all patients, the lack of exact quantitative measures hinders a thorough analysis of its possible effect on the GP index and its link to fibrosis. Future research should include quantitative evaluations of steatosis, such as controlled attenuation parameter (CAP) measures or histological grading43, to assess its potential influence on the results and enhance the GP index.
The limited cohort size constrained our ability to perform statistically significant distinctions between adjacent fibrosis stages, particularly F2/F3 (intermediate fibrosis) and F4 (advanced fibrosis). Furthermore, we are aware that transient elastography has a limited capacity to discriminate between intermediate stages of fibrosis (F2/F3). However, the results presented in Fig. 3 suggest that the GP index has the potential to provide finer resolution among these stages in larger, more diverse cohorts. This finding is particularly promising, as patients with F2/F3 fibrosis may be candidates for MASLD-specific therapeutic interventions, while those with F4 fibrosis require HCC monitoring. Future studies should aim to validate the GP index in larger patient populations to confirm its utility in distinguishing between these clinically significant stages of fibrosis and further explore its role in guiding therapeutic decision-making.
Conclusions
This study focused on identifying age-independent markers from a broad panel of variables to develop a novel noninvasive index for assessing liver fibrosis related to MASLD. While inflammation reporters like IL-8 and RDW-CV correlate with fibrosis severity, they were excluded from the final index to avoid age-related biases. The new GP index, composed of Gln and Prop, offers a robust diagnostic tool for MASLD-related fibrosis that appears to perform well across different ages, though further validation in elderly populations is warranted. Its simplicity, cost-effectiveness, and high predictive power make it advantageous for accurately staging liver fibrosis across diverse age groups, potentially improving diagnostic accuracy and patient outcomes. Future studies will be needed to further validate and refine the index by including larger, sex-balanced, and ethnically diverse cohorts.
Materials and methods
Study population
The “Integrated phenotyping of the Gut-plAtelet-Liver AXIS in the progression of chronic liver disease” (iGAL-AXIS)” project is an observational, prospective study aimed at exploring the relationship between gut dysbiosis, metabolome composition, inflammation, and platelet activation in chronic liver disease. Individuals (> 18 years) diagnosed with MASLD based on EASL guidelines44 were enrolled and classified according to the level of fibrosis. Specifically, MASLD was defined by the presence of hepatic steatosis, occurring in subjects with at least one cardiometabolic risk factor and the absence of significant alcohol intake (greater than 20 g per day for women and 30 g per day for men)45. The study accounted for several covariates: age, sex, body mass index (BMI), diabetes, hypertension, dyslipidemia, and medication use. The study was conducted in full conformance with the principles of the Declaration of Helsinki, and it was approved by the local Ethics Committee of Policlinico Umberto I, Sapienza University of Rome, Rome, Italy (reference 6804, 09/11/2022). Written informed consent has been obtained from all patients.
Assessment of Liver steatosis and fibrosis
Vibration-controlled transient elastography (FibroScan, Echosens, Paris, France) was used for liver assessment, employing both M and XL probes and an automatic probe selection tool that determines the most suitable probe based on real-time measurements of the skin-to-liver capsule distance. The procedure was conducted according to the manufacturer’s guidelines and training. The operator was blinded to all clinical data and patient diagnoses. Fibrosis staging by transient elastography was classified using the following thresholds: 8.2, 9.7, and 13.6 for diagnosing ≥ F2, ≥ F3, and F4, respectively46.
The reliability of fibrosis staging was assessed by summarizing LSM values for each fibrosis category (F0–F4). Ten valid measurements were obtained per patient, and results were considered valid when the FibroScan-specific IQR/median was ≤ 0.30. Table 7 reports the mean ± SD, median [IQR], minimum and maximum LSM values, and corresponding IQR/median values for each fibrosis category. All categories showed IQR/median values well below the 0.30 threshold, indicating robust measurement quality and supporting the accuracy of fibrosis staging in this cohort.
Hemogram and inflammatory profiling
At enrollment, venous blood samples were collected from study participants. EDTA-anticoagulated blood was used to obtain the hemogram profile on a Sysmex hematology analyzer. Blood samples were collected from all participants after an overnight fast of at least 10 h to minimize variability in metabolite levels caused by dietary intake. This standardized protocol ensured consistent conditions across all samples and reduced potential confounding effects related to the fed or fasting state. Blood without anticoagulants was allowed to clot, and serum was separated by centrifugation at 3400 g for 20 min. Coded samples were stored at − 80 °C until batch analysis.
The concentration of inflammatory cytokines was assessed in serum samples by multiplex bead-based flow cytometric assay (Biolgend, Inflammation Panel I, catalog number 740809), according to the manufacturer’s instructions. Briefly, after thawing, the serum samples were immediately centrifuged at maximum speed and transferred to new tubes. A small volume of each serum (25ul) was diluted 1:1 in the Assay buffer provided in the kit. Each serum was incubated with 13 bead populations distinguished by size and internal APC fluorescent dye, which bind to 13 distinct human inflammatory cytokines and chemokines, including IL-1β, IFN-α2, IFN-γ, TNF-α, MCP-1 (CCL2), IL-6, IL-8 (CXCL8), IL-10, IL-12p70, IL-17A, IL-18, IL-23, and IL-33. The following day, the beads were incubated first with cytokine-specific biotinylated antibodies and then with Streptavidin–phycoerythrin, and they were immediately acquired at a BD Accuri C6 Plus flow cytometer. Cytokine-specific populations were segregated based on the size and internal APC fluorescence intensity. The concentration of a particular cytokine was quantified based on the PE fluorescent signal according to a standard curve generated in the same assay. Measurements were ascertained while blinded to the sample origin. All samples were assayed in duplicate, and those showing values above the standard curve were retested with appropriate dilutions.
The FIB-4 index was assessed in 44 patients. It was calculated using the following formula: [age (years) × AST]/[platelet counts (× 109/L) × ALT1/2]47.
1H-NMR spectroscopy-based metabolomics
Thawed serum samples underwent protein removal using 3 kDa cut-off Amicon Ultra-0.5 centrifugal filter devices. The filters were washed four times with distilled water to eliminate glycerol (13,800 g, 4 °C for 20 min), followed by centrifugation at 13,800 g for 90 min. NMR buffer (250 mM phosphate buffer KH2PO4/K2HPO4, pH 7.4, containing 0.82 mM sodium trimethylsilyl propanoate-d4, 10% D2O, and 2% NaN3) was added to each filtered serum to reach a final volume of 600 μL. The resultant solution was then transferred into a 5 mm NMR tube.
The 1H-NMR spectra for each sample were obtained using a Bruker Avance 700 MHz spectrometer equipped with a triple resonance TXI probe and a SampleXpress Lite autosampler. The spectra were collected at 25 °C using a noesypr1d sequence, with 1024 scans, four dummy scans, a spectral width of 16 ppm, an acquisition time of 2 s, a relaxation delay of 3 s, and a mixing time of 100 ms. Following the acquisition, the spectra were processed with 0.5 Hz of line-broadening, and then manual phase and baseline correction were performed. Chenomx NMRSuite 8.5 (Chenomx Inc.) was used to quantify metabolites, with TSP- d4 serving as the internal standard. 52 metabolites were quantified using this method in almost all samples.
Data analysis
All statistical analyses were conducted using R v4.3.1 (https://www.r-project.org), and plots were created using Excel. All inferential tests are two-tailed with a nominal alpha level of 0.05. Due to the analyses’ exploratory nature, no multiplicity adjustments were made. The p-values for the most significant associations between metabolites and fibrosis were further validated using the Bonferroni correction. The metabolite concentrations were normalized before statistical analysis using probabilistic quotient normalization48, and the data from the inflammation panel were log-transformed. The combined data sets, including the hemogram, inflammation panel, and metabolic panel, comprised 84 variables.
Additionally, variables describing the demographic and health conditions of the subjects, such as age, sex (1 for female), BMI, fibrosis, diabetes, hypertension, and dyslipidemia were included in the analysis. The fibrosis variable was created by assigning a value of 0 to the control group and values of 1 (F = 0,1) through 4 (F = 2,3,4) based on the fibrosis scale49. Table S1 shows all the data used in this analysis.
Before calculating the interaction terms, the collinearity of the variables was tested. As age and fibrosis were found to be collinear, all the conditions were scaled using unit variation (UV)50. Then, we calculated and UV-scaled the interaction term between age and fibrosis. Finally, we UV-scaled all the measured variables. This ensures that the coefficients will be comparable and allows the determination of the relative importance of the effect.
To compute the profile linked to individual conditions, each of the 84 measured variables (Mi) was linearly correlated with the seven parameters (Cj) describing the previously mentioned demographic and health conditions, along with the interaction term, following the Eq. (1) as previously described24:
$${{varvec{M}}}_{{varvec{i}}}={{varvec{beta}}}_{{varvec{i}}0}+sum_{{varvec{j}}=1}^{8}{{varvec{beta}}}_{{varvec{i}}{varvec{j}}}{{varvec{C}}}_{{varvec{j}}}$$
(1)
For each of the 84 equations, the values of the nine coefficients, their standard errors, t-values, p-values, and 95% CI were calculated, and the complete results are shown in Table S2. The set of metabolites showing statistically significant association with a given condition represents its corresponding profile. Using this approach, we explored the correlation between variable levels and fibrosis stages across the entire F0-F4 spectrum. This model, described by Eq. (1), obviated the need to convert the fibrosis condition into a binary variable as necessitated by the more frequently employed logistic regression technique.
In evaluating the predictive ability of various indexes for explaining the severity of liver fibrosis (F = 0–1 versus F = 2–4), an unmatched logistic regression model was employed with and without adjustments for age and sex. To address potential issues of bias and separation in logistic regression, particularly in small sample sizes or when events are rare, we utilized Firth’s method, a penalized maximum likelihood logistic regression implemented through the logistf function. This same approach was used to construct a mixed model combining metabolite concentrations.
To construct the GP index, we first analyzed the 84 inflammatory, hematological, and metabolic variables using multivariate linear regression adjusted for age and fibrosis stage. Variables significantly associated with fibrosis and unrelated to age (Bonferroni-adjusted p < 0.001) were retained as candidate markers. This procedure reduced the dimensionality of the dataset and eliminated age-related confounders. To avoid over-parameterization and to evaluate the model on independent data, the cohort of 63 MASLD patients was randomly divided into a training set (n = 48) and a validation set (n = 15). All combinations of the selected candidate metabolites were tested in the training set using pseudo-R2, Akaike and Bayesian information criteria (AIC, BIC)51, cross-validation accuracy (CVA)52, and area under the ROC curve (AUC). AIC) and BIC, together with CVA), were used to provide insights into the model fit and predictive performance. The pseudo-R2 statistics measure the model’s explanatory power, indicating how well the model explains the variance in the dependent variable53. Finally, DeLong’s non-parametric test was used to compare the AUCs of two ROC curves to evaluate the discriminative ability of the models. To determine the best model considering all the metrics, we created a combined index that considers each metric’s relative importance. Pseudo-R2, CVA, and AUC values were scaled between 0 and 1, where 1 represents the best performance. We used an inverted scale for AIC and BIC so that the lower AIC and BIC scores, which indicate models that best explain the data with the fewest parameters, correspond to higher normalized values. The combination with the best overall performance and parsimony was selected to define the GP index. The final model coefficients were calculated exclusively on the training set and subsequently applied without modification to the validation set to assess performance on unseen data. To test whether the inclusion of age or age and sex as covariants provides a better index, we used the Likelihood Ratio Test (LRT) and its associated p-value54.
Data availability
The datasets used and/or analyzed during the current study are available from the corresponding author upon reasonable request.
References
-
Rinella, M. E. et al. A multisociety Delphi consensus statement on new fatty liver disease nomenclature. J. Hepatol. 79, 1542–1556 (2023).
-
Boccatonda, A. et al. From NAFLD to MAFLD: Definition pathophysiological basis and cardiovascular implications. Biomedicines 11, 883 (2023).
-
Kong, D., Zhang, F., Zhang, Z., Lu, Y. & Zheng, S. Clearance of activated stellate cells for hepatic fibrosis regression: Molecular basis and translational potential. Biomed. Pharmacother. 67, 246–250 (2013).
-
Tsochatzis, E. A., Bosch, J. & Burroughs, A. K. Liver cirrhosis. The Lancet 383, 1749–1761 (2014).
-
Elena, P., Raluca Ioana, A., Andrei Emilian, P. & Adorata Elena, C. Non-invasive serological markers of hepatic fibrosis—mini review. Arch. Surge. Clin. Res. 8, 032–038 (2024).
-
Auricchio, P. & Finotti, M. From NAFLD to chronic liver diseases. assessment of liver fibrosis through non-invasive methods before liver transplantation: Can we rely on them?. Transplantology 4, 71–84 (2023).
-
Zupo, R. et al. Liver fibrosis and 8-year all-cause mortality trajectories in the aging cohort of the Salus in Apulia study. Biomedicines 9, 1617 (2021).
-
Pitisuttithum, P. et al. Predictors of advanced fibrosis in elderly patients with biopsy-confirmed nonalcoholic fatty liver disease: The GOASIA study. BMC Gastroenterol 20, 1–9 (2020).
-
Nahon, P. et al. Assessment of liver fibrosis using transient elastography in patients with alcoholic liver disease. J. Hepatol. 49, 1062–1068 (2008).
-
Kariyama, K. et al. Fibrosis-3 index: a new score to predict liver fibrosis in patients with nonalcoholic fatty liver disease without age as a factor. Gastro. Hep. Adv. 1, 1108–1113 (2022).
-
Krishnasamy, N. et al. Non-invasive markers: Fibrometer, fibroscan vs liver biopsy in detecting liver fibrosis in HBV patients. J. Clin. Exp. Hepatol. 6, S100–S101 (2016).
-
Ogawa, Y. et al. Wisteria floribunda agglutinin-positive Mac-2-binding protein and type 4 collagen 7S: Useful markers for the diagnosis of significant fibrosis in patients with non-alcoholic fatty liver disease. J. Gastroenterol Hepatol. 33, 1795–1803 (2018).
-
Choe, E. K. & Kang, H. Y. The association between platelet-related parameters and nonalcoholic fatty liver disease in a metabolically healthy nonobese population. Sci. Rep. 14, 1–8 (2024).
-
Seki, E. & Schwabe, R. F. Hepatic inflammation and fibrosis: Functional links and key pathways. Hepatology 61, 1066–1079 (2015).
-
Semenovich, D. S. et al. Fibrosis development linked to alterations in glucose and energy metabolism and prooxidant-antioxidant balance in experimental models of liver injury. Antioxidants 12, 1604 (2023).
-
Li, W. Volcano plots in analyzing differential expressions with mRNA microarrays. J. Bioinform. Comput. Biol. 10, 1231003 (2012).
-
Enomoto, H. et al. A new metabolism-related index correlates with the degree of liver fibrosis in hepatitis C virus-positive patients. Gastroenterol. Res. Pract. 2015, 926169 (2015).
-
Enomoto, H. et al. Association of amino acid imbalance with the severity of liver fibrosis and esophageal varices. Ann. Hepatol. 12, 471–478 (2013).
-
Ishikawa, T. Branched-chain amino acids to tyrosine ratio value as a potential prognostic factor for hepatocellular carcinoma. World J. Gastroenterol. 18, 2005–2008 (2012).
-
Michitaka, K. et al. Amino acid imbalance in patients with chronic liver diseases. Hepatol. Res. 40, 393–398 (2010).
-
Thing, M. et al. Targeted metabolomics reveals plasma short-chain fatty acids are associated with metabolic dysfunction-associated steatotic liver disease. BMC Gastroenterol. 24, 1–10 (2024).
-
Du, K. et al. Increased glutaminolysis marks active scarring in nonalcoholic steatohepatitis progression. Cell. Mol. Gastroenterol. Hepatol. 10, 1–21 (2020).
-
Sterling, R. K. et al. AASLD Practice Guideline on blood-based noninvasive liver disease assessment of hepatic fibrosis and steatosis. Hepatology https://doi.org/10.1097/HEP.0000000000000845 (2024).
-
Pitti, E. et al. Metabolic crosstalk in multimorbidity: identifying compensatory effects among diabetes, hypertension, and dyslipidemia. J. Endocr. Soc 8, bvae152 (2024).
-
Godbole, N. et al. Prognostic and pathophysiologic significance of il-8 (Cxcl8) in biliary atresia. J. Clin. Med. 10, 2705 (2021).
-
Glass, O. et al. Serum interleukin-8, osteopontin, and monocyte chemoattractant protein 1 are associated with hepatic fibrosis in patients with nonalcoholic fatty liver disease. Hepatol. Commun. 2, 1344–1355 (2018).
-
Franceschi, C., Garagnani, P., Parini, P., Giuliani, C. & Santoro, A. Inflammaging: A new immune-metabolic viewpoint for age-related diseases. Nat. Rev. Endocrinol. 14, 576–590 (2018).
-
Yadav, V. et al. Interleukin levels and non-alcoholic fatty liver disease in chronic plaque psoriasis: An analytical case control study. Indian J. Dermatol. 68, 377–384 (2023).
-
Knorr, J. et al. Interleukin-18 signaling promotes activation of hepatic stellate cells in mouse liver fibrosis. Hepatology 77, 1968–1982 (2023).
-
Wang, Y. Q., Cao, W. J., Gao, Y. F., Ye, J. & Zou, G. Z. Serum interleukin-34 level can be an indicator of liver fibrosis in patients with chronic hepatitis B virus infection. World J. Gastroenterol. 24, 1312–1320 (2018).
-
Aslam, H. et al. The role of red cell distribution width as a prognostic marker in chronic liver disease: A literature review. Int. J. Mole. Sci. 24, 3487 (2023).
-
Yang, W., Huang, H., Wang, Y., Yu, X. & Yang, Z. High red blood cell distribution width is closely associated with nonalcoholic fatty liver disease. Eur. J. Gastroenterol. Hepatol. 26, 174–178 (2014).
-
Cengiz, M., Candir, B. A., Yilmaz, G., Akyol, G. & Ozenirler, S. Is increased red cell distribution width an indicating marker of nonalcoholic steatohepatitis and fibrotic stage?. World J. Gastroenterol. 19, 7412–7418 (2013).
-
Kim, H. M. et al. Elevated red cell distribution width is associated with advanced fibrosis in NAFLD. Clin. Mol. Hepatol. 19, 258–265 (2013).
-
Sun, M. et al. Serum creatinine as an independent predictor of moderate to severe fibrosis in chinese american non-obese metabolic dysfunction-associated steatotic liver disease. Cureus https://doi.org/10.7759/cureus.61116 (2024).
-
Kumar, R., Prakash, S. S., Priyadarshi, R. N. & Anand, U. Sarcopenia in chronic liver disease: A metabolic perspective. J. Clin. Trans. Hepatol. 10, 1213–1222 (2022).
-
Zhou, T. et al. Impact of skeletal muscle mass evaluating methods on severity of metabolic associated fatty liver disease in non-elderly adults. Br. J. Nutr. 130, 1373–1384 (2023).
-
Rojas, Á., García-Lozano, M. R., Gil-Gómez, A., Romero-Gómez, M. & Ampuero, J. Glutaminolysis-ammonia-urea cycle axis, non-alcoholic fatty liver disease progression and development of novel therapies. J. Clin. Trans. Hepatol. 10, 356–362 (2022).
-
Cho, E. H. Succinate as a regulator of hepatic stellate cells in liver fibrosis. Front Endocrinol. (Lausanne) 9, 383762 (2018).
-
Hu, H. et al. Intestinal microbiome and NAFLD: Molecular insights and therapeutic perspectives. J. Gastroenterol. 55, 142–158 (2019).
-
Summary, E. EASL–EASD–EASO clinical practice guidelines on the management of metabolic dysfunction-associated steatotic liver disease (MASLD). Diabetologia 67, 2375–2392 (2024).
-
Degos, F. et al. Diagnostic accuracy of FibroScan and comparison to liver fibrosis biomarkers in chronic viral hepatitis: A multicenter prospective study (the FIBROSTIC study). J. Hepatol. 53, 1013–1021 (2010).
-
Chen, C. J. et al. Effects of hepatic steatosis on non-invasive liver fibrosis measurements between hepatitis b and other etiologies. Appl. Sci. 9, 1961 (2019).
-
Tacke, F. et al. EASL–EASD–EASO clinical practice guidelines on the management of metabolic dysfunction-associated steatotic liver disease (MASLD). J. Hepatol. 81, 492–542 (2024).
-
Rinella, M. E. et al. A multisociety Delphi consensus statement on new fatty liver disease nomenclature. Hepatology 78, 1966–1986 (2023).
-
Eddowes, P. J. et al. Accuracy of fibroscan controlled attenuation parameter and liver stiffness measurement in assessing steatosis and fibrosis in patients with nonalcoholic fatty liver disease. Gastroenterology 156, 1717–1730 (2019).
-
Sterling, R. K. et al. Development of a simple noninvasive index to predict significant fibrosis in patients with HIV/HCV coinfection. Hepatology 43, 1317–1325 (2006).
-
Dieterle, F., Ross, A., Schlotterbeck, G. & Senn, H. Probabilistic quotient normalization as robust method to account for dilution of complex biological mixtures. Application in1H NMR metabonomics. Anal. Chem. 78, 4281–4290 (2006).
-
Bedossa, P. & Poynard, T. An algorithm for the grading of activity in chronic hepatitis C. Hepatology 24, 289–293 (1996).
-
van den Berg, R. A., Hoefsloot, H. C. J. J., Westerhuis, J. A., Smilde, A. K. & van der Werf, M. J. Centering, scaling, and transformations: Improving the biological information content of metabolomics data. BMC Genomics 7, 1–15 (2006).
-
Burnham, K. P. & Anderson, D. R. Multimodel inference: Understanding AIC and BIC in model selection. Sociol. Methods Res. 33, 261–304 (2004).
-
Wong, T. T. & Yeh, P. Y. Reliable accuracy estimates from k-fold cross validation. IEEE Trans. Knowl. Data Eng. 32, 1586–1594 (2020).
-
Steyerberg, E. W. et al. Assessing the performance of prediction models: A framework for traditional and novel measures. Epidemiology 21, 128–138 (2010).
-
Buse, A. The likelihood ratio, wald, and lagrange multiplier tests: An expository note. Am. Stat. 36, 153–157 (1982).
Acknowledgements
This study was supported by Ministero della Ricerca – PRIN 2022 (code: 2022C7ZR3W) to S.B. and D.O.C. and co-financed by the Next Generation EU (DM 1557 11.10.2022), in the context of the National Recovery and Resilience Plan, Investment PE8—Project Age-It: “Ageing Well in an Ageing Society”. The views and opinions expressed are only those of the authors and do not necessarily reflect those of the European Union or the European Commission. Neither the European Union nor the European Commission can be held responsible for them.
Funding
This study was supported by Ministero della Ricerca—PRIN 2022 (code: 2022C7ZR3W) to S.B. and D.O.C. and co-financed by the Next Generation EU (DM 1557 11.10.2022) in the context of the National Recovery and Resilience Plan, Investment PE8—Project Age-It: “Ageing Well in an Ageing Society”. The views and opinions expressed are only those of the authors and do not necessarily reflect those of the European Union or the European Commission. Neither the European Union nor the European Commission can be held responsible for them.
Ethics declarations
Competing interests
The authors declare no competing interests.
Additional information
Publisher’s note
Springer Nature remains neutral with regard to jurisdictional claims in published maps and institutional affiliations.
Supplementary Information
Rights and permissions
Open Access This article is licensed under a Creative Commons Attribution-NonCommercial-NoDerivatives 4.0 International License, which permits any non-commercial use, sharing, distribution and reproduction in any medium or format, as long as you give appropriate credit to the original author(s) and the source, provide a link to the Creative Commons licence, and indicate if you modified the licensed material. You do not have permission under this licence to share adapted material derived from this article or parts of it. The images or other third party material in this article are included in the article’s Creative Commons licence, unless indicated otherwise in a credit line to the material. If material is not included in the article’s Creative Commons licence and your intended use is not permitted by statutory regulation or exceeds the permitted use, you will need to obtain permission directly from the copyright holder. To view a copy of this licence, visit http://creativecommons.org/licenses/by-nc-nd/4.0/.
About this article

Cite this article
Zampieri, S., Petrella, G., Nagni, E. et al. A potential age-independent MASLD-related liver fibrosis index based on metabolic profiling. Sci Rep 15, 32328 (2025). https://doi.org/10.1038/s41598-025-18172-x
-
Received:
-
Accepted:
-
Published:
-
DOI: https://doi.org/10.1038/s41598-025-18172-x