Introduction
The deadly condition known as pancreatic ductal adenocarcinoma (PDAC) is characterized by rapid tumor development, few curative options, and a low survival rate1,2. Numerous types of pancreatic malignancies are recognized, yet approximately 90% of adult cases are characterized as PDAC upon diagnosis3. It has a five-year survival rate of fewer than 10% and is the fourth most common cause of cancer-related deaths globally4. PDAC’s rising prevalence, expected to make it the second-greatest cause of cancer-related deaths by 2030, emphasizes the significance of taking action against it5.
Since most patients are diagnosed at advanced stages, early diagnosis is essential to improving PDAC outcomes when therapeutic therapies are no longer possible. In PDAC, initial symptoms, such as stomach pain, nausea, and appetite loss, are nonspecific, making early identification difficult. Carbohydrate antigen 19 − 9 (CA19-9) is now the tumor marker for pancreatic cancer, although it is neither sensitive nor specific enough to diagnose the illness. CA19-9 has been linked to chronic pancreatitis, and some individuals with early-stage PDAC and other malignancies may also exhibit expression of this protein. While CA19-9 is elevated in some patients with pancreatic cancer, its low sensitivity and specificity mean that it cannot reliably differentiate between pancreatic cancer and other conditions, leading to potential misdiagnoses or delayed detection6,7,8. Given these shortcomings, there is a critical need for the identification of novel biomarkers that can provide more accurate and earlier detection of pancreatic cancer, especially in high-risk populations such as those with T2D.
Recent studies have focused on the connection between diabetes and the risk of developing cancer. For example, studies show that in diabetic patients, there is a two-fold increase in the incidence of pancreatic cancer9, a two-fold increase in the risk of hepatobiliary cancers10, a 20% increase in the risk of breast cancer11, a two-fold increase in the risk of endometrial cancer12, and a 50% increase in the incidence of colorectal cancer13. Moreover, it has been shown that in some cancers, patients with T2D have a higher mortality rate. For example, there is a 30–40% increase in mortality rate in pancreatic cancer14, a 2.5-fold increase in liver cancer15, a 30% increase in endometrial cancer16, a 15–30% increase in breast cancer14, and a 20–50% increase in colorectal cancer in patients with diabetes17. Several factors have been reported to be involved in the risk of cancer in diabetic patients, including High blood levels of sugar (hyperglycemia) and insulin (hyperinsulinemia), and the release of inflammatory cytokines. Chronic hyperglycemia in T2D has been shown to enhance the glycolytic phenotype of cancer cells, providing them with the necessary energy for rapid proliferation. In PDAC, hyperglycemia also increases oxidative stress, promoting DNA damage and genomic instability, which are critical for tumorigenesis. Furthermore, the high glucose levels activate pancreatic stellate cells, contributing to fibrosis and a tumor-promoting microenvironment. Hyperinsulinemia plays a crucial role in the early stages of PDAC by stimulating the insulin receptor signaling pathways (such as PI3K/Akt and MAPK), which promote cell proliferation, inhibit apoptosis, and facilitate the acinar-to-ductal metaplasia (ADM), a precursor lesion to PDAC. These insulin-driven pathways not only support cancer cell survival but may also accelerate the progression of premalignant lesions to invasive tumors18,19. Therefore, understanding the complex relationship between T2D and PDAC is essential for developing a comprehensive understanding of the condition and identifying potential new therapeutic targets.
The identification of biomarkers relies on a comprehensive understanding of the molecular mechanisms underlying PDAC initiation, progression, and metastasis. Traditional approaches to biomarker discovery often focus on identifying individual genes associated with disease, but this approach may be insufficient in the context of complex, multi-factorial diseases such as T2D and PDAC. The interplay between metabolic dysregulation, genetic susceptibility, and environmental factors creates a highly intricate landscape, one that is difficult to capture with linear, single-gene analyses. Moreover, the heterogeneity of blood transcriptomes across individuals complicates the identification of robust, universal biomarkers. Given these challenges, we turned to Weighted Gene Co-expression Network Analysis (WGCNA), a systems biology approach that identifies modules of co-expressed genes, rather than focusing on individual gene associations20,21. This method allows us to uncover the complex gene-gene interactions that are often missed in traditional biomarker discovery, providing a more holistic understanding of the biological processes that underlie T2D and PDAC. By identifying these co-expressed gene modules, WGCNA enables us to explore the multi-dimensional interactions that drive disease progression, making it a more powerful tool for discovering novel biomarkers in this complex disease context.
Materials and methods
Data acquisition and processing
The RNA-seq transcriptome aligned data (in bam format) of PDAC patients and healthy controls were obtained from the European Genome-Phenome Archive database (EGA) (ega-archive.org) with the accession number EGAD00001006915 using the EGA Download Client tool (Version 3.4.0 + galaxy0)22,23. The RNA-seq raw data of T2D patients and healthy controls were obtained from the Gene Expression Omnibus database (GEO) (www.ncbi.nlm.nih.gov/geo) with the accession number of GSE114192 using Faster Download and Extract Reads in FASTQ tool (Version 2.11.0 + galaxy1)24,25. The RNA-seq data was analyzed using the Galaxy platform (usegalaxy.eu)26. The HISAT2 (Version 2.2.1 + galaxy0) was used to align raw RNA-seq reads of the GEO data to the hg38 human reference genome, and the htseq-count (Version 0.9.1 + galaxy1) was used for both EGA and GEO data to quantify how many reads map to each feature27,28.
Differential expression analysis
PCA was used to find and remove outlier samples from the datasets to improve data quality29. The DESeq2 R package (1.38.3) was used to analyze the differential expression between PDAC and control samples and between T2D and control samples30. This study considered differentially expressed genes (DEGs) with |logFC| > 0.58 (|FC| > 1.5) and an adjusted p-value < 0.05 as significant. P-values were adjusted for multiple testing using the Benjamini-Hochberg (BH) procedure to control the false discovery rate (FDR) at a significance level of 0.05. The normalized expression matrices were obtained from the DESeq2 package as input for the WGCNA software.
Construction of gene co-expression network
The WGCNA software (1.72) was used to construct the co-expression networks31. A signed-hybrid weighted gene co-expression network was constructed based on the PDAC and T2D count matrix gene expression pattern. The pairwise correlations between genes were calculated, and a soft-thresholding power was applied to create a weighted adjacency matrix. The soft thresholding power was determined using the R function pickSoftThreshold. The adjacency matrix was calculated into a topological overlap matrix (TOM) based on the chosen soft-threshold power to reduce the effects of noise and erroneous associations. Hierarchical clustering was used to group highly co-expressed genes into the same modules and extract them using the dynamic hybrid tree-cutting approach based on the TOM dissimilarity. The mergeCloseModules method was used to combine modules with a high eigengene correlation (cutHeight = 0.25, which corresponds to a correlation of 0.75). The minimum module size of 30 was used for dynamic tree cutting. Eigengenes was used as each module’s first principal component, resulting in a weighted average of the co-expression profiles.
Module preservation analysis
The module preservation analysis function of the WGCNA software was utilized based on Zsummary and medianRank benchmarks to evaluate essential unique modules in the PDAC network compared to the normal network, and T2D compared to the normal one. Modules that have a specific co-expression pattern in the test network (PDAC and T2D) compared to the control data are the non-preserved modules. These modules have a lower Zsummary and a higher MedianRank value. The VennDiagram R package (1.7.3) was used to select non-preserved modules in PDAC and T2D that have the most overlapping gene members. The same package was also used to further investigate which of those modules with high shared members have a high number of DEGs among them, indicating the high association of those modules in both PDAC and T2D32.
Construction of protein-protein interaction network
Using the STRING database (string-db.org) and Cytoscape software version 3.8.2, the protein-protein interaction (PPI) network of the significantly common co-expressed genes in PDAC and T2D was constructed33,34. Protein interactions and the weight of each edge (line) in the PPI network are predicted by the potential interaction between genes at the protein level. Hub genes have been identified using the CytoHubba Cytoscape plugin (0.1) using the Maximal Clique Centrality (MCC) parameter35.
Reconstruction of lncRNA-mRNA co-expression network
To reconstruct the lncRNA-mRNA network, the calculated co-expression network was extracted using the exportNetworkToCytoscape function of the WGCNA package with default parameters. Then the long non-coding RNAs (lncRNA), which have a co-expression correlation with identified hub genes, were selected and visualized using Cytoscape. Finally, the genes with the most differential expression patterns were chosen for qPCR validation.
Patient selection
Blood samples were obtained from 25 patients diagnosed with PDAC, 25 patients diagnosed with PDAC and T2D, 25 patients diagnosed with T2D, and 25 healthy controls referred to the Milad or Zahraye Marzieh hospital (Isfahan, Iran) between June 2022 and September 2024 and were collected in EDTA-containing vials. Blood samples were collected before the start of surgery or chemo/radiotherapy. This study was performed in accordance with the seventh edition of the Helsinki declaration and approved by the medical ethics committee of the University of Isfahan (IR.UI.REC.1398.082). Samples were collected with patients’ written informed consent. All methods were performed in accordance with the guidelines and regulations of the medical ethics committee of the University of Isfahan. Demographic and clinicopathological characteristics of the participants were presented in Table S1. Patients were matched across groups where possible.
Total RNA extraction and cDNA synthesis
To isolate PBMCs from the blood samples, whole blood was collected in 2 mL EDTA tubes. Then, within five hours after sample collection, Ficoll Lymphodex (INNO-TRAIN, Germany) was used to extract PBMCs. After isolation, PBMCs were snap-frozen and stored at -70 °C. Total RNA was extracted from PBMCs of patients and healthy controls using the RiboEx RNA extraction reagent (GeneAll, Taiwan) following the manufacturer’s instructions. Before cDNA synthesis, RNA quality was assessed using a NanoDrop spectrophotometer to measure the OD260/280 ratio, with acceptable values between 1.8 and 2.0 indicating minimal protein contamination. With the standard protocol, the AddScript cDNA synthesis kit (Addbio, Korea) was used to reverse transcribe the total RNA to cDNA.
Quantitative real-time PCR
The NCBI online tool and Oligo 7 Primer Analysis Software were used to design the Forward and Reverse primers of the target genes (synthesized by the SinaClon Company). The sequences of all qRT-PCR primers are given in Supplementary Table S2. All primers were designed to span the intronic sequences. For qPCR amplification, the annealing temperature was optimized to 60 °C, and amplification efficiency was assessed by generating a standard curve. The efficiency of each assay was determined to be within the acceptable range for accurate quantification. RealQ Plus 2x Master Mix Green (Ampliqon, Denmark) and Applied Biosystems machines (StepOne Plus) were used for qRT-PCR. All samples were run in duplicates. The comparative Ct method (ΔΔCt) was used to calculate the gene expression data. The relative expression of genes was calculated using the ACTB reference gene.
To evaluate the diagnostic value of the CEBPZ gene, receiver operating characteristic (ROC) curve analyses were conducted using the pROC package (version 1.19.0.1) in R. The area under the curve (AUC) values were calculated to evaluate the diagnostic performance of CEBPZ compared with CA19-9 across different patient groups.
Statistical analysis
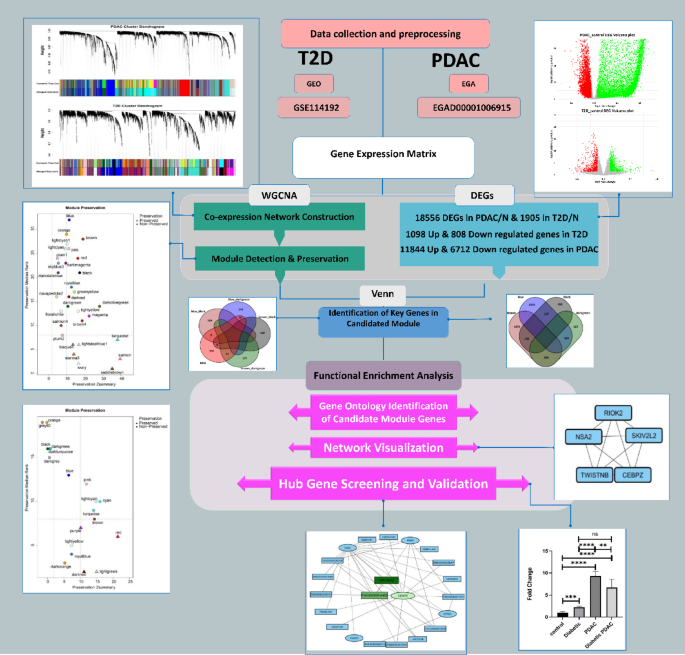
Statistical analysis was performed using GraphPad Prism (version 9.0.0) software. The ordinary one-way ANOVA was used to test for the difference in the expression among four study groups, and an adjusted p-value < 0.05 was considered significant36. Normality was assessed using the [Shapiro-Wilk test/Kolmogorov-Smirnov test], and homogeneity of variances was checked with Levene’s test. Both assumptions were met (p > 0.05). The overall schematic workflow of all steps is represented in Fig. 1.

Schematic workflow of overall steps.
Results
Differential gene expression analysis reveals distinct patterns in diabetic and pancreatic cancer
We obtained a normalized expression profile data matrix of the GSE114192 GEO dataset containing 25 T2D and 11 healthy samples with 17,632 expressed genes and the EGAD00001006915 EGA dataset containing 64 PDAC and 31 healthy samples with 22,959 expressed genes. In the diabetic dataset, we identified 1905 DEGs (including 808 downregulated and 1098 upregulated), and in the pancreatic cancer dataset, 18,556 DEGs (including 6712 downregulated and 11,844 upregulated) with |logFC| > 0.58 and adjusted p-value < 0.05 (Fig. 2A, B).

Volcano plot of DEGs and dendrogram of network components showing dis-regulated and co-expressed genes in PDAC and T2D. Genes with a significant upregulation are marked green, genes with a significant downregulation are marked red, and genes with non-significant changes are marked gray. Graph A shows the differential expression pattern in pancreatic data, and Graph B shows the differential expression pattern in diabetes data. Co-expressed network genes are represented by a unique color in the dendrogram. Each line in the dendrogram represents a gene. C PDAC network and D T2D network.
Uncovering modules related to T2D and PDAC
Based on the results of the pickSoftThreshold, powers 6 and 3 were selected for T2D and PDAC data, respectively (Figure S1). Initial network analysis showed that 55 and 26 modules can be found in diabetes and pancreatic cancer data, respectively. After calculating the ME and merging the modules that have high correlation and similarity with each other, the number of diabetes and pancreatic cancer modules was decreased to 32 and 20, respectively (Fig. 2C, D).
Module preservation analysis
Module Preservation analysis was used to identify modules related to diabetes and pancreatic cancer. This analysis revealed that T2D and PDAC groups have only 7 and 4 conserved modules, respectively, compared to the control (T2D modules: bisque4, lightsteelblue1, turquoise, sienna3, salmon, ivory, saddlebrown; PDAC modules: purple, red, darkred, lightgreen). To identify the modules involved in both T2D and PDAC, the least conserved modules were selected (diabetic modules blue, brown, lightcyan1, orange, pink, and pancreatic cancer modules grey60, orange, black, darkgreen, darkturquise, darkgrey (Fig. 3).

Module preservation analysis of A PDAC and B T2D network. Each point in this diagram represents a module. Modules shown with triangles are preserved modules, and modules shown with circles are non-preserved modules. The dotted blue and green lines indicate the Zsummary thresholds of 2 and 10, and the red dotted line indicates the MedianRank threshold of 8. Modules with Zsummay greater than 10 and MedianRank less than eight were considered preserved.
Comparative analysis of shared genes in T2D and PDAC modules
Examining the components of the selected modules in the previous step showed that the blue and brown diabetes modules have the most genes in common with the black and darkgreen cancer modules (Fig. 4A). There are 117 genes in common between blue and black modules, 303 genes in blue and darkgreen, 118 genes in brown and black, and finally 194 genes in common between brown and darkgreen modules. The highest number of genes with significant differential expression was seen in blue and darkgreen modules (Fig. 4B).

Integrated analysis of non-preserved modules in diabetes and pancreatic cancer, mRNA-lncRNA co-expression network, and CEBPZ gene expression across study groups. A Among the non-preserved modules of diabetes and pancreatic cancer, the blue and brown diabetes modules have the most common components with the black and darkgreen cancer modules. B Among the common components between selected modules, 303 common genes between blue and darkgreen modules have the highest number of genes with differential expression patterns in diabetes and cancer. C Oval and rectangle nodes represent mRNA and lncRNA, respectively. The three genes CEBPZ, MIR155HG, and ENG00000244055 shown in green in the center, have the most differential expression patterns in diabetes and pancreatic cancer. The intensity of the green color indicates the increased expression of each gene. D In all three groups of diabetes, pancreatic cancer, and diabetic pancreatic cancer, a significant increase in expression of the CEBPZ gene was seen compared to the control group. (* = adj p value < 0.5, ** = adj p value < 0.1, *** = adj p value < 0.01, **** = adj p value < 0.001)
Protein-protein interaction network analysis
The protein-protein interaction of common genes in the blue and darkgreen module was retrieved from the STRING database. The calculated protein-protein network includes 191 nodes and 341 edges. Five main nodes were identified after network visualization in Cytoscape using the Cytohubba plugin and based on the MCC score. These five nodes include the genes TWISTNB, RIOK2, SKIV2L2, CEBPZ, and NSA2.
Reconstruction of lncRNA-mRNA network
The co-expression pattern of TWISTNB, RIOK2, SKIV2L2, CEBPZ, and NSA2 genes with lncRNAs in the modules was extracted from the network and reconstructed using Cytoscape. This network contains 22 nodes and 42 edges (Fig. 4C). Among the above genes, CEBPZ, MIR155HG, and ENSG00000244055 showed the highest differential expression pattern in the two groups of diabetes and pancreatic cancer compared to the control. Therefore, its expression was validated in patients’ samples using qRT-PCR.
CEBPZ gene expression as a potential diagnostic marker
Given the high differential expression of the CEBPZ, MIR155HG, and ENSG00000244055 genes in T2D and PDAC-T2D groups compared to the control, their expression was further validated using qRT-PCR. First, the expression level of genes was normalized by the expression level of the internal control ACTB gene. Then, the expression levels of the gene in the T2D, PDAC and PDAC-T2D groups were calculated and analyzed compared to the control group using the ΔΔCT method. Figure 4D shows a significant expression level of CEBPZ was obtained in samples from PDAC and diabetic PDAC compared to the T2D and control groups. The reliable expression data could not be obtained (results were not significant) for the MIR155HG and ENSG00000244055 genes (data were not shown).
ROC analyses showed distinct performance patterns between CEBPZ and CA19-9. For PDAC vs. PDAC-T2D, CEBPZ achieved an AUC of 0.73, outperforming CA19-9 (AUC = 0.669). In the Control vs. PDAC-T2D comparison, CEBPZ reached an AUC of 0.848, while CA19-9 achieved an AUC of 1. For Control vs. PDAC, both markers performed strongly, with CA19-9 (AUC = 1) slightly exceeding CEBPZ (AUC = 0.998) (Fig. 5).

ROC curve analyses comparing CEBPZ and CA19-9 across different groups. A PDAC vs. PDAC-T2D: CEBPZ (AUC = 0.73) vs. CA19-9 (AUC = 0.669). B Control vs. PDAC-T2D: CEBPZ (AUC = 0.848) vs. CA19-9 (AUC = 1). C Control vs. PDAC: CEBPZ (AUC = 0.998) vs. CA19-9 (AUC = 1). ROC analyses were performed using the pROC R package (version 1.19.0.1).
Discussion
PDAC is one of the deadliest cancers, with a nearly 20% survival rate. In the early stages of pancreatic cancer, symptoms are not detectable, resulting in poor diagnosis and prognosis4,37. PDAC is usually diagnosed when the tumor has progressed, and metastasis has occurred. Early diagnosis of PDAC is difficult due to nonspecific early symptoms such as abdominal discomfort, nausea, and anorexia. The lack of proper diagnostic tools makes this disease deadly, and more research is needed to improve the diagnosis6. The role of diabetes and its relationship to the possibility of cancer has been the focus of researchers in recent years. In several studies, it has been shown that in diabetic patients, there is a two- to three-fold increase in the incidence of pancreatic cancer, a two-fold increase in the risk of hepatobiliary cancers, and a 20% increase in the risk of breast cancer9,10,11.
Gene co-expression network examines the co-expression pattern between genes. This network examines how genes are differentially co-expressed among different samples and which groups are expressed together in a common pattern38,39. Finding differentially expressed genes (DEGs) in RNA-seq data provides insights into the molecular mechanisms underlying PDAC and diabetes40. Using blood samples for RNA-seq analysis enables non-invasive diagnostic and prognostic methods for pancreatic cancer and diabetes41,42. Co-expression network reconstruction using WGCNA provides a systems biology approach to understanding the relationships between genes and their function43. Identifying the most significant module with module preservation analysis provides further evidence for the association of genes identified in PDAC and diabetes44.
This study identified 1905 and 18,558 genes with significant differential expression in diabetes and pancreatic cancer data, respectively. Examination and analysis of the module members showed that 303 common genes between the blue T2D and darkgreen modules of PDAC have a co-expression pattern related to both T2D and PDAC. Five hub genes were selected based on the pattern of protein-protein interaction among these 303 genes. Finally, the co-expression network was reconstructed between 5 genes and other lncRNAs co-expressed in the module. Three genes, CEBPZ, MIR155HG, and ENSG00000244055 had this network’s highest significant differential expression.
CEBPZ (CCAAT Enhancer Binding Protein Zeta) gene belongs to the CBF/Mak21 family. The CEBPZ protein is involved in the cellular response to environmental stimuli through the transcription process, which includes heat shock factors, protected DNA elements, and CCAAT boxes. This protein acts as a DNA-bound transcription activator and regulates the heat shock protein 70 (HSP70) promoter in a CCAAT-dependent manner. This protein also plays a role in cell growth and differentiation, especially blood cell differentiation45,46. Studies show that increased expression of CEBPZ can be used as a potential biomarker in gastric cancer47 and esophageal squamous cell cancer46, as well as chronic kidney disease48. Also, gene mutations of CEBPZ have been reported in acute myeloid leukemia49 and hereditary non-polyp colorectal cancer50.
Many studies have also investigated the role of the MIR155HG gene (MIR155 Host Gene) in the immune response and the progression and proliferation of cancer51,52. For example, it has been shown that the activation of MIR155HG transcription is associated with the early stages of T-cell activation51,52,53. Also, high expression of this gene has been reported in B-cell lymphoma51, Hodgkin’s lymphoma54, breast cancer55, glioma56,57 and stomach cancer58. In addition, these studies have shown that the high expression of this gene is also related to pancreatic cancer52,59. Increasing the expression of this gene in pancreatic tissue by inhibiting the tumor suppressor gene miR-802 can promote the development and progression of this cancer52.
The ENSG00000244055 gene is a novel non-coding RNA located on chromosome 7. The biological role of this lncRNA is still not well known. A 2022 bioinformatics study showed that the differential expression of this lncRNA in extracellular vesicles could be used as a potential biomarker in breast cancer60.
In this study, we examined the expression pattern of CEBPZ, MIR155HG, and ENSG00000244055 using qPCR because of their higher score in DEG and module membership. The reliable expression data could not be obtained (results were not significant) for MIR155HG and ENSG00000244055 genes. Our analysis showed that the expression of the CEBPZ gene increased significantly in the three groups of patients compared to the control. The expression pattern of this gene was increased 2.23 times in the diabetic group, 9.29 times in the pancreatic cancer group, and 6.65 times in the diabetic pancreatic cancer group compared to the control. These results confirm that CA19-9 remains highly accurate in distinguishing PDAC from controls, but CEBPZ may offer complementary value in differentiating PDAC from PDAC-T2D, where CA19-9 performance is weaker. This highlights the potential of CEBPZ as a biomarker in specific patient subgroups, particularly those with T2D, although larger validation studies are required to confirm its clinical utility. This study suggests the CEBPZ expression may serve as a diagnostic biomarker for assessing PDAC risk in individuals with T2D, given its differential expression in this specific cohort. To our knowledge, this is the first study to construct and validate a blood-based lncRNA-mRNA regulatory network linking T2D to PDAC risk. The expression of the CEBPZ gene has been studied in pancreatic tissues or tumor biopsies, but less so in peripheral blood — especially in the context of T2D-PC progression. Blood-based biomarkers are valuable for early detection, given the inaccessibility of pancreatic tissue and the typically late diagnosis of pancreatic cancer. However, more extensive studies are needed to investigate and confirm the role of this gene as a marker in these two diseases.
Data availability
The RNA-seq transcriptome aligned data (in bam format) of PDAC patients and healthy controls were obtained from the European Genome-Phenome Archive database (EGA) (ega-archive.org) with the accession number EGAD00001006915 using the EGA Download Client tool (Version 3.4.0+galaxy0) . The RNA-seq raw data of T2D patients and healthy controls were obtained from the Gene Expression Omnibus database (GEO) (www.ncbi.nlm.nih.gov/geo) with the accession number of GSE114192 using Faster Download and Extract Reads in FASTQ tool (Version 2.11.0+galaxy1).
References
-
Hamilton, S. R. & Aaltonen, L. A. Pathology and Genetics of Tumours of the Digestive System (IARC press Lyon, 2000).
-
Nagtegaal, I. D. et al. The 2019 WHO classification of tumours of the digestive system. Histopathology 76 (2), 182 (2020).
-
Frappart, P-O. & Hofmann, T. G. Pancreatic ductal adenocarcinoma (Pdac) organoids: the shining light at the end of the tunnel for drug response prediction and personalized medicine. Cancers 12 (10), 2750 (2020).
-
Nakkina, S. P. et al. Differential expression of polyamine pathways in human pancreatic tumor progression and effects of polyamine Blockade on tumor microenvironment. Cancers 13 (24), 6391 (2021).
-
Kjaergaard, A. D. et al. Inflammatory biomarker score identifies patients with six-fold increased risk of one-year mortality after pancreatic cancer. Cancers 13 (18), 4599 (2021).
-
da Costa, W. L. Jr, Oluyomi, A. O. & Thrift, A. P. Trends in the incidence of pancreatic adenocarcinoma in all 50 united States examined through an age-period-cohort analysis. JNCI Cancer Spectr. 4 (4), pkaa033 (2020).
-
Blackford, A. L., Canto, M. I., Klein, A. P., Hruban, R. H. & Goggins, M. Recent trends in the incidence and survival of stage 1A pancreatic cancer: a surveillance, epidemiology, and end results analysis. JNCI: J. Natl. Cancer Inst. 112 (11), 1162–1169 (2020).
-
Nipp, R. et al. Disparities in cancer outcomes across age, sex, and race/ethnicity among patients with pancreatic cancer. Cancer Med. 7 (2), 525–535 (2018).
-
Quoc Lam, B., Shrivastava, S. K., Shrivastava, A., Shankar, S. & Srivastava, R. K. The impact of obesity and diabetes mellitus on pancreatic cancer: molecular mechanisms and clinical perspectives. J. Cell. Mol. Med. 24 (14), 7706–7716 (2020).
-
Conway, R. B. N., Sudenga, S., McClain, D. & Blot, W. J. Diabetes and liver cancer risk: A stronger effect in Whites than blacks? J. Diabetes Complicat. 35 (3), 107816 (2021).
-
Lega, I. C. et al. The impact of diabetes on breast cancer treatments and outcomes: a population-based study. Diabetes Care. 41 (4), 755–761 (2018).
-
Luo, J. et al. Association between diabetes, diabetes treatment and risk of developing endometrial cancer. Br. J. Cancer. 111 (7), 1432–1439 (2014).
-
Wang, H. MicroRNA, diabetes mellitus and colorectal cancer. Biomedicines 8 (12), 530 (2020).
-
Harding, J. L. et al. Trends in cancer mortality among people with vs without diabetes in the USA, 1988–2015. Diabetologia 63, 75–84 (2020).
-
Abudawood, M. Diabetes and cancer: a comprehensive review. J. Res. Med. Sciences: Official J. Isfahan Univ. Med. Sci. ;24. (2019).
-
Lees, B., Hampton, J. M., Trentham-Dietz, A., Newcomb, P. & Spencer, R. A population-based study of causes of death after endometrial cancer according to major risk factors. Gynecol. Oncol. 160 (3), 655–659 (2021).
-
Soltani, G. et al. Obesity, diabetes and the risk of colorectal adenoma and cancer. BMC Endocr. Disorders. 19 (1), 1–10 (2019).
-
Irwin, M. L. et al. Fasting C-peptide levels and death resulting from all causes and breast cancer: the health, eating, activity, and lifestyle study. J. Clin. Oncol. 29 (1), 47–53 (2011).
-
Irwin, M. L. et al. Relationship of obesity and physical activity with C-peptide, leptin, and insulin-like growth factors in breast cancer survivors. Cancer Epidemiol. Biomarkers Prev. 14 (12), 2881–2888 (2005).
-
Ovens, K., Eames, B. F. & McQuillan, I. Comparative analyses of gene co-expression networks: implementations and applications in the study of evolution. Front. Genet. 12, 695399 (2021).
-
Yan, J., Risacher, S. L., Shen, L. & Saykin, A. J. Network approaches to systems biology analysis of complex disease: integrative methods for multi-omics data. Brief. Bioinform. 19 (6), 1370–1381 (2018).
-
Al-Fatlawi, A. et al. Deep learning improves pancreatic cancer diagnosis using RNA-based variants. Cancers 13 (11), 2654 (2021).
-
Lappalainen, I. et al. The European Genome-phenome archive of human data consented for biomedical research. Nat. Genet. 47 (7), 692–695 (2015).
-
Eckold, C. et al. Impact of intermediate hyperglycemia and diabetes on immune dysfunction in tuberculosis. Clin. Infect. Dis. 72 (1), 69–78 (2021).
-
Leinonen, R., Sugawara, H., Shumway, M. & Collaboration, I. N. S. D. The sequence read archive. Nucleic Acids Res. 39 (suppl_1), D19–D21 (2010).
-
Jalili, V. et al. The galaxy platform for accessible, reproducible and collaborative biomedical analyses: 2020 update. Nucleic Acids Res. 48 (W1), W395–W402 (2020).
-
Kim, D., Langmead, B. & Salzberg, S. L. HISAT: a fast spliced aligner with low memory requirements. Nat. Methods. 12 (4), 357–360 (2015).
-
Anders, S., Pyl, P. T. & Huber, W. HTSeq—a python framework to work with high-throughput sequencing data. Bioinformatics 31 (2), 166–169 (2015).
-
Wold, S., Esbensen, K. & Geladi, P. Principal component analysis. Chemometr. Intell. Lab. Syst. 2 (1–3), 37–52 (1987).
-
Love, M. I., Huber, W. & Anders, S. Moderated Estimation of fold change and dispersion for RNA-seq data with DESeq2. Genome Biol. 15 (12), 1–21 (2014).
-
Langfelder, P. & Horvath, S. WGCNA: an R package for weighted correlation network analysis. BMC Bioinform. 9 (1), 1–13 (2008).
-
Chen, H. & Boutros, P. C. VennDiagram: a package for the generation of highly-customizable Venn and Euler diagrams in R. BMC Bioinform. 12 (1), 1–7 (2011).
-
Shannon, P. et al. Cytoscape: a software environment for integrated models of biomolecular interaction networks. Genome Res. 13 (11), 2498–2504 (2003).
-
Mering Cv, Huynen, M., Jaeggi, D., Schmidt, S., Bork, P. & Snel, B. STRING: a database of predicted functional associations between proteins. Nucleic Acids Res. 31 (1), 258–261 (2003).
-
Chin, C-H. et al. CytoHubba: identifying hub objects and sub-networks from complex interactome. BMC Syst. Biol. 8 (4), 1–7 (2014).
-
Ross, A., Willson, V. L., Ross, A. & Willson, V. L. One-way anova. Basic and Advanced Statistical Tests: Writing Results Sections and Creating Tables and Figures. :21 – 4. (2017).
-
Kruger, D., Lahoud, N., Yako, Y. Y., Devar, J. & Smith, M. Pancreatic ductal adenocarcinoma: prognostic indicators of advanced disease. Plos One. 17 (1), e0262439 (2022).
-
Meyer, W. A. Geometry and its Applications (Elsevier, 2006).
-
de la Fuente, A. From ‘differential expression’to’ differential networking’–identification of dysfunctional regulatory networks in diseases. Trends Genet. 26 (7), 326–333 (2010).
-
Hu, Y. et al. Identification of the shared gene signatures and biological mechanism in type 2 diabetes and pancreatic cancer. Front. Endocrinol. 13, 847760 (2022).
-
Jang, S. I. et al. Improved predictability of pancreatic ductal adenocarcinoma diagnosis using a blood immune cell biomarker panel developed from bulk mRNA sequencing and single-cell RNA-sequencing. Cancer Immunol. Immunother. 72 (8), 2757–2768 (2023).
-
Christodoulou, M-I. et al. Blood-based analysis of type-2 diabetes mellitus susceptibility genes identifies specific transcript variants with deregulated expression and association with disease risk. Sci. Rep. 9 (1), 1512 (2019).
-
Naghsh-Nilchi, A., Ebrahimi Ghahnavieh, L. & Dehghanian, F. Construction of miRNA‐lncRNA‐mRNA co‐expression network affecting EMT‐mediated cisplatin resistance in ovarian cancer. J. Cell. Mol. Med. 26 (16), 4530–4547 (2022).
-
Heidari, M., Pakdel, A., Bakhtiarizadeh, M. R. & Dehghanian, F. A framework for non-preserved consensus gene module detection in johne’s disease. Front. Veterinary Sci. 9, 974444 (2022).
-
Chen, Y. et al. C/EBPZ modulates the differentiation and proliferation of preadipocytes. Int. J. Obes. 46 (3), 523–534 (2022).
-
Huang, Y. et al. CEBPG promotes esophageal squamous cell carcinoma progression by enhancing PI3K-AKT signaling. Am. J. Cancer Res. 10 (10), 3328 (2020).
-
Kori, M. & Gov, E. Bioinformatics prediction and machine learning on gene expression data identifies novel gene candidates in gastric cancer. Genes 13 (12), 2233 (2022).
-
Wang, J. et al. Identification of Important Modules and Hub Gene in Chronic Kidney Disease Based on WGCNA. Journal of Immunology Research. ;2022. (2022).
-
Herold, T. et al. Isolated trisomy 13 defines a homogeneous AML subgroup with high frequency of mutations in spliceosome genes and poor prognosis. Blood. J. Am. Soc. Hematol. 124 (8), 1304–1311 (2014).
-
Yu, L. et al. Screening for susceptibility genes in hereditary non-polyposis colorectal cancer. Oncol. Lett. 15 (6), 9413–9419 (2018).
-
Peng, L., Chen, Z., Chen, Y., Wang, X. & Tang, N. MIR155HG is a prognostic biomarker and associated with immune infiltration and immune checkpoint molecules expression in multiple cancers. Cancer Med. 8 (17), 7161–7173 (2019).
-
Qin, Y., Liu, X., Pan, L., Zhou, R. & Zhang, X. Long noncoding RNA MIR155HG facilitates pancreatic cancer progression through negative regulation of miR-802. J. Cell. Biochem. 120 (10), 17926–17934 (2019).
-
Diener, C. et al. Quantitative and time-resolved MiRNA pattern of early human T cell activation. Nucleic Acids Res. 48 (18), 10164–10183 (2020).
-
Hamed, H. B., Elgammal, S. A., Narouz, M. W. & Elnaggar, M. G. Micro-RNA 155 in non-Hodgkin lymphoma. Egypt. J. Haematol. 46 (1), 48 (2021).
-
Gao, S. et al. MicroRNA-155, induced by FOXP3 through transcriptional repression of BRCA1, is associated with tumor initiation in human breast cancer. Oncotarget 8 (25), 41451 (2017).
-
Balasubramaniyan, V. & Bhat, K. P. Targeting MIR155HG in glioma: a novel approach. Neuro-oncology 19 (9), 1152–1153 (2017).
-
He, X. et al. LncRNA MIR155HG promotes Temozolomide resistance by activating the Wnt/β-catenin pathway via binding to PTBP1 in glioma. Cell. Mol. Neurobiol. 41, 1271–1284 (2021).
-
Lin, H. et al. LncRNA MIR155HG overexpression promotes Proliferation, Migration, and chemoresistance in gastric cancer cells. Int. J. Med. Sci. 20 (7), 933–942 (2023).
-
Giulietti, M., Righetti, A., Principato, G. & Piva, F. LncRNA co-expression network analysis reveals novel biomarkers for pancreatic cancer. Carcinogenesis 39 (8), 1016–1025 (2018).
-
Wang, H. et al. Novel LncRNAs with diagnostic or prognostic value screened out from breast cancer via bioinformatics analyses. PeerJ 10, e13641 (2022).
Funding
There is no funding.
Ethics declarations
Competing interest
The authors declare that they have no known competing financial interests or personal relationships that could have appeared to influence the work reported in this paper.
Additional information
Publisher’s note
Springer Nature remains neutral with regard to jurisdictional claims in published maps and institutional affiliations.
Supplementary Information
Rights and permissions
Open Access This article is licensed under a Creative Commons Attribution-NonCommercial-NoDerivatives 4.0 International License, which permits any non-commercial use, sharing, distribution and reproduction in any medium or format, as long as you give appropriate credit to the original author(s) and the source, provide a link to the Creative Commons licence, and indicate if you modified the licensed material. You do not have permission under this licence to share adapted material derived from this article or parts of it. The images or other third party material in this article are included in the article’s Creative Commons licence, unless indicated otherwise in a credit line to the material. If material is not included in the article’s Creative Commons licence and your intended use is not permitted by statutory regulation or exceeds the permitted use, you will need to obtain permission directly from the copyright holder. To view a copy of this licence, visit http://creativecommons.org/licenses/by-nc-nd/4.0/.
About this article

Cite this article
Nilchi, A.N., Dehghanian, F., Vallian, S. et al. Dissecting lncRNA-mRNA regulatory network in type 2 diabetes as the risk factor of pancreatic cancer. Sci Rep 15, 37288 (2025). https://doi.org/10.1038/s41598-025-21200-5
-
Received:
-
Accepted:
-
Published:
-
DOI: https://doi.org/10.1038/s41598-025-21200-5