Abstract
Murraya koenigii (L.) Spreng is a tree spice belongs to the family Rutaceae. The presence of variability in breeding population is prior need for any crop improvement programme. This calls for an evaluation of curry leaf genotypes to study the variability in South India. In this study, a total of thirty accessions of curry leaf were collected from various places and were profiled using 13 Inter simple sequence repeats (ISSR) markers. The molecular analysis resulted in PIC value greater than 0.5 for UBC-856 followed by UBC-807, UBC-834 and UBC-835 and the average PIC value was 0.83 indicating that the markers were efficient in revealing diversity among the studied genotypes. Based on the similarity index, genotypes were grouped into nine clusters in dendrogram. Cluster- I was the largest comprising of 15 genotypes followed by Cluster-II, Cluster IV, Cluster V, Cluster VI, Cluster VII, and Cluster VIII with 2 genotypes each while Cluster IX had 1 genotype. The markers were able to distinguish them into distinct genotypes with some located in different clusters. The wide genetic variability observed using ISSR markers would be of much valuable for efficient management of germplasm and for effective utilization of materials in breeding programmes to select the superior genotypes of desirable characteristics. This information could be used as the basis for curry leaf conservation and cultivation activities in South India.
Introduction
Murraya koenigii (L.) Spreng is a perennial herbal spice, deciduous to semi evergreen aromatic tree that belongs to the family Rutaceae. India is the leading producer and exporter of curry leaves1. Tamil Nadu is the leading state in curry leaf cultivation with an area of 2, 543. 00 ha and a production of 35,932.81 tonnes2. It is mainly grown in Coimbatore, Theni and Salem districts and Coimbatore stands in the first position with an area of 1,215.00 ha and a production of 17,010.002.
Few varieties like DWD-1, DWD-2 and Senkaampu (a local type found in the Tamil Nadu region) are cultivated commercially in India1. Information related to the genetic variability in curry leaf is very limited. In a previous study a total of 152 bands were amplified, out of which 136 were polymorphic corresponding to 89.47% polymorphism across the accessions3. Genetic diversity of 61 fenugreek accessions by using 18 random primers resulted in 66–100% polymorphism with genetic similarity of 0.66 to 0.90, indicating a moderate to high genetic variability4.Twenty eight ISSR primers amplified 6.89 average numbers of bands per primer and 5.07 average numbers of polymorphic bands per primer in Coriander5. An evaluation of fifteen cultivars of Betelvine (Piper betle) by using 18 ISSR primers resulted in average polymorphic information content (PIC) of 0.32 over all primers used. Jaccard’s similarity coefficient showed dendrogram grouped cultivars in 3 main clusters6.Thirty four ISSR markers were used for nutmeg diversity analysis. They were polymorphic with a band size of 300 to 1500 bp. Two major clusters were classified based on the Jaccard’s similarity coefficient at a coefficient value of 0.627. Moringa accessions showed the average band size of 202–3010 bp. Three clusters were made based on the RAPD fingerprints with 88.5% similarity level8.
Phenotype of a crop is greatly influenced by genotype and environment. In perennial crops, a study of stability of a morphological character in varying environment and to develop varieties which show small genotype-environment interaction is time consuming9. Identification of suitable genotypes, therefore, becomes imperative for promoting its quality and production, productivity and quality. Hence the present study was formulated with the objective of evaluation and characterization of different Curry leaf accessions through molecular techniques.
Materials and methods
DNA extraction
Fresh healthy and recently matured leaves were collected from each accession.The germplasm material used for the studyis given under Table 1. One hundred milligrams of fresh leaf tissues were ground using liquid nitrogen in a sterile pestle and mortar. The powdered leaf tissues were collected in a 2 ml microcentrifuge tube and 500 µl freshly prepared CTAB extraction buffer (2% CTAB, 100 mMTris-base, 20 mM EDTA and 1.4 M NaCl) with a pH of 8, 1 µl of mercaptoethanol and 1% PVP was added. The microcentrifuge tube was then incubated at 65oC in the water bath for 1 h with intermittent shaking. The samples were then treated with an equal volume of 24:1 chloroform: iso-amyl alcohol and incubated for 15 min with intermittent shaking followed by centrifugation at 12,000 rpm for 10 min. The supernatant was collected in a fresh 1.5 µl micro centrifuge tube and an equal volume of ice cold isopropanol was added to the supernatant and incubated at -20 C over- night. The contents were centrifuged at 12,000 rpm and the supernatant was decanted. The collected pellet was washed with 100 µl of 70% ethanol (centrifuged at 10000 rpm for 10 min) twice, air dried immediately and dissolved in 50 µl of st erile water followed by storage at -20 °C until utilization10. The integrity and purity of genomic DNA was confirmed by gel electrophoresis in 0.8% agarose gel, carried out at approximately 70 V for 30 min in 10X TAE buffer and visualized with ethidium bromide staining under UV light. The DNA concentrations were determined at 260 nm and 280 nm using the Nanodrop® ND-1000 spectrometer and where necessary the DNA solution was diluted to a working concentration of 50 ng µL-1 using sterile distilled water.
Inter simple sequence repeat (ISSR) analysis
Thirteen primer sets designed for curry leaf were used to amplify ISSRs in 30 curry leaf genotypes. The primers used in the study are listed below (Table 2).
Components of PCR reaction mixture for ISSR
The amplification was performed in a total reaction volume of 10 µL containing the following:
-
DNA sample (50 ng): 1 µl.
-
Primer (10 µM) : 1 µl.
-
Master Mix : 4.0 µl.
-
Sterile distilled water : 4 µl.
-
Total volume : 10 µl.
The PCR amplification procedure is as follows:
- 1.
Initial denaturation at 94 0 C for 4 min.
- 2.
Denaturation at 94 0 C 60 s.
- 3.
Annealing (Depends upon the primer used) 60 s 35 cycles.
- 4.
Extension at 72 o C 2 min.
- 5.
Final extension at 72 o C for 7 min.
- 6.
Hold at 4 o C till storage.
Data analysis and data scoring
Polymorphic bands were scored visually for their presence or absence for each primer. The scores were obtained in the form of a matrix with ‘1’ and ‘0’, which indicate the presence and absence of bands in each genotype respectively.
Polymorphism information content (PIC) value
Polymorphism information content (PIC) values were calculated for ISSR markers, to characterize the capacity of each primer to reveal or detect polymorphic loci among the genotypes. PIC values may range from 0 (monomorphic) to 1 (very highly discriminative), with many alleles in equal frequencies.
PIC value was calculated using the formula11. PICJ = 1- ∑ P2 I = 1 to L ij Where ij is the relative frequency of the lth allele for the locus j and is summed across all the alleles (L) overall lines.
Cluster analysis
Genetic dinversity estimate related analyses were done using NTSYSpc software, version- 2.02i12. The binary data scoring was used to construct a dendrogram. The genetic associations between accessions were evaluated by calculating the Jaccard’s similarity coefficient for pairwise comparisons based on the proportions of shared bands produced by the primers13. The similarity matrix was generated using the SIMQUAL programme and the clustering of genotypes was done using an Unweighted Pair Group Method (UPGMA) with an arithmetic average algorithm following the SAHN module. The clustering result was used to construct a dendrogram following the TREE module14.
Result and discussion
Polymorphic information content (PIC)
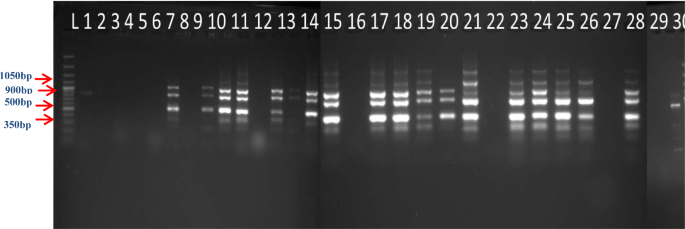
The Polymorphic Information Content is a measure of polymorphism. Among the 13 primers, only 12 produced the discrete bands. The PIC value of 12 ISSR primers ranged from 0.56 to 0.92 (Table 3). Twelve ISSR markers recorded PIC values greater than 0.5 and UBC-856 recorded the highest PIC value (0.92) followed by UBC-807, UBC-834 (0.91) and UBC-835 (0.88) indicating the markers are efficient in revealing diversity among the studied genotypes. The average PIC value was 0.83. The banding pattern of UBC_856 and UBC_834 were presented in Figs. 1 and 2 respectively.

ISSR banding pattern for UBC_834.

ISSR banding pattern for UBC_856.
The results revealed that ISSR markers were able to do estimate the available genetic diversity within and among different accessions. The polymorphism detected revealed higher genetic diversity as the curry leaf is an out breeding species. Our results are inline with the earlier studies in different species viz., M. koenigii15Gaultheria fragrantissimsa16, Lens culinaris17 and Punica18.
The higher genetic diversity is also may be maintained from many generations as the natural populations were able to combat with the heterogenetic variations in the ecosystem19.
The per cent of polymorphism was recorded maximum for the primer UBC_ 836 (62.5%), followed by UBC_881, UBC_856, UBC_857 (50.00%) and UBC_810 (42.86%).Similar results were reported in curry leaf20,15 and related species M. paniculata21.
Cluster analysis using ISSR marker data
The banding pattern of ISSR markers were scored in the form of binary data.
The data was used to compute Jaccard’s similarity index. The similarity index obtained for each pair wise comparison of ISSR markers among 30 genotypes were used to construct dendrogram based on hierarchical clustering and the result is presented in Fig. 3.

Dendrogram of curry leaf accessions based on ISSR analysis using the UPGMA method.
The 30 curry leaf genotypes were grouped into nine clusters (Table 4). Cluster- I was the largest comprising of 15 genotypes (Acc. no.1, 2, 27, 29, 26, 7, 3, 4, 22, 11, 6, 19, 24, 28 and Check) followed by Cluster-II (Acc. no. 12 and 14) Cluster- III (Acc. no. 5 and 8) Cluster- IV (Acc. no. 16 and 18) Cluster V (Acc. no. 9 and 10) Cluster VI (Acc. no. 23 and 25) Cluster VII (Acc. no. 15 and 17) and Cluster VIII (Acc. no. 20 and 21) with 2 genotypes each while Cluster IX (Acc. no. 13) had 1 genotype.
The banding pattern of ISSR markers were scored in the form of binary data. Similarity index for each pair wise comparison of ISSR markers among thirty genotypes were used to construct dendrogram based on hierarchical clustering and the result is presented in Fig. 3.
The data was used to compute Jaccard’s similarity index and it ranges from 0.08 to 0.44 (Fig. 3).
The thirty curry leaf genotypes were grouped into nine clusters.Cluster- I was the largest comprising of 15 genotypes (Acc. no.1, 2, 27, 29, 7, 3, 4, 22, 11, 6, 19, 24 ,28, 26 and Check) followed by Cluster-II (Acc. no. 12 and 14) Cluster- III (Acc. no. 5 and 8) Cluster IV(Acc. no. 16 and 18) Cluster V (Acc. no. 9 and 10) Cluster VI (Acc. no. 23 and 25) Cluster VII (Acc. no. 15 and 17) and Cluster VIII (Acc. no. 20 and 21) with two genotypes each while Cluster IX had one genotype (Acc.no.13).These groupings showed distinct genetic relationships influenced by geographic distribution patterns. ISSR markers were able to group the accessions into distinct clusters independent of locality of collection. The markers were able to distinguish them into distinct genotypes with some located in different clusters. The reason behind this is, during molecular characterization the traits at molecular level not influenced by the external source.
The grouping the different accessions according to UPGMA dendrogram showed that the accessions are mixed together irrespective of their geographical origin. The earlier studies in curry leaf also revealed that genetic variation found was not always same with their origin15.
The genetic nature of the different accessions depicts the combined effects of different elements along with the species pedigree history22. In the present study the variations showed by different accessions followed the same pattern as found in other out crossing plant species19,23,24.
The genotypes from one region were grouped together in some cases, while they were placed in different clusters in certain cases. The wide genetic variability observed using ISSR markers would be of much valuable for efficient management of germplasm and for effective utilization of materials in breeding programmes to select the superior genotypes of desirable characteristics.
In conclusion present study gave the clear picture of existence of diversity in genotypes at genetic level as DNA markers are not influenced by environmental effects or plant growth stages whereas morphological markers does. ISSR markers proved best for assessing genetic diversity in curry leaf germplasm. This shows that the genotypes which were used in the present study can be utilized for further crop improvement programme.
Data availability
The datasets used and/or analyzed during the current study available from the corresponding author on reasonable request.
References
-
Raghu, B. R. Diversity and distribution of Curry Leaf in India. J. Hort Sci. 15(1), 1–8 (2020).
-
Statistics. Horticulture Crops: Area and Production of Tamil Nadu for 2019-20 (Final Estimates), Area and Production. Pdf.37p. (2019)-20.
-
Verma, P. & Mashiat, A. Genetic variability in fenugreek (Trigonella foenum-graecum L.) assessed in South Eastern Rajasthan. Int. J. Seed Spices. 2(1), 56–58 (2012).
-
Sundaram, S. & Shalini, P. Assessment of genetic diversity among fenugreek (Trigonella foenum-graecum L.), using RAPD molecular markers. J. Med. Plants Res. 5(9), 1543–1548 (2011).
-
Tomar-Rukam, S. et al. Genetic diversity analysis in coriander (Coriandrum sativum) genotypes through morphological and molecular characterization. Res. J. Biotech. 9, 1–11 (2014).
-
Goyat, S. et al. Evaluation of genetic diversity of Piper betle cultivars using ISSR markers. IJAR. 4(1), 571–579 (2016).
-
Anu, G. K., Reshma, J. & Varghese, S. G. Marker based assessment of genetic diversity in nutmeg (Myristica fragrans Houtt.) Using ISSR primers. J. Exp. Biol. Agril Sci. 7, 108–116 (2019).
-
Swati., A. B., Attri., A. & Kulshrestha, S. Evaluating the genetic diversity of Moringa oleifera obtained from South-Central and Northern States of India using RAPD markers technique. Asian J. Plant. Sci. 19, 1–7 (2020).
-
Allard, Robert, W., Anda, D. & Bradshaw Implications of genotype-environmental interactions in applied plant breeding. Crop Sci. 4(5), 503–508 (1964).
-
Doyle, Jeff, J., Jan, L., Doyle & A rapid DNA isolation procedure for small quantities of fresh leaf tissue. Phytochem Bull. 19, 11–15 (1987).
-
Anderson, J. A., Churchill., G. A., Autrique., J. E., Tanksley., S. D. & Sorrells, M. E. Optimizing parental selection for genetic linkage maps. Genome. 36(1), 181–186 (1993).
-
Rohlf, F. & James NTSYSpc Numerical Taxonomy and Multivariate Analysis System Version 2.0 user Guide (.Exeter Software Publishers Ltd. Setauket, 1998).
-
Jaccard, P. Nouvelles recherches sur la distribution florale. Bull. Soc. Vaud Sci. Nat. 44, 223–270 (1908).
-
Ali, M. L., Rajewski., J. F., Baenziger., P. S. & Gill., K. S. K. M. Eskridge. And I. Dweikat. 2008. Assessment of genetic diversity and relationship among a collection of US sweet sorghum germplasm by SSR markers. Mol. Breed. 21(4):497–509 .
-
Verma, S. & Rana, T. S. Genetic diversity within and among the wild populations of Murraya koenigii (L.) Spreng., as revealed by ISSR analysis. Biochem. Systemat Ecol. 39(2), 139–144 (2011).
-
Apte, G. S. et al. Genetic diversity analysis in Gaultheria Fragrantissima Wall. Ericaceae from the two biodiversity hotspots in India using ISSR markers. Curr. Sci. 9112, 1634 (2006).
-
Fikiru, E., Kassahun, T. & Endashaw, B. Genetic diversity and population structure of Ethiopian lentil Lens culinaris Medikus landraces as revealed by ISSR marker. Af J. Biotechnol. 6(12), 1460–1468 (2007).
-
Narzary, D., Rana, T. S. & Ranade, S. A. Genetic diversity in inter-simple sequence repeat profiles across natural populations of Indian pomegranate Punica granatum L. Plant. Biol. 12, 806–813 (2010).
-
Hedrick, P. W. Genetic polymorphism in heterogenous environments: A decade later. Annu. Rev. Ecol. Syst. 17, 535–566 (1976).
-
Verma, S. & T.S.Rana Genetic relationships among wild and cultivated accessions of curry leaf plant (Murraya koenigii (L.) Spreng.), as revealed by DNA fingerprinting methods. Mol. Biotechnol. 53(2), 139–149 (2013).
-
Verma, S., Rana, T. S. & Ranade, S. A. Genetic variation and clustering in Murraya paniculata complex as revealed by single primer amplification reaction methods. Curr. Sci. 96, 1210–1216 (2009).
-
Schaal, B. A., Hayworth, D. A., Olsen, K. M., Rauscher, J. T. & Smith, W. A. Phylogeographic studies in plants: problems and prospects. Mol. Ecol. 7, 465–474 (1998).
-
Heywood, J. S. Spatial analysis of genetic variation in plant populations. Annu. Rev. Ecol. Syst. 22, 335–355 (1991).
-
Loveless, M. D. & Hamrick, J. L. Ecological determinants of genetic structure in plant populations. Annu. Rev. Ecol. Syst. 15, 65–95 (1984).
Acknowledgements
All the authors are thankful to Tamil Nadu Agricultural University for providing research facilities.
Funding
No funding used for the current research.
Ethics declarations
Ethics approval and consent to participate
Not applicable.
Consent for publication
Not applicable.
Competing interests
The authors declare no competing interests.
Plant material collection
“The collection of plant material complies with relevant institutional, national, and international guidelines and legislation.”
Additional information
Publisher’s note
Springer Nature remains neutral with regard to jurisdictional claims in published maps and institutional affiliations.
Rights and permissions
Open Access This article is licensed under a Creative Commons Attribution-NonCommercial-NoDerivatives 4.0 International License, which permits any non-commercial use, sharing, distribution and reproduction in any medium or format, as long as you give appropriate credit to the original author(s) and the source, provide a link to the Creative Commons licence, and indicate if you modified the licensed material. You do not have permission under this licence to share adapted material derived from this article or parts of it. The images or other third party material in this article are included in the article’s Creative Commons licence, unless indicated otherwise in a credit line to the material. If material is not included in the article’s Creative Commons licence and your intended use is not permitted by statutory regulation or exceeds the permitted use, you will need to obtain permission directly from the copyright holder. To view a copy of this licence, visit http://creativecommons.org/licenses/by-nc-nd/4.0/.
About this article

Cite this article
Chittaragi, D., Ananthan, M., Venkatesan, K. et al. Molecular characterization of curry leaf genotypes using ISSR markers. Sci Rep 15, 37763 (2025). https://doi.org/10.1038/s41598-024-76912-x
-
Received:
-
Accepted:
-
Published:
-
DOI: https://doi.org/10.1038/s41598-024-76912-x