
Data availability
The data supporting this study are provided in the article and in its Supplementary Information and Source Data files. Multi-omics data from published studies used in this work are summarized in Supplementary Table 3. Additional data are available at https://www.wanglab-thu.org.cn/pro. Source data are provided with this paper.
References
-
Zheng, H. & Xie, W. The role of 3D genome organization in development and cell differentiation. Nat. Rev. Mol. Cell Biol. 20, 535–550 (2019).
-
Chen, Z. & Zhang, Y. Role of mammalian DNA methyltransferases in development. Annu. Rev. Biochem. 89, 135–158 (2020).
-
Schmitt, A. D., Hu, M. & Ren, B. Genome-wide mapping and analysis of chromosome architecture. Nat. Rev. Mol. Cell Biol. 17, 743–755 (2016).
-
Dekker, J. et al. The 4D nucleome project. Nature 549, 219–226 (2017).
-
Yu, M. & Ren, B. The three-dimensional organization of mammalian genomes. Annu. Rev. Cell Dev. Biol. 33, 265–289 (2017).
-
Li, Z. et al. Asymmetric distribution of parental H3K9me3 in S phase silences L1 elements. Nature 623, 643–651 (2023).
-
Emerson, D. J. et al. Cohesin-mediated loop anchors confine the locations of human replication origins. Nature 606, 812–819 (2022).
-
Dekker, J. et al. Spatial and temporal organization of the genome: current state and future aims of the 4D nucleome project. Mol. Cell 83, 2624–2640 (2023).
-
Liu, Y. et al. Fork coupling directs DNA replication elongation and termination. Science 383, 1215–1222 (2024).
-
Li, D. et al. Chromatin accessibility dynamics during iPSC reprogramming. Cell Stem Cell 21, 819–833.e6 (2017).
-
Wan, Y. et al. Dynamic imaging of nascent RNA reveals general principles of transcription dynamics and stochastic splice site selection. Cell 184, 2878–2895.e20 (2021).
-
Wen, X. et al. Single-cell multiplex chromatin and RNA interactions in ageing human brain. Nature 628, 648–656 (2024).
-
Lupianez, D. G. et al. Disruptions of topological chromatin domains cause pathogenic rewiring of gene-enhancer interactions. Cell 161, 1012–1025 (2015).
-
Tolhuis, B., Palstra, R. J., Splinter, E., Grosveld, F. & de Laat, W. Looping and interaction between hypersensitive sites in the active β-globin locus. Mol. Cell 10, 1453–1465 (2002).
-
Schoenfelder, S. & Fraser, P. Long-range enhancer–promoter contacts in gene expression control. Nat. Rev. Genet. 20, 437–455 (2019).
-
Wang, D. et al. Reprogramming transcription by distinct classes of enhancers functionally defined by eRNA. Nature 474, 390–394 (2011).
-
Zhou, Y., Xu, S., Zhang, M. & Wu, Q. Systematic functional characterization of antisense eRNA of protocadherin α composite enhancer. Genes Dev. 35, 1383–1394 (2021).
-
Li, G. et al. ChIA-PET tool for comprehensive chromatin interaction analysis with paired-end tag sequencing. Genome Biol. 11, R22 (2010).
-
Beagrie, R. A. et al. Complex multi-enhancer contacts captured by genome architecture mapping. Nature 543, 519–524 (2017).
-
Beagrie, R. A. et al. Multiplex-GAM: genome-wide identification of chromatin contacts yields insights overlooked by Hi-C. Nat. Methods 20, 1037–1047 (2023).
-
Mirny, L. A. & Solovei, I. Keeping chromatin in the loop(s). Nat. Rev. Mol. Cell Biol. 22, 439–440 (2021).
-
Boettiger, A. N. et al. Super-resolution imaging reveals distinct chromatin folding for different epigenetic states. Nature 529, 418–422 (2016).
-
Su, J. H., Zheng, P., Kinrot, S. S., Bintu, B. & Zhuang, X. Genome-scale imaging of the 3D organization and transcriptional activity of chromatin. Cell 182, 1641–1659.e26 (2020).
-
Takei, Y. et al. Integrated spatial genomics reveals global architecture of single nuclei. Nature 590, 344–350 (2021).
-
Yang, T. & Wang, S. Image-based 3D genomics through chromatin tracing. Nat. Rev. Methods Primers 4, 76 (2024).
-
Pownall, M. E. et al. Chromatin expansion microscopy reveals nanoscale organization of transcription and chromatin. Science 381, 92–100 (2023).
-
Gabriele, M. et al. Dynamics of CTCF- and cohesin-mediated chromatin looping revealed by live-cell imaging. Science 376, 496–501 (2022).
-
Yang, J. H. & Hansen, A. S. Enhancer selectivity in space and time: from enhancer−promoter interactions to promoter activation. Nat. Rev. Mol. Cell Biol. 25, 574–591 (2024).
-
Brückner, D. B., Chen, H. T., Barinov, L., Zoller, B. & Gregor, T. Stochastic motion and transcriptional dynamics of pairs of distal DNA loci on a compacted chromosome. Science 380, 1357–1362 (2023).
-
Alexander, J. M. et al. Live-cell imaging reveals enhancer-dependent Sox2 transcription in the absence of enhancer proximity. eLife 8, e41769 (2019).
-
Chen, H. T. et al. Dynamic interplay between enhancer−promoter topology and gene activity. Nat. Genet. 50, 1296–1303 (2018).
-
Janicki, S. M. et al. From silencing to gene expression: real-time analysis in single cells. Cell 116, 683–698 (2004).
-
Masui, O. et al. Live-cell chromosome dynamics and outcome of X chromosome pairing events during ES cell differentiation. Cell 145, 447–458 (2011).
-
Xu, H. et al. TriTag: an integrative tool to correlate chromatin dynamics and gene expression in living cells. Nucleic Acids Res. 48, 13013–13014 (2020).
-
Chen, B. et al. Dynamic imaging of genomic loci in living human cells by an optimized CRISPR/Cas system. Cell 155, 1479–1491 (2013).
-
Wang, H. et al. CRISPR-mediated live imaging of genome editing and transcription. Science 365, 1301–1305 (2019).
-
Qin, P. et al. Live cell imaging of low- and non-repetitive chromosome loci using CRISPR−Cas9. Nat. Commun. 8, 14725 (2017).
-
Gu, B. et al. Transcription-coupled changes in nuclear mobility of mammalian cis-regulatory elements. Science 359, 1050–1055 (2018).
-
Lyu, X. Y. et al. CRISPR FISHer enables high-sensitivity imaging of nonrepetitive DNA in living cells through phase separation-mediated signal amplification. Cell Res. 32, 969–981 (2022).
-
Yang, L. et al. CRISPR-array-mediated imaging of non-repetitive and multiplex genomic loci in living cells. Nat. Methods 21, 1646–1657 (2024).
-
Ma, H. et al. Multiplexed labeling of genomic loci with dCas9 and engineered sgRNAs using CRISPRainbow. Nat. Biotechnol. 34, 528–530 (2016).
-
Cheng, A. W. et al. Casilio: a versatile CRISPR-Cas9-Pumilio hybrid for gene regulation and genomic labeling. Cell Res. 26, 254–257 (2016).
-
Ma, H. et al. CRISPR-Sirius: RNA scaffolds for signal amplification in genome imaging. Nat. Methods 15, 928–931 (2018).
-
Mao, S., Ying, Y., Wu, X., Krueger, C. J. & Chen, A. K. CRISPR/dual-FRET molecular beacon for sensitive live-cell imaging of non-repetitive genomic loci. Nucleic Acids Res. 47, e131 (2019).
-
Peng, Q. et al. Engineering inducible biomolecular assemblies for genome imaging and manipulation in living cells. Nat. Commun. 13, 7933 (2022).
-
Clow, P. A. et al. CRISPR-mediated multiplexed live cell imaging of nonrepetitive genomic loci with one guide RNA per locus. Nat. Commun. 13, 1871 (2022).
-
Geng, Y. T. & Pertsinidis, A. Simple and versatile imaging of genomic loci in live mammalian cells and early pre-implantation embryos using CAS-LiveFISH. Sci. Rep. 11, 12220 (2021).
-
Zhang, Z. et al. Fluorogenic CRISPR for genomic DNA imaging. Nat. Commun. 15, 934 (2024).
-
Hong, Y., Lu, G., Duan, J., Liu, W. & Zhang, Y. Comparison and optimization of CRISPR/dCas9/gRNA genome-labeling systems for live cell imaging. Genome Biol. 19, 39 (2018).
-
Mao, S., Wu, R., Luo, W., Qin, J. & Chen, A. K. Spuriously transcribed RNAs from CRISPR-sgRNA expression plasmids scaffold biomolecular condensate formation and hamper accurate genomic imaging. Nucleic Acids Res. 53, gkaf192 (2025).
-
Chen, B. et al. Expanding the CRISPR imaging toolset with Staphylococcus aureus Cas9 for simultaneous imaging of multiple genomic loci. Nucleic Acids Res. 44, e75 (2016).
-
Ge, X. et al. Outward-oriented sites within clustered CTCF boundaries are key for intra-TAD chromatin interactions and gene regulation. Nat. Commun. 14, 8101 (2023).
-
Lv, X. et al. Patterned cPCDH expression regulates the fine organization of the neocortex. Nature 612, 503–511 (2022).
-
Wu, Q. & Maniatis, T. A striking organization of a large family of human neural cadherin-like cell adhesion genes. Cell 97, 779–790 (1999).
-
Wang, Y., Chen, Y., Hu, Y. & Fang, X. Site-specific covalent labeling of large RNAs with nanoparticles empowered by expanded genetic alphabet transcription. Proc. Natl Acad. Sci. USA 117, 22823–22832 (2020).
-
Niu, X. et al. Pseudoknot length modulates the folding, conformational dynamics, and robustness of Xrn1 resistance of flaviviral xrRNAs. Nat. Commun. 12, 6417 (2021).
-
Wang, Y. et al. Posttranscriptional site-directed spin labeling of large RNAs with an unnatural base pair system under non-denaturing conditions. Chem. Sci. 11, 9655–9664 (2020).
-
Li, L. J. et al. Natural-like replication of an unnatural base pair for the expansion of the genetic alphabet and biotechnology applications. J. Am. Chem. Soc. 136, 826–829 (2014).
-
Lee, K. H., Hamashima, K., Kimoto, M. & Hirao, I. Genetic alphabet expansion biotechnology by creating unnatural base pairs. Curr. Opin. Biotechnol. 51, 8–15 (2018).
-
Betz, K. et al. KlenTaq polymerase replicates unnatural base pairs by inducing a Watson-Crick geometry. Nat. Chem. Biol. 8, 612–614 (2012).
-
Oh, J. et al. Transcriptional processing of an unnatural base pair by eukaryotic RNA polymerase II. Nat. Chem. Biol. 17, 906–914 (2021).
-
Korolev, S. & Gagnon, K. SpCas9 with sgRNA and target DNA. RCSB Protein Data Bank. https://doi.org/10.2210/pdb8G1I/pdb (2023).
-
Atlasi, Y. & Stunnenberg, H. G. The interplay of epigenetic marks during stem cell differentiation and development. Nat. Rev. Genet. 18, 643–658 (2017).
-
Xu, J. Q. et al. Super-resolution imaging of higher-order chromatin structures at different epigenomic states in single mammalian cells. Cell Rep. 24, 873–882 (2018).
-
Ricci, M. A., Manzo, C., García-Parajo, M. F., Lakadamyali, M. & Cosma, M. P. Chromatin fibers are formed by heterogeneous groups of nucleosomes in vivo. Cell 160, 1145–1158 (2015).
-
Nozaki, T. et al. Condensed but liquid-like domain organization of active chromatin regions in living human cells. Sci. Adv. 9, eadf1488 (2023).
-
Saxton, M. N., Morisaki, T., Krapf, D., Kimura, H. & Stasevich, T. J. Live-cell imaging uncovers the relationship between histone acetylation, transcription initiation, and nucleosome mobility. Sci. Adv. 9, eadh4819 (2023).
-
Nagashima, R. et al. Single nucleosome imaging reveals loose genome chromatin networks via active RNA polymerase II. J. Cell Biol. 218, 1511–1530 (2019).
-
Feng, Y. et al. Simultaneous epigenetic perturbation and genome imaging reveal distinct roles of H3K9me3 in chromatin architecture and transcription. Genome Biol. 21, 296 (2020).
-
Lasko, L. M. et al. Discovery of a selective catalytic p300/CBP inhibitor that targets lineage-specific tumours. Nature 550, 128–132 (2017).
-
Vigushin, D. M. et al. Trichostatin A is a histone deacetylase inhibitor with potent antitumor activity against breast cancer. Clin. Cancer Res. 7, 971–976 (2001).
-
Payer, B. & Lee, J. T. X chromosome dosage compensation: how mammals keep the balance. Annu. Rev. Genet. 42, 733–772 (2008).
-
Xie, G. J. et al. MLL3/MLL4 methyltransferase activities control early embryonic development and embryonic stem cell differentiation in a lineage-selective manner. Nat. Genet. 55, 693–705 (2023).
-
Alver, B. H. et al. The SWI/SNF chromatin remodelling complex is required for maintenance of lineage specific enhancers. Nat. Commun. 8, 14648 (2017).
-
Lex, R. K. et al. GLI transcriptional repression is inert prior to Hedgehog pathway activation. Nat. Commun. 13, 808 (2022).
-
Kraushaar, D. C. et al. Genome-wide incorporation dynamics reveal distinct categories of turnover for the histone variant H3.3. Genome Biol. 14, R121 (2013).
-
Huang, X., Bashkenova, N., Yang, J. H., Li, D. & Wang, J. L. ZFP281 recruits polycomb repressive complex 2 to restrict extraembryonic endoderm potential in safeguarding embryonic stem cell pluripotency. Protein Cell 12, 213–219 (2021); erratum 12, 511–513 (2021).
-
Xie, W. H. et al. RNF40 regulates gene expression in an epigenetic context-dependent manner. Genome Biol. 18, 32 (2017).
-
Pham, P. D. et al. Transcriptional network governing extraembryonic endoderm cell fate choice. Dev. Biol. 502, 20–37 (2023).
-
Kaemena, D. F. et al. B1 SINE-binding ZFP266 impedes mouse iPSC generation through suppression of chromatin opening mediated by reprogramming factors. Nat. Commun. 14, 488 (2023).
-
Raccaud, M. et al. Mitotic chromosome binding predicts transcription factor properties in interphase. Nat. Commun. 10, 487 (2019).
-
Du, Z. H. et al. Stepwise de novo establishment of inactive X chromosome architecture in early development. Nat. Genet. 56, 2185–2198 (2024).
-
Cloutier, M., Harris, C., Gayen, S., Maclary, E. & Kalantry, S. Experimental analysis of imprinted mouse X-chromosome inactivation. Methods Mol. Biol. 1861, 177–203 (2018).
-
Cox, G. & Sheppard, C. J. R. Practical limits of resolution in confocal and non-linear microscopy. Microsc. Res. Tech. 63, 18–22 (2004).
-
Kehayova, P., Monahan, K., Chen, W. S. & Maniatis, T. Regulatory elements required for the activation and repression of the protocadherin-α gene cluster. Proc. Natl Acad. Sci. USA 108, 17195–17200 (2011).
-
Guo, Y. et al. CTCF/cohesin-mediated DNA looping is required for protocadherin α promoter choice. Proc. Natl Acad. Sci. USA 109, 21081–21086 (2012).
-
Monahan, K. et al. Role of CCCTC binding factor (CTCF) and cohesin in the generation of single-cell diversity of Protocadherin-α gene expression. Proc. Natl Acad. Sci. USA 109, 9125–9130 (2012).
-
Wang, T. F. et al. Chemical-induced phase transition and global conformational reorganization of chromatin. Nat. Commun. 14, 5556 (2023).
-
Ye, C. Y. et al. DRUG-seq for miniaturized high-throughput transcriptome profiling in drug discovery. Nat. Commun. 9, 4307 (2018).
-
Tak, Y. E. et al. Augmenting and directing long-range CRISPR-mediated activation in human cells. Nat. Methods 18, 1075–1081 (2021).
-
Morgan, S. L. et al. Manipulation of nuclear architecture through CRISPR-mediated chromosomal looping. Nat. Commun. 8, 15993 (2017).
-
Furlan, G. et al. The Ftx noncoding locus controls X chromosome inactivation independently of its RNA products. Mol. Cell 70, 462–472 (2018).
-
Hnisz, D. et al. Super-enhancers in the control of cell identity and disease. Cell 155, 934–947 (2013).
-
Bal, E. et al. Super-enhancer hypermutation alters oncogene expression in B cell lymphoma. Nature 607, 808–815 (2022).
-
Sabari, B. R. et al. Coactivator condensation at super-enhancers links phase separation and gene control. Science 361, eaar3958 (2018).
-
Cho, W. K. et al. Mediator and RNA polymerase II clusters associate in transcription-dependent condensates. Science 361, 412–415 (2018).
-
Lovén, J. et al. Selective inhibition of tumor oncogenes by disruption of super-enhancers. Cell 153, 320–334 (2013).
-
Delmore, J. E. et al. BET bromodomain inhibition as a therapeutic strategy to target c-Myc. Cell 146, 904–917 (2011).
-
Linares-Saldana, R. et al. BRD4 orchestrates genome folding to promote neural crest differentiation. Nat. Genet. 53, 1480–1492 (2021).
-
Crump, N. T. et al. BET inhibition disrupts transcription but retains enhancer-promoter contact. Nat. Commun. 12, 223 (2021).
-
Xiang, J. et al. Human colorectal cancer-specific CCAT1-L lncRNA regulates long-range chromatin interactions at the MYC locus. Cell Res. 24, 513–531 (2014).
-
Cai, Z. K. et al. RIC-seq for global in situ profiling of RNA−RNA spatial interactions. Nature 582, 432–437 (2020).
-
Zhu, Y. et al. High-resolution dynamic imaging of chromatin DNA communication using Oligo-LiveFISH. Cell 188, 3310–3328.e27 (2025).
-
Wan, X. et al. SiCLAT: simultaneous imaging of chromatin loops and active transcription in living cells. Genome Biol. 26, 1 (2025).
-
Ochiai, H., Sugawara, T. & Yamamoto, T. Simultaneous live imaging of the transcription and nuclear position of specific genes. Nucleic Acids Res. 43, e127 (2015).
-
Lengner, C. J. et al. Primary mouse embryonic fibroblasts: a model of mesenchymal cartilage formation. J. Cell. Physiol. 200, 327–333 (2004).
-
Jinek, M. et al. Structures of Cas9 endonucleases reveal RNA-mediated conformational activation. Science 343, 1247997 (2014).
-
Schindelin, J. et al. Fiji: an open-source platform for biological-image analysis. Nat. Methods 9, 676–682 (2012).
-
Beliveau, B. J. et al. Versatile design and synthesis platform for visualizing genomes with Oligopaint FISH probes. Proc. Natl Acad. Sci. USA 109, 21301–21306 (2012).
-
Wang, H. et al. CRISPR-mediated programmable 3D genome positioning and nuclear organization. Cell 175, 1405–1417.e14 (2018).
-
Zou, Z., Ohta, T., Miura, F. & Oki, S. ChIP-Atlas 2021 update: a data-mining suite for exploring epigenomic landscapes by fully integrating ChIP-seq, ATAC-seq and Bisulfite-seq data. Nucleic Acids Res. 50, W175–W182 (2022).
Acknowledgements
We are grateful to members of the Wang laboratory for their discussions and comments during the preparation of the manuscript. We thank the Imaging Core Facility of the Technology Center for Protein Sciences at Tsinghua University for microscopy imaging and analysis support. We thank R. Xu and D. S. Liu for their support in exploring fluorescent gRNA labeling methods during the initial stages, which, although not included here, has provided valuable insights. This work was funded by the following grants: the Agriculture Science and Technology Major Project to H.W., the National Key R&D Program of China (2022YFC3400204 to H.W., 2021YFA1301500 to X.F., 2021YFA1100102 to W.X.); the National Natural Science Foundation of China (32270573 to H.W., U1832215 to X.F.), the Strategic Priority Research Program of the Chinese Academy of Sciences (XDB0570300 to X.F.), the Beijing Natural Science Foundation (F251024 to X.F.) and the Tsinghua-Peking Joint Center for Life Sciences (H.W. and W.X.). H.W. is supported by the Independent Research Fund of the State Key Laboratory of Complex, Severe, and Rare Diseases (2025-I-ZD-005), the Tsinghua University Initiative Scientific Research Program and the Benyuan Charity Fund. W.X. is a recipient of the New Cornerstone Investigator award.
Ethics declarations
Competing interests
The authors have filed patents (CN: 202511377180X by H.W., X.F., K.H., J.Z. and M.L. and CN: 2025113774687 by H.W., M.L. and K.H.) related to this work.
Peer review
Peer review information
Nature Biotechnology thanks the anonymous reviewers for their contribution to the peer review of this work.
Additional information
Publisher’s note Springer Nature remains neutral with regard to jurisdictional claims in published maps and institutional affiliations.
Extended data
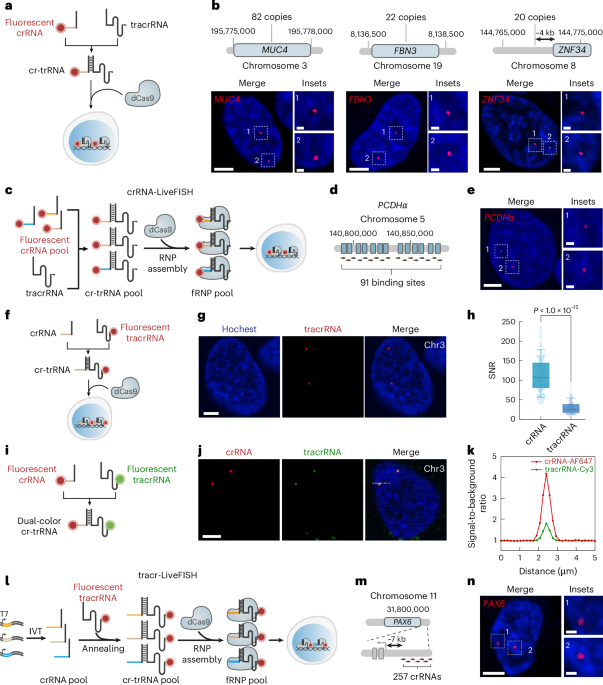
Extended Data Fig. 1 Additional LiveFISH imaging of specific gene loci via fluorescent crRNAs or fluorescent tracrRNAs.
a, Additional live-cell images of various repetitive loci, including Chr3, MUC4, FBN3, and ZNF34, labeled by crRNA-LiveFISH. Scale bars, 5 μm. b, Comparison of signal-to-noise ratio (SNR) at gene loci with different numbers of repeats, including Chr3 (~500 copies, N=100 loci, Cy3), MUC4 (82 copies, N=100 loci, Atto565), FBN3 (22 copies, N=100 loci, Atto565), and ZNF34 (20 copies, N=100 loci, Atto565). Box plots show median, 25th–75th percentiles, whiskers (10th–90th), and individual points. c, Additional live-cell images of Chr3 and MUC4, labeled by tracr-LiveFISH. Scale bars, 5 μm. d, A representative U2OS image (left) of MUC4 loci using a pair of crRNA (red, Atto565) and tracrRNA (green, Cy5) labeled with distinct fluorophores. Scale bar, 5 μm. e, The linescan plot showing signal-to-background ratio along the dashed line in d. f, A representative U2OS image of ZNF34 loci using a pair of crRNA (red, Atto565) and tracrRNA (green, Cy5) labeled with distinct fluorophores. Scale bar, 5 μm. g, The linescan plot showing signal-to-background ratio along the dashed line in f. h, Comparison of SNR at ZNF34 loci by fluorescent crRNA (N=100 loci, Atto565) and fluorescent tracrRNA (N=100 loci, Cy5). p-value: two-sided unpaired t-test. Box plots show median, 25th–75th percentiles, whiskers (10th–90th), and individual points. All experiments were replicated independently ≥ 3 times.
Extended Data Fig. 2 Additional information for validating the labeling efficiency and specificity of UBP-sgRNA-based LiveFISH imaging.
a, Schematic of CRISPR LiveFISH via randomly inserted Cy3-labeled sgRNA for repetitive sequences. The DNA template was prepared by PCR using a forward primer containing T7 promoter and a spacer sequence, and a universal reverse primer containing the sgRNA scaffold. Fluorescent sgRNAs were prepared by random insertion of Cy3-UTP during IVT, assembled with dCas9, and delivered into living cells for LiveFISH imaging. b, 8% TBE denaturing urea PAGE analysis of Cy3-labeled sgRNAs generated by UBP labeling (lanes 1–3) and random-insertion labeling (lanes 4). Visualized by fluorescent imaging (left) and SYBR gold staining (UV, right). A single-stranded RNA ladder was used to verify the sgRNAs targeting Chr3, MUC4, and ZNF34 with different spacer lengths. c, A representative U2OS image of Chr3 loci using Cy3-RI-sgRNA. Scale bar, 5 μm. d, Additional live-cell images of MUC4 and ZNF34 labeled by UBP-based LiveFISH. Scale bars, 5 μm. e, DNA FISH (green) validating UBP-sgRNA LiveFISH (red) labeling of ZNF34 loci, with separate channels. Scale bar, 5 μm. f, RNA FISH (green) validating UBP-sgRNA labeling (red) of ZNF34 loci. Scale bar, 5 μm. g, Relative ZNF34 expression in U2OS cells after delivery of ZNF34-targeting sgRNA (sgTarget) versus non-targeting sgRNA (sgNT), normalized to the non-targeting group. Mean ± SD. Individual points show data from 3 biological replicates. p-value: two-sided unpaired t-test. h, Representative U2OS cell imaging of MUC4 loci using UBP-sgRNA (JF549) with dCas9-EGFP. Scale bar, 5 μm. i, The linescan plots showing relative fluorescence intensity of UBP-sgRNA and dCas9-EGFP along the dashed lines in h. j, Comparison of SNR between dCas9-EGFP (N=100 loci) and UBP-sgRNA (N=100 loci, JF549) at MUC4 loci. Box plots show median, 25th–75th percentiles, whiskers (10th–90th), and individual points; p-value: two-sided unpaired t-test. All experiments were replicated independently ≥ 3 times.
Extended Data Fig. 3 Additional information on multi-color imaging using UBP-sgRNA-based LiveFISH.
a, Additional U2OS cells showing dual-color labeling of the MUC4 (red, AF647) and ZNF34 loci (green, JF549) using UBP-sgRNAs, respectively. Scale bars, 5 μm. b, Live-cell imaging revealed fluorescent dCas9 exchange between different pre-assembled RNPs. Two sets of fRNPs were separately pre-assembled: dCas9-EGFP (green) with JF549-sgRNAChr13 (blue), and dCas9 with AF647-sgRNAChr3 (red). These RNPs were then co-delivered into U2OS cells at a ratio of 1:1. If no crosstalk occurs, Chr3 loci would be labeled exclusively by AF647-sgRNAChr3 (red). However, due to RNP crosstalk, Chr3 loci were labeled in both the red (AF647-sgRNAChr3) and green (dCas9-EGFP) channels, indicating that dCas9-EGFP exchanged between the two pre-assembled RNP complexes (scale bar, 5 μm; insets, scale bars, 1 μm). c, A representative U2OS cell showing simultaneous labeling of six loci using differentially labeled UBP-sgRNAs (scale bars, 5 μm) with insets (scale bars, 1 μm), including T1 (AF488), FBN3 (JF549), ZNF34 (AF647), Chr13 (AF488 and JF549), MUC4 (JF549 and AF647) and PR1 (AF488 and AF647). d, The 3D trajectories of the non-repetitive MUC4.I1 loci (red), MUC4.I3 loci (green), and Chr3 loci (purple) in Fig. 3c. e, Additional live-cell images labeling the non-repetitive MUC4.I1 loci (red, JF549), repetitive MUC4.I3 loci (green, AF647), and Chr3 loci (purple, AF488; scale bars, 5 μm). Insets: scale bars, 1 μm. f, Box plot comparing the distances from MUC4.I1 to MUC4.I3 (N=100 loci pairs), and from Chr3 to MUC4.I3 (N=100 loci pairs), respectively. Box plots show median, 25th–75th percentiles, whiskers (10th–90th), and individual points; p-value: two-sided unpaired t-test. All experiments were replicated independently ≥ 3 times.
Extended Data Fig. 4 Additional epigenetic characterization, gRNA design, FISH imaging, and RNA expression analysis of the Xist locus.
a-c, Bar graphs of the ATAC-seq (a), H3K4me1 (b), and H3K27me3 (c) signals around the Xist gene in NIH3T3 (blue), MEF (grey), and XEN (orange) cells. d, Schematic of the Xist gene labeled by PRO-LiveFISH using a pool of fluorescent gRNAs. e, Additional live-cell images labeling the Xist loci in NIH3T3 (male), MEF (female), and XEN (female) cells by PRO-LiveFISH. Scale bars, 5 μm. f, Representative XEN cell imaging of the Xist DNA locus by PRO-LiveFISH (red) and Xist RNA transcripts (grey, RNA FISH) around the inactive X chromosome. Scale bar, 5 μm. g, Relative Xist expression in XEN cells after delivery of Xist-targeting sgRNA (sgTarget) or non-target sgRNA (sgNT), normalized to the non-targeting group. Mean ± SD. Individual points show data from 3 biological replicates. p-value: two-sided unpaired t-test. h, Box plot comparing the sizes of Xist loci in NIH3T3 (blue, N=11 loci), MEF (grey, N=11 loci), and XEN (orange, N=11 loci) cells, respectively. p-value: one-way ANOVA with Tukey’s post hoc test. i, Representative DNA FISH images of the Xist loci in the XEN cell. Scale bar, 5 μm. j, Comparison of the sizes of Xist loci in XEN cells labeled by PRO-LiveFISH (N=14 loci) and DNA FISH (N=14 loci). p-value: two-sided unpaired t-test. k, Scatterplots for Xist step displacement (dx, dy) in XEN cells, including control group (Ctrl, DMSO treated) and A-485 treated group (A485, 100 μM for 16 h). dxt = xt-xt-1, dyt = yt-yt-1, where (xt,yt) is the locus coordinate at time t. Movements tracked every 5 s. Box plots in h and j show median, 25th–75th percentiles, whiskers (10th–90th), and individual points. All experiments were replicated independently ≥ 3 times.
Extended Data Fig. 5 Additional information on PRO-LiveFISH and DNA FISH imaging of PCDHα-enhancer interactions.
a, Additional U2OS cell imaging showing PCDHα (red, AF647) and HS5-1 loci (green, JF549; scale bar, 5 μm), with magnified insets showing time-lapse images with split channels (bottom; scale bars, 1 μm). b, Representative DNA FISH image of the PCDHα (green) and HS5-1 (red) loci in U2OS cell. Scale bar, 5 μm. c, Quantification of distances between PCDHα and HS5-1 by DNA FISH in U2OS cells. Mean ± SD, with dots showing 3 independent biological replicates. d, Comparison of distances between PCDHα and HS5-1 by PRO-LiveFISH (N=150 loci pairs) and DNA FISH (N=120 loci pairs). Box plots show median, 25th–75th percentiles, whiskers (10th–90th), and individual points; p-value: two-sided unpaired t-test. All experiments were replicated independently ≥ 3 times.
Extended Data Fig. 6 Additional information on PRO-LiveFISH imaging of Xist gene and its enhancer in primary MEF cells.
a, Imaging of a representative female primary MEF cell labeling the Xist loci by PRO-LiveFISH, based on the pooled JF549-sgRNAs. Scale bar, 5 μm. b, Imaging of a representative male primary MEF cell labeling the Xist loci by PRO-LiveFISH, based on the pooled JF549-sgRNAs. Scale bar, 5 μm. c, DNA FISH images of the Xist loci in female primary MEF cells. Scale bar, 5 μm. d, DNA FISH images of the Xist loci in male primary MEF cells. Scale bar, 5 μm. e, The integrated map of Hi-C and H3K27ac signals (ChIP-seq) for the Xist and Ftx genomic regions in MEF cells. f, DNA FISH images of the Xist and Ftx loci in the female (top) and male (bottom) primary MEF cells. Scale bars, 5 μm. g, Comparison of distances between Xist and Ftx loci by PRO-LiveFISH (N=100 loci pairs) and DNA FISH (N=100 loci pairs) in primary MEF cells. Box plots show median, 25th–75th percentiles, whiskers (10th–90th), and individual points; p-value: two-sided unpaired t-test. All experiments were replicated independently ≥ 3 times.
Extended Data Fig. 7 Additional information on studying BRD4’s role in super-enhancer organization of the MYC oncogene.
a, Magnified time-lapse and split-channel images of inset 1 in Fig. 6b. Scale bars, 1 μm. b, Additional live-cell images of MYC (green, JF549) and its SE (CCAT1, red, AF647) in HeLa cells using PRO-LiveFISH (scale bars, 5 μm), with insets (scale bars, 1 μm). c, Representative HeLa cells showing labeling of MYC SE (CCAT1) by PRO-LiveFISH and MYC RNA (RNA FISH). Scale bars, 5 μm. d, The relative MYC expression in HeLa cells after delivery of CCAT1-targeting sgRNA (sgTarget) or non-target sgRNA (sgNT), normalized to the non-targeting group. Mean ± SD. Individual points show data from 3 biological replicates. e, Magnified time-lapse and split-channel images of inset 1 in Fig. 6e. Scale bars, 1 μm. f, Additional live-cell images in HeLa cells after JQ1 treatment labeling MYC (green, JF549) and its SE (CCAT1, red, AF647) using PRO-LiveFISH (scale bars, 5 μm), with insets (scale bars, 1 μm). g, Distribution of distances between MYC and its SE (CCAT1) in control (Ctrl, DMSO) and JQ1-treated group (5 μM, 24 h). Mean ± SD, with dots showing 3 independent replicates. h, Box plot of distances between MYC and its SE (CCAT1) in control (Ctrl, N=120 loci pairs) and JQ1-treated group (N=120 loci pairs) by DNA FISH. i, Representative DNA FISH images of the MYC and its SE (CCAT1) in control (Ctrl, top) and JQ1-treated group (scale bars, 5 μm), with insets (scale bars, 1 μm). j-k, Box plots of 3D step distances of MYC (j) and CCAT1 (k) in control (Ctrl, N=150 loci steps) and JQ1-treated groups (JQ1, N=150 loci steps), tracked at 10-s intervals. p-value in d, h, j and k: two-sided unpaired t-test. Box plots in h, j and k show median, 25th–75th percentiles, whiskers (10th–90th), and individual points. All experiments were replicated independently ≥ 3 times.
Supplementary information
Source data
Rights and permissions
Springer Nature or its licensor (e.g. a society or other partner) holds exclusive rights to this article under a publishing agreement with the author(s) or other rightsholder(s); author self-archiving of the accepted manuscript version of this article is solely governed by the terms of such publishing agreement and applicable law.
About this article

Cite this article
Liu, M., Huang, K., Zhang, J. et al. CRISPR live-cell imaging reveals chromatin dynamics and enhancer interactions at multiple non-repetitive loci. Nat Biotechnol (2025). https://doi.org/10.1038/s41587-025-02887-3
-
Received:
-
Accepted:
-
Published:
-
Version of record:
-
DOI: https://doi.org/10.1038/s41587-025-02887-3

