
Introduction
Popularly known stinging nettle also called Urtica dioica L., it is an esteemed species of the genus Urtica, and a member of the family Utricaceae. It is widely distributed across temperate regions in Asia, North America, Africa and Europe1,2. Nettle has demonstrated its versatility, having been used in food and for medicinal purposes for centuries3. Several bioactive compounds and phytochemicals, including flavonoids, phenolics, and organic acids are abundantly found in leaves and extracts of nettle, contributing to its anti-diabetic, diuretic, anti-inflammatory, antioxidant, and antibacterial properties. Further, it was also been found that nettle leaves are rich sources of minerals (Ca, K, and Fe), vitamins (A and C), lutein, and well-known phenolic compounds namely caffeic acid, chlorogenic acid, and kaempferol-3-rutinoside, which can block the glycation process4,5. It also contains amino acids such as valine, tryptophan, isoleucine, threonine, leucine, methionine, lysine, and phenylalanine, which are essential for maintaining the body’s health6. Additionally, due to its significant antimicrobial activity against bacteria like Bacillus subtilis, Lactobacillus plantarum, Pseudomonas aeruginosa and Escherichia coli, it has strong potential to be used as a natural preservative in the food industry7. These properties make nettle leaves an appropriate source of bioactive substances for use in medicine or as a functional food ingredient5.
Considering the significant utilization of bioactive-compound-rich nettle extracts in food and medicinal remedies, selecting appropriate extraction techniques becomes crucial. The selected technique should facilitate higher extraction yield and be sustainable, time-saving, non-destructive, and efficient7. Therefore, it is essential to use advanced extraction techniques, one such being microwave-assisted extraction (MAE). MAE, considered a novel and green extraction technique, is gaining considerable popularity over conventional methods. MAE enables efficient extraction of solute from the plant matrix while using less solvent, generating minimum waste, and reducing environmental and human exposure to harmful chemicals8. The extraction process in this technique is driven by changes in cell structure due to electromagnetic waves. The process is rapid due to alignment in mass and heat transfer gradients, with microwaves boosting the extraction kinetics and offering advantages over conventional extraction methods9. In order to maximize the potential of the extraction, it is crucial to select process parameters such as microwave power, time, temperature, and solvent type, as these affect the overall quality of the extracted solute7.
Therefore, in this regard, the current study focuses on the extraction of polyphenolic compounds from nettle leaves using MAE in solvents such as water, ethanol (80%) and natural deep eutectic solvent (NADES), and further optimising the MAE process based on microwave power (W), time (Min) and slurry-to-solvent ratio by applying response surface methodology (RSM). The obtained extracts were optimised based on their total phenolic content (TPC), total flavonoid content (TFC), and antioxidant activity by DPPH. Moreover, the optimized extracts were assessed in terms of TPC, TFC, antioxidant activity (DPPH, ABTS, and FRAP), antimicrobial activity, mass-spectroscopy (GC-MS), and phenolic profiling (U-HPLC).
Materials and methods
Materials and chemicals
In this experiment, fresh leaves of Urtica dioica L. were collected from naturally growing populations in non-protected, publicly accessible areas of Gangolihat, Uttarakhand, India (Latitude 29.65815° N, Longitude 80.039598° E). The collection site is open to the public, and the species is traditionally used by local communities for culinary and ethnomedicinal purposes. While Urtica dioica L. is not endemic to India, it has become naturalized in certain regions and is commonly found in the wild. It is not listed under any endangered or protected categories in local or national biodiversity regulations. Since the plant material was collected in minimal quantities for preliminary, non-commercial academic research from non-protected areas, no formal permissions or licenses were required. Nevertheless, the authors ensured that the collection was conducted responsibly without disturbing the local ecosystem. All the chemicals required for analysis were sourced from Sigma-Aldrich and HiMedia, India.
Preparation of raw material
Nettle leaves were detached from stems manually, followed by washing and rinsing under tap water to eliminate impurities, dust, and foreign particles adhered to them. The washed and cleaned leaves were spread uniformly on a tray dryer (Thermo Life Sciences) for drying at 50 ± 5 °C for 5 h. After thorough drying, the leaves were ground using a household mixer grinder (Sujata, 900 W, India) to obtain a fine powder, which was further sieved using a 40-mesh sieve to achieve uniformity. The resulting nettle powder (NG) was finally secured in an airtight container to prevent moisture penetration for further treatment and use.
Preparation of NADEs
The NADEs used as the extraction solvent was prepared as per the methodology given by Gupta et al.10. Concisely, lactic acid and choline chloride were chosen as hydrogen donor and acceptor, respectively. Lactic acid and choline chloride were mixed in a ratio of 2:1, followed by heating the mixture at 50–55 °C in a water bath until it became clear and unclouded. It was prepared fresh for the extraction process.
Experimental design using Box-Behnken Design (BBD) and validation of model
In the current study, BBD was implemented to obtain the combinations of process parameters and experiments. The selected process parameters were microwave power (X1), time (X2), and solvent-to-slurry ratio (X3), with TPC, TFC, and DPPH as the selected responses. A total of 17 experiments were conducted along with 5 central points.
Design Expert 13.0.1 software was employed for statistical analysis. The experimental data using Box-Behnken Design (BBD) were fitted to a second-order polynomial model to express the response variables as functions of the independent variables, as shown in the following equation (Eq. 1).
$$:Y={beta}_{0}sum_{i=1}^{n}{beta}_{i}{X}_{i}+sum_{i=1}^{n}{beta}_{ii}{X}_{i}^{2}+sum_{i=1}^{n-1}sum_{j=i+1}^{n}{beta}_{ij}{X}_{i}{X}_{j}::$$
(1)
where Y represents the desired response, and β0, βi, βii, and βij are the coefficients for the intercept, linear terms, quadratic terms, and interaction terms, respectively. Xi and Xj denote the levels of independent variables (where i = 1, 2,… and j = 1, 2, …), and n indicates the number of independent variables. The parametric effects on various responses were assessed by interpreting the developed models. Multiple regression analysis was employed to analyze the experimental data, develop response functions, and optimize variable parameters for the best outputs. Model adequacy was evaluated using R² (coefficient of multiple determination). The values of model coefficients and related statistics, including lack of fit, p-value, standard deviation, mean, coefficient of variation (C.V.), and Adequate Precision, were obtained using the software. The p-value indicates the significance probability, with models having lower p-values considered superior11. The fit of the quadratic model was estimated by calculating the percentage error using the following equation (Eq. 2).
$$:varvec{E}varvec{r}varvec{r}varvec{o}varvec{r}:left(varvec{%}right)=frac{(varvec{E}varvec{x}varvec{p}varvec{e}varvec{r}varvec{i}varvec{m}varvec{e}varvec{n}varvec{t}varvec{a}varvec{l}:varvec{v}varvec{a}varvec{l}varvec{u}varvec{e}-varvec{p}varvec{r}varvec{e}varvec{d}varvec{i}varvec{c}varvec{t}varvec{e}varvec{d}:varvec{v}varvec{a}varvec{l}varvec{u}varvec{e})}{varvec{E}varvec{x}varvec{p}varvec{e}varvec{r}varvec{i}varvec{m}varvec{e}varvec{n}varvec{t}varvec{a}varvec{l}:varvec{v}varvec{a}varvec{l}varvec{u}varvec{e}}times:100::$$
(2)
Microwave-assisted extraction
The extraction was carried out in a microwave extractor (Ethos, Milestone, Italy) using distilled water, ethanol (80%) and prepared NADES as extracting solvents, following the methodology adopted by Gupta et al.10 with some modifications. An accurately weighed sample was put in a flat bottom flask (500 mL) followed by adding the selected solvent. Microwave treatment was applied under varying conditions as mentioned in Table 1. Upon microwave extraction, the mixture was centrifuged (REMI, R-8C Plus) at 5000 rpm for 10 min and concentrated using a rotary vacuum evaporator (DLAB, RE-100) operated at 50 °C. The NG extracts extracted in water, ethanol, and NADES were coded as NGW, NGE, and NGN, respectively. The resulting crude extracts were diluted to 1 mg/mL concentration using the respective solvents.
Phytochemical and antioxidant analysis
Total phenolic content (TPC)
Determination of TPC was done by adding 1mL of extracts to 0.5 mL of FC reagent (10%) and 2.5 mL of Na2CO3 (20%), followed by proper mixing in a vortex shaker (DLAB, MX-S). After thorough shaking, mixture was subjected to an incubation period of 45 min in completely dark conditions, and absorbance was observed at 725 nm in a UV spectrophotometer (Shimadzu 1900), as per the method suggested by Kumar et al.12. Results were expressed in mg GA/100 mg, based on calculations using the gallic acid standard curve.
Total flavonoid content (TFC)
TFC of the extracts was done adopting the methodology followed by Kumar et al.12, according to which 1 mL of the extracts was added to 0.3 mL of NaNO2 (5%), 0.3 mL of AlCl3 (5%), 2 mL of NaOH (1 mol/L), and 2.5 mL of distilled water. The mixture was thoroughly mixed for a few minutes by putting on a vortex shaker (DLAB, MX-S,) followed by immediate absorbance measurement at 510 nm using a UV spectrophotometer (Shimadzu 1900). The calculation was done using the quercetin standard curve, and results were expressed as mg QE/100 mg.
2,2-diphenyl-1-picrylhydrazyl assay (DPPH)
The DPPH assay of the prepared extracts was performed by following the methodology given by Kumar et al.12. 1 mL of the extracts was mixed with 4 mL of DPPH solution (0.004%) in the dark, followed by proper mixing in a vortex shaker (DLAB, MX-S), and kept in the incubation for 30 min at room temperature in the dark. The absorbance was recorded at 517 nm by UV spectrophotometer (Shimadzu 1900). The result was calculated as per the following equation (Eq. 3).
$$%rm{IA} =:frac{{A}_{c}-{A}_{e}}{{A}_{c}}times 100$$
(3)
where Ac and Ae are the absorbances recorded of the control and extracts, respectively.
Ferric reducing antioxidant power (FRAP assay)
The FRAP assay for the optimized extracts was determined by the methodology described by Chaves et al.13. The FRAP mix was freshly prepared by combining 0.3 M acetate buffer solution of pH 3.6 with 10 mM of 2,4,6- tripyridyl-S-triazine (TPTZ) and 20 mL of ferric chloride hexahydrate (FeCl3.6H2O) in the ratio of 10:1:1, respectively. To the prepared FRAP mix, 0.5 mL of extracts was added, followed by heating the mixture at 37 °C for 10 min and thereafter incubating it for 30 min in the dark. Absorbance was taken at 593 nm using a UV spectrophotometer (Shimadzu 1900). The ferric-reducing potential was calculated using the ascorbic acid standard curve, and results were represented in the µM ascorbic acid equivalent.
2,2-azinobis-(−3-ethylbenzothiazoline-6-sulfonate) assay (ABTS assay)
The methodology described by Ullah et al.14, with some modifications, was followed to perform ABTS assay of the extracts. For the preparation of the ABTS mix, 7 mM of ABTS and 2.45 mM of potassium persulphate solution were mixed in a ratio of 1:1 and kept in the dark for 16–24 h. Thereafter, the prepared ABTS mix was diluted with ethanol (80%), and absorbance was set as 0.7 ± 0.02 at 734 nm wavelength. Further, the ABTS assay was performed by adding 3 mL of working solution to 1 mL of extracts, after an incubation of 6 min in the dark, absorbance was observed at 734 nm using a UV spectrophotometer (Shimadzu 1900).
The result was calculated using the below-mentioned equation (Eq. 4).
$$text{ABTS radical scavenging activity}, (%) = frac{{A}_{W}-{A}_{e}}{{A}_{w}}times:100$$
(4)
where Aw and Ae are the observed absorbance of the ABTS working solution and extracts, respectively.
Phenolic profiling by U-HPLC
For the quantitative determination of phenolic compounds, the sample was prepared following the methodology adopted by Ranatunge et al.15. According to the method, 8 mL of methanol (80%) was used to dissolve 2.5 g of the extract. The mixture was sonicated for 10 min, followed by continuous shaking for 5 min and then centrifugation (REMI R-8 C plus) at 9000 rpm for 10 min. The described extraction process was repeated 3 times, and the pooled supernatant was collected with a clear appearance. Further, the supernatant was filtered using a 0.2 μm syringe filter to load into the column. The U-HPLC (Shimadzu N- series) used for the analysis was equipped with a PDA detector and a C18 column (1.9 μm, 2.1 × 100 mm). Calibration was performed with benzoic acid, p-coumaric acid, vanillic acid, gallic acid, etc. as analytical standards. Preparation of the binary mobile phase was completed using 2,2,2-trifluoroacetic acid (0.2%) in water as mobile phase I and ACN (50%) with 2,2,2-trifluoroacetic acid (0.2%) as mobile phase II at a flow rate of 1 mL/min. Various peaks at different wavelengths (280, 320, 350, and 367 nm) were recorded by using a C18 column (30 °C) along with a column oven. Agilent Solution’s EZ Chrom software was used for calculating the area under the peak. Finally, the calculated results were represented in mg/kg on a dry weight basis.
Anti-microbial activity
The disc-diffusion method as described by Ngamsurach and Praipipat16 was employed to observe the anti-microbial activity of the prepared extracts. Revived bacterial strains of Staphylococcus aureus, Escherichia coli, and Streptococcus pyogenes were used as suspension to spread on solidified nutrient agar plates. Each plate was divided into five regions for observing the activity of the extracts prepared at concentrations of 1, 2, 3, 4, and 5 mg/mL. Later, the 6 mm filter paper cut-out discs, each soaked with extract of different concentrations, was placed firmly on the plate, experimenting in duplicate. Separate plates for positive (antibiotic) and negative controls (water, ethanol, and NADES) were prepared. All prepared plates were incubated at 37 °C using an incubator (Equitron, Incubator Stream Series, 091 L) set for 24 h. Later, the measurement of the observed zones was done in mm.
GC-MS analysis
Gas chromatography-mass spectroscopy was used in the identification of existing bioactive compounds in the NG-derived different extracts by adopting the method suggested by Upadhyay et al.17. The extracts were dissolved using hexane as a solvent, and further centrifugation was done to achieve phase separation. The collected supernatant was then loaded in the column for analysis. The GC-MS (Agilent, 5977 C GC/MSD 8890GC System) was equipped with column HP-5 with a diameter of 0.250 mm. Helium was used as the carrier gas at a flow rate of 1.5 mL/min, with the pressure exerted on the column at 11.961 psi with oven temperature at 40 °C.
LC-MS analysis
The methodology opted by Bakar et al.18 was followed to conduct the chromatographic analysis of different extracts. An Agilent C18 reverse-phase column with dimensions 4.0 × 250 mm, 1.8 μm, operated at 50 °C with a 0.4 mL/min flow rate, was used for a 30-min run. A gradient elution was performed with solvent A (water + 0.1% acetic acid) and solvent B (acetonitrile + 0.1% acetic acid), increasing B from 5 to 85% over 25 min and returning to initial conditions in 5 min. A sample quantity of 20 µL was injected. The mass spectroscopy was conducted in both positive and negative electrospray ionisation modes over an m/z range of 150–1500, with source conditions: nebulizer pressure 40 psi, drying gas flow 12 L/min at 350 °C. Data were received and analysed using Agilent Mass Hunter software, and the obtained peaks were identified by comparing them with the literature and online database.
Statistical analysis
For comparative analysis, all the experiments were performed in triplicate, and results were expressed as mean ± SD using MS Excel.
Results and discussion
In this study, we aimed to investigate the effect of different solvents on microwave-assisted extraction of bioactive compounds from Nettle (Urtica dioica) leaves. For this, a total of 17 experiments, including 5 centre points, were performed with each solvent i.e., water, ethanol, and NADES, and the results of the corresponding responses, including TPC (mg GAE/g), TFC (mg QE/g), and DPPH (%), were obtained and summarized in Table 1. The TPC varied from 218.16 mg GAE/g to 155.8 mg GAE/g for water, 202.32 mg GAE/g to 166.84 mg GAE/g for ethanol, and 209.91 mg GAE/g to 167.25 mg GAE/g for NADES. The highest and lowest TPC content was measured with water. TFC varied from 57.16 mg QE/g to 99.5 mg QE/g for water, 73.76 mg QE/g to 123.36 mg QE/g for ethanol, and 55.66 mg QE/g to 72.55 mg QE/g for NADES. The highest TFC content was observed with ethanol while the lowest was observed with NADES. A similar observation was reported by Martinović et al.19. DPPH (%) varied from 84.91 to 95.17 with water, 85.38 to 95.89 with ethanol, and 89.72 to 96.09 with NADES. The highest DPPH (%) was observed with NADES, while the lowest was with water. The highest DPPH radical scavenging activity was reported in the NADES extract of Toona sinensis seed20 and NADES extract of olive pomace21 compared to water and ethanolic extracts.
Model Fitting and analysis of variance (ANOVA)
Table 1 shows the experimental results that were examined by calculating the analysis of variance (ANOVA), including F-value, lack of fit (LOF), mean, coefficient of variance (C.V. %), coefficient of determination (R2), and Adeq. Prec. (Table 2) using Design Expert software. The adequacy of the results was analysed using the second-order polynomial equations (Eq. 5 to 13) presented in Table 3. In Eqs. (5)–(13), only significant terms (p < 0.05) were reported. The positive and negative signs showed that the process variables, i.e., microwave power, time, and solid-to-solvent ratio, could increase or decrease the TPC, TFC, and DPPH (%), respectively. A positive sign suggests a positive effect or an increase in the response, whereas a negative sign represents a negative effect or a decline in the response. Equations 5, 8, and 11 indicate that time had a linearly significant (p < 0.01) positive effect on TPC for all solvents. Equations 6, 9, and 12 show that power had a quadratically significant (p < 0.01) positive effect on TFC for ethanol and NADES, whereas it was negative for water. Equations 7, 10, and 13 show that the sample-to-solvent ratio had a quadratically significant (p < 0.01) positive effect on DPPH for water, whereas it was negative for ethanol and NADES. The examined results of the regression analysis of the responses are illustrated in Table 4. The linear, quadratic, and interactive effects of power (watts), time (min), and sample-to-solvent ratio, either positively or negatively on TPC, TFC, and DPPH, are reported in Table 5.
The high-quality relationship between the experimental results and predicted values provided by the software is indicated by the R2 of more than 85%, as recommended22,23. In this research, the R2 values of TPC, TFC, and DPPH (%) for water, ethanol, and NADES solvents were higher than the recommended values (Table 2). The credibility of experimental results depends on the C.V. value. The higher the C.V. value, the lower the credibility of the results, and vice versa (Mehra et al. 2024). In this research, the C.V. value for TPC, TFC, and DPPH (%) for water, ethanol, and NADES solvents ranged between 1.07 to 7.69. The adeq precision, which measures the signal-to-noise ratio, should be greater than 4 and is desirable. From Table 2, it was observed that the adeq precision for all the responses were higher than 4, ranging from 7.57 to 17.60, and thus considered beneficial. Higher F values of the designed model for TPC, TFC, and DPPH (%) corresponding to water, ethanol, and NADES solvents illustrate that the model was highly significant, whereas the LOF values lower than the F-values represent a nonsignificant lack of fit24.
Effect of process parameters on TPC, TFC and DPPH
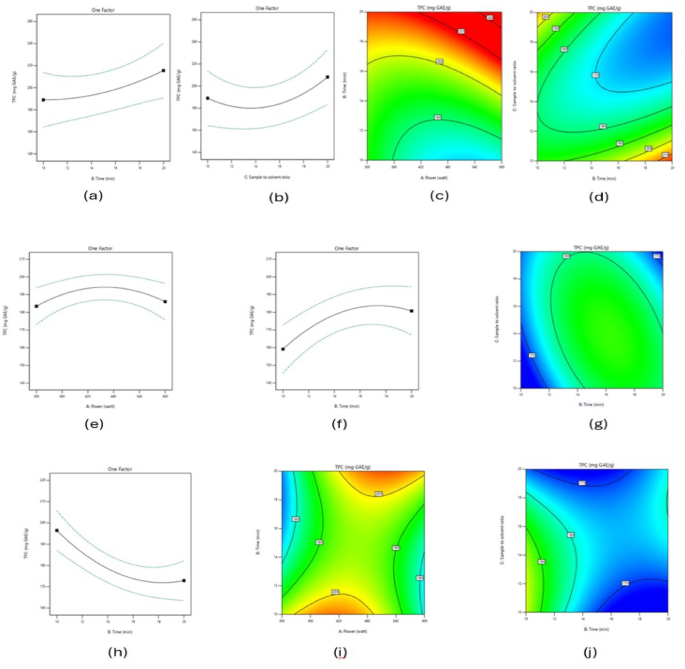
The effect of process parameters, i.e., power, time, and sample-to-solvent ratio on TPC, is presented in Table 4; Fig. 1(a)–(d) for water, (e)-(g) for ethanol, and (h)-(j) for NADES.

The effect of process parameters on TPC (a)–(d) for water, (e)–(g) for ethanol, and (h)–(j) for NADES.
Figure 1(a), (d), and (f) depict that TPC increased as the time increased with water and ethanol, while a reduction was observed with NADES as the time increased (Fig. 1(h), and (j)). From Fig. 1(c), and (e), it was observed that TPC increased in water and ethanolic extracts as the power increased, while in the NADES extract, TPC decreased (Fig. 1 (i)). As the sample-to-solvent ratio increased, TPC increased in water (Fig. 1(b), (d)) and ethanolic extract (Fig. 1(g)), whereas TPC decreased in the NADES extract as the sample-to-solvent ratio increased (Fig. 1(j)).
The increase in TPC with water and ethanol may depend on the following factors: the increase in microwave treatment time, microwave power, and volume of the solvent enhances the breakdown of the cell membrane and increases the extraction of phenolic compounds by improving the interaction between the phenolic compounds and the solvent25,26,27, while the reduction in TPC with NADES could be attributed to the presence of an excessive amount of water molecules surrounding the NADES, which increase the polarity of NADES and create hindrance between NADES and phenolic compounds28, decreasing the TPC content29. Another possibility is the overheating of NADES due to prolonged microwave treatment time and power, which degrades the phenolic compounds26. Our findings are in line with those of Taweekayujan et al.29, who reported a decrease in the TPC content of coffee silverskin extract in deep eutectic solvent. Similar findings were also observed by Vargas-Serna et al.26, who reported a higher amount of TPC (mg eq GA/g DW) in the water extract of pineapple peel compared to ethanolic (96%) extract. This could be attributed to the high polarity of water compared to ethanol due to the high dielectric constant30.
The effect of process parameters, i.e., power, time, and sample-to-solvent ratio, on TFC is presented in Table 4 and Fig. 2(a)-(c) for water, (d)-(f) for ethanol, and (g)-(i) for NADES.

The effect of process parameters on TFC (a)–(c) for water, (d)–(f) for ethanol, and (g)–(i) for NADES.
From Fig. 2(a)-(i), it was reported that TFC content decreased with increased microwave treatment time (Fig. 2 (h)), microwave power (Fig. 2(a), (d), (g), (h), and (i)), and sample-to-solvent ratio (Fig. 2(b), (c), (e), (f), and (i)) for the water, ethanolic, and NADES extracts. The results of our study support previous findings that also report a reduction in TFC with an increase in liquid-to-solid ratio31, increased microwave power31, and increased microwave treatment time32.
The effect of process parameters i.e. power, time, and sample-to-solvent ratio, on DPPH is presented in Table 4; Fig. 3 (a)-(c) for water, (d)-(f) for ethanol, and (g)-(h) for NADES.

The effect of process parameters on DPPH (a)–(c) for water, (d)–(f) for ethanol, and (g), (h) for NADES.
With an increase in microwave treatment time, a reduction in % DPPH was observed, as shown in Fig. 3(c) for the water extract and Fig. 3(g) for NADES extract. As the power increased, an increment in % DPPH for the water extract (Fig. 3(a)) and reduction for the ethanolic extract (Fig. 3(d)) and NADES extract (Fig. 3(f)) was noted. An increment in % DPPH for the water extract (Fig. 3(b)) and ethanolic extract (Fig. 3(e)) was observed, while reduction for NADES extract (Fig. 3 (h)) was noted with an increase in the sample-to-solvent ratio.
Numerical optimization of process parameters and verification of the designed model
Optimization is the process of finding the best feasible solution among a set of possible options to achieve a specific objective. The desirability function is a numerical optimization technique used to select optimal values for process variables and responses. It employs a scale from 0 to 1, where 0 represents undesirable solutions and 1 represents the most desirable solutions33,34. To optimize the process parameters and responses, Design Expert software was utilized. Based on the study’s aim and objective, the constraints reported in Table 4 were fixed. Out of several solutions, only one solution for each process parameter with the corresponding solvent that suits the aim and objective, with higher desirability, i.e., 0.820 for water, 0.751 for ethanol, and 0.808 for NADES, was selected. Table 5 illustrates the predicted/optimized and experimental values of process parameters and responses. Table 5 shows that the experimental values are in reasonable agreement with predicted/optimized values with a small % error. In the present study, verification of the designed model was examined using normal probability plots (Fig. 4). Ideally, all experimental data points for each response should fall precisely on a straight line. However, in reality, deviations from this ideal line occur, representing model error. These deviations, known as residuals, typically exhibit a normal distribution. However, if the residuals do not follow a normal distribution, their cumulative distribution function for a specific population can often be approximated by a straight line12,35. From Fig. 4(a)- (i), it was observed that there is no deliberate failure of the hypothesis that underlines the analysis36.

Normal probability plots of residuals for water (a)–(c); ethanol (d)–(f); NADES (g)–(i).
Comparative analysis of optimized extracts
Microwave-assisted water, ethanolic, and NADES extract of nettle (Urtica dioica) leaves were prepared under optimised conditions:, 300-watt power, 10 min time, and 1:10 sample to the solvent ratio for water; 300-watt power, 17 min time, and 1:10 sample to the solvent ratio for ethanol; and 300-watt power, 10 min time, and 1:13 sample to the solvent ratio for NADES. The following analysis was performed and compared.
Antioxidant potential of optimized extracts
The antioxidant potential of optimized water, ethanolic, and NADES extract of nettle leaves was determined in terms of TPC, TFC, DPPH, ABTS, and FRAP. The maximum TPC content of 209.14 (mg GAE/g) was obtained in the NADES extract, followed by the water extract 202.28 (mg GAE/g), and 189.14 (mg GAE/g) in the ethanolic extract (Fig. 5(a)). Our findings corroborate those of Gupta et al.10, who reported the highest TPC in orange peel extracts obtained using microwave-assisted extraction with NADES as the solvent. From Fig. 5(a), it was observed that TFC was found to be maximum (117.61 mg QE/g) in the ethanolic extract and minimum (75.46 mg QE/g) in the NADES extract. Our results corroborate those of Martinović et al.19, who reported the highest TFC in bilberry leaf extracts prepared in ethanol (50%) compared to water and betaine-urea-based NADES solvent.
DPPH (%IA) is a widely used method for the evaluation of antioxidant properties. It is a simple, quick, and affordable technique that assesses the ability of substances to act as hydrogen donors or free radical scavengers37. The highest and lowest DPPH (%IA), i.e., 96.40% and 89.56% was observed in the NADES and water extract, respectively (Fig. 5(b)). The ABTS assay is considered a highly sensitive method for determining antioxidant activity due to the rapid reaction kinetics exhibited by antioxidants in this system38,39. In this study, the highest ABTS (%) was reported in the NADES extract (89.67%), while the lowest (78.13%) value was observed in the water extract (Fig. 5(b)). Figure 5(c) illustrates the effect of water, ethanol, and NADES on FRAP values. From Fig. 5(c,) it was observed that the NADES extract has a higher FRAP value (190.83 µM AA equivalent) compared to water (155.48 µM AA equivalent) and ethanol (174.90 µM AA equivalent). Several studies have reported similar increasing trends in %IA, ABTS, and FRAP values in NADES-based extract10,40.

Antioxidant potential (a) TPC and TFC, (b) DPPH and ABTS, and (c) FRAP, of water, ethanolic, and NADES extract.
Phenolic acids
Phenolic acids are recognized for their significant contributions to human health, exhibiting antioxidant, anti-inflammatory, antilipidemic, antidiabetic, and antihypertensive properties41,42,43. In this investigation, only two phenolic acids were detected, namely gallic acid and chlorogenic acid. The effect of different solvents on the extraction of phenolic acids is represented in Fig. 6. In their study of the extraction of phenolic compounds from nettle leaves using microwave- and ultrasound-assisted extraction, Ince et al.44 reported that gallic acid and chlorogenic were found as the main phenolic compounds. Grevsen et al.45 reported that chlorogenic acid in nettle leaf ranges from 250 to 1630 mg/100 g DW. In our study, chlorogenic acid was found to be highest (854.621 mg/100 g) in the water extract, followed by the ethanolic extract (833.697 mg/100 g), and 721.094 mg/100 g in the NADES extract. Our results fall within the range reported by Grevsen et al.45. Gallic acid was found to be maximum (90.46 mg/100 g) in the ethanolic extract, followed by the water extract (54.536 mg/100 g), and 37.474 mg/100 g in the NADES extract. In this study, the amount of gallic acid was higher than the 9.76 mg/100 g reported by Elez Garofulić et al.7, while lower than the 112.5 mg/100 g reported by Ince et al.44. The results of our study also conclude that NADES as a solvent became less effective for the extraction of phenolic acids from nettle leaves. This could be due to the polarity and viscosity of the solvents.

Phenolic acid extracted from nettle leaves using different solvents.
Antimicrobial potential of optimized extracts
The antimicrobial potential of optimized water, ethanolic, and NADES extracts was investigated using the agar disc diffusion method against gram-positive (Staphylococcus aureus and Streptococcus pyogenes) and gram-negative (E. coli). Inhibition zones of 8 mm or less were not considered active against pathogenic bacteria46. At 1 mg/mL concentration, the maximum inhibition zone was formed by the NADES extract (22.5 mm) against Streptococcus pyogenes (Fig. 7a). In comparison, the minimum inhibition zone was observed with the water extract (13.5 mm) against Staphylococcus aureus. In contrast, ethanolic extract was able to form an inhibition zone of less than 8 mm. The possible reason could be that at incubation temperature, ethanol (80%) and water may evaporate readily, causing uneven diffusion of bioactive compounds into the agar medium47. In contrast, NADES, having higher viscosity, regulates the diffusion process, as defined by Ivanović et al.47 in their study, which observed a similar pattern. At a concentration of 2 mg/mL, the water extract showed the highest activity, forming the maximum inhibition zone (24 mm) against Staphylococcus aureus, while the minimum zone this time was formed by the NADES extract (16 mm) against Escherichia coli and Streptococcus pyogenes (Fig. 7b). The reason behind NADES showing less activity could be that when the concentration of the extracts is increased, the high concentration of bioactive compounds starts to precipitate, which prevents their diffusion into the agar medium and disables the formation of inhibition zones. This phenomenon is called “precipitation” or “saturation”. This is acceptable because NADES has a higher viscosity than water, which hinders the diffusion of the bioactive compounds, affecting their interaction with cells and resulting in less accurate results, as suggested by Ivanović et al.47. A similar pattern was observed at a concentration of 3 mg/mL, where the water extract showed a higher inhibition zone (23 mm) against Escherichia coli, whereas the NADES extract showed the minimum inhibition zone (19.5) against Staphylococcus aureus and Staphylococcus aureus (Fig. 7c). However, a change was observed at 4 mg/mL concentration, where no inhibition zone was observed with the water extract, while the NADES extract showed an inhibition zone (21 mm) against Staphylococcus aureus (Fig. 7d). The overall antimicrobial property of the NADES extract could be the result of the synergistic effect of the organic acid (lactic acid) and the phenolic compounds such as chlorogenic acid and gallic acid, found in abundance during the study48.

Antimicrobial potential of optimized water, ethanolic, and NADES extracts at (a) 1 mg/mL, (b) 2 mg/mL, (c) 3 mg/mL, and (d) 4 mg/mL concentration.
GC-MS analysis of optimized extracts
The bioactive compounds identified through GC-MS have been reported to possess certain therapeutic properties such as antioxidant, anti-inflammatory, analgesic, antimicrobial, laxative, etc. In the water extrac,t the predominant bioactive compounds identified were hydroquinone, d-allose, and glutamic acid. Hydroquinone, commonly found in plants, possesses strong antimicrobial activity against food-borne pathogens like S. aureus as studied by Ma et al.49. D-allose is a low-calorie, non-toxic sweetener with 80% of sucrose’s sweetness and is considered a potent and appealing alternative to sucrose, additionally having anti-cancer and anti-tumour properties50. Glutamic acid is an amino acid widely known for its anti-inflammatory properties and for preventing risk factors related to hypertension and obesity51. In the ethanolic extract, the compounds found were melezitose, hexadecanamide, and d-glucopyranuronic acid. Melezitose exhibits several properties: it enhances food texture, is used as a stabilizer in medicines, and serves as a hair smoothner52. Hexadecanamide is a fatty acid amide compound used as an emulsifier and thickening agent; in addition, it holds good antioxidant and anti-hypertensive properties53. The NADES extract was found to have galactinol, which contributes to good colour and aroma in products, along with its antioxidant properties54. The obtained chromatogram is represented in Fig. 8(a), (b) and (c) for water, ethanol, and NADES extracts, respectively.

Chromatogram for (a) water extract, (b) ethanolic extract, and (c) NADES extracts.
LC-MS analysis of the optimized extracts
PCA analysis
PCA stands for principal component analysis, which is a technique used to reduce the dimensionality of multivariate data and generate a new set of variables called principal components (PCs). It serves as an unbiased technique to represent significant variance in data using a limited number of components55. The PCA study of the data is presented in Fig. 9, which represents a total of 45 identified peaks in the final PCA model. The information about the identified peaks distributed in three regions of NGW, NGE, and NGN was reduced to two PCs only (PC1 and PC2). The first principal component (PC1) was able to account for 63.46% of the major variance of the data. Furthermore, PC2 explained about 22.4% variation of the remaining variation in the peaks. Therefore, both PCs collectively cover 85.86% of the total information in the data set studied. This is quite a good amount of information, which is capable of classifying the three regions categorically. Based on the obtained PC scores, the samples NGW and NGE lay in the same quadrant, whereas NGN was located in the other quadrant.

PCA of metabolites detected in optimised extracts (NGW, NGE and NGN) of nettle grass.
Heat map and dendrogram
In this study, a total of 46 compounds were identified, mainly in the form of flavonoids, namely luteolin 6-C-glucoside, kaempferol-3-O-rutinoside, biochanin A, genistein, wogonoside, naringenin, puerarin, and chlorflavonin, with higher abundance in NGW and NGE, followed by NGN. A heat map of all the identified compounds was constructed and is presented as Fig. 10. Phenolic acids like caffeic acid and feruloylquinic acids were also found in abundance in NGW and NGE, while polyphenols such as salvianolic acid D, gallocatechin, and monogalloyl glucose were mainly detected in NGN. Evodiamine was the major amine detected in all three extracts, while amides such as acanthamide D, protopanaxatriol, and epiisorosmanol were mainly found in NGW and NGE extracts only. Essential vitamins responsible for various physiological functions, such as retinoic acid and folic acid, along with fatty acids like oleic acid, were detected in NGW only. Furthermore, to support the findings of the study, a dendrogram (hierarchical cluster analysis) was created based on the similarity of compounds found in NGW, NGE, and NGN, as represented in Fig. 11.

Heat map of metabolites identified in water (NGW), ethanolic (NGE), and NADES (NGN) extracts.

Dendrogram of metabolites present in NGW, NGE and NGN.
Conclusion
In the conducted study, nettle leaves emerged as a highly promising natural source for obtaining valuable compounds due to their rich phenolic and antioxidant profile. Their maximum utilization will not only improve the value of plant-based resources but also foster sustainable and innovative approaches in the fields of food and health. Among the assessed solvents during the RSM-BBD-based extraction and optimization process, the NADES-based extract demonstrated the utmost significance and efficiency. It achieved the maximum values for TPC and DPPH along with good antimicrobial activity. Gallic acid and chlorogenic acid, identified through U-HPLC, were the predominant acids present, along with bioactive compounds like galactinol, and polyphenols like salvianolic acid D, gallocatechin, and monogalloyl glucose identified through GC-MS and LC-MS analyses, respectively, providing synergistic properties such as antioxidant, antimicrobial, and anti-inflammatory effects. This indicates the potential of NADES to be a promising solvent for future applications in the food, health, and pharmaceutical industries.