Introduction
Antimicrobial resistance (AMR) is a global threat that can result in millions of deaths if preventive measures are not implemented. The global prevalence of deaths associated with bacterial AMR rose to 4.71 million in 2021, and a progressive upsurge is projected to reach up to 8.22 million deaths due to AMR in 20501.
Bacterial aggregation and biofilm formation is seen as one of the key concerns in addressing AMR2. Aggregated lifestyle of bacteria ensures the survival of the innermost bacteria in this multicellular matrix even in hostile environments, while simultaneously providing a fruitful ground for horizontal gene transfer3. Once unfavourable conditions subside, bacteria could separate from the aggregate matrix and successfully colonise new surfaces3. This phenomenon is known to be fueled by constant antibiotic exposure and the presence of contaminants as aggregation platforms4,5.
Altogether, these figures underscore a critical need for the exploration of novel techniques to monitor and study bacterial aggregation and AMR evolution. As the burden of AMR is considered the greatest in low-income and middle-income countries, cost-efficient and innovative techniques pleasing a variety of surveillance strategies of AMR are in high demand6.
The most common methods for bacterial aggregation studies are sedimentation assays or flow cytometry7,8. However, these methods have the major limitation to be time-consuming or expensive9. Water-in-oil droplets, acting as nanoscale bioreactors, exhibit great potential at increasing the precision of microbiological experiments10. Furthermore, the method is much faster and enables identifying bacterial growth within 3 − 4 h as opposed to 16 − 20 h required by the traditional culturing methods11.
Recent advancements have employed droplets for a wide range of microbiological assays and experiments. The most promising use of droplets is for antibiotic susceptibility testing, which would enable rapid evaluation of bacterial responses to antimicrobials12. Droplet platforms are also advantageous in enzyme activity screening, metabolic profiling and microbial interaction studies, where confined microenvironment allows for precise reaction conditions and bacterial behaviour observation13. Lastly, the platform exhibits great potential to isolate and cultivate rare or slow-growing bacteria, that thrive only in delicately configured environmental conditions13.
Two main methods of creating water-in-oil droplets are recognised, and each approach comes with trade-offs in ease of use, reproducibility, and analysis. Using monodisperse droplets for biological experiments offers high reproducibility between experiments and precise control over droplet size and volume, leading to easier detection and analysis workflows14,15,16. However, producing them requires advanced laboratory equipment and the purchase of a commercially available microfluidic droplet system may introduce financial and training-related challenges for the user interested in the technology17.
As another option, droplets could be generated in a polydisperse distribution through a simple vortex of immiscible and aqueous liquids17. A significant drawback of polydisperse droplets is seen most in lack of precise volume control leading to batch-to-batch variability, higher surfactant consumption, and more complex software algorithms to accurately detect and analyse droplets15,16,18 . Despite abovementioned limitations, polydisperse droplets provide the same throughput and droplet stability over time compared to monodisperse droplets, making it a great, highly accessible alternative to monodisperse droplet systems17.
Droplet experiments have been coupled with many diverse modalities of droplet detection and analysis, optical detection being the most common approach. Depending on experiment nature, one could analyse droplets using microscopy imaging, Raman spectroscopy, and many more19. Regarding aggregation, imaging provides direct insight in the dynamics of such bacterial behaviour. Furthermore, imaging equipment is commonly available in laboratories, making droplet analysis highly accessible for anyone.
Due to high-throughput nature of droplet-based techniques, visual inspection of images is laborious and therefore, not a viable option for droplet image analysis. So far, automated image analysis often relies on high proficiency in programming skills using Python, MATLAB, and other advanced tools20. These proficiencies may fall outside the typical training of many biomedical professionals, preventing their widespread adoption in droplet analysis.
Alternatively, commercially available sophisticated software for image analysis may aid in this issue. However, the use of these more sophisticated image analysis tools is often hindered by high cost, leaving researchers little options to set up a droplet analysis workflow without significant financial investment.
Lastly, a variety of script-free open-source software have been developed to assess different biological structures, such as CellProfiler™, ImageJ, ilastik, QuPath, and many more. The uniform morphology of droplets makes it easy to adapt such software for droplet detection and consecutive droplet content analysis. Previously, Sanka et al. (2021) studied the suitability of such software for droplet detection and found high accuracy, precision and wide applicability of CellProfiler™ for various droplet experiments compared to other similar software20.
Although such script-free open-source software demand little in terms of finances, training and technical setup, the lack of readily available workflows with thorough documentation tailored specifically for droplet analysis remains a significant obstacle in mainstream adoption of droplet technologies.
Therefore, a clear need to bridge the gap between advanced bioinformatics and droplet image analysis for broader user base comes sharply into focus. In this paper we propose a solution to this need by using water-in-oil droplets in combination with user-friendly image analysis tools to assess the aggregation patterns of bacteria in high-throughput. The applicability of the method is demonstrated by easy-to-use image analysis pipelines established using a free, open-source software CellProfiler™ to quantify bacterial aggregation in response to suboptimal concentrations of antibiotics, microplastic beads or metals in both mono- and polydisperse droplets. The pipelines presented in this paper are accompanied with thorough guidelines including troubleshooting instructions for easy adaption of the method. Lastly, we seek to encourage the discussion and the development of more user-friendly and transparent analytical tools for droplet research.
Results and discussion
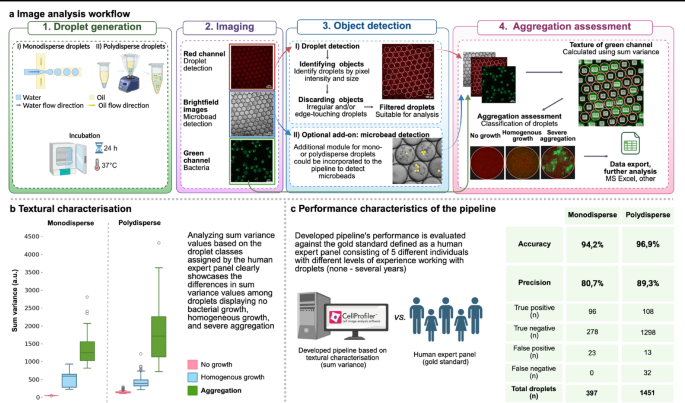
An image analysis pipeline utilizing textural characterisation within CellProfiler™ was specifically designed to identify and aid classifying droplets based on bacterial state (‘no growth’, homogenous growth’, ‘aggregation’) detected inside droplet (Fig. 1a). Texture is a feature describing the variability and spatial arrangement of pixel intensities across an image or an object. In single-cell state of life, bacteria are evenly distributed in droplets, resulting in little difference between pixel intensities across droplet. In aggregation, pixel intensities vary greatly in droplets—pixels in areas emptied due to bacterial migration or death show low or no signal, while aggregated regions exhibit strong intensity in proximity.

Droplet generation and image analysis workflow utilising textural properties in CellProfiler™ showcases a fit tool for bacterial aggregation evaluation in droplets. (a) Protocol overview of the bacterial aggregation assessment using CellProfiler™. Droplets of mono- or polydisperse nature can be used to analyse bacterial aggregation. Generation of droplets is followed by further incubation to encourage bacterial growth and study the phenomenon under investigation. Droplets are visualised via microscopy, where three types of images are acquired—brightfield, red, and green channel. Droplets are detected using the red channel of the images, microbeads via brightfield images and textural characterisation is performed in the green channel. All data gathered during the analysis is exported as a .csv file and could be analysed using any spreadsheet software. (b) Higher values of textural characteristic—sum variance—measurements reveal severely aggregated droplets. Shown data is applicable to experiments performed with sub-optimal concentrations of cefotaxime in mono- and polydisperse droplets. Boxplots display the minimum, first quartile, median, third quartile and maximum values of sum variance in the classification group. Outliers above interquartile range of 1.5 are shown as circles. (c) Developed pipeline can assess aggregation severity with great accuracy and precision in both mono- and polydisperse droplet data. Shown data is applicable to experiments performed with sub-optimal concentrations of cefotaxime and kanamycin in monodisperse- and cefotaxime, chloramphenicol, ciprofloxacin, doxycycline and trimethoprim in polydisperse droplets. To assess aggregation detection performance, droplets containing aggregative bacteria were interpreted ‘positive’, whereas droplets with homogenous growth and no growth were considered ‘negative’. Figure created with biorender.com.
Computationally, texture characterisation starts with constructing a grey-level co-occurrence matrix (GLCM) to assess how often two pixels in a predefined distance and direction with specific values appear on an image. GLCM alone is not a descriptor of texture and estimating texture must be presented in a single representative value to determine one measurement for an image or an object. For this, Haralick21 famously proposed 14 definitions. Out of these, sum variance of texture proved to be the most suitable for aggregation analysis in droplets as shown in Supplementary material 6.
Currently, the textural values of each droplet in our pipelines are classified using a strict threshold as demonstrated in Supplementary material 6. Only providing the most basic functionality of a strict threshold to classify data into bins is seen as a major limitation of Cellprofiler™. For more advanced classification demands, users can use a sister-software CellProfiler Analyst incorporating machine learning methods, or alternatively, employ other specialised software or programming languages with the necessary advanced capabilities. The principles and protocol for implementing the pipeline is outlined in Supplementary material 4.
In some droplets, bacteria failed to form traditionally seen large clusters and instead exhibited fine, pinpoint-like aggregation patterns. Because these micro-aggregates were very small and difficult to distinguish from homogenous droplets based on texture alone, they were classified together with the homogenous group. This limitation highlights a potential improvement area where adaptive classification approaches, such as k-means clustering, could help determine whether a droplet’s texture more closely resembles aggregation or homogenous growth.
Furthermore, CellProfiler™ is equipped to detect and exclude extraneous objects during the analysis of the objects under interest. The main analysis of target objects remains unaffected while simultaneously providing valuable information on the presence of additional objects to the user. This translates to the capability of assessing the presence of additional objects (e.g. microplastic) inside the droplets that can affect the aggregation patterns of bacteria. An easy setup of the pipeline for microplastic beads alongside bacteria in droplets is assisted with a Supplementary material 5.
In general, empirical experimentation in our laboratory has shown universality and effectiveness of our pipeline. In our experience, texture characterisation a) does not rely on defining thresholds to determine the boundaries of objects under interest (aggregates) inside droplets and b) textural properties are independent of the experiment’s nature or conditions.
The method proves to be computationally efficient due to eliminating the need for additional modules within the pipeline to perform multiple measurements. Solely analysing texture and classifying droplets to their respective categories using 10 16-bit monodisperse droplet image sets (30 images total) with a resolution of 2048 × 2048 pixels with 8 workers running takes 55 s.
Additional object detection (such as microplastics) doubles the duration of the same analysis, resulting in a processing time of exactly 2 min. This results mainly from a module calculating the illumination function to correct uneven lighting on the images, which can be prominent in brightfield images and can alter the detection of microplastics on an image. In case illumination correction is not needed, textural characterisation of abovementioned droplet dataset with additional object detection inside droplets is reduced to 1 min and 16 s of processing time.
Calculating the texture of droplets via sum variance correlates well with aggregation in droplets as demonstrated in Fig. 1b. Figure 1c demonstrates the accuracy of our pipeline to assess the severity of aggregation up to 94.2% (ranging from 93.5% to 94.8%) and precision of 80.7% (ranging from 78.2 to 82.8%) in monodisperse droplets. Similar performance could be achieved in polydisperse droplets with an accuracy of 96.9% (range = 94.0 − 98.6%) and precision of 89.3% (range = 65 − 100%).
Users must be aware that the polydisperse data may be more unpredictable—additional assessments may be valuable to determine an appropriate texture scale for analysing larger droplets in the polydisperse dataset. In datasets with high droplet size variability, larger droplets often contain larger bacterial aggregates. When a small texture scale—set according to the smallest droplets—is applied to these larger droplets, the resulting sum variance values may be underestimated. This occurs because many neighbouring pixels within large aggregates have similar intensities. Therefore, when analysing highly polydisperse datasets, users should adjust the texture scale to reflect the typical droplet size or minimize droplet size variability by filtering out droplets that are significantly smaller or larger than average.
As proof-of-concept, we quantified bacterial aggregation in different experimental scenarios as demonstrated in Fig. 2a. The software was tested with droplets infused with Escherichia coli, antibiotics in varying concentrations and additionally, metals or microplastic beads. Further data analysis of these testing results revealed significant variations in aggregation patterns.

Texture-based aggregation assessment is applicable in various experimental setups. (a) The aggregation pipeline described in the current paper was applied to various datasets using E. coli. (b) Monodisperse droplets harbouring bacteria were infused with suboptimal concentrations of antibiotics and in an additional experiment, with microplastic beads. Microplastic beads are seen to significantly decrease aggregation where cefotaxime (CTX) concentration is 0.018 μg/mL (p < 0.001), but increase aggregation at 0.024 μg/mL (p = 0.026). In experiments conducted with kanamycin (KAN) with a concentration of 0.388 μg/mL, aggregation is decreased in the presence of microplastics (p < 0.001). c In polydisperse droplets, a significant increase in aggregation compared to droplets without any antibiotics is seen in some concentrations of ciprofloxacin (CPFX at a concentration of 0.012 μg/mL, p < 0.001), doxycycline (DOXY at a concentration of 4.505 μg/mL, 6.007 μg/mL, 8.009 μg/mL and 10.679 μg/mL, p < 0.001) and trimethoprim (TMP at a concentration of 0.006 μg/mL, p = 0.016; 0.012 μg/mL, p = 0.008 and 0.023 μg/mL, 0.047 μg/mL, 0.094 μg/mL, 0.188 μg/mL, p < 0.001). d In polydisperse droplets using parallel experiments of cefotaxime-infused droplets with and without microplastic beads, CTX at concentrations of 0.008 μg/mL, 0.01 μg/mL, 0.013 μg/mL, 0.018 μg/mL and 0.032 μg/mL decrease aggregation significantly (p < 0.001). Similarly to experiments conducted with monodisperse droplets shown on Fig. 2b, microplastic beads appear to have an antagonistic effect on the bacterial natural defence mechanisms against antibiotics, resulting in increased sensitivity to antibiotics. e Droplets containing E. coli and metal solutions demonstrated a significant decrease in aggregation. In experiments conducted with CuSO4, a reduced presence of aggregates was shown in concentrations of 1.9 mM and 2.3 mM with p values of 0.002 and < 0.001, respectively. A similar effect was observed with experiments using LiCl and ZnCl2, where aggregation and overall viability is effectively reduced in response to increasing levels of LiCl and ZnCl2 (•—p < 0.001). Figure created with biorender.com.
First, antibiotic exposure modulates the aggregation of bacteria depending on the antibiotic type (Fig. 2c). The most pronounced levels of increased aggregation are observed in the nucleic acid synthesis targeting antibiotics CPFX and TMP. The cause of the phenomenon is likely the release of small amounts of extracellular DNA into the bacterial environment, which is well known for its aggregative characteristics22
A contrasting observation regarding protein targeting antibiotics was observed, where CHL did not exhibit aggregation inducing effect whereas DOXY did so significantly. This difference may be related to where the antibiotics bind to the ribosome – CHL is known to bind to the 50S A site, whereas DOXY affects the 30S subunit. In literature, other antibiotics targeting 30S subunit are known to boost bacterial aggregation up to 100-fold23. The insignificant results of CHL align well with previous experiments, where biofilm formation capacity was significantly downregulated in exposure to CHL24.
Although antibiotics targeting the cell wall synthesis, such as CTX, are well known for their aggregative qualities4,22, our experiment did not witness a significant increase in aggregation. The mechanism driving this response has yet to be identified.
Strikingly, our data is indicating that the presence of microplastics in the bacterial environment could have a negative effect on the bacterial aggregation. A significant reduction in aggregation rates and increased sensitivity to CTX was shown in both mono- and polydisperse droplet experiments (Fig. 2b, d). The effect is speculated to be linked to oxidative stress-inducing properties of microplastics, which could enhance antibiotic effect on bacterial cells25,26,27. Our preliminary findings highlight the need for more systematic studies on bacterial aggregation dynamics in the presence of microplastics, given that many studies also report microplastics as an aggregation platform and a promotor26,28.
Our experiments revealed a significant influence of metals on bacterial aggregation patterns. As shown on Fig. 2e, introduction of metals to bacterial environment rapidly decreases the aggregation levels as well as the viability of bacteria. Although CuSO4, LiCl and ZnCl2 salts are known for their innovative antimicrobial applications prospects in biotechnology29,30,31, they are also known to enhance antimicrobial resistance gene transfer32,33. Not all is known in terms of physiological response of bacteria to these substances and droplet technologies may prove valuable to further determine the cellular and molecular responses occuring within smaller subpopulations.
There are some limitations to our study. First, insufficient droplet aeration may influence aggregation patterns as a clear relationship between imbalanced gas concentrations and increased aggregation is known. Although this effect could ideally be evaluated by comparing the droplet-based method with a more conventional approach assessing bacterial aggregation, the absence of standardised methods and protocols prevents such comparison.
To overcome this limitation, each experiment included a reference droplet dataset that contained no antimicrobials or pollutants. This served as a baseline for comparison. As the potential impact of poor aeration would be consistent across all experimental conditions, including those with varying antibiotic concentrations or pollutants, it is unlikely to bias our findings.
Furthermore, antibiotic leakage is a known challenge in water-in-oil droplet systems. The likelihood of diffusing into neighbouring droplets increases with smaller and more hydrophobic antibiotic molecules34. Leakage is both concentration- and distance-dependent, meaning that higher antibiotic concentrations and droplets in close proximity can increase cross-talk between droplets34. In polydisperse datasets, numerous small droplets occupying the gaps between larger ones may further facilitate diffusion, suggesting that some degree of leakage could have occurred under these conditions. However, the phenomenon is expected to extend across all experiments and therefore does not invalidate our data and our results highlight bacterial aggregation patterns in the presence of suboptimal antibiotic concentrations, microbeads, and metal pollutants. In future work, the use of thermosetting oils could be explored, as forming a cured oil matrix around droplets may help prevent leakage and cross-talk between them35,36.
Conclusion
Texture based image analysis pipeline was established in a user-friendly and open-source software CellProfiler™.The method is considered a fit tool to unveil bacterial aggregation mechanisms in response to different environmental factors, such as suboptimal antibiotic concentrations and microplastic bead presence. The solution addresses the unmet need for efficient analysis of aggregated bacteria within microfluidic droplets in bulk, paving the way to improve or develop novel antimicrobial strategies.
Providing high-throughput methods for droplet image analysis bridge the gap in bioinformatics expertise among laboratory professionals, enabling the advancement of novel antimicrobial strategies and evaluating their efficacy. User-friendly approach of the method promotes the automation of image analysis in droplet microfluidics, making it nearly an instantaneous process while ensuring reproducible and quantitative results. While the current study design used bacterial aggregates as an object of interest inside droplets, texture characterisation could be applicable in various other experiments, such as cellular (platelets, tumor cell clusters) or protein aggregation experiments. Moreover, the calculation of droplet content texture values in general are easily applicable in other software (e.g. ImageJ/Fiji) or programming languages (e.g. MATLAB®, Python). This ensures that the method is accessible and easy to employ regardless of the preferred tool used for image analysis.
It is recommended that further research be undertaken regarding experimentation with different tools, particularly script-based tools. This may aid in establishing a greater degree of understanding of droplet analysis in microbiology and other fields, perhaps leading to the development of advanced tools dedicated to droplet image analysis. Additionally, it would be beneficial to develop an image analysis pipeline to determine the size and shape of aggregates, which would provide further valuable insight on bacterial aggregation patterns and -behaviour influenced by various contaminants in their environment.
Methods
Microbiology
E. coli strain JEK 1036, is a wild-type E. coli W3310 strain labelled with green fluorescent protein37. To prepare E. coli for the study, one colony of E. coli grown on Luria–Bertani (L-B) agar (BioMaxima, Poland) was dissolved in 5 mL of L-B broth (BioMaxima, Poland) and incubated overnight at 37° C. After incubation, the optical density of the culture was measured. The culture was diluted with the mixture of fluorophore Alexa Fluor™ 647 (Invitrogen, Thermo Fisher Scientific Inc., USA) dye, antibiotics or metal solutions, and L-B broth (BioMaxima, Poland) to achieve 5.9 × 10⁵—2 × 10⁶ CFU/mL. As a result, bacterial density value of yielding roughly 50:50 ratio of positive and negative droplets.
The antibiotic concentrations were chosen based on the MIC curves of a 96-well plate method shown in Supplementary material 6. The MIC curves for metal solution concentrations were determined based on previously reported levels of heavy metal contamination in environmental hotspots, to best reflect real-world conditions of metal pollution and the co-selection of antimicrobial resistance mechanisms38,39,40,41. The selection of microbeads content was aimed to produce at around 1–3 microbeads per droplet.
Droplet generation
To generate monodisperse droplets sized 120 nL, a PDMS microfluidic chip was prepared and connected with appropriate sizes of PTFE tubing as described by Bartkova et al.6. To generate polydisperse droplets sized between 20 and 200 nL, test tubes containing oil, Alexa Fluor™ 647 and bacterial suspension were vortexed using Vortex-Genie® 2 (Scientific Industries, USA) for 5 s. Novec HFE 7500 fluorocarbon oil with 2% concentration of perfluoropolyether (PFPE)—poly(ethylene glycol) (PEG)—PFPE triblock surfactant was used for both mono- and polydisperse droplets.
Imaging setup
For imaging, Countess™ (Invitrogen, Thermo Fisher Scientific Inc., USA) cell counting chamber slides were prepared with droplets. Approximately 18–20 µL of droplets with oil were pipetted into one chamber of the slide to fill the chamber. Images of droplets were captured using the LSM 900 Laser Scanning Microscope (Zeiss, Germany) equipped with ZEN 3.3 (blue edition) software with following settings: Plan-Apochromat 10x/0.45 objective, diode lasers 488 and 640 nm, DIC light, pinhole size 460 µm. In experiments using monodisperse droplets and polydisperse droplet experiments with solely antibiotics, 8-bit images were acquired. Polydisperse droplet experiments with microplastics and -metals were imaged in 16-bit format. All images were acquired at a resolution of 2048 × 2048 pixels and exported as TIFF files.
Software and data analysis
All acquired images were analysed using CellProfiler™ software version 4.2.6 developed in Python environment (Broad Institute, Inc., USA)42. All experiments were carried out on MacBook Air (M1, 2020) with a macOS Monterey system version 12.0.1 (Apple Inc., USA). Data analysis was performed using Excel (Microsoft Inc., USA). For statistical testing, χ2-test was employed with a significance level set at a p value of < 0.05.
Figure assembly
Composite figures were compiled using Biorender (Biorender.com).
Data availability
All data generated or analysed during this project are included in this published article and its supplementary information files.
References
-
A. R. Collaborators. Articles Global burden of bacterial antimicrobial resistance 1990–2021: A systematic analysis with forecasts to 2050. https://doi.org/10.1016/S0140-6736(24)01867-1 (2021).
-
Stevenson, E. M., Buckling, A., Cole, M., Lindeque, P. K. & Murray, A. K. Selection for antimicrobial resistance in the plastisphere, Sci. Total Environ. 908, 168234. https://doi.org/10.1016/j.scitotenv.2023.168234 (2023).
-
Sauer, K. et al. The biofilm life cycle: expanding the conceptual model of biofilm formation. Nat. Rev. Microbiol. https://doi.org/10.1038/s41579-022-00767-0 (2022).
-
Tavaddod, S., Dawson, A. & Allen, R. J. Bacterial aggregation triggered by low-level antibiotic-mediated lysis, Biofilms Microbiomes 10, 90. https://doi.org/10.1038/s41522-024-00553-1(2024).
-
Pham, D. N., Clark, L. & Li, M. Microplastics as hubs enriching antibiotic-resistant bacteria and pathogens in municipal activated sludge. J. Hazard. Mater. Lett. https://doi.org/10.1016/j.hazl.2021.100014 (2021).
-
Lewnard, J. A. et al. Burden of bacterial antimicrobial resistance in low-income and middle-income countries avertible by existing interventions: an evidence review and modelling analysis. Lancet 403 (10442), 2439–2454. https://doi.org/10.1016/S0140-6736(24)00862-6 (2024).
-
Kragh, K. N., Tolker-Nielsen, T. & Lichtenberg, M. The non-attached biofilm aggregate. Commun. Biol. 6(1), 1–13. https://doi.org/10.1038/s42003-023-05281-4 (2023).
-
Konieczny, M., Rhein, P., Czaczyk, K., Białas, W. & Juzwa, W. Imaging flow cytometry to study biofilm-associated microbial aggregates. Molecules https://doi.org/10.3390/molecules26237096 (2021).
-
Crivello, G., Fracchia, L., Ciardelli, G., Boffito, M. & Mattu, C. In vitro models of bacterial biofilms: innovative tools to improve Understanding and treatment of infections. Nanomaterials https://doi.org/10.3390/nano13050904 (2023).
-
Ruszczak, A., Bartkova, S., Zapotoczna, M., Scheler, O. & Garstecki, P. Droplet-based methods for tackling antimicrobial resistance. Curr. Opin. Biotechnol. https://doi.org/10.1016/j.copbio.2022.102755 (2022).
-
Scheler, O. et al. Optimized droplet digital CFU assay (ddCFU) provides precise quantification of bacteria over a dynamic range of 6logs and beyond. Lab Chip 17(11), 980–1987. https://doi.org/10.1039/c7lc00206h (2017).
-
Postek, W. & Garstecki, P. Droplet microfluidics for high-throughput analysis of antibiotic susceptibility in bacterial cells and populations. Acc. Chem. Res. https://doi.org/10.1021/acs.accounts.1c00729 (2022).
-
Nauwynck, W., Faust, K. & Boon, N. Droplet microfluidics for single-cell studies: A frontier in ecological Understanding of microbiomes. FEMS Microbiol. Rev. 49. https://doi.org/10.1093/femsre/fuaf032 (2025).
-
Chen, Z., Lv, Z., Zhang, Z., Zhang, Y. & Cui, W. Biomaterials for microfluidic technology. Mater. Futures 1(1). https://doi.org/10.1088/2752-5724/ac39ff (2022).
-
Park, Y. et al. Monodisperse micro-oil droplets stabilized by polymerizable phospholipid coatings as potential drug carriers. Langmuir 31 (36), 9762–9770. https://doi.org/10.1021/acs.langmuir.5b02747 (2015).
-
Sanka, I. et al. User-friendly analysis of droplet array images. Anal. Chim. Acta. https://doi.org/10.1016/j.aca.2023.341397 (2023).
-
Byrnes, S. A., Phillips, E. A., Huynh, T., Weigl, B. H. & Nichols, K. P. Polydisperse emulsion digital assay to enhance time to detection and extend dynamic range in bacterial cultures enabled by a statistical framework. Analyst 143 (12), 2828–2836. https://doi.org/10.1039/c8an00029h (2018).
-
Amirifar, L. et al. Droplet-based microfluidics in biomedical applications. Biofabrication 14(2). https://doi.org/10.1088/1758-5090/ac39a9 (2021).
-
Zhou, P., He, H., Ma, H., Wang, S. & Hu, S. A review of optical imaging technologies for microfluidics. Micromachines https://doi.org/10.3390/mi13020274 (2022).
-
Sanka, I., Bartkova, S., Pata, P., Smolander, O. P. & Scheler, O. Investigation of different free image analysis software for high-throughput droplet detection. ACS Omega. 6 (35), 22625–22634. https://doi.org/10.1021/acsomega.1c02664 (2021).
-
Haralick, R. M., Dinstein, I. & Shanmugam, K. Textural features for image classification. IEEE Trans. Syst. Man. Cybern.. SMC-3(6), 610–621. https://doi.org/10.1109/TSMC.1973.4309314 (1973).
-
Yu, W., Hallinen, K. M. & Wood, K. B. Interplay between antibiotic efficacy and drug-induced Lysis underlies enhanced biofilm formation at subinhibitory drug concentrations. Antimicrob. Agents Chemother. 62(1). https://doi.org/10.1128/AAC.01603-17 (2018).
-
Haaber, J., Cohn, M. T., Frees, D., Andersen, T. J. & Ingmer, H. Planktonic aggregates of Staphylococcus aureus protect against common antibiotics. PLoS ONE. 7 (7), 1–12. https://doi.org/10.1371/journal.pone.0041075 (2012).
-
Zhang, M. et al. Effect of sublethal dose of chloramphenicol on biofilm formation and virulence in Vibrio parahaemolyticus. Front. Microbiol. 14, 1–18 (2023). https://doi.org/10.3389/fmicb.2023.1275441
-
Wang, R., Li, X., Li, J., Dai, W. & Luan, Y. Bacterial interactions with nanoplastics and the environmental effects they cause. Fermentation https://doi.org/10.3390/fermentation9110939 (2023).
-
Yi, X. et al. Effect of polystyrene microplastics of different sizes to Escherichia coli and Bacillus cereus. Bull. Environ Contam. Toxicol. https://doi.org/10.1007/s00128-021-03215-6 (2021).
-
Feng, L. J. et al. Aged microplastics enhance their interaction with Ciprofloxacin and joint toxicity on Escherichia coli. Ecotoxicol. Environ. Saf. https://doi.org/10.1016/j.ecoenv.2022.114218 (2022).
-
Gong, X. et al. Effect of different size microplastic particles on the construction of algal-bacterial biofilms and microbial communities. J. Environ. Manage. https://doi.org/10.1016/j.jenvman.2023.118246 (2023).
-
Ma, X., Zhou, S., Xu, X. & Du, Q. Copper-containing nanoparticles: mechanism of antimicrobial effect and application in dentistry-a narrative review. Front. Surg. https://doi.org/10.3389/fsurg.2022.905892 (2022).
-
Chen, Y. et al. Zinc-based metal organic framework with antibacterial and anti-inflammatory properties for promoting wound healing. Regenerative Biomaterials. https://doi.org/10.1093/rb/rbac019 (2022).
-
Tsao, N. et al. Protection against Klebsiella pneumoniae using lithium chloride in an intragastric infection model. Antimicrob. Agents Chemother. https://doi.org/10.1128/AAC.04261-14 (2015).
-
Zhang, Y. et al. Sub-inhibitory concentrations of heavy metals facilitate the horizontal transfer of plasmid-mediated antibiotic resistance genes in water environment. Environ. Pollut. https://doi.org/10.1016/j.envpol.2018.01.032 (2018).
-
Li, J. et al. Lithium enhanced plasmid-mediated conjugative transfer of antimicrobial resistance genes in Escherichia coli: different concentrations and mechanisms. Aquat. Toxicol. 279, 107263. https://doi.org/10.1016/j.aquatox.2025.107263 (2025).
-
Ruszczak, A., Jankowski, P., Vasantham, S. K., Scheler, O. & Garstecki, P. Physicochemical properties predict retention of antibiotics in Water-in-Oil droplets. Anal. Chem. https://doi.org/10.1021/acs.analchem.2c04644 (2023).
-
Wu, W., Zhang, S., Zhang, T. & Mu, Y. Immobilized droplet arrays in thermosetting oil for dynamic proteolytic assays of single cells. ACS Appl. Mater. Interfaces. 13 (5), 6081–6090. https://doi.org/10.1021/acsami.0c21696 (2021).
-
Wu, W. et al. A thermosetting oil for Droplet-based real-time monitoring of digital PCR and cell culture. Adv. Funct. Mater. 28 (39), 1–11. https://doi.org/10.1002/adfm.201803559 (2018).
-
Keymer, J. E., Galajda, P., Lambert, G., Liao, D. & Austin, R. H. Computation of mutual fitness by competing bacteria. Proc. Natl. Acad. Sci. U.S.A. 105 (51), 20269–20273. https://doi.org/10.1073/pnas.0810792105 (2008).
-
Seiler, C. & Berendonk, T. U. Heavy metal driven co-selection of antibiotic resistance in soil and water bodies impacted by agriculture and aquaculture. Front. Microbiol. https://doi.org/10.3389/fmicb.2012.00399 (2012).
-
Wales, A. D. & Davies, R. H. Co-selection of resistance to antibiotics, biocides and heavy metals, and its relevance to foodborne pathogens. Antibiotics https://doi.org/10.3390/antibiotics4040567 (2015).
-
Pal, A., Bhattacharjee, S., Saha, J., Sarkar, M. & Mandal, P. Bacterial survival strategies and responses under heavy metal stress: a comprehensive overview. Crit. Rev. Microbiol. https://doi.org/10.1080/1040841X.2021.1970512 (2022).
-
Mahmudiono, T. et al. The concentration of lithium in water resources: A systematic review, meta-analysis and health risk assessment. Rev. Environ. Health. https://doi.org/10.1515/reveh-2023-0025 (2023).
-
Lamprecht, M. R., Sabatini, D. M. & Carpenter, A. E. CellProfiler™: Free, versatile software for automated biological image analysis. BioTechniques 42 (1), 71–75. https://doi.org/10.2144/000112257 (2007).
Acknowledgements
We would like to thank Prof. Piotr Garstecki (ICHF, PAN, Poland) for providing us with microfluidic chip schematics and surfactant for droplet emulsion.
Ethics declarations
Competing interests
The authors declare no competing interests.
Additional information
Publisher’s note
Springer Nature remains neutral with regard to jurisdictional claims in published maps and institutional affiliations.
Supplementary Information
Rights and permissions
Open Access This article is licensed under a Creative Commons Attribution-NonCommercial-NoDerivatives 4.0 International License, which permits any non-commercial use, sharing, distribution and reproduction in any medium or format, as long as you give appropriate credit to the original author(s) and the source, provide a link to the Creative Commons licence, and indicate if you modified the licensed material. You do not have permission under this licence to share adapted material derived from this article or parts of it. The images or other third party material in this article are included in the article’s Creative Commons licence, unless indicated otherwise in a credit line to the material. If material is not included in the article’s Creative Commons licence and your intended use is not permitted by statutory regulation or exceeds the permitted use, you will need to obtain permission directly from the copyright holder. To view a copy of this licence, visit http://creativecommons.org/licenses/by-nc-nd/4.0/.
About this article

Cite this article
Saar-Abroi, M., Lindpere, K., Kácsor, D. et al. High-throughput bacterial aggregation analysis in droplets. Sci Rep 15, 42980 (2025). https://doi.org/10.1038/s41598-025-27034-5
-
Received:
-
Accepted:
-
Published:
-
Version of record:
-
DOI: https://doi.org/10.1038/s41598-025-27034-5