Introduction
Extracellular vesicles (EVs) are lipid membrane-bound vesicles secreted by cells, facilitating the transfer of non-secreting components, including proteins, RNAs, lipids, and other cellular materials, to recipient cells1,2. EVs are primarily categorized into two types: endosome-derived EVs (exosomes) and plasma membrane protrusion-derived EVs (ectosomes)3,4,5. Endosome-derived EVs originate from intraluminal vesicles within multivesicular endosomes6,7,8, which are secreted upon endosomal fusion with the plasma membrane9. In contrast, protrusion-derived EVs are formed through the budding and scission of plasma membrane protrusions5,10,11.
The classification of EVs based on their biogenesis does not always align with their isolation methods. Current EV separation techniques, such as differential centrifugation and affinity purification, do not fully distinguish between these two subtypes4. EVs are typically classified as small EV fractions (s-EVs) and large EV fractions (l-EVs) based on their sedimentation properties, despite substantial size and content overlaps. However, l-EVs are generally enriched in protrusion-derived EVs, whereas s-EVs tend to consist of endosome-derived EVs4.
Given the natural ability of EVs to transfer intracellular components, they have been explored as alternative delivery systems for therapeutic proteins, potentially replacing viral vectors and synthetic carriers12,13,14. However, most EV engineering efforts have focused on EVs in the s-EV fraction, with the assumption that the EVs are largely derived from endosomes. Despite extensive modifications, the efficiency of functional protein delivery via EVs in the s-EV fractions remains suboptimal compared to other modalities, including virus-mediated approaches. To enhance delivery efficiency, viral fusogenic proteins have been introduced into EVs in the s-EV fractions13,15,16, but this diminishes their advantage as a virus-free alternative. In contrast, the potential of protrusion-derived EVs for protein delivery remains largely unexplored.
EVs are present in all biological fluids, including serum, a crucial component of cell culture media that provides essential yet incompletely characterized factors17,18. Serum contains various bioactive molecules, including growth factors and EVs, which promote cell migration, a process critical for angiogenesis and metastasis19,20. Notably, even in the absence of growth factor signaling, serum induces cell migration, suggesting the presence of unidentified stimulatory factors21,22. EVs in serum have been implicated in this process17,23,24, yet their molecular mechanisms remain unclear.
Microinjection of intracellular signaling proteins, such as the Rho family small GTPase Rac1, has been shown to promote cell migration25. Direct microinjection of Rac1 induces membrane ruffling and lamellipodia formation, facilitating migration26,27. Interestingly, Rac1 has been detected in serum-derived EVs28,29, but its functional role in EV-induced migration has not been investigated.
EV uptake primarily occurs via endocytosis, leading to their trafficking into endosomes30,31. The Bin-Amphiphysin-Rvs (BAR) domain superfamily proteins play a pivotal role in plasma membrane deformation during endocytosis32,33,34,35,36. Following plasma membrane invagination, these structures are cleaved off into the cytoplasm in cooperation with dynamin37,38. In contrast, inverse BAR (I-BAR) domain-containing proteins, including MIM, collaborate with small GTPases to regulate protrusion formation39. Notably, we previously identified that MIM-dependent protrusion-derived EVs contain Rac111,40. However, direct evidence that EV-incorporated proteins such as Rac1 are delivered to the cytosol of recipient cells has not been available.
In this study, we investigate the uptake and functional impact of Rac1-containing EVs derived from cellular protrusions in serum. Our study provides direct evidence that MIM-dependent protrusion-derived EVs contain Rac1 that is released from endosomes to the cytoplasm to induce the migration of recipient cells. Furthermore, the engineered MIM-dependent protrusion-derived EVs demonstrate their ability to efficiently transfer the genome-editing protein Cas12f to recipient cells. Unlike endosome-derived EVs, protrusion-derived EVs achieve high delivery efficiency without requiring viral fusogenic proteins, highlighting their potential as a next-generation biomolecular delivery platform.
Results
Requirement of EV endocytosis for serum-induced cell migration
Endocytosis is mediated, at least in part, by Cdc42-interacting protein 4 (CIP4), an F-BAR domain-containing protein41,42,43. Interestingly, CIP4 is implicated in the migration of various cancer cells, including pancreatic cancer cells44,45,46,47,48, suggesting its potential role in mediating EV internalization to facilitate cell migration.
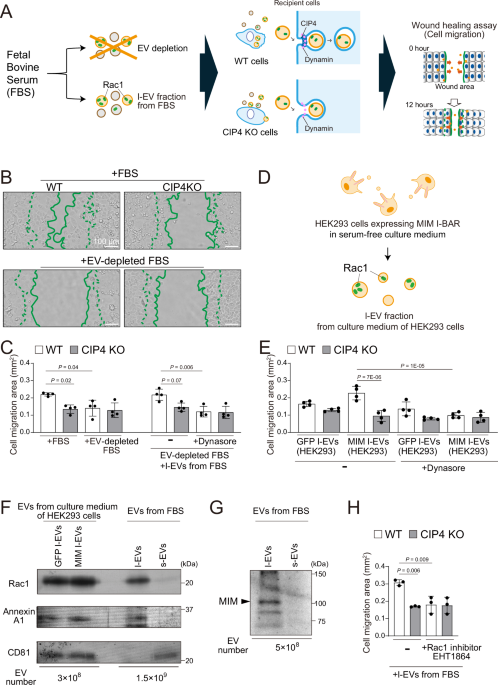
In conventional cell culture methods, fetal bovine serum (FBS) is heat-inactivated at 56 °C for 30 min to inactivate the complement system, followed by freezing for storage. This processed FBS remains effective in promoting cell migration. Pancreatic cancer PANC-1 cells exhibit serum-dependent migration49. To investigate the role of serum EVs in cell migration, we depleted EVs from heat-inactivated serum via ultracentrifugation and examined their effects on PANC-1 wild-type (WT) cells and CIP4-knockout (KO) cells (Fig. 1A and Supplementary Fig. 1).

A Schematic representation of the role of EVs in the FBS on cell migration. FBS was heat-inactivated as a conventional treatment for cell culture, and EVs in it were depleted by ultracentrifugation. Cell migration was measured by the wound healing assay. B Cell migration during the wound healing of WT or CIP4 KO PANC-1 cells in the presence of FBS (Top) or EV-depleted FBS (Bottom). Cell edges at 0 h (dotted lines) and 12 h (solid lines) are shown. Scale bars, 100 μm. C Cell migration in the presence of FBS, EV-depleted FBS, or EV-depleted FBS supplemented with l-EV fraction from FBS (4 × 10⁶ cells were treated with 6 × 10⁸ EVs/ml in 1 ml). Dynamin inhibitor dynasore was applied at 40 μM. Cell migration areas are the wounded areas occupied by migrated cells after 12 h. Data show the means ± SD from 4 independent experiments. D Illustration of Rac1-containing EVs from HEK293 cell culture medium. E Cell migration in the presence of l-EV fraction from MIM I-BAR-expressing HEK293 cells (4 × 10⁶ cells were treated with 1.4 × 10⁹ EVs/ml in 1 ml). Dynasore was applied at 40 μM. Data show the means ± SD from 4 independent experiments. F Western blotting of Rac1 in the l-EV fractions of GFP or MIM I-BAR-expressing HEK293 cells and EV fractions from FBS. The number of EVs per lane was indicated. Representative blots from three technical replicates using the same lot of FBS are shown. G Western blotting of MIM in the EV fractions from FBS. A representative blot from the three technical replicates using the same lot of FBS is shown. H Cell migration under the l-EV fraction from FBS treated with the Rac1 inhibitor EHT1864 at 20 μM. 4 × 10⁶ cells were treated with 6 × 10⁸ EVs/ml in 1 ml. Data show the means ± SD from 3 independent experiments. Statistical significance was performed by one-way ANOVA with Tukey’s honestly significant difference (HSD) test. Source data are provided as a Source data file.
In a wound healing assay, CIP4 KO cells exhibited slower migration than WT cells in the medium containing original serum with EVs (Fig. 1B and Supplementary Fig. 2A). Interestingly, when cultured in EV-depleted serum, WT cells displayed reduced migration, reaching levels comparable to CIP4 KO cells (Fig. 1B and Supplementary Video 1). These findings indicate that serum-derived EVs contribute to cell migration in a CIP4-dependent manner.
To clarify the specific role of serum EVs in cell migration, we supplemented EVs isolated from FBS into the wound healing assay. EV fractions were obtained through stepwise centrifugation, separating them into large EVs (l-EVs) and small EVs (s-EVs) based on size. Nanoparticle tracking analysis (NTA) of EV size distribution revealed the removal of EVs by the ultracentrifugation (Supplementary Fig. 2B) and that the predominant population of serum EVs in the l-EV fraction had a diameter of approximately 140 nm, whereas that in the s-EV fraction was approximately 100 nm (Supplementary Fig. 2C). Additionally, the number of particles in the l-EV fraction was lower than in the s-EV fraction (Supplementary Fig. 2D).
Next, we evaluated the effects of these EV fractions on migration under EV-depleted conditions. Supplementation with the l-EV fraction significantly enhanced the migration of WT cells compared to CIP4 KO cells (Fig. 1C and Supplementary Video 2). In contrast, supplementation with the s-EV fraction resulted in similar migration levels in WT and CIP4 KO cells (Supplementary Fig. 2E).
To further determine whether EV-induced migration is endocytosis-dependent, cells were pretreated with the dynamin inhibitor dynasore. Dynasore significantly reduced the migration of WT cells induced by l-EVs but had no effect on CIP4 KO cells (Fig. 1C and Supplementary Video 2). These results suggest that serum-derived l-EV fraction facilitates cell migration through an endocytosis-dependent mechanism.
Induction of cell migration by MIM-dependent EV endocytosis
We previously reported that the l-EV fraction from HEK293 cells contains Rac1 and promotes the migration of recipient cells in a MIM-dependent manner40, although the underlying mechanisms remain unclear. We collected the l-EV fraction from HEK293 cells expressing the MIM I-BAR domain and applied these EVs to WT and CIP4 KO cells as described above (Fig. 1D). WT cells exhibited increased migration in response to the l-EV fraction from MIM I-BAR-expressing cells compared to CIP4 KO cells (Fig. 1E and Supplementary Video 3). Furthermore, dynasore treatment reduced WT cell migration in the presence of this l-EV fraction but had no effect on CIP4 KO cells (Fig. 1E). These findings indicate that the MIM-I-BAR-dependent l-EV fraction promotes cell migration via an endocytosis-dependent mechanism, similar to the serum-derived l-EV fraction.
Function of Rac1 in protrusion-derived EVs for cell migration
To elucidate the role of Rac1 in EVs, we compared the Rac1 content in serum-derived EV fractions with that in HEK293-derived EV fractions. Rac1 was detected in the l-EV fraction from HEK293 expressing either GFP or GFP-MIM (Fig. 1F). Cell migration was significantly promoted by the l-EV fraction from GFP-MIM-expressing cells than that from GFP-expressing cells (Fig. 1E), indicating that these MIM-dependent l-EVs, rather than general l-EVs, have the ability to transfer Rac1 to promote cell migration. Interestingly, Rac1 was also detected in the l-EV fraction from FBS, as the l-EV fraction from HEK293 cells expressing the MIM I-BAR domain, but was absent in the s-EV fraction from FBS (Fig. 1F and Supplementary Fig. 2F). Therefore, the inability of the s-EV fraction was presumably due to the absence of Rac1 in the fraction; however, the residual EVs after ultracentrifugation clearance could possibly mask the effect of the EVs in the s-EV fraction. Furthermore, MIM was also present in the l-EV fraction from FBS (Fig. 1G), suggesting that MIM-associated l-EVs in serum may contain Rac1.
To determine whether Rac1 within EVs contributes to cell migration, we modulated its activity using a Rac inhibitor or Rac1 mutants. First, the l-EV fraction from FBS was treated with the Rac inhibitor EHT1864. After removing EHT1864 by washing, the effect of the inhibitor-treated l-EV fraction on cell migration was assessed. Interestingly, unlike the untreated l-EV fraction, the EHT1864-treated l-EV fraction from FBS did not promote migration in either WT or CIP4 KO cells (Fig. 1H and Supplementary Video 4). The amino acid sequence of Rac1 from Bos taurus was identical to that of Homo sapiens (Supplementary Fig. 2G), supporting that Rac1 in the l-EV fraction from bovine serum had activity for promoting cell migration as human Rac1.
Next, to examine the functional impact of Rac1 mutants within EVs, we co-expressed constitutively active Rac1 G12V or dominant-negative Rac1 T17N along with the MIM I-BAR domain in HEK293 cells to encapsulate these mutants in l-EVs. Rac1 mutants localized to MIM I-BAR-induced filopodia (Supplementary Fig. 3A) and did not affect the size distribution, EV number, or Rac1 content in the l-EV fraction (Supplementary Fig. 3B–D). However, WT cells exposed to Rac1 T17N-containing l-EV fraction exhibited slower migration compared to those treated with Rac1- or Rac1 G12V-containing EVs in the l-EV fraction (Supplementary Fig. 3E and Supplementary Video 5).
Furthermore, the addition of purified Rac1 protein alone did not enhance WT cell migration relative to CIP4 KO cells (Supplementary Fig. 3F and Supplementary Video 6). These findings suggest that Rac1 enclosed within serum-derived or HEK293-derived l-EV fraction plays a role in promoting cell migration.
Uptake of MIM-dependent EVs at CIP4-localized sites
To investigate the mechanism by which Rac1 in EVs exerts its effects in recipient cells, we visualized the localization of Rac1 within EVs during intracellular trafficking from endocytosis to endosomes (Fig. 2A). The l-EV fraction was prepared from HEK293 cells expressing GFP-tagged MIM I-BAR domain (GFP-MIM I-BAR), resulting in the inherent labeling of EVs. Recipient PANC-1 cells stably expressed mCherry-tagged CIP4 (mCherry-CIP4) under a CIP4 KO background (Supplementary Fig. 1). GFP-MIM I-BAR-labeled EVs in the l-EV fraction added to PANC-1 cells expressing mCherry-CIP4 were examined using confocal microscopy. EVs monitored by GFP-MIM I-BAR were transiently co-localized with mCherry-CIP4 at the plasma membrane before gradually disappearing, suggesting that they undergo endocytosis (Supplementary Fig. 4 and Supplementary video 7).

A Schematic illustration of EV endocytosis, endosomal transport, and cargo release. B 3D-PALM/STORM live cell imaging of the CIP4-mEos4b (magenta)-expressing CIP4 KO PANC-1 cells with l-EV fraction having SF650T-Halo-MIM I-BAR (green). Images were recorded every 10 s. Scale bar, 500 nm. C Colocalization of CIP4-mEos4b with SF650T-Halo-MIM I-BAR in (B). The percentages of voxels co-localized in each frame were calculated (“RAW”). Co-localization of the CIP4 images with the 180°-rotated SF650T-Halo-MIM images is shown as “Randomized”. The 13 super-resolution images from independently seeded 5 cells, which resulted in 4, 1, 4, 2, and 2 images, respectively, were analyzed. D Colocalization of EVs from the l-EV fractions having both Halo-Rac1 and mCherry-MIM I-BAR with EEA1 (Top) or Lamp1 (Bottom) in WT cells after 3 h of incubation, in which 106 cells were treated with 1.6 × 10⁹ EV/ml in 1 ml. Arrowheads in the enlarged images show their colocalization. Scale bars, 10 μm. E Quantification of the colocalization of Halo-Rac1 with EEA1 (Top) or Lamp1 (Bottom) in WT and CIP4 KO cells using Mander’s coefficients after EV addition. The EV fraction and the number of cells and EVs were the same as (D). The red lines indicate the means of 54 cells from 3 independent experiments. F PALM imaging of the l-EVs having SF650B-Halo-Rac1 in the late endosome, having Lamp1-mEos4b (Left). Enlargements of the square regions in the left images are on the Right. Arrowheads indicate possible release of SF650B-Halo-Rac1 from the endosome. Scale bars, 10 μm (Left) and 100 nm (Right). G Quantification of the Halo-Rac1 release from the endosome in (F). The percentage of EVs with crossover of Halo-Rac1 and Lamp1 in a cell is shown (17 cells from 3 independent experiments). All EVs with Lamp1-positive endosomes were counted. The full range of images with the marking of the counting of the EVs is shown in Supplementary Fig. 6B. The percentage of Halo-Rac1-releasing EVs was calculated as the percentage of “Halo-Rac1-releasing EVs” among the Halo-Rac1 EVs in the Lamp1-positive endosomes (endosome-colocalizing EVs). The means ± SD are shown. Statistical significance was determined by a two-tailed unpaired Mann–Whitney U test (C, E) or a two-tailed t-test with Welch’s correction (G). Source data are provided as a Source data file.
To further analyze the spatial relationship between EVs and CIP4, we performed three-dimensional single-molecule localization microscopy (3D-SMLM)50. CIP4 was labeled with the photoswitchable fluorescent protein mEos4b and was stably expressed in CIP4 KO cells (Supplementary Fig. 1). The l-EVs were labeled through the expression of Halo-tagged MIM I-BAR (Halo-MIM I-BAR) in HEK293 cells, ensuring endogenous incorporation of the label into EVs. One hour after EV addition, CIP4 was observed in close proximity to EVs at the nanoscale level (Fig. 2B and Supplementary Video 8). The number of CIP4-mEos4b molecules in the vicinity of EVs (Halo-MIM I-BAR) was significantly higher than that of randomized control spots (Fig. 2C). Interestingly, CIP4-mEos4b molecules exhibited asymmetric localization around EV particles, a characteristic reminiscent of clathrin-dependent endocytosis42.
Endosomal transport of EV-derived Rac1 for cytosolic release
Endocytosed vesicles are transported to endosomes following their internalization from the plasma membrane. To investigate the fate of internalized EVs, we examined the localization of EVs from the l-EVs derived from Halo-Rac1- and mCherry-MIM I-BAR-co-expressing cells at different time points after EV addition (Supplementary Fig. 5A). These l-EVs were incorporated into WT recipient cells within 3 h, whereas their incorporation was reduced in CIP4 KO cells (Supplementary Fig. 5B-D).
Immunostaining of the recipient cells revealed that l-EVs labeled with Halo-Rac1 and mCherry-MIM I-BAR colocalized with EEA1 and Lamp1, markers of early and late endosomes, respectively (Fig. 2D). The co-localization of Halo-Rac1 with EEA1 or Lamp1 progressively increased over time after EV addition in WT cells, but this increase was attenuated in CIP4 KO cells (Fig. 2E). Internalized EVs redistributed from the cell periphery to the perinuclear region over time, corresponding to the localization patterns of early and late endosomes, respectively (Supplementary Fig. 5E). Together, these findings suggest that Rac1-containing l-EVs are initially transported to early endosomes and subsequently trafficked to late endosomes in recipient cells.
Colocalization of Rac1 with Lamp1 became apparent 3 h after EV addition, coinciding with the onset of EV-induced cell migration (Supplementary Fig. 5F). These findings suggest that Rac1 is released from late endosomes into the cytosol, where it enhances cell migration. To further investigate Rac1 localization within late endosomes, we performed super-resolution microscopy using recipient cells expressing mEos4b-tagged Lamp1 incubated with Halo-Rac1-labeled EVs (Fig. 2F, G and Supplementary Fig. 6). The mEos4b-tagged Lamp1 was localized to the membrane of the endosome. If the Halo-Rac1 was kept in the EVs in the endosomes, then the Halo-Rac1 signals were thought to be in the Lamp1 signal clusters, where the Halo-Rac1 signals “overlap” within the cluster of Lamp1-mEos4b. On the other hand, the Halo-Rac1 signals at the rim of the cluster of Lamp1-mEos4b indicated that Halo-Rac1 was on the membrane of endosomes, which could be considered that Rac1 “crossover” the endosomal membrane, about to be released from the endosome via fusion between EV and endosome membranes (Fig. 2F, arrowheads). Some of the EV-derived Halo-Rac1 signals colocalized at Lamp1-positive late endosomes, with distinct crossover signals indicative of Rac1 release into the cytoplasm. These findings suggest that EV-derived Rac1 was released and escaped from late endosomes.
To examine the role of endosomal function in Rac1 release, we treated cells with bafilomycin, an H+-ATPase inhibitor that raises endosomal pH. Bafilomycin treatment increased the number of Halo-Rac1 signals per EV retained within the endosome (Supplementary Fig. 6C) and reduced Rac1 crossover events (Fig. 2F, G). Halo-Rac1 signals diffused in the cytosol after release from the endosome were also decreased by bafilomycin treatment (Supplementary Fig. 7). Indeed, EV-derived Halo-Rac1 was detected at the leading edge of migrating cells in the wound healing assay (Fig. 3A and Supplementary Fig. 8A), where the lamellipodia were detected by the lamellipodia-forming protein WAVE2. Importantly, leading-edge localization of the released Rac1 from endosomal EVs was decreased by bafilomycin treatment (Fig. 3B, C). Additionally, both bafilomycin treatment and CIP4 KO led to a reduction in cytosolic Halo-Rac1 levels and impaired cell migration (Supplementary Fig. 8B, C and Supplementary Video 9). These findings suggest that Rac1 enclosed within endocytosed EVs is released from late endosomes to facilitate cell migration.

A Lamellipodia formation by the l-EV fraction from the cells expressing MIM. The WT or CIP4 KO PANC-1 cells were incubated with l-EV fraction from Halo-MIM I-BAR- or Halo-single expressing cells, in which 106 PANC-1 cells were treated with 1.4 × 10⁷ EVs/ml in 1 ml for 3 h. After fixation, cells were stained for WAVE2 to visualize lamellipodia (arrowheads). Scale bars, 40 μm. Representative images from three independent experiments are shown. B PANC-1 cells incubated with l-EV fraction from mCherry-MIM I-BAR and Halo-Rac1 expressing cells, in which 2.5 × 10⁶ PANC-1 cells were treated with 0.1% DMSO or 100 nM Bafilomycin for 30 min and then with 2 × 10⁹ EVs in 0.5 ml of EV-depleted medium for 12 h. After fixation, cells were stained for HaloTag, mCherry, and F-actin. Arrowheads show Halo-Rac1 localization at the leading edge. Scale bars, 10 μm. C Quantification of cells with Halo-Rac1 localization at leading edges after incubating with the EVs for 12 h. Data show the means ± SD from 3 independent experiments, in which 7–10 microscopic fields were analyzed per experiment. Statistical significance was determined by a two-tailed unpaired t-test with Welch’s correction. Source data are provided as a Source data file.
Stoichiometry of EV-derived Rac1 in cell migration induction
The increase in cell migration induced by the l-EV fraction from FBS was comparable to that observed with EVs from the culture medium of HEK293 cells. Notably, the extent of migration enhancement by these EVs was similar to that induced by native FBS-containing EVs, indicating that EVs were responsible for the observed increase in cell migration (Supplementary Fig. 9A). Therefore, determining the amount of Rac1 delivered from EVs to recipient cells is crucial.
To quantify the internalized Rac1, we treated WT and CIP4 KO PANC-1 cells with the l-EV fraction derived from Halo-Rac1- and MIM I-BAR-co-expressing cells. After trypsinization to remove surface-bound EVs, recipient cells were collected, and the internalized Halo-Rac1 was quantified by western blotting. The amount of internalized Halo-Rac1 increased dramatically in a time-dependent manner in WT cells but remained unchanged in CIP4 KO cells (Fig. 4A).

A Western blotting of the WT or CIP4 KO PANC-1 cells (106 cells) treated with l-EV fraction from MIM I-BAR- and Halo-Rac1-co-expressing cells (8 × 10⁸ EVs/ml in 1 ml) for the indicated times to quantify the internalized Halo-Rac1 to endogenous Rac1. Each lane contains l-EV fraction from MIM I-BAR- and Halo-Rac1-co-expressing cells (5 × 10⁶ EVs for the blotting with anti-Halo or anti-β-actin antibodies, and 5 × 10⁷ EVs for the blotting with anti-Rac1 antibody), and the cell lysates from EV-treated cells (2 × 10⁵ cells) per lane. B Western blotting of purified Rac1 (25 ng) and l-EV fraction from Halo-Rac1- and MIM-co-expressing cells (5 × 10⁷ EVs) on the same membrane as (A) to determine the amount of Halo-Rac1 and endogenous Rac1 in EVs. C Halo-Rac1 molecules internalized per cell calculated from (A, B). Data show the means ± SD from 3 independent experiments. D The amount of the recipient cell-derived endogenous Rac1 molecules per cell from the western blotting of (A). Data show the means ± SD from 3 independent experiments. E Ratio of the internalized Halo-Rac1 to cellular endogenous Rac1 calculated from (C, D). Data show the means ± SD from 3 independent experiments. F Illustration of sandwich ELISA for Halo-Rac1. G Halo-Rac1 molecules internalized per cell were quantified by ELISA. PANC-1 cells incubated with l-EV fraction expressing MIM I-BAR and Halo-Rac1 for 1 and 3 h were measured, in which 6 × 10⁶ cells were treated with 1.5 × 10⁹ EVs/ml in 6 ml EV-depleted FBS-containing medium. The means ± SD are shown from 4 independent experiments. H The comparison of microinjected cells with the EV-treated cells. PANC-1 cells were microinjected with Halo-tagged Rac1 (300 μg/ml) or treated with Halo-tagged Rac1-containing EVs from MIM and Rac1 expressing cells at 4 × 10⁹ EVs/ml, 0.5 ml medium, and at 1 × 10⁵ or 1 × 10⁶ cells, respectively. After incubation for 30 min or 12 h, respectively, cells were fixed and stained with an anti-Halo antibody. Rhodamine-labeled dextran was co-injected to identify the injected cells. The injection amount, as monitored by Rhodamine fluorescence, was correlated with Halo protein amount. Actin filaments were visualized by phalloidin staining. Scale bars, 10 μm. Representative images from three independent experiments are shown. I Summary of the Rac1 molecule transfer via EVs. Statistical significance was determined by one-way ANOVA with Tukey’s HSD. Source data are provided as a Source data file.
Using purified Rac1 protein as a reference (Fig. 4B), we determined the number of Halo-Rac1 molecules delivered via l-EVs (Fig. 4C) as well as the quantity of endogenous Rac1 in recipient cells using western blotting (Fig. 4D). After 3 h of EV incubation, the number of Halo-Rac1 molecules incorporated into a single WT recipient cell was 6.2 ± 0.8 × 10⁴ (Fig. 4C), whereas the number of endogenous Rac1 molecules in the same cell was 1.2 ± 0.3 × 10⁷ (Fig. 4D). Thus, the ratio of incorporated Halo-Rac1 to endogenous Rac1 after 3 h was 0.53 ± 0.14% (Fig. 4E, summarized in Fig. 4I).
To further validate these measurements, we performed a sandwich ELISA using anti-HaloTag and anti-Rac1 antibodies with purified Halo-Rac1 protein as a standard (Fig. 4F and Supplementary Fig. 9B). After 3 h of EV incubation, the number of incorporated Halo-Rac1 molecules per recipient cell, as measured by ELISA, was 5.5 ± 3.0 × 10⁴ (Fig. 4G), confirming the quantification obtained by western blotting.
Additionally, non-tagged Rac1 from donor cells was packaged into EVs at an amount comparable to that of Halo-Rac1 (Fig. 4B), with an estimated 4.8 ± 3.6 × 10⁴ molecules per recipient cell (Fig. 4I). Taken together, the total number of exogenous Rac1 molecules delivered via EVs, including both Halo-Rac1 and non-tagged Rac1, was 1.1 ± 0.9 × 10⁵ per recipient cell (Fig. 4I). Consequently, the ratio of EV-derived Rac1 (Halo-Rac1 and non-tagged Rac1) to endogenous Rac1 in recipient cells was approximately 1% (Fig. 4I).
The total amount of internalized Rac1 from EVs included both cytosol-released Rac1 and endosome-retained Rac1, and it is thought that only cytosol-released Rac1 induced cell migration. We estimated the number of cytosol-released Rac1 from EVs to induce cell migration. In Supplementary Fig. 7B, the number of released Halo-Rac1 signals of DMSO-treated cells was 4.9 ± 3.2 × 10³ per cell, whereas that of bafilomycin-treated cells was 2.2 ± 1.4 × 10³ per cell. By comparing the fluorescence intensity of SF650T Halo ligand with that of SF650T-treated Halo-Rac1 in cells, we determined the labeling efficiency of Halo-Rac1 under our experimental conditions to be 24.3 ± 5.3% (Supplementary Fig. 9C). Therefore, the number of released Halo-Rac1 molecules was 2.0 ± 1.4 × 10⁴ per DMSO-treated cell. The total number of internalized Halo-Rac1 molecules per cell was 6.2 ± 0.8 × 10⁴ (Fig. 4C), suggesting that 32 ± 23% of the internalized EV-derived-Rac1 were released to the cytosol under the assumption of the observation rate of the Halo tag to be 100% (Supplementary Fig. 9D).
Furthermore, we microinjected Halo-Rac1 that was purified from E. coli and the microinjected cells were stained with anti-Halo antibody, together with the cells treated with the EVs from the cells expressing Halo-Rac1 and MIM. The injection marker, Rhodamine-dextran, was proportional to the amount of injected Halo-Rac1. Then, a similar intensity of Halo stain was observed, indicating that the delivery can be in an equivalent amount (Fig. 4H).
The number of Rac1 molecules per EV
The number of Rac1 molecules in l-EVs from FBS and those from the serum-free culture medium of HEK293 cells expressing Halo-Rac1 and MIM were quantified, as summarized in Fig. 4I and Supplementary Fig. 9D. EV concentrations were comparable between FBS and the culture medium of HEK293 cells (Supplementary Figs. 2C and 3C). The average number of Rac1 molecules per EV was also similar, with 5.2 ± 1.4 × 10² molecules per l-EV from FBS (Supplementary Fig. 2F) and 4.5 ± 1.7 × 10³ molecules per l-EV from HEK293 medium (Supplementary Fig. 3D). Among the Rac1 molecules within an EV from HEK293 cells, Halo-Rac1 accounted for 2.5 ± 1.7 × 10³ molecules per EV.
The number of internalized Halo-Rac1 molecules per cell was determined to be 6.2 ± 0.8 × 10⁴ by western blotting (Fig. 4C). Given this, we estimated that approximately 24.6 ± 16.5 EVs, corresponding to 3.1 ± 2.1% of the total added EVs, were internalized per cell.
Next, we quantified the proportion of EVs in the l-EV fractions containing Halo-Rac1 via microscopic observation (Supplementary Fig. 10A). Halo-Rac1-positive l-EVs were defined as those with fluorescence signals exceeding 2.5 standard deviations above the baseline fluorescence of the EVs from cells without Halo-Rac1 expression (cutoff lines in Supplementary Fig. 10B). The l-EVs co-expressing MIM and Halo-Rac1 comprised approximately 9.0% of all observable EVs in fluorescence microscopy (Supplementary Fig. 10B). However, PKH26 is known to form aggregates51, and therefore, the EV number detected by PKH26 could be higher than the actual number of EVs. The average number of Halo-Rac1 molecules per EV, as determined by western blotting, was approximately 2.5 × 10³ molecules (Supplementary Fig. 3D, summarized in Supplementary Fig. 9D). Considering this proportion, we estimated that an individual EV contained approximately 2.5 × 10³/0.090 = 2.8 × 10⁴ Halo-Rac1 molecules.
To further determine the number of Halo-Rac1 molecules per EV, we directly quantified fluorescence intensity. As a reference, we used SF650T Halo ligand solution, where fluorescence intensity increased linearly with Halo ligand concentration (Supplementary Fig. 10C). Using the correlation between Halo-Rac1 fluorescence intensity and Halo-Rac1 concentration (Supplementary Fig. 10D, Left), along with the relationship between fluorescence intensity and diameter of detected particle in Halo-Rac1/GFP-MIM double-positive EVs (Supplementary Fig. 10D, Right), we calculated the average number of SF650T-labeled Halo-Rac1 molecules per EV to be approximately 5.5 × 10³ molecules. Based on the labeling efficiency, we estimated that the actual number of Halo-Rac1 molecules per EV was approximately 2.3 × 10⁴ molecules (Supplementary Fig. 10E, F).
Engineering of protrusion-derived EVs for protein delivery
To demonstrate the direct transfer of proteins via MIM-dependent EVs, we packaged the genome-editing enzyme Cas12f52 into MIM-dependent EVs using rapamycin-induced binding between FKBP and FRB53 (Fig. 5A). Following co-expression of MIM I-BAR-FKBP, Cas12f-Halo-FRB, and guide RNA in HEK293 cells, rapamycin treatment recruited Cas12f to cellular protrusions (Supplementary Fig. 11A and Supplementary Video 10) and increased its presence in the l-EV fraction (Fig. 5B) without altering EV production (Supplementary Fig. 11B).

A Schematic illustration of Cas12f loading into EVs and genome editing. Cas12f-Halo-FRB binds to FKBP-MIM in the presence of rapamycin and is loaded to the MIM-dependent EVs. The reporter cassette contains mCherry and two kinds of frame-shifted GFP, expressing GFP after the cutting of the target sequence by Cas12f and the addition/deletion of nucleotides during repair. B Western blotting of HEK293 cell lysates and their l-EV fractions from mCherry-FKBP-MIM I-BAR- and Cas12f-Halo-FRB-co-expressing cells, with or without rapamycin treatment. Lysates of the same number of cells (6 × 10³ cells) and EVs (7 × 10⁹ EVs) were analyzed. Representative blots from three independent experiments are shown. C–F Genome-editing of reporter cells by Cas12f-carrying EVs. Cas12f-reporter cells (2.5 × 10⁴ cells), including HEK293 (C, D) and PANC-1 (E, F), were treated with l-EV fraction (1.5 × 10¹⁰ EVs/ml in 0.2 ml). After 3 days, GFP-positive cells were counted under a fluorescence microscope (C and E, Left: representative images; Right: quantification from 3 independent experiments) or by flow cytometry (FCM, D and F, D from 6 independent experiments and F from 4 independent experiments). The bars in the graphs show the addition of EVs treated with (gray) or without (light gray) rapamycin or no EV addition (white). The l-EV fraction from cells expressing Cas12f and MIM 5KA was also examined (E). G–I Effect of heating or freezing on the genome editing efficiency of l-EVs. l-EV fractions (1.5 × 10¹⁰ EVs/ml in 0.2 ml) were heated or frozen as indicated and incubated with the reporter HEK293 cells (G, H) or PANC-1 cells (I) for genome editing as in (C–F). GFP-positive cells were counted by fluorescence images (G from 6 independent experiments, I from 3 independent experiments) or by FCM (H from 5 independent experiments). The bars in the graphs show the addition of EVs treated with (gray) or without (light gray) rapamycin or no EV addition (white). Data show the means ± SD. Statistical significance was performed by one-way ANOVA with Tukey’s HSD test (C, E–I) or Kruskal–Wallis test with Dunn’s multiple comparisons test (D). Source data are provided as a Source data file.
Next, we established reporter cells containing a frame-shifted GFP coding sequence to detect errors introduced by genome editing enzymes, including Cas12f. In this system, GFP translation is restored upon nucleotide insertion or deletion following Cas12f-mediated cleavage at the target sequence located between mCherry and GFP (Fig. 5A). Reporter cells derived from HEK293 or PANC-1 cells were treated with l-EVs containing Cas12f, and fluorescence was monitored by microscopic imaging and flow cytometry. The number of GFP-positive reporter cells increased proportionally to the amount of delivered Cas12f from MIM-dependent l-EVs via rapamycin treatment, which induces the MIM-Cas12f binding (Fig. 5C–F and Supplementary Fig. 12).
Similarly, GFP-positive cells were observed after Cas12f-carrying EVs were added to reporter cells derived from HeLa cells (Supplementary Fig. 13A) and gingival cancer Ca9-22 cells (Supplementary Fig. 13B), indicating the robustness of EV-mediated Cas12f delivery. However, the frequency of GFP-positive cells varied among reporter cell lines, with the highest efficiency observed in HEK293 cells, suggesting that EV uptake may be cell-type dependent.
To assess whether Cas12f delivery via EVs requires MIM, we attenuated protrusion formation by introducing a five-lysine-to-alanine (5KA) mutation in the MIM I-BAR domain54, which was previously shown to impair EV generation40. The l-EV fraction from cells expressing the MIM 5KA mutant with Cas12f failed to induce GFP expression in recipient reporter cells (Fig. 5E), indicating that Cas12f delivery was dependent on MIM-induced protrusion-derived EVs. Furthermore, CIP4 KO PANC-1 reporter cells exhibited reduced GFP positivity compared to WT cells following Cas12f-containing EV treatment (Fig. 5E, F), suggesting that MIM-dependent EVs carrying Cas12f are taken up in a CIP4-dependent manner, similar to those carrying Rac1.
Stability of cargo proteins in protrusion-derived EVs
Rac1 in the l-EV fraction from heat-inactivated and frozen FBS promoted cell migration (Fig. 1). To assess whether Cas12f in EV fractions retain its activity after heat exposure and freezing, similar to the heat inactivation process of FBS, we tested its functionality under different storage conditions.
Cas12f-containing EV fractions maintained at 4 °C or 37 °C for 30 min retained their ability to generate GFP-positive cells (Fig. 5G–I). Surprisingly, EV fractions exposed to 56 °C for 30 min also maintained their ability to induce GFP expression in recipient cells (Fig. 5G–I). Furthermore, EV fractions stored at −80 °C or snap-frozen in liquid nitrogen before storage at −80 °C remained functional (Fig. 5G). The transmission electron microscopy (TEM) observation demonstrated the presence of the membrane particles indicative of EVs in both l-EV and s-EV fractions, with or without heating or freezing treatments (Supplementary Fig. 14A). The size distribution of EVs under TEM was similar to that from NTA (mean size of EVs in the l-EV fraction: 227.4 nm (TEM), 253.9 nm (NTA), mean size of s-EV fraction: 105.6 nm (TEM), 168.9 nm (NTA)), and was not affected by heating or freezing treatments (Supplementary Fig. 14B, C). These findings suggest that MIM-dependent protrusion-derived EVs preserve the integrity and functionality of their cargo proteins, including Rac1 and Cas12f, even after exposure to heating or freezing conditions.
Comparison of protrusion-derived and endosome-derived EVs
Most EV engineering strategies for protein delivery have utilized endosome-derived EVs within the s-EV fraction55,56. CD63, a tetraspanin protein, serves as a marker for endosomes and endosome-derived EVs4. To compare the efficiency of protrusion-derived and endosome-derived EVs in delivering genome-editing enzymes, we fused FKBP to either the MIM I-BAR domain or CD63 to facilitate the packaging of FRB-tagged Cas12f. The l-EV and s-EV fractions were collected from HEK293 cells transfected with these constructs using differential centrifugation.
Cas12f loading efficiency per EV was determined by western blotting (Fig. 6A, B). The average number of Cas12f molecules per l-EV from MIM I-BAR-expressing cells was 1.2 ± 0.45 and 4.3 ± 1.8 without and with 100 nM rapamycin treatment, respectively. When Cas12f was expressed with a T2A sequence followed by the MIM I-BAR domain, the Cas12f number per l-EV increased to 11.2 ± 6.9 with rapamycin. In contrast, CD63-mediated packaging resulted in a higher Cas12f loading per EV than MIM I-BAR through rapamycin-induced dimerization, with an average Cas12f molecules per l-EV of 7.7 ± 0.65 and 55.3 ± 1.3 without and with 100 nM rapamycin treatment, respectively (Fig. 6A, B). However, in the s-EV fractions from both MIM I-BAR- and CD63-expressing cells, the Cas12f content per EV was lower than that in l-EVs under rapamycin treatment (Fig. 6A, B).

A Western blotting of the l-EV fraction and s-EV fraction from HEK293 cells co-transfected with the vector for expression of mCherry-FKBP-MIM I-BAR- or CD63-GFP-FKBP and Cas12f-Halo-FRB-co-expressing cells, with MIM-derived EVs or CD63-derived EVs with or without rapamycin treatment. Those from the cells transfected with a vector expressing Cas12f, followed by the T2A sequence and the I-BAR domain, were also analyzed. Lysates of the same number of cells (6 × 10³ cells) and EVs (7 × 10⁹ EVs) were analyzed. B Quantification of (A). Bar graphs show the addition of EVs from cells transfected with mCherry-FKBP-MIM I-BAR (green) or CD63-GFP-FKBP (yellow) followed by rapamycin treatment, those without rapamycin treatment (light gray), or no EV addition (white) throughout the Fig. 6B–F. C Genome-editing of reporter cells by Cas12f-carrying EV fractions. Cas12f-reporter HEK293 cells (2.5 × 10⁴ cells) were treated with l-EV fractions or s-EV fractions prepared as in (A) (1.5 × 10¹⁰ EVs/ml in 0.2 ml). After 3 days, their fluorescence was observed under microscope and the number of GFP-expressing cells was counted. D Genome editing of reporter cells by Cas12f-carrying EV fractions detected by FCM. The l-EV fractions and s-EV fractions prepared after rapamycin treatment were added to reporter cells as described in (C). GFP-expressing cells were counted by FCM. E, F Genome-editing efficiency of the Cas12f-containing EVs. The efficiency per Cas12f molecule (E) was determined by the GFP-positive cell number divided by the amount of Cas12f per EV (B), and the efficiency per added EV volume (F) was determined by GFP-positive cell number divided by the relative EV volume described in Supplemental fig. 14D. The efficiency was indicated as arbitrary units (arb. units). Data show the means ± SD (3 independent experiments for (B, C, E, F); 5 independent experiments for (D)). Statistical significance was performed by one-way ANOVA with Tukey’s HSD test (B, C) to compare among all data sets, or with Dunnett’s multiple comparisons test (D–F) to compare each data set with that of no EV (D) or that of l-EVs treated with DMSO (E, F). Source data are provided as a Source data file.
To assess the genome-editing efficiency of Cas12f delivered by the EVs, equal numbers of these l-EVs and s-EVs were applied to reporter cells. The EVs in the l-EV fraction from MIM I-BAR-expressing cells exhibited higher or similar genome-editing activity compared to those from CD63-expressing cells and EVs from the s-EV fractions from both of the cells (Fig. 6C, D). Notably, Cas12f actively loaded into EVs via CD63 in the presence of rapamycin was not functional, as the genome-editing efficiency of EVs derived from Cas12f- and CD63-expressing cells remained unchanged regardless of rapamycin treatment (Fig. 6E). The genome-editing efficiency per Cas12f protein showed that Cas12f packaged via MIM I-BAR retained ~30 times higher genome-editing efficiency than that packaged via CD63 (Fig. 6E). The total volume of EVs added to cells was larger for l-EVs than for s-EVs, considering that the same number of EVs from the l-EV and s-EV fractions were added to reporter cells (Supplementary Fig. 14D). However, after the volume normalization, the genome-editing efficiency of MIM-derived EVs was still higher than that of CD63-derived EVs in both fractions, though the efficiency of delivery per volume of EVs was similar between EVs in the l-EV and s-EV fractions (Fig. 6F). These results demonstrate that plasma membrane protrusions induced by MIM are more suitable for packaging enzymatically active proteins into EVs compared to endosomal packaging mediated by CD63.
Discussion
This study demonstrates that protrusion-derived EVs naturally transfer the small GTPase Rac1, which enhances cell migration of recipient cells after endocytosis and subsequent release from endosomes. Furthermore, these EVs exhibit remarkable stability against heating and freezing, making them promising vehicles for the stable delivery of bioactive proteins, including genome-editing enzymes. Notably, unmodified protrusion-derived EVs demonstrated higher delivery efficiency compared to previously reported engineered endosome-derived EVs.
The delivery of EV cargo was comparable to microinjection via endocytic trafficking. The amount of Rac1 delivered to the cytoplasm via EVs is sufficient to induce functional effects. The estimated number of Rac1 molecules transferred per cell is approximately 1 × 10⁵, a level comparable to the amount required to induce membrane ruffles and lamellipodia in microinjection experiments. Direct microinjection introduces 1–2 × 10⁻¹⁴ L of a 0.3 mg/mL Rac1 solution, equivalent to ~14 μM or 0.8–1.7 × 10⁵ Rac1 molecules26. After 3 h from EV addition, at least ~32% of internalized Rac1 (approximately 0.4 × 10⁵ Rac1 molecules) was estimated to be released into the cytosol (Supplementary Fig. 9D). Considering that the observation of PALM/STORM did not cover the whole cell area (60–70% of the whole cell area) and was not taken as a Z-stack, the amount of released Rac1 is suggested to be at a comparable level to the microinjection amount of Rac1 to suffice for cell migration. Additionally, the fluorescence intensity of cytosolically released Halo-Rac1 increased continuously after EV addition, reaching approximately six-fold the initial amount 12 h later (Supplementary Fig. 8B). These findings indicate that EVs can efficiently deliver sufficient amounts of Rac1 to promote lamellipodium formation.
For EV cargo to function, two critical steps are required: (1) binding of EVs to recipient cells and (2) intracellular release of the cargo. EV surface ligand-receptor interactions likely vary across different EV populations, involving integrins, sugar chains, lectins, phosphatidylserine, tetraspanins, and cell adhesion molecules57. Following membrane binding, EV cargo can be released through direct fusion with the plasma membrane58 or endocytic uptake and subsequent escape into the cytosol30. The endocytic pathways include clathrin-dependent endocytosis59, phagocytosis60, and macropinocytosis61. Once internalized, EVs are transported to endosomes, where they are either degraded or released into the cytosol. This retrofusion process, in which intraluminal vesicles (ILVs) fuse with the endosomal membrane, is beginning to be elucidated62,63. However, EV-specific retrofusion mechanisms remain unknown.
The MIM-dependent EVs in this study were likely internalized via clathrin-mediated endocytosis, given the involvement of CIP4 and dynamin. However, the specific ligands and receptors mediating this process remain unidentified. Electron microscopy has revealed clathrin-coated pits ranging from 10 to 300 nm in diameter64, while atomic force microscopy reports diameters of 120–200 nm42. The observed sizes of EVs in the l-EV fractions from FBS (Supplementary Fig. 2C) and MIM-expressing cells (Supplementary Fig. 3B) fall within this range, suggesting compatibility with clathrin-mediated uptake. Cargo release was inhibited by bafilomycin (Fig. 2F, G and Supplementary Fig. 6B), which disrupts endosomal function by inhibiting vacuolar ATPases14,65. Thus, EV cargo release is not a sign of endosomal dysfunction but a regulated cellular process. Further research is needed to elucidate the molecular mechanisms governing EV cargo release from endosomes.
Protrusion-derived EVs can be optimal vehicles for the functional packaging of proteins. Rac1 localizes to the plasma membrane via lipid modifications25 and is enriched in MIM-induced plasma membrane protrusions (Supplementary Fig. 3A). The scission of these protrusions allows Rac1 to be encapsulated into EVs under neutral pH conditions in the cytosol. Co-immunoprecipitation analyses show that expressed Rac1 interacts with the I-BAR domain of MIM66,67. If Rac1 were packaged within endosomes, it could undergo GTP release due to protein unfolding in the acidic environment68, potentially compromising its activity. Thus, filopodia-derived EVs provide a more suitable platform for delivering active signaling proteins such as Rac1.
Similarly, filopodia provide a superior environment for packaging engineered proteins such as Cas12f due to their neutral pH. As shown in Fig. 6, Cas12f packaged into endosome-derived EVs via CD63 exhibited higher protein loading per EV but significantly lower genome-editing efficiency than Cas12f packaged into MIM-induced EVs. This suggests that CD63-mediated packaging at endosomes may result in protein degradation or misfolding, given that endosomes serve as sites for protein degradation.
Encapsulation in plasma membrane-derived EVs under neutral conditions likely enhances protein stability. Indeed, Rac1 and Cas12f remained functional after heating and freezing (Figs. 1 and 5). Serum for cell culture is typically filtered, frozen, and heat-inactivated at 56 °C. The thermal denaturation temperature of Rac1 is 64.8 °C69, while Cas12f retains dsDNA cleavage activity above 60 °C70. Thus, the preservation of Rac1 and Cas12f within protrusion-derived EVs may stem not only from their intrinsic stability but also from the protective properties of these EVs. Further studies are required to assess whether other bioactive proteins retain stability within EVs under similar conditions.
The presence of Rac1-containing EVs in serum implicates their physiological roles. Rac1 delivery via serum-derived EVs may play a crucial role in physiological processes such as wound healing, vascular remodeling, and tumor metastasis. MIM is highly expressed in neuronal cells, kidney cells, immune cells, and endothelial cells71,72,73,74,75, suggesting that these tissues serve as natural sources of Rac1-containing EVs in circulation. Additionally, cancer cell invadopodia produce Rac1-enriched EVs76, which may be released into the bloodstream and facilitate vascular remodeling and metastasis.
The genome-editing efficiency via protrusion-derived EVs is enhanced. If cargo protein stability can be enhanced in EVs, they could serve as efficient delivery tools for bioactive proteins. While multiple studies have attempted to package genome-editing enzymes into EVs, most have relied on s-EV fractions enriched with endosome-derived EVs. In this study, CD63-mediated Cas12f packaging resulted in higher protein loading per EV but significantly lower genome-editing efficiency compared to MIM-mediated EVs.
Previous studies have reported lower genome-editing efficiencies using s-EV-fraction-derived delivery (Supplementary table 1). For example, the genome-editing efficiency of EVs in s-EV fractions carrying cytosolic Cas9 was 0.05%77, while EVs in s-EV fraction containing Cas9 conjugated to tetraspanins via split-GFP achieved only 0.02%78. Additionally, when Cre recombinase was incorporated into EVs in s-EV fractions via FKBP-FRB, Cre-mediated genome recombination required endosomal escape enhancers such as chloroquine79.
To improve EV-mediated delivery, EVs have been modified using viral proteins such as VSV-G, a fusogenic glycoprotein that facilitates low-pH-dependent membrane fusion80. VSV-G-possessing EVs in s-EV fractions exhibited enhanced delivery efficiency13, 15, 16, and the protrusion-derived EVs without VSV-G in this study were considered to achieve similar but still weaker delivery efficiency to the EVs carrying VSV-G (Supplementary Table 1). These findings suggest that plasma membrane protrusions inherently possess mechanisms for efficient EV cargo uptake and release.
This study highlights the critical role of protrusion-derived EVs in the transport of functional proteins such as Rac1. Quantitative analyses of EV internalization and cargo release indicate that protrusion-derived EVs serve as highly efficient and versatile delivery vehicles for bioactive proteins, including genome-editing enzymes.
Methods
Cell culture
HEK293 cells (FreeStyle 293, Thermo Fisher Scientific, #R79007), adapted to serum-free suspension culture, were used for EV production. The cells were cultured in synthetic FreeStyle 293 Expression Medium (Thermo Fisher Scientific, #12338018) on the orbital shaker rotating at 135 rpm and placed in the 37 °C incubator with a humidified atmosphere of 8% CO2. For the EV reception, PANC-1 cells (ATCC, #CRL-1469), HEK293 cells (Lenti-X, TaKaRa, #632164), HeLa cells (ATCC, #CCL-2), and Ca9-22 cells (Japanese Collection of Research Bioresources Cell Bank, #JCRB0625) were cultured in Dulbecco’s Modified Eagle Medium (DMEM) (Nacalai, #08459-64) supplemented with 10% (vol/vol) FBS (Sigma, #173012) and penicillin–streptomycin at 37 °C in the incubator with a humidified atmosphere of 5% CO2.
Plasmids
Human CIP4 cDNA (Gene Bank NC_000019.10; NCBI protein database code gi:62897779) in the pEGFP-N3 plasmid32 was subcloned into the pMXs-IRES-Hygromycin resistant (HygR) plasmid51 with mEos4b or mCherry at its C-terminus.
The mouse MIM I-BAR domain (residues 1-275, Gene Bank XM_006520714.2) was cloned into the BglII and BamHI sites of the pEGFP-C1 plasmid (CLONTECH). The EGFP of the pEGFP-C1 was replaced with Halo7 or mCherry to make pHalo7-C1 or pmCherry-C1, respectively. Then, the I-BAR domain of MIM was inserted into pHalo7- C1 or pmCherry-C1 plasmids at the same site as the pEGFP-C1-MIM I-BAR. FKBP cDNA53 was inserted into the pmCherry-MIM I-BAR to construct pmCherry-FKBP-MIM I-BAR. The FKBP and superfolder (sf) GFP sequences were inserted after the CD63 sequence in pQH vector81, resulting in the pQH-CD63-sfGFP-FKBP.
The mouse Rac1 cDNA (Gene Bank NC_000071.7) was inserted into the multi-cloning site of the pHalo7-C1 to make pHalo-C1-Rac1. PrimeSTAR Mutagenesis Basal Kit (TaKaRa, #R046A) introduced point mutations of G12V or T17N on Rac1. The pEGFP-C1-GST-Rac1 was generated by inserting the Glutathione S-transferase (GST)-tagged Rac1 cDNA into the pEGFP-C1 plasmid, as has been reported previously36. The pGEX6P-1-Halo-Rac1 G12V was created by inserting Halo7-tag-fused G12V Rac1 mutant into pGEX6P-1.
Cas12f was expressed by lentivirus using the pKLV2 vector. The puromycin resistance gene and BFP of the pKLV2-U6gRNA5(BbsI)-PGKpuro2ABFP-W (a gift from Kosuke Yusa, Addgene plasmid #67974)82 were replaced by IRES-HygR and EGFP, as vector backbone. The I123H/D195K/D208R/V232A mutant of Cas12f from Acidibacillus sulfuroxidans (described as “Cas12f” in this paper)52, Halo7-tag, and FRB were inserted after the CMV promotor of the vector, and followed by U6 promoter for expressing sgRNA for the mouse transthyretin (TTR) gene (as guide RNA)52, resulting in pKLV2-AsCas12fHKRA-Halo7-GSGS-FRB-guideRNA. The T2A sequence and FKBP-MIM I-BAR were inserted, followed by the Cas12f-Halo-FRB sequence of pKLV2-AsCas12fHKRA-Halo7-GSGS-FRB-guideRNA to express both Cas12f and MIM I-BAR by one plasmid in the cell.
The reporter of Cas12f with sgRNA for TTR was also constructed under the CMV promotor of pKLV2 vector, which has mCherry followed by T2A and TTR target sequence, further followed by the frameshifted two GFP sequences, IRES, and hygromycin resistance gene, resulting in pKLV2mCherry_TTR_GFPGFPv3.
Transfection
HEK293 cells were transfected with purified DNAs including pEGFP-C1, pEGFP-N3-MIM I-BAR, pHalo7-C1, pHalo7-C1-MIM I-BAR, pEGFP-C1-GST-Rac1, pHalo7-C1-Rac1 WT and mutants (G12V and T17N), pmCherry-FKBP-MIM I-BAR, pQH-CD63-sfGFP-FKBP, pKLV2-AsCas12fHKRA-Halo7-GSGS-FRB-guideRNA, and pKLV2-AsCas12fHKRA-Halo7-GSGS-FRB-T2A-FKBP-MIM I-BAR-guideRNA using polyethylenimine MAX (PEI, Polysciences, #49553-93-7). The plasmid DNA (30 μg) and 1 mg/ml PEI (30 μl) were separately diluted in 1 ml of Opti-MEM reduced serum medium (Thermo Fisher Scientific, #31985070) and incubated for 5 min at room temperature. In the case of the co-transfection, two plasmids of 15 μg each were pre-mixed before Opti-MEM dilution. Then, the DNA and PEI in Opti-MEM were mixed and further incubated for 30 min at room temperature, and the mixture was added to the 28 ml culture of HEK293 cells at 1 × 10⁶ cells/ml. The cells were then cultured for 48 h. The transfected cells were added with the final 10 nM rapamycin or 0.01% DMSO for 24 h before the EV preparation for chemical dimerization.
Preparation of knockout and stably expressing cell lines
The CIP4 gene in PANC-1 cells was knocked out by using the CRISPR-Cas9 system. Two pairs of guide RNAs targeting the second exon sequences of the human CIP4, which are #1: 5’-TGCTCGAGCGCCACACGCAG-3’, and #2: 5’-CGTGAAAGAACGCACCGAAG-3’, were designed using the CRISPR direct server (https://crispr.dbcls.jp/)83. Forward and reverse oligo DNAs for these sequences were annealed and inserted into the BbsI site of the pX459 vector (Addgene #62988). PANC-1 cells were transfected with these plasmids and selected by puromycin (InvivoGen, ant-pr-1).
The CIP4 gene was re-expressed in the CIP4 KO PANC-1 cells by retrovirus-mediated gene transfer. HEK293 platA cells were transfected with pMXs-CIP4-mEos4b-IRES-HygR or pMXs-CIP4-mCherry-IRES-HygR using 293-fectin (Invitrogen) for 2 days to produce retrovirus, and the supernatant containing the retrovirus was filtered and infected with CIP4 KO PANC-1 cells in the presence of polybrene (Sigma, TR-1003) at 32 μg/ml. Cells were selected in a culture medium containing hygromycin B (InvivoGen, ant-hg-1) for the stable transfectants at appropriate concentrations.
Antibodies
The following antibodies were used for western blotting (WB) and/or immunofluorescence staining (IF) at the following dilutions: mouse anti-CIP4 (BD, clone 21, 612556, 1:100 for IF, 1:1000 for WB), mouse anti-GAPDH (Santa Cruz, sc-166574, 1:2000 for WB), rabbit anti-WAVE2 (Cell signaling, clone D2C8, #3659, 1:100 for IF, 1:1000 for WB), rabbit anti-N-WASP (Cell signaling, clone 30D10, #4848, 1:1000 for WB), mouse anti-dynamin II (BD, #610263, 1:1000 for WB), mouse anti-endophilin II (Santa Cruz, #sc-365704, 1:1000 for WB), rabbit anti-clathrin light chain A (CLTA) (proteintech, #10852-1-AP, 1:1000 for WB), mouse anti-Rac1 (Millipore, 05-389, 1:4000 for WB), mouse anti-Rac1 (BD, #610651, 1:200 for WB of EV uptake, 1:400 for ELISA), rabbit anti-Cdc42 (Cell signaling, #2462, 1:1000 for WB), rabbit anti-HaloTag (Promega, #G9281, 1:1000 for WB, 1:1000 for IF, 1:1000 for ELISA), mouse anti-HaloTag (Promega, #G9211, 1:1000 for WB, 1:1000 for ELISA), mouse monoclonal anti-MIM (Abnova, #H00009788-M01, 1:1000 for WB), mouse anti-CD81 (Santa Cruz, #sc-166029, 1:2000 for WB), mouse anti-Annexin I (Santa Cruz, sc-12740, 1:1000 for WB), rabbit anti-EEA1 (Cell signaling, #3288, 1:100 for IF), mouse anti-Lamp1 (Santa Cruz, #sc-20011,1:50 for IF), mouse anti-β-actin (Santa Cruz, #sc-47776, 1:3000 for WB), mouse anti-mCherry (Novus, #NBP1-96752, 1:1000 for IF), rabbit anti-GFP (MBL Life Science, #598, 1:4000 for WB), and rabbit anti-RFP (MBL Life Science, #PM005, 1:3000 for WB).
The secondary antibodies are as follows: Alexa Fluor-conjugated highly cross-adsorbed goat anti-mouse or anti-rabbit IgG antibodies (Invitrogen, #A11029, #A11031, #A11034 or #A11011, 1:500 for IF), Alexa Fluor 488 Phalloidin (Invitrogen, #A12379, 1:1000 for IF), Alexa Fluor 647 Phalloidin (Invitrogen, #A22287, 1:500 for IF), alkali-phosphatase (AP)-conjugated anti-mouse IgG (Promega, #S3721, 1:10,000 for WB; Sigma, #A3562, 1:30,000 for WB) or AP-conjugated anti-rabbit IgG (Promega, #S3731, 1:10,000 for WB), Horseradish peroxidase (HRP)-conjugated anti-mouse IgG (Promega, #W4021, 1:30,000 for WB) or HRP-conjugated anti-rabbit IgG (Promega, #W4011, 1:30,000 for WB).
Data analysis
For overall data analysis in this study, Excel version 2508 (build 19127.20302) (Microsoft) and Graphpad Prism 10 version 10.2.0 (392) (Graphpad Software LLC) were used to construct graphs and tables. ImageJ 1.54p (NIH) was used to analyze all images.
Western blotting
Cell lysates or proteins were separated by SDS-PAGE and transferred to the PVDF membranes (Millipore, #IPVH00010) using a Trans-Blot SD Semi-Dry Transfer Cell (BIO-RAD, #1703940) at 24 V for 1 h. The blotted membranes were blocked in 5% (wt/vol) skim milk in PBS containing 0.05% (vol/vol) Tween-20 (PBS-T) at room temperature for 1 h. Then, the membrane was incubated overnight at 4 °C with primary antibodies described above in PBS-T containing 0.01% (wt/vol) NaN3. After three washes with PBS-T, the membrane was incubated with AP-conjugated anti-mouse or anti-rabbit IgG antibody for 1 h. After three washes, the AP substrate consisting of 5-bromo-3-chloro-indolyl phosphate (Roche Diagnostics, #10760978103) and 4-nitro blue tetrazolium chloride (Roche Diagnostics, #11383213001) in the AP buffer was added for detection.
To detect Halo7-Rac1 in the EV-treated PANC-1 cells, blotted PVDF membranes were blocked in 5% (wt/vol) of ECL PRIME blocking reagent (Cytiva, #RPN418) in PBS-T overnight at 4 °C and incubated with antibodies against Rac1, Halo or β-actin in PBS-T containing 0.5% (wt/vol) ECL PRIME blocking reagent overnight at 4 °C. After three washes with PBS-T, membranes were incubated with HRP-conjugated anti-mouse IgG antibodies in PBS-T containing 0.5% (wt/vol) ECL PRIME blocking reagent overnight. After five washes, the ECL Prime Western Blotting Detection Reagent was added for the detection by ImageQuant LAS 4000 (GE Healthcare). To detect MIM in the EV fractions from FBS, the PVDF membrane was incubated with anti-MIM antibody in Can Get Signal Solution 1 (TOYOBO, #NKB-201) overnight at 4 °C and then with HRP-conjugated anti-mouse IgG antibody in Can Get Signal Solution 2 (TOYOBO, #NKB-301) overnight at 4 °C.
Preparation of the l-EV and s-EV fractions
The EV fractions were prepared as described previously40 with several modifications. In brief, 30 ml of the HEK293 cell suspension culture in a 50 ml centrifuge tube (Violamo, #VIO-50BN) was centrifuged sequentially at 1000 × g for 10 min and 3000 × g for 10 min at 4 °C to remove cell bodies and dead cells, respectively, using MX-307 centrifuge and AR510-04 rotor (TOMY, k-factor: 880). Then, l-EVs in the supernatant were pelleted by centrifugation at 10,000 × g for 30 min at 4 °C. The pelleted l-EVs were re-suspended in 1 ml of filtered PBS and centrifuged again at 10,000 × g for 30 min at 4 °C using MX-307 centrifuge and AR015-24 rotor (TOMY, k-factor: 643). The resulting l-EV pellet was re-suspended in 50 μl of PBS. The supernatant of the 10,000 × g centrifugation in a polycarbonate bottle (Beckman, #355622) was ultracentrifuged at 120,000 × g for 70 min at 4 °C using the Optima XE-90 ultracentrifuge and the Type-45Ti rotor (Beckman, k-factor: 259). The pellet was resuspended in 0.8 ml of PBS and pelleted again in an open-top thick-wall polycarbonate tube (Beckman, #343775) at 120,000 × g for 70 min at 4 °C using the Optima TLX ultracentrifuge and TypeTLX120.2 rotor (Beckman, k-factor: 34.8). The pelleted s-EVs were resuspended in 100 μl of filtered PBS. EV preparation from FBS (30 ml) was performed similarly, except that the FBS was heated for 30 min at 56 °C before the centrifugation to inactivate the complement.
To inhibit Rac1 in EVs, EHT1864 (TargetMol, #T6483) was added to the l-EV fraction from FBS at a final concentration of 20 μM, and the solution was incubated for 45 min at 37 °C. After the treatment, l-EVs were pelleted by centrifugation at 10,000 × g for 30 min at 4 °C and were washed with 1 ml of PBS, centrifuged at 10,000 × g for 30 min at 4 °C, and re-suspended in PBS.
To label Halo7-tagged proteins in the EVs, HaloTag ligands SaraFluor 650 T (SF650T) or SaraFluor 650B (SF650B) ligands (Goryochemical, #A308-01 or #A201-01) were used. Purified EVs were incubated with 50 nM of these HaloTag ligands for 1 h, rotating at 200 rpm at 37 °C using the shaker with incubator (BIOSAN, #TS-100C). To remove the ligands in the solution, The EVs were washed with 1 ml of PBS, centrifuged at 10,000 × g for 30 min at 4 °C, and re-suspended in PBS. In super-resolution microscopy observation, the labeled EVs were loaded on the Amicon Ultra 10k (Millipore, #UFC501008) and washed with 0.5 ml of PBS.
To label EVs using the PKH26 Red Fluorescent Cell Linker Kit (Sigma, #MINI26), 40 μl of the EV fraction was added to 110 μl of Dilution C as the kit instruction. Then 150 μl of the 2 μM PKH26 dye in Dilution C was added and incubated for 5 min at room temperature. To stop the reaction, 1% (wt/vol) BSA in PBS was added and incubated for 3 min at room temperature. Then 700 μl of PBS was added, and the EVs were centrifuged at 10,000 × g for 30 min at 4 °C. The pelleted EVs were washed with 1 ml of PBS, centrifuged at 10,000 × g for 30 min at 4 °C, and resuspended in 40 μl of PBS.
The protein concentration of each EV fraction was quantified by using Qubit 4 fluorometer (Invitrogen, #Q33238). The size distribution and particle number of each EV fraction were determined by nano-tracking analysis (NTA) using the NanoSight LM10 instrument (Malvern Panalytical). Each sample was recorded for 1 min and 5 times with the camera level set to 11 and with the detection threshold at 14. The particle concentration and the standard error at each diameter were calculated by using NTA3.4 software.
EV-depleted FBS
The EV-depleted FBS was prepared by the centrifugation of FBS at 120,000 × g for 16 h at 4 °C. 80% of the supernatant was transfered to a new tube using an electric pipette without disturbing the pellet, and then filtered through a 0.22 μm filter (Merck, #SLGPR33RB) as described previously84,85.
Wound healing assay
The effect of the EVs on the wound healing assay was performed in the EV-depleted DMEM, containing 10% EV-depleted FBS.
The PANC-1 cells and the CIP4 KO PANC-1 cells were seeded in the glass-based dishes (IWAKI, #3910-035) at the number of 2 × 10⁶ cells in the DMEM containing normal FBS at 10%. After 2 days of culture (approximately doubling the cell number), the cell monolayer was scratched to make a wound using a plastic micropipette tip. After the scratch, cells were placed for 10 min, and then the images were taken at 5-min intervals for 12 h by CytoSMART (Axion BioSystems, by the CytoSMART software v32.1.0.34022).
The l-EV or s-EV fractions prepared from FBS (6 × 10⁸ particles) were added to the confluent monolayer of PANC-1 cells in 1 ml of DMEM medium containing 10% (vol/vol) of EV-depleted FBS in a 35 mm dish (Corning, #430165) after scratch. The l-EV fractions prepared from GFP- or GFP-MIM I-BAR-expressing HEK293 cells as above, which contained total proteins of 5 μg (approximately 1.4 × 10⁹ particles), or 5 μg of purified Rac1 protein, were added to the culture medium of PANC-1 cells after scratch.
To inhibit dynamin, final 40 μM dynasore (CAS: 304448-55-3, AdipoGen, #AG-CR1-0045-M005) or 0.1% DMSO was added to cells and incubated for 30 min before EV addition and cell scratching. To inhibit H+-ATPase, final 100 nM bafilomycin (AdipoGen, #BVT-0252-C100) or 0.1% DMSO was added to 1 ml of culture medium and incubated for 30 min before EV addition and cell scratching.
The wound area was measured manually using the Image J software (NIH) by calculating the wound area covered by the migrated cells at each time point.
Immunofluorescence staining
PANC-1 cells were seeded on coverslips (Matsunami, #C013001) in the 24-well plate at 5 × 10⁵ cells. After 2 days of culture (approximate doubling time of the cells), the cell monolayer was formed, and then the medium was replaced with DMEM without FBS for more than 12 h for serum starvation. Then, the cell monolayer was scratched to make a wound using a plastic micropipette tip and incubated in the 1 ml of DMEM supplemented with 10% (vol/vol) of FBS or EV-depleted FBS supplemented with 1.6 × 10⁹ particles of EVs from the l-EV fractions. Bafilomycin or DMSO was added to the wound healing assay 30 min before EV addition.
HEK293 cells co-expressing MIM with wild-type (WT) or mutant Rac1 were incubated on coverslips coated with collagen (TOYOBO, TMTCC-050) for 3 h at 37 °C.
These cells were fixed using 4% (wt/vol) paraformaldehyde (PFA) in the DMEM containing 10% FBS or 10% EV-depleted FBS at room temperature for 10 min. Cells were made permeable using 0.1% Triton X-100 in 1% (wt/vol) BSA-containing TBS for 5 min and blocked with 1% (wt/vol) BSA in TBS for 1 h. After washing with PBS, cells were incubated with primary antibodies diluted in 0.1% (wt/vol) BSA-containing TBS at room temperature for over 2 h. After washes, cells were incubated with AlexaFluor-labeled secondary antibodies and Alexa488- or Alexa647-labeled phalloidin (Invitrogen, diluted at 1:500) diluted in 0.1% (wt/vol) BSA-containing TBS for 1 h at room temperature. After further washes, cells were mounted using ProLong Diamond with a DAPI mounting solution (Invitrogen, #P36971).
Images were acquired using the confocal microscope (Olympus, FV1000D, with FV10-ASW software Ver. 04.02) with 60× or 100× oil immersion objective lenses (NA 1.35 or 1.40, respectively) or a confocal microscope LSM980 (Zeiss) equipped with the PlanApo 63 ×/1.4 oil lens (Zeiss). Images were analyzed using Image J software. Line profiles of the fluorescence intensity were measured using “Plot Profile” on the described lines.
The fluorescence intensity of SF650T-labeled Halo7-Rac1 released from the EVs in the endosomes into the cytoplasm in the recipient cells was measured as follows: puncta of the Halo7-Rac1, as Halo7-Rac1 remained in the EVs in the endosomes, were detected using “Analyze Particles” plugin of Image J as the particles with a threshold of more than 3000. The number of detected puncta was almost the same as the manually counted number of Halo7-Rac1 dots. The average intensity of the Halo7-Rac1 in the cytoplasm, excluding the EV puncta area, was measured.
Fluorescence quantification of EVs
The l-EVs were labeled with the PKH26 dye and the SF650T Halo ligand and then incubated in 1.2 ml of FreeStyle 293 Expression Medium in the glass-based dishes at 37 °C for 2 h. After incubation, the EVs were observed using a confocal microscope FV1000D (Olympus) equipped with a 100× oil immersion objective lens (NA 1.40). The pixel size of the image is 124 nm × 124 nm (0.015 µm2).
Acquired images were analyzed using Image J software. EVs were detected at the PKH26 channel using the “Analyze Particles” plugin of Image J. The mean fluorescence intensities of GFP and Halo (SF650T) channels were measured at the detected particle areas. The fluorescence intensity distribution of EVs was analyzed using the Flowjo software (Becton Dickinson, v10.10.0). The linear regression lines of the plot of PKH26 (x-axis) versus the other fluorescent protein (y-axis) of the EVs from the single transfected cells (e.g., GFP-MIM I-BAR in Halo7-Rac1 transfected EVs) were used to identify another fluorescence, where the standard deviation (SD) of the signals from the regression line in another fluorescence channels was used as the cut-off line for the positive particles of another fluorescence. From the distribution of the signals, 2.5 × SD for GFP-MIM-I-BAR, and Halo-Rac1 channels, and 1.5 × SD for Halo-Cas12f channel.
The EV size (diameter) was calculated from the pixel area by the “Analyze Particles” plugin, assuming that all the EVs are spheres. Since the wavelength of the irradiated laser was 568 nm in the PKH26 channel under the observation with the objective lens (NA 1.40), the resolution of the images was approximately 0.5 × 568/1.40 = 272 nm. The measurement of the area having 1–3 pixels was combined.
The labeling efficiency and measurements of the Halo-Rac1 protein in the EVs
To measure the protein concentration in EV, droplets of SF650T Halo ligand solution were prepared using a method similar to that reported previously86. Briefly, 1 µl of 0.2, 0.4, 0.6, 0.8, or 1 mM SF650T Halo ligand solution was added to mineral oil (Sigma, M5904-5 ml) and vortexed for 10 min to make the droplets for the measurement. The fluorescence intensity of SF650T Halo ligand alone was 0.076 times less than that in the presence of HaloTag protein, according to the manufacturer (Goryo Chemical).
To determine the labeling efficiency, the fluorescence intensity of Halo-Rac1 in the cell lysate was compared with that of the SF650T Halo ligand. Non-transfected or Halo-Rac1-expressing HEK293 cells were centrifuged at 10,000 × g for 30 min at 4 °C. The pellets were incubated with 50 nM of these HaloTag ligands for 1 h, rotating at 200 rpm at 37 °C. To remove the ligands in the solution, the pellets were washed with PBS, centrifuged at 10,000 × g for 30 min at 4 °C, and re-suspended in the sonication buffer containing 50 mM HEPES (pH 7.4), 25 mM NaCl, 1 mM EDTA, 1 mM MgCl2, and 0.5% Triton X-100. The suspensions were sonicated using an ultrasonic homogenizer VP-5S (TAITEC) at level 9 (maximum level), with a cycle of 10 s of sonication and a 10-s pause for 10 min. Then, the lysate was centrifuged at 17,900 × g (15,000 rpm) for 5 min at 4 °C (TOMY, KITMAN-18). The collected supernatants were filtered using a 100-kDa ultrafiltration membrane (Millipore, #Ultrafree-C3HK) to remove high molecular weight factors. The flowthrough was concentrated using Amicon Ultra 3k (Millipore, #UFC500396). Fluorescence was measured using the fluorescence spectrometer FP-6500 (JASCO, analyzed by FP-6500 Spectra Manager for Windows 95/NT Ver 1.54.03). The lysate of Halo-Rac1-expressing cells was diluted in the sonication buffer to a total Halo-Rac1 (including labeled and non-labeled Halo-Rac1) concentration of 0.25 µM, determined by western blotting, compared with purified Rac1. The lysate of non-transfected cells was similarly diluted. SF650T Halo ligand was diluted in the sonication buffer to 0.25 µM. The fluorescence spectrum of the lysate of Halo-Rac1-expressing cells, subtracted by that of the non-transfected cells, and the fluorescence spectrum of the SF650T ligand subtracted by that of the sonication buffer alone is shown in Supplementary Fig. 9C. The fluorescence intensity of fully-labeled Halo-Rac1 was estimated from that of SF650T Halo ligand divided by 0.076, according to the manufacturer (Goryo Chemical). Since the labeling efficiency of SF650T and SF650B Halo ligands is supposed to be similar because they are slightly different only in their chromophores, we assumed the same labeling efficiency to calculate the Halo-Rac1 number for EVs from the STORM images.
Live cell imaging for EV uptake
The CIP4 KO PANC-1 cells stably expressing CIP4-mCherry were seeded in the glass-based dishes at 2 × 10⁶ cells. After 2 days of culture (approximate doubling time of the cells), the cell monolayer was scratched to make a wound using a plastic micropipette tip, which was performed in the wound healing assay. Then, the medium was replaced with the DMEM containing 10% EV-depleted FBS medium and EVs of 3.5 × 10⁹ particles in 200 µl. Time-lapse images were acquired at 37 °C in the chamber containing 5% CO2 under the laser confocal microscope (FV1000D, Olympus) equipped with a 100× oil immersion objective lens (NA 1.40; Olympus). Images were analyzed using Image J software.
3D super-resolution microscopy
For the live cell imaging of the EV uptake, PANC-1 cells expressing CIP4-mEos4b were seeded on glass-based dishes and incubated overnight to make a confluent monolayer. The l-EVs were prepared from culture media of HEK293 cells expressing Halo7-MIM I-BAR and labeled with SaraFluor 650T-conjugated Halo ligand as described above. After scratching the cells to make a wound, 3 × 10⁹ particles of fluorescently labeled l-EVs were added to the 4 × 10⁶ cells in 200 µl of phenol red-free DMEM medium (Gibco, #21063029) containing 10% EV-depleted FBS, and the cells were incubated for 1 h before the observation. A Nikon Ti-E inverted microscope equipped with a high N.A. oil objective lens (CFI Apo TIRF 100×, NA 1.49; Nikon) and two qCMOS cameras (ORCA Quest C15550-20UP; Hamamatsu Photonics) was used to obtain 3002 single-molecule images of 256 × 256 pixels, with a 20 ms exposure time. A cylindrical lens (MED54301, Nikon) was set in both imaging paths to generate astigmatism for single-molecule fluorescent spots, and the position in the z direction was defined from its ellipticity50. For calibration of the Z position, we observed single particles of multicolor fluorescent beads (Tetraspeck Microspheres 100 nm in diameter; Thermo Fisher Scientific) fixed on a glass-based dish and continuously moved (1 nm/millisecond) to z-direction using a z-piezo stage (Nano Z100, Mad City Labs). The obtained movies were analyzed using the “Cylindrical lens calibration” function of the ThunderSTORM plugin. The predefined mask was used to obtain correction data in the x- and y-directions related to the previous paper87. Single particle tracking was performed using ImageJ and ThunderSTORM, and 3D images were reconstructed by accumulating 1500 images (30 s). 3D time-lapse images were created using the image analysis software AIVIA. 3D pixel colocalization analysis was performed using AIVIA software version 12 to quantify the percentage of MIM signals co-localized with CIP4 signals. The analysis was conducted in three steps. First, we used “Pixel Colocalization” to detect overlapping fluorescent signals from two channels for pixels with intensity ≥1. Then, to detect signals from particles containing MIM, we applied “3D object analysis-meshes” to both MIM and Colocalization channels. The analysis parameters were set as follows: (Minimum edge intensity = 10, Object radius threshold ≥ 30 nm). Finally, we counted the number of objects in both MIM and Colocalization channels to calculate the colocalization percentage. The 180°-rotated images were used as randomized images for comparison.
To observe the fixed cell with the taken-up EVs, 1 × 10⁵ of PANC-1 cells stably expressing mEos4b-Lamp1 were seeded on glass-based dishes 2 days before EV addition. As described above, the l-EV fraction co-expressing Halo7-Rac1 and FLAG-MIM I-BAR was prepared and labeled with a Halo ligand SF650B. Bafilomycin or DMSO was added in the same condition as the wound healing assay 30 min before EV addition, and labeled l-EVs of 2 × 10⁹ particles were added to PANC-1 cells in 200 µl of 10% EV-depleted FBS-containing DMEM and incubated for 3 h. The cells were fixed with 4% PFA and 0.2% glutaraldehyde in a buffer containing 30 mM HEPES (pH 7.4), 100 mM NaCl, and 2 mM CaCl2 for 10 min at room temperature. After three washes with PBS, the cells were treated with 0.1% NaBH4 in PBS for 7 min at room temperature. After two washes with PBS, the cells were stored at 4 °C in 1% (wt/vol) polyvinyl alcohol and 10 mM cysteamine in PBS until the observation. Super-resolution microscopy was performed according to the reported procedures88,89 with slight modifications. Cells were soaked in the PBS supplemented with 10 mM Tris HCl (pH 7.5), 10% glucose, 10 mM cysteamine, 50 mM 2-mercaptoethanol, 2.5 mM protocatechuic acid, 2 mM cyclooctatetraene, and 50 mM protocatechuic dioxygenase just before the observation. An N-STORM (Nikon) super-resolution microscope equipped with a 100×/NA 1.49 objective lens (Apo TIRF 100× Oil DIC N2 Nikon) and an EMCCD camera (iXon Du-897; ANDOR) was used to obtain 20,000 images of 256 × 256 pixels (40.96 × 40.96 μm), with a 20 ms exposure time. 15,000 fluorescence images were sequentially acquired, in which the first 7500 images were of mEos4b-Lamp1, and the remaining 7500 were of SaraFluor 650B-labeled Halo7-Rac1. The 405 nm laser was used for the mEos4b activation, and the 488 and 647 nm lasers were used to detect Lamp1-mEos4b and SaraFluor 650B, respectively.
The acquired images were analyzed using NIS-Elements software AR (version 5.42.04, Nikon). Before performing this analysis, we excluded datasets that were unsuitable, namely those containing two or more cells, those containing debris, and those where the total number of detected Halo-Rac1 signals showed outliers in the Smirnov–Grubbs test. The signals with accuracy <40 nm were considered. Because the single molecule identification of the crowded molecules like Rac1 in the EVs cannot be considered quantitative90,91. Therefore, we manually analyzed the Halo7-Rac1 signal crossing over around mEos4b-Lamp1, as shown in Fig. 2G, according to the criteria illustrated in Supplementary Fig. 6, in 17 images of PANC-1 cells. The following three criteria defined the release events (crossover) of Halo-Rac1 from endosomes: (1) the area of the cluster of the Halo-Rac1 does not contain the centroid of the Lamp1 signal cluster, (2) the dispersed Halo-Rac1 signals are observed outside the Lamp1 signal cluster and close to the Rac1 cluster, and (3) the no dispersed Halo-Rac1 that does not fulfill the (2) was observed in the vicinity of the Lamp1 cluster.
The analysis for the cytosolic number of Halo-Rac1 was performed as in the previous study92,93 with modifications, where over four signals within 20 nm in the xy plane and 40 nm in the z direction were connected to a cluster. The non-clustered signals are considered to be the cytosolic Rac1. These calculations were performed with MATLAB.
Purification of the Rac1 protein
Rac1 protein was expressed in HEK293 cells as EGFP-GST-Rac1 and purified with the removal of the EGFP-GST tag as described previously36. The pEGFP-C1-GST-Rac1 plasmid was transfected in HEK293 cells using PEI. Cells were grown at 37 °C, 8% CO2, for 2 days and collected by centrifugation at 5350 × g for 10 min. The cell pellet was lysed in 1 ml of lysis buffer containing 10 mM Tris HCl (pH 7.5), 150 mM NaCl, 5 mM EDTA, 0.5% Triton X-100, 1 mM phenylmethylsulfonyl fluoride, and 1 mM dithiothreitol (DTT), sonicated at 4 °C using ultrasonic homogenizer Q700 (QSONICA), and then centrifuged at 17,200 × g for 5 min at 4 °C. The supernatant was incubated with 100 μl of equilibrated Glutathione Sepharose 4B beads (GE Healthcare, #17-0756-01) at 4 °C for 1 h. The sample was centrifuged at 500 × g for 3 min to collect the beads, and the supernatant was removed. The beads were washed three times with wash buffer (10 mM Tris-HCl (pH 7.5), 150 mM NaCl, 1 mM EDTA, and 1 mM DTT). To cleave the EGFP-GST, PreScission Protease (GE Healthcare) in 200 μl of wash buffer was added, and the sample was rotated overnight at 4 °C. The supernatant was then centrifuged at 500 × g for 3 min at 4 °C to obtain the purified Rac1 protein. The protein concentration was measured using the Qubit 4 fluorometer.
Halo-Rac1 G12V protein for microinjection was expressed in E. coli BL21 (DE3) strain transformed with pGEX6P-1-Halo-Rac1 G12V plasmid and induced by incubating with 0.1 mM isopropyl-beta-D-thiogalactopyranoside (IPTG) at 20 °C overnight. Protein purification was performed as same as above, following the previously reported method36.
Trypsin treatment
To examine whether the Rac1 protein is outside or inside of the EV membrane, EV fractions were treated with trypsin, as we showed previously40. In brief, EV fractions containing 0.32 μg of protein or purified Rac1 protein were treated with 4 μM trypsin (MP Biomedicals) in PBS for 30 min at 37 °C. After the treatment, the same volume of SDS-PAGE sample buffer was added, and the samples were analyzed by western blotting. The ratio of the Rac1 amount after the trypsin treatment to that without trypsin treatment was calculated by analyzing the western blotting bands using Image J.
Western blotting of the internalized Rac1 in the EV recipient cells
To measure the Rac1 amount contained in the internalized EVs, EVs that remained on the plasma membrane were removed from the recipient cells by trypsin treatment, as shown previously94. In brief, PANC-1 cells were seeded at 106 cells on the 6-well plate. After the cells were attached, cells were washed in a serum-free DMEM medium 3 times and cultured in the serum-free medium for over 12 h. PANC-1 cells in 1 ml medium were incubated with 8 × 10⁸ EVs for 1, 3, and 6 h in a 37 °C incubator in a humidified atmosphere of 5% CO2. Then, cells were treated with 0.25% trypsin (MP Biomedicals)—0.02% EDTA in PBS for 5 min at room temperature to remove the cell-surface bound EVs. After the reaction, the trypsin solution was collected and centrifuged at 3000 × g for 10 min at 4 °C to pellet the cells that were detached from the plate. After removing the trypsin solution, cells on the dishes were collected in 50 µl of SDS-PAGE sample buffer and combined with the cell pellets from the trypsin solution. 10 µl of these samples were analyzed by western blotting.
ELISA of the Halo7-Rac1 in the EV recipient cells
PANC-1 cells were seeded in a 10 cm dish at 6 × 10⁶ cells. After the cells were attached, cells were washed in a serum-free DMEM medium 3 times and cultured in the serum-free medium for over 12 h. Then, 9 × 10⁹ particles of the l-EV fraction from HEK293 cells co-expressing FLAG-MIM I-BAR and Halo7-Rac1 were added to cells in a 6 ml DMEM medium containing 10% EV-depleted FBS. Cells were cultured for 1 or 3 h at 37 °C in a humidified atmosphere of 5% CO2.
To prepare the cell lysate, a culture medium containing l-EVs was removed and washed with PBS 3 times. Cells were lysed in 500 μl of the lysis buffer. Cells were collected using a cell scraper and passed ten times through a 1 ml syringe (TERUMO, #1-4908-01) with a 25 G needle (TERUMO, #61-9703-87) to disrupt chromosomes. Then, the lysate was sonicated using an ultrasonic homogenizer VP-5S (TAITEC) at level 6 (maximum level), with on time of 10 s and off time of 10 s for 1 min. Then, the lysate was centrifuged at 4 °C, 17,900 × g for 5 min, and the supernatant was collected.
One day before the measurement, anti-HaloTag rabbit antibody at 1 μg/ml in 100 μl PBS was dispensed into the 96-well ELISA plate (Thermo, #3855) and incubated overnight at 37 °C. Plates were washed 3 times with PBS and blocked with 3% (wt/vol) BSA in PBS at room temperature for 1 h. After washing 3 times with PBS, 100 μl of the cell lysate or the lysis buffer alone was added to the plate, and the plate was incubated at room temperature for 2 h. After washing three times with PBS-T, the plates were incubated with 100 μl of anti-Rac1 antibody diluted in 0.3% (wt/vol) BSA/PBS-T for 2 h at room temperature. After washing three times with PBS-T, 100 μl of 1:500 diluted HRP-conjugated anti-mouse IgG antibody (Invitrogen) in PBS-T containing 0.5% (wt/vol) ECL Prime blocking reagent was added to the plate, and the plate was incubated at room temperature for 1 h. After washing three times with PBS-T, 100 μl of TMB solution (Thermo, 1-step Slow-TMB-ELISA, #34024) was added to the plate and incubated at room temperature. The HRP reaction was stopped by the addition of 100 μl of 1 M phosphoric acid, and the absorbance at a wavelength of 450 nm was measured using a microplate reader (TriStar LB942).
The l-EV fraction from FLAG-MIM I-BAR- and Halo7-Rac1-co-expressing cells was serially diluted in the lysis buffer, and the Rac1 amount was measured by ELISA simultaneously with the cell lysates. The same l-EV fraction was subjected to western blotting with purified Rac1 protein of known protein concentration to calculate the concentration of Rac1 in the l-EV fraction. The l-EV fraction of the known Rac1 concentration was measured to create the calibration line. For calculating the Halo7-Rac1 concentration in the PANC-1 cell lysate treated with l-EV fraction, the absorbance at 450 nm of the cell lysate was subtracted by that without l-EV fraction and divided by the slope of the calibration line.
Microinjection and EV-treatment comparison
Halo-Rac1 G12V protein was diluted to 300 μg/ml in a buffer containing 10 mM Tris-HCl, pH7.5, 150 mM NaCl, 5 mM MgCl2, and 6.25 mg/ml of 0.22 μm-filtered Rhodamine B isothiocyanate-Dextran (Sigma, R9379). After centrifugation at 15000 rpm at 4 °C for 5 min, the supernatant was microinjected into PANC-1 cells. Microinjection was performed as described previously95, using the Femtojet 2 (Eppendorf) with a Femtotips injection needle (Eppendorf). The EV-treated cells were prepared simultaneously. The microinjected cells and EV-treated cells were fixed by 4% PFA for 5 min at room temperature and stained by rabbit anti-Halo-tag antibody and Alexa-647-labeled phalloidin. Cells were observed by LSM980 confocal microscope (Zeiss) under the same conditions simultaneously.
Cas12f-reporter assay
A lentivirus system was used to produce Cas12f-reporter cells. Lenti-X 293T cells were transfected with pKLV2-mCherry_TTR_GFPGFPv3 (described above) together with psPAX2 (Addgene, #11260) and pMD2G (Addgene, #11259) to produce lentivirus. The supernatant was filtered and added to the cells. The selection of transfected cells was performed by hygromycin and fluorescent-activated cell sorting.
The Cas12f-reporter cells were suspended in 100 µl of serum-free DMEM medium at 2.5 × 10⁴ cells per well in the 96-well plate (TrueLine, TR5003). EVs of 3 × 10⁹ suspended in 5 μl of the serum-free DMEM medium were added to the Cas12f-reporter cells, which were incubated for 1 h at 37 °C in a humidified atmosphere of 5% CO2. After incubation, 100 µl of DMEM medium containing 10% EV-depleted FBS was added, and cells were incubated for 3 days before observation or flow cytometry.
Cells treated by EVs were observed under epi-fluorescence microscopes, Ti2 (Nikon) equipped with a 63× lens (NA 1.4, Nikon) or IX81 (Olympus, with MicroManager software Ver. 2.0.3.20250418) equipped with a 10× objective lens (NA 0.25, Olympus). Images were analyzed using Image J software. The number of GFP-positive cells was counted in 2625.6 × 2625.6 µm (approximately 5000 cells seeded, and growth up to approximately 13000 PANC-1 cells, and approximately 28000 HEK293 cells after 3days incubation) areas. The genome editing efficiency was calculated after subtracting the background GFP positive cell number without EV treatment.
To examine the effect of heating or freezing on EVs, the same number of EVs were dispensed and treated with heat for 30 min at 37 °C or at 56 °C in the block incubator (ASTEC, BI-516S) followed by storage for 1 day at 4 °C, or frozen at −80 °C or frozen in liquid nitrogen followed by storage for 1 day at −80 °C. After these treatments, the numbers of EVs were measured using NTA. EVs were added to cells under the same EV and cell concentration described above.
Flow cytometry analysis for Cas12f-reporter assay
The Cas12f-reporter cells and EVs were mixed in the 96-well plates, which were incubated for 3 days at 37 °C in a humidified atmosphere of 5% CO2 (described in Cas12f-reporter assay). For flow cytometry analysis, cells were trypsinized and transferred to 1.5 mL tubes using a doubled volume of DMEM containing 10% FBS. Cells were centrifuged for 5 min at 200 × g, resuspended in 100 µL 0.5% BSA 2 mM EDTA in PBS and passed through a 50 µm nylon mesh filter.
Cells were analyzed on a CytoFLEX S (Beckman Coulter). Firstly, cells were selected using forward scatter area (FSC-A) and sideward scatter area (SSC-A) plots. Then, single cells were selected by plotting FSC-A and forward scatter height (FSC-H). Edited reporter cells were decided by gating and measuring GFP expression and mCherry expression (reporter cells marker) using a 488 nm laser and 561 nm laser, respectively (FITC-ECD plot). For analysis performed with the CytExpert, compensation matrices and gating settings were set based on signals in all measured channels, and the same gates and matrices were used for all samples. The results were plotted with CytExpert (Beckman Coulter, Version 2.4.0.28).
Transmission electron microscopic observation
The formvar membrane support of the grid was made with polyvinyl formvar (IA19K, Nisshin EM). The prepared EV shown above was attached to the supported grid, and the grids were washed with PBS for 1 min and then twice with distilled water. Last, the grids were counterstained twice with 1% uranyl acetate in distilled water for 2 min each. The grids were dried and then observed with a transmission electron microscope (Hitachi H-7100)36.
Statistics and reproducibility
No statistical method was used to predetermine sample size. At least three biological replicates were examined in each experiment. No data were excluded from the analyses. The experiments were not randomized except for Fig. 2C. The investigators were not blinded to allocation during experiments and outcome assessment.
Normality of the data sets was tested using Shapiro–Wilk or Kolmogorov–Smirnov tests for datasets with sample sizes greater than 3. Because normality could not be reliably tested for datasets with a sample size of 3, these datasets were assumed to follow a normal distribution. For normally distributed datasets, statistical significance between the two groups was assessed using two-tailed unpaired t-test with Welch’s correction. Comparisons among more than three groups were performed using one-way ANOVA corrected with Dunnett’s multiple comparisons or Tukey’s honestly significant difference tests. For non-normally distributed data, two-tailed unpaired Mann–Whitney U test was used for two groups, and Kruskal–Wallis test followed by Dunn’s multiple comparisons test was used for more than three groups. Values of p < 0.05 were considered to be significant. All data are described as the mean ± SD.
Reporting summary
Further information on research design is available in the Nature Portfolio Reporting Summary linked to this article.
Data availability
All data are available in the main text or the supplementary materials. Source data are provided with this paper.
References
-
Mathieu, M., Martin-Jaular, L., Lavieu, G. & Thery, C. Specificities of secretion and uptake of exosomes and other extracellular vesicles for cell-to-cell communication. Nat. Cell Biol. 21, 9–17 (2019).
-
Valadi, H. et al. Exosome-mediated transfer of mRNAs and microRNAs is a novel mechanism of genetic exchange between cells. Nat. Cell Biol. 9, 654–659 (2007).
-
van Niel, G., D’Angelo, G. & Raposo, G. Shedding light on the cell biology of extracellular vesicles. Nat. Rev. Mol. Cell Biol. 19, 213–228 (2018).
-
Welsh, J. A. et al. Minimal information for studies of extracellular vesicles (MISEV2023): from basic to advanced approaches. J. Extracell. Vesicles 13, e12404 (2024).
-
Dixson, A. C., Dawson, T. R., Di Vizio, D. & Weaver, A. M. Context-specific regulation of extracellular vesicle biogenesis and cargo selection. Nat. Rev. Mol. Cell Biol. 24, 454–476 (2023).
-
Hanson, P. I. & Cashikar, A. Multivesicular body morphogenesis. Annu Rev. Cell Dev. Biol. 28, 337–362 (2012).
-
Baietti, M. F. et al. Syndecan-syntenin-ALIX regulates the biogenesis of exosomes. Nat. Cell Biol. 14, 677–685 (2012).
-
Trajkovic, K. et al. Ceramide triggers budding of exosome vesicles into multivesicular endosomes. Science 319, 1244–1247 (2008).
-
Colombo, M., Raposo, G. & Thery, C. Biogenesis, secretion, and intercellular interactions of exosomes and other extracellular vesicles. Annu Rev. Cell Dev. Biol. 30, 255–289 (2014).
-
Rilla, K. Diverse plasma membrane protrusions act as platforms for extracellular vesicle shedding. J. Extracell. Vesicles 10, e12148 (2021).
-
D’Angelo, G., Raposo, G., Nishimura, T. & Suetsugu, S. Protrusion-derived vesicles: new subtype of EVs? Nat. Rev. Mol. Cell Biol. 24, 81–82 (2023).
-
Silva, A. M. et al. Quantification of protein cargo loading into engineered extracellular vesicles at single-vesicle and single-molecule resolution. J. Extracell. Vesicles 10, e12130 (2021).
-
Hirose, H., Hirai, Y., Sasaki, M., Sawa, H. & Futaki, S. Quantitative analysis of extracellular vesicle uptake and fusion with recipient cells. Bioconjugate Chem. 33, 1852–1859 (2022).
-
Bonsergent, E. et al. Quantitative characterization of extracellular vesicle uptake and content delivery within mammalian cells. Nat. Commun. 12, 1864 (2021).
-
Yao, X. et al. Engineered extracellular vesicles as versatile ribonucleoprotein delivery vehicles for efficient and safe CRISPR genome editing. J. Extracell. Vesicles 10, e12076 (2021).
-
Gee, P. et al. Extracellular nanovesicles for packaging of CRISPR-Cas9 protein and sgRNA to induce therapeutic exon skipping. Nat. Commun. 11, 1334 (2020).
-
Jia, L. et al. Maternal and umbilical cord serum-derived exosomes enhance endothelial cell proliferation and migration. FASEB J. 32, 4534–4543 (2018).
-
Hayashi, I. & Sato, G. H. Replacement of serum by hormones permits growth of cells in a defined medium. Nature 259, 132–134 (1976).
-
Bishop, E. T. et al. An in vitro model of angiogenesis: basic features. Angiogenesis 3, 335–344 (1999).
-
Jiang, Y. et al. Exosomal long noncoding RNA HOXD-AS1 promotes prostate cancer metastasis via miR-361-5p/FOXM1 axis. Cell Death Dis. 12, 1129 (2021).
-
Shan, D. et al. The G protein G alpha(13) is required for growth factor-induced cell migration. Dev. Cell 10, 707–718 (2006).
-
Tarcic, G. et al. EGR1 and the ERK-ERF axis drive mammary cell migration in response to EGF. FASEB J. 26, 1582–1592 (2012).
-
Wortzel, I., Dror, S., Kenific, C. M. & Lyden, D. Exosome-mediated metastasis: communication from a distance. Dev. Cell 49, 347–360 (2019).
-
Yokoi, A. & Ochiya, T. Exosomes and extracellular vesicles: rethinking the essential values in cancer biology. Semin. Cancer Biol. 74, 79–91 (2021).
-
Ridley, A. J. Rho GTPase signalling in cell migration. Curr. Opin. Cell Biol. 36, 103–112 (2015).
-
Ridley, A. J. Microinjection of Rho and Rac into quiescent Swiss 3T3 cells. Methods Enzymol. 256, 313–320 (1995).
-
Ridley, A. J., Paterson, H. F., Johnston, C. L., Diekmann, D. & Hall, A. The small GTP-binding protein rac regulates growth factor-induced membrane ruffling. Cell 70, 401–410 (1992).
-
Sahu, V. et al. Quantification of Rac1 and Rac1b in serum of non small cell lung cancer by label free real time assay. Clin. Chim. Acta 460, 231–235 (2016).
-
Eroglu, F. K. et al. Circulating extracellular vesicles of patients with steroid-sensitive nephrotic syndrome have higher RAC1 and induce recapitulation of nephrotic syndrome phenotype in podocytes. Am. J. Physiol. Ren. Physiol. 321, F659–f673 (2021).
-
Mulcahy, L. A., Pink, R. C. & Carter, D. R. Routes and mechanisms of extracellular vesicle uptake. J. Extracellular Vesicles 3, 24641 (2014).
-
Costa Verdera, H., Gitz-Francois, J. J., Schiffelers, R. M. & Vader, P. Cellular uptake of extracellular vesicles is mediated by clathrin-independent endocytosis and macropinocytosis. J. Control Release 266, 100–108 (2017).
-
Shimada, A. et al. Curved EFC/F-BAR-domain dimers are joined end to end into a filament for membrane invagination in endocytosis. Cell 129, 761–772 (2007).
-
Mattila, P. K. & Lappalainen, P. Filopodia: molecular architecture and cellular functions. Nat. Rev. Mol. Cell Biol. 9, 446–454 (2008).
-
Krause, M. & Gautreau, A. Steering cell migration: lamellipodium dynamics and the regulation of directional persistence. Nat. Rev. Mol. Cell Biol. 15, 577–590 (2014).
-
Takenawa, T. & Suetsugu, S. The WASP-WAVE protein network: connecting the membrane to the cytoskeleton. Nat. Rev. Mol. Cell Biol. 8, 37–48 (2007).
-
Wan Mohamad Noor, W. N. I. et al. Small GTPase Cdc42, WASP, and scaffold proteins for higher-order assembly of the F-BAR domain protein. Sci. Adv. 9, eadf5143 (2023).
-
Ferguson, S. M. & De Camilli, P. Dynamin, a membrane-remodelling GTPase. Nat. Rev. Mol. Cell Biol. 13, 75–88 (2012).
-
McMahon, H. T. & Boucrot, E. Molecular mechanism and physiological functions of clathrin-mediated endocytosis. Nat. Rev. Mol. Cell Biol. 12, 517–533 (2011).
-
Scita, G., Confalonieri, S., Lappalainen, P. & Suetsugu, S. IRSp53: crossing the road of membrane and actin dynamics in the formation of membrane protrusions. Trends Cell Biol. 18, 52–60 (2008).
-
Nishimura, T. et al. Filopodium-derived vesicles produced by MIM enhance the migration of recipient cells. Dev. Cell 56, 842–859 e848 (2021).
-
Itoh, T. et al. Dynamin and the actin cytoskeleton cooperatively regulate plasma membrane invagination by BAR and F-BAR proteins. Dev. Cell 9, 791–804 (2005).
-
Yu, Y. & Yoshimura, S. H. Self-assembly of CIP4 drives actin-mediated asymmetric pit-closing in clathrin-mediated endocytosis. Nat. Commun. 14, 4602 (2023).
-
Crosas-Molist, E. et al. Rho GTPase signaling in cancer progression and dissemination. Physiol. Rev. 102, 455–510 (2022).
-
Saengsawang, W. et al. The F-BAR protein CIP4 inhibits neurite formation by producing lamellipodial protrusions. Curr. Biol. 22, 494–501 (2012).
-
Pichot, C. S. et al. Cdc42-interacting protein 4 promotes breast cancer cell invasion and formation of invadopodia through activation of N-WASp. Cancer Res. 70, 8347–8356 (2010).
-
Rolland, Y. et al. The CDC42-interacting protein 4 controls epithelial cell cohesion and tumor dissemination. Dev. Cell 30, 553–568 (2014).
-
Truesdell, P. et al. CIP4 promotes lung adenocarcinoma metastasis and is associated with poor prognosis. Oncogene 34, 3527–3535 (2015).
-
Malet-Engra, G. et al. CIP4 controls CCL19-driven cell steering and chemotaxis in chronic lymphocytic leukemia. Cancer Res. 73, 3412–3424 (2013).
-
Roy, I. et al. Pancreatic cancer cell migration and metastasis is regulated by chemokine-biased agonism and bioenergetic signaling. Cancer Res. 75, 3529–3542 (2015).
-
Huang, B., Wang, W., Bates, M. & Zhuang, X. Three-dimensional super-resolution imaging by stochastic optical reconstruction microscopy. Science 319, 810–813 (2008).
-
Pužar Dominkuš, P. et al. PKH26 labeling of extracellular vesicles: characterization and cellular internalization of contaminating PKH26 nanoparticles. Biochim. Biophys. Acta Biomembr. 1860, 1350–1361 (2018).
-
Hino, T. et al. An AsCas12f-based compact genome-editing tool derived by deep mutational scanning and structural analysis. Cell 186, 4920–4935.e4923 (2023).
-
Komatsu, T. et al. Organelle-specific, rapid induction of molecular activities and membrane tethering. Nat. Methods 7, 206–208 (2010).
-
Suetsugu, S. et al. The RAC binding domain/IRSp53-MIM homology domain of IRSp53 induces RAC-dependent membrane deformation. J. Biol. Chem. 281, 35347–35358 (2006).
-
Lu, Y., Godbout, K., Lamothe, G. & Tremblay, J.P. CRISPR-Cas9 delivery strategies with engineered extracellular vesicles. Mol. Ther. Nucleic Acids 34, 102040 (2023).
-
Whitley, J. A. & Cai, H. Engineering extracellular vesicles to deliver CRISPR ribonucleoprotein for gene editing. J. Extracell. Vesicles 12, e12343 (2023).
-
Gonda, A., Kabagwira, J., Senthil, G. N. & Wall, N. R. Internalization of exosomes through receptor-mediated endocytosis. Mol. Cancer Res. 17, 337–347 (2019).
-
Parolini, I. et al. Microenvironmental pH is a key factor for exosome traffic in tumor cells. J. Biol. Chem. 284, 34211–34222 (2009).
-
Tian, T. et al. Exosome uptake through clathrin-mediated endocytosis and macropinocytosis and mediating miR-21 delivery. J. Biol. Chem. 289, 22258–22267 (2014).
-
Feng, D. et al. Cellular internalization of exosomes occurs through phagocytosis. Traffic 11, 675–687 (2010).
-
Fitzner, D. et al. Selective transfer of exosomes from oligodendrocytes to microglia by macropinocytosis. J. Cell Sci. 124, 447–458 (2011).
-
Eden, E. R. & Futter, C. E. Membrane trafficking: retrofusion as an escape route out of the endosome. Curr. Biol. 31, R1037–r1040 (2021).
-
Perrin, P. et al. Retrofusion of intralumenal MVB membranes parallels viral infection and coexists with exosome release. Curr. Biol. 31, 3884–3893.e3884 (2021).
-
Canton, I. & Battaglia, G. Endocytosis at the nanoscale. Chem. Soc. Rev. 41, 2718–2739 (2012).
-
Joshi, B. S., de Beer, M. A., Giepmans, B. N. G. & Zuhorn, I. S. Endocytosis of extracellular vesicles and release of their cargo from endosomes. ACS Nano 14, 4444–4455 (2020).
-
Bompard, G., Sharp, S. J., Freiss, G. & Machesky, L. M. Involvement of Rac in actin cytoskeleton rearrangements induced by MIM-B. J. Cell Sci. 118, 5393–5403 (2005).
-
Dawson, J. C., Bruche, S., Spence, H. J., Braga, V. M. & Machesky, L. M. Mtss1 promotes cell-cell junction assembly and stability through the small GTPase Rac1. PLoS ONE 7, e31141 (2012).
-
Koivusalo, M. et al. Amiloride inhibits macropinocytosis by lowering submembranous pH and preventing Rac1 and Cdc42 signaling. J. Cell Biol. 188, 547–563 (2010).
-
Toyama, Y., Kontani, K., Katada, T. & Shimada, I. Decreased conformational stability in the oncogenic N92I mutant of Ras-related C3 botulinum toxin substrate 1. Sci. Adv. 5, eaax1595 (2019).
-
Wu, Z. et al. Programmed genome editing by a miniature CRISPR-Cas12f nuclease. Nat. Chem. Biol. 17, 1132–1138 (2021).
-
Mattila, P. K., Salminen, M., Yamashiro, T. & Lappalainen, P. Mouse MIM, a tissue-specific regulator of cytoskeletal dynamics, interacts with ATP-actin monomers through its C-terminal WH2 domain. J. Biol. Chem. 278, 8452–8459 (2003).
-
Saarikangas, J. et al. Missing-in-metastasis MIM/MTSS1 promotes actin assembly at intercellular junctions and is required for integrity of kidney epithelia. J. Cell Sci. 124, 1245–1255 (2011).
-
Maddugoda, M. P. et al. cAMP signaling by anthrax edema toxin induces transendothelial cell tunnels, which are resealed by MIM via Arp2/3-driven actin polymerization. Cell Host Microbe 10, 464–474 (2011).
-
Kim, N. et al. Repulsive Sema3E-Plexin-D1 signaling coordinates both axonal extension and steering via activating an autoregulatory factor, Mtss1. Elife 13, e96891 (2024).
-
Senju, Y. et al. Actin-rich lamellipodia-like protrusions contribute to the integrity of epithelial cell-cell junctions. J. Biol. Chem. 299, 104571 (2023).
-
Sedgwick, A. E., Clancy, J. W., Olivia Balmert, M. & D’Souza-Schorey, C. Extracellular microvesicles and invadopodia mediate non-overlapping modes of tumor cell invasion. Sci. Rep. 5, 14748 (2015).
-
de Jong, O. G. et al. A CRISPR-Cas9-based reporter system for single-cell detection of extracellular vesicle-mediated functional transfer of RNA. Nat. Commun. 11, 1113 (2020).
-
Zhang, C. & Schekman, R. Syncytin-mediated open-ended membrane tubular connections facilitate the intercellular transfer of cargos including Cas9 protein. Elife 12, e84391 (2023).
-
Heath, N. et al. Endosomal escape enhancing compounds facilitate functional delivery of extracellular vesicle cargo. Nanomedicine 14, 2799–2814 (2019).
-
Ci, Y., Yang, Y., Xu, C. & Shi, L. Vesicular stomatitis virus G protein transmembrane region is crucial for the hemi-fusion to full fusion transition. Sci. Rep. 8, 10669 (2018).
-
Maeda, K., Goto, S., Miura, K., Saito, K. & Morita, E. The incorporation of extracellular vesicle markers varies among vesicles with distinct surface charges. J. Biochem. 175, 299–312 (2024).
-
Tzelepis, K. et al. A CRISPR dropout screen identifies genetic vulnerabilities and therapeutic targets in acute myeloid leukemia. Cell Rep. 17, 1193–1205 (2016).
-
Hoxhaj, G., Dissanayake, K. & MacKintosh, C. Effect of IRS4 levels on PI 3-kinase signalling. PLoS ONE 8, e73327 (2013).
-
Urzì, O., Olofsson Bagge, R. & Crescitelli, R. The dark side of foetal bovine serum in extracellular vesicle studies. J. Extracell. Vesicles 11, e12271 (2022).
-
Eitan, E., Zhang, S., Witwer, K. W. & Mattson, M. P. Extracellular vesicle-depleted fetal bovine and human sera have reduced capacity to support cell growth. J. Extracell. Vesicles 4, 26373 (2015).
-
Sun, C., Liu, L., Vasudevan, H. N., Chang, K. C. & Abate, A. R. Accurate bulk quantitation of droplet digital polymerase chain reaction. Anal. Chem. 93, 9974–9979 (2021).
-
Koyama-Honda, I. et al. Fluorescence imaging for monitoring the colocalization of two single molecules in living cells. Biophys. J. 88, 2126–2136 (2005).
-
Olivier, N., Keller, D., Gönczy, P. & Manley, S. Resolution doubling in 3D-STORM imaging through improved buffers. PLoS ONE 8, e69004 (2013).
-
Tachikawa, M. et al. Measurement of caveolin-1 densities in the cell membrane for quantification of caveolar deformation after exposure to hypotonic membrane tension. Sci. Rep. 7, 7794 (2017).
-
Kalisvaart, D. et al. Precision in iterative modulation enhanced single-molecule localization microscopy. Biophys. J. 121, 2279–2289 (2022).
-
Prakash, K. et al. Resolution in super-resolution microscopy—facts, artifacts, technological advancements and biological applications. J. Cell Sci. 138, jcs263567 (2025).
-
Nishimura, T. & Suetsugu, S. Super-resolution analysis of PACSIN2 and EHD2 at caveolae. PLoS ONE 17, e0271003 (2022).
-
Khater, I. M., Meng, F., Wong, T. H., Nabi, I. R. & Hamarneh, G. Super resolution network analysis defines the molecular architecture of caveolae and caveolin-1 scaffolds. Sci. Rep. 8, 9009 (2018).
-
Cardeñes, B. et al. Cellular integrin α5β1 and exosomal ADAM17 mediate the binding and uptake of exosomes produced by colorectal carcinoma cells. Int. J. Mol. Sci. 22, 9938 (2021).
-
Suetsugu, S., Miki, H. & Takenawa, T. Distinct roles of profilin in cell morphological changes: microspikes, membrane ruffles, stress fibers, and cytokinesis. FEBS Lett. 457, 470–474 (1999).
Acknowledgements
Dr. Chitose Oneyama (Aichi Cancer Center Research Institute) for providing PANC-1 cells, Dr Eiji Morita (Hirosaki University) for CD63 expressing plasmid, and the Life Science Collaboration Center (LiSCo) at Nara Institute of Science and Technology for their technical support, and all members of the laboratory for their technical assistance and helpful discussions. This manuscript was proofread and edited with the assistance of ChatGPT (OpenAI) to improve grammar and clarity. The final content was reviewed and approved by all authors. This work was supported by the JSPS KAKENHI (JP17H03674, JP21H05047, JP20KK0341, JP20H03252, JP24H01286, and JP24K02024) (S.S.), JST CREST (JPMJCR1863 and JPMJCR24B3) (S.S.), JST CREST (JPMJCR24B3) (T.I.), JST CREST (JPMJCR24B3) (K.G.N.S.), Uehara Memorial Foundation (S.S.), Takeda Science Foundation (S.S.), the National Institute of Health (R35GM149329) (T.I.), the National Science Foundation (000819255) (T.I.), JST FOREST Program (JPMJFR2413) (T.N.), JSPS KAKENHI (JP17K07427, JP20K06625 and JP23H02476) (T.N.), and 2021 NAIST University Fellowships for the Creation of Innovation in Science and Technology (T.F.).
Ethics declarations
Competing interests
T.F., T.N., H.K., and S.S. have submitted a patent application to the Japan Patent Office pertaining to the dimerization-induced protein delivery by the protrusion-derived EVs aspects of this work (Application Number (2024)218454). The remaining authors declare no competing interests.
Peer review
Peer review information
Nature Communications thanks the anonymous reviewers for their contribution to the peer review of this work. A peer review file is available.
Additional information
Publisher’s note Springer Nature remains neutral with regard to jurisdictional claims in published maps and institutional affiliations.
Supplementary information
Source data
Rights and permissions
Open Access This article is licensed under a Creative Commons Attribution-NonCommercial-NoDerivatives 4.0 International License, which permits any non-commercial use, sharing, distribution and reproduction in any medium or format, as long as you give appropriate credit to the original author(s) and the source, provide a link to the Creative Commons licence, and indicate if you modified the licensed material. You do not have permission under this licence to share adapted material derived from this article or parts of it. The images or other third party material in this article are included in the article’s Creative Commons licence, unless indicated otherwise in a credit line to the material. If material is not included in the article’s Creative Commons licence and your intended use is not permitted by statutory regulation or exceeds the permitted use, you will need to obtain permission directly from the copyright holder. To view a copy of this licence, visit http://creativecommons.org/licenses/by-nc-nd/4.0/.
About this article

Cite this article
Fujioka, T., Nishimura, T., Kawana, H. et al. Efficient cellular transformation via protein delivery through the protrusion-derived extracellular vesicles. Nat Commun 16, 10900 (2025). https://doi.org/10.1038/s41467-025-66351-1
-
Received:
-
Accepted:
-
Published:
-
Version of record:
-
DOI: https://doi.org/10.1038/s41467-025-66351-1