Introduction
Water kefir (WK) grains, also referred to as tibicos, contain a symbiotic community of bacteria and yeasts used to ferment sugar-rich solutions, to which dried and/or fresh fruits can be added1. The resulting fermentation product is a refreshing, slightly alcoholic beverage containing various microbial metabolites2. WK grains primarily consist of the extracellular polysaccharide (EPS) dextran, which provides structural integrity and enables the transfer of the grains and their microbial community from one fermentation to the next3. Lentilactobacillus hilgardii has been shown to produce dextran and is considered the main contributor to grain growth, although other microbes may also play a role4,5.
The WK microbiome primarily comprises yeasts, lactic acid bacteria (LAB), and acetic acid bacteria (AAB), although other bacteria, such as Zymomonas and bifidobacteria, are also commonly detected6. Yeasts hydrolyze sucrose into glucose and fructose, thereby providing monosaccharides for other members of the community. They are also considered the primary producers of ethanol in WK fermentations and major contributors of volatile esters and higher alcohols. LAB are the main producers of lactic acid and mannitol, while AAB generate various acids, such as acetic acid and gluconic acid, consuming ethanol in the process1,6. The role of Zymomonas in WK is less clear, but it appears comparable to that of yeasts: Zymomonas also hydrolyzes sucrose into glucose and fructose and is well known for its capacity to produce ethanol7,8.
Various studies have investigated WK composition using culture-based approaches, amplicon metagenomics, and shotgun metagenomics6,9,10,11,12,13,14,15. However, fewer studies have examined community dynamics10,11,13. Early profiling of community dynamics by PCR-DGGE in WK grains and beverages lacking Zymomonas, revealed largely stable microbial compositions, with AAB appearing only after 144 h of fermentation10. 16S amplicon-based studies have shown a microbial succession from LAB to AAB in WK fermentations without Zymomonas11. Patel et al.13. investigated the fermentation dynamics of WK dominated by Zymomonas mobilis, observing a largely stable community in both the liquid and grains throughout fermentation and demonstrated that Zymomonas-dominated WK can produce WK with acceptable sensory properties. However, the community dynamics of WK with and without Zymomonas have not been directly compared. In our recent large-scale metagenomics study, we observed the presence of Zymomonas in about a third of WK communities. When present, Zymomonas tended to be highly abundant and to dominate the community6.
Zymomonas is a monotypic genus comprising only the species Zymomonas mobilis, which includes the subspecies Zymomonas mobilis subsp. mobilis and Zymomonas mobilis subsp. pomaceae16. Despite belonging to the same species, the genomes of these subspecies can share less than 95% average nucleotide identity6, a threshold often used to differentiate bacterial species17. For simplicity, we refer to Z. mobilis subsp. pomaceae in this manuscript as Z. pomaceae. Zymomonas has been isolated from sugar-rich sources and alcoholic beverages, and while valued for its high ethanol productivity7, it is considered a contaminant in cider and beer production18. Zymomonas was highly abundant in several WK samples that were shipped fresh but significantly less abundant and often absent in WK that were dried before shipment6, suggesting that the common process of drying WK grains is not well tolerated by Zymomonas.
WK has previously been investigated using shotgun metagenomics6,12 and metabolomics, including volatilomics6,11,13, but has not yet been studied by metaproteomics. While proteomics has been employed to study individual WK microorganisms or microbial pairs19,20, a community-wide metaproteomic analysis remains lacking.
In this study, we combined shotgun metagenomics, metaproteomics, and metabolomics to investigate microbial succession and functional changes in yeast–LAB–AAB and Zymomonas-dominated WK fermentations. We further explored the niche role of Len. hilgardii within WK grains. Finally, by contrasting metagenomic and metaproteomic data, we highlight the underappreciation of yeasts in metagenomics-only analyses of microbial communities.
Results
Metagenomic changes of microbial composition during the first 48 h of fermentation
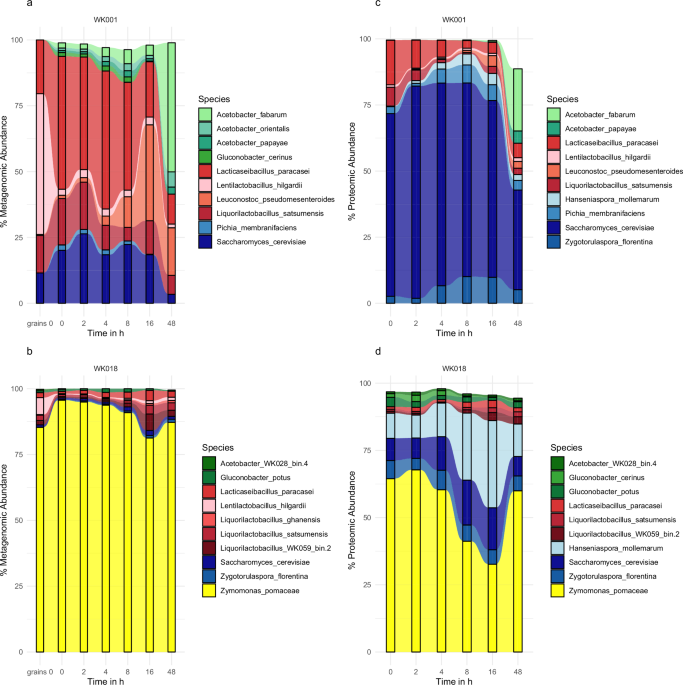
We previously studied the microbial composition of 69 distinct WK beverages by metagenomics after 8 and 48 h of fermentation, as well as the grains6. Based on those results, we selected two WK with distinct community states to study their fermentation dynamics at higher resolution, particularly at the start of fermentation. Shotgun metagenomic sequencing generated 100,887,606 paired-end raw reads. Based on metagenomic analysis, and applying thresholds of at least 35% breadth and a minimum expected-to-observed breadth ratio of 0.75 to confirm species presence, read mapping ranged from 66.93 to 80.90% (mean 76.25%) with a total of 13 species detected in each of the WK (Supplementary Data 1). WK001 showed an Acetobacter-dominated community, while WK018 was dominated by Zymomonas after 48 h of fermentation (Fig. 1a, b).

The top 10 species in WK001 and WK018, as determined by relative taxonomic abundance from metagenomic (a, b) and relative LFQ intensity from metaproteomic (c, d) analysis. Acetic acid bacteria (AAB) are shown in shades of green, lactic acid bacteria (LAB) in shades of red, and yeasts in shades of blue.
In WK001, the following species were detected: Acetobacter fabarum, Acetobacter orientalis, Acetobacter papayae, Gluconobacter albidus, Gluconobacter cerinus, Gluconobacter oxydans, Hanseniaspora mollemarum, Lacticaseibacillus paracasei, Lentilactobacillus hilgardii, Leuconostoc pseudomesenteroides, Liquorilactobacillus satsumensis, Pichia membranifaciens, and Saccharomyces cerevisiae. WK018 showed the presence of Acetobacter fabarum, Acetobacter okinawensis, Acetobacter orientalis, Acetobacter WK028_bin.4, Gluconobacter potus, Lacticaseibacillus paracasei, Lentilactobacillus hilgardii, Liquorilactobacillus ghanensis, Liquorilactobacillus satsumensis, Liquorilactobacillus WK059_bin.2, Saccharomyces cerevisiae, Zygotorulaspora florentina, and Zymomonas pomaceae. Acetobacter WK028_bin.4 and Liquorilactobacillus WK059_bin.2 were, at the time of analysis, predicted to be novel species based on metagenome-assembled genomes6.
The microbial community of WK001 showed compositional changes over the sampled time points (Fig. 1a). The period from 0 to 2 h was characterized by an increase in S. cerevisiae. Between 2 and 4 h, Lac. paracasei increased in abundance. Leu. pseudomesenteroides became more abundant between 4 and 16 h, while A. fabarum was most abundant at 48 h (Fig. 1a).
In contrast, the Zymomonas-dominated fermentation of WK018 remained mostly stable throughout the sampled time points (Fig. 1b). A slight increase in Liq. WK059_bin.2 and Liq. satsumensis was observed between 8 and 16 h (Fig. 1b).
Interestingly, Len. hilgardii was 22.9-fold and 19.0-fold more abundant on grains than in liquid at the start of fermentation for WK001 and WK018, respectively. In contrast, Lac. paracasei was 2.5-fold more abundant in the liquid phase than on grains in WK001 (Fig. 2). These results suggest that Len. hilgardii is strongly attached to the WK grains, while other species, such as Lac. paracasei, may diffuse more easily from the grains into the liquid.
Despite differences in microbial composition (Fig. 1a, b), both WK001 and WK018 exhibited similar pH reductions to 3.9 (Supplementary Fig. 1) and grain biomass increased by 196% after 48 h of fermentation (Supplementary Table 1).

Len. hilgardii shows a strong association with the grains, as evidenced by its higher abundance in grain samples compared to liquid samples.
Metaproteomics reveals the importance of yeasts during the fermentation
While metagenomics provides insights into the potential functional capacity of microbial communities based on gene content, metaproteomics captures functional activity by identifying proteins present at specific time points. This distinction helps to explain apparent discrepancies between the two approaches. Metaproteomic analysis identified 5404 and 4237 protein groups in WK001 and WK018, respectively. In WK001, metaproteomic analysis of species abundance (expressed as % LFQ intensity) revealed that S. cerevisiae was the dominant contributor to the proteome across all sampled time points. The relative protein abundance of Lac. paracasei decreased from 0 to 8 h, whereas proteins associated with AAB, particularly Acetobacter spp., increased between 16 and 48 h (Fig. 1c). In WK018, Z. pomaceae was the primary contributor to the detected proteins, although yeasts remained major contributors throughout the fermentation process (Fig. 1d). The increase in AAB-associated proteins from 16 to 48 h was less pronounced in WK018 compared to WK001 (Fig. 1).
The strong contribution of yeasts, particularly S. cerevisiae and H. mollemarum, to WK fermentations, and their relative underestimation when relying solely on metagenomic analysis, became evident through comparison of metagenomic and metaproteomic abundance data. For instance, in WK001 at 8 h, the metagenomic relative abundance of yeasts (H. mollemarum, P. membranifaciens, S. cerevisiae, and Zyg. florentina) was 24.9%, whereas metaproteomic analysis indicated a much higher relative abundance of 94.3%. Similarly, in WK018 at 16 h, yeasts represented only 2.9% of the community based on metagenomics but accounted for 54.1% of the proteomic profile, an 18-fold difference (Fig. 1). Across all samples from WK001, the average yeast relative abundance was 20.2% by metagenomic and 80.0% by metaproteomic analysis. In WK018, these values were 1.8% and 34.1%, respectively. Due to their larger genomes and cell sizes compared to bacteria, yeasts often show lower taxonomic coverage in metagenomic datasets relative to their read-based or protein-based abundance (Fig. 3a, b). As a result, read-based abundance correlated better (R = 0.57) with metaproteomic abundance than coverage-based abundance (R = 0.46; Fig. 3c).

Spearman’s rank correlation was used to compare a taxonomic abundance (based on genome coverage) and read-based abundance, b taxonomic abundance and metaproteomic abundance and c metaproteomic abundance and read-based abundance. Yeast species exhibited higher protein abundance relative to their metagenomic coverage and read-based abundance, underscoring the limitations of metagenomic approaches in accurately capturing yeast contributions.
Metaproteomic analysis revealed that the production of proteins associated with global metabolic pathways was stable across the fermentation period. Bray–Curtis dissimilarities between consecutive time points were low (WK001: mean 0.038; WK018: 0.025), and start-to-end dissimilarities over 48 h remained modest (WK001: 0.166; WK018: 0.031). Between inocula, dissimilarity at matched time points averaged only 0.057, confirming that global pathway expression was highly comparable despite differences in microbial composition (Fig. 4a and Supplementary Data 1).

Metaproteomic analysis reveals stable and comparable expression of a global metabolic pathways, b carbohydrate metabolism, and c amino acid metabolism in WK001 and WK018 over the first 48 h of fermentation, despite differences in microbial composition. In contrast, d metabolism of cofactors and vitamins shows temporal and between-sample variability, with notable differences between WK001 and WK018. Pathway classifications are based on KEGG level 1.0, 1.1, 1.5, and 1.8, respectively.
This consistency was also evident in carbohydrate and amino acid metabolism, where Bray–Curtis dissimilarities between consecutive timepoints were low (WK001: 0.085 and 0.134; WK018: 0.077 and 0.078, respectively), and start–end dissimilarities over 48 h remained modest, particularly in WK018 (0.086 and 0.025). Between inocula, dissimilarities averaged 0.113 and 0.160, underscoring the conserved expression of these functions (Fig. 4b, c and Supplementary Data 1). In contrast, cofactor and vitamin metabolism showed greater variability (mean consecutive dissimilarity WK001 = 0.196, WK018 = 0.108), with WK001 drifting substantially over 48 h (0.544) and between-inoculum dissimilarities averaging 0.296 (up to 0.576).
The contribution of specific species to proteins involved in metabolic pathways varied over time and was influenced by the structure of the WK microbial community (Fig. 5 and Supplementary Fig. 7). For example, in WK001 at 48 h, S. cerevisiae was the primary contributor to proteins associated with carbon metabolism, while A. fabarum was the main contributor to amino acid biosynthesis (Fig. 5). At the same time point, Leu. pseudomesenteroides exhibited the highest contribution to ribosomal protein production. In contrast, in WK018 at 48 h, contributions to proteins involved in carbon metabolism and amino acid biosynthesis were more evenly distributed between yeasts and Z. pomaceae (Fig. 5).

Metaproteomic analysis of selected metabolic pathways at 48 h, visualized as a heatmap with each pathway scaled to 100% relative species contribution. Only the 11 species with the highest cumulative contributions across these pathways are shown.
NMR metabolomics reveals inoculum specific metabolic differences
NMR-based metabolomics analysis enabled the detection of 29 metabolites in the WK samples (Supplementary Data 1). As expected, ethanol and organic acids accumulated over the course of fermentation, while sugar concentrations progressively declined (Fig. 6; Supplementary Figs. 2 and 3). WK018, dominated by Zymomonas, displayed lower concentrations of glucose and fructose compared to WK001 (Fig. 6 and Supplementary Fig. 2). After 48 h of fermentation, ethanol concentrations reached 120 mM in WK001 and 346 mM in WK018, corresponding to 0.7% and 2.0% alcohol by volume (ABV), respectively (Supplementary Fig. 2). Acetate began accumulating earlier than lactate in both fermentations, peaking at 16 h before declining by 48 h. In contrast, lactate concentrations continued to rise, reaching their highest levels at 48 h (Supplementary Fig. 3).

Row-scaled NMR-based metabolite abundances across media, WK001, and WK018 conditions revealed dynamic temporal shifts and inoculum-dependent metabolic differences over the 48 h fermentation period.
Correlation analysis identified several positive and negative correlations between metagenomic species abundance and the metabolites acetoin and glycylproline (Supplementary Fig. 4a). Notably, acetoin and glycylproline accumulated to higher levels in WK018 compared to WK001 (Fig. 6). Consistently, species positively correlated with these metabolites were more abundant in WK018, while those negatively correlated were enriched in WK001, based on metagenomic data. Metaproteomics revealed several negative correlations between formate and several AAB (Supplementary Fig. 4b).
Principal coordinates analysis (PCoA) based on both Canberra and Euclidean distance metrics revealed distinct clustering of samples according to fermentation time and inoculum type (Fig. 7a, b). The Euclidean distance, which emphasizes absolute differences through squared values, showed a stronger separation between WK001 and WK018 at 48 h. In contrast, the Canberra distance, which considers relative differences, showed better separation by time.

Principal coordinates analysis based on Canberra a and Euclidean b distances for NMR-derived metabolite profiles, and Canberra c and Euclidean d distances for volatile organic compound (VOC) profiles. The analysis shows separation of samples over time and between the different inocula.
Volatile organic compound (VOC) profiles reflect inoculum-specific fermentation dynamics
VOCs were examined in addition to the general metabolites (NMR analysis). The VOC profiles of WK were characterized primarily by the accumulation of volatile esters and alcohols, with a minor contribution from organic acids (Fig. 8 and Supplementary Fig. 5). WK001 primarily accumulated volatile alcohols, such as 3-methyl-1-butanol, 2-methyl-1-butanol, and ethanol (Supplementary Figs. 5 and 6). In contrast, WK018 exhibited a peak in volatile alcohols at 8 h, followed by a decline over time. Among esters, ethyl acetate was the most abundant in WK018, followed by ethyl octanoate and β-phenylethyl acetate. The most abundant alcohol in WK018 was 3-methyl-1-butanol (Supplementary Data 1), indicating distinct VOC dynamics between the inocula. The acids 2-methylpropanoic acid and 3-methylbutanoic acid accumulated in WK001 but were absent in WK018. In contrast, acetaldehyde (aldehyde) and n-propyl acetate (ester) accumulated in WK018 but were absent in WK001 (Supplementary Data 1).

Stacked bar plots showing the abundance of volatile acids, alcohols, and esters in VOC profiles over time. At 48 h, WK001 is predominantly characterized by alcohols, whereas WK018 is dominated by esters. All compound abundances are presented in relative units (RU).
Volatile compounds specific to WK018, such as ethyl acetate and acetaldehyde, exhibited strong positive correlations with microbial species abundances in WK018 in both metagenomic and metaproteomic datasets (Fig. 9a, b). These correlations were not observed with species abundant in WK001, highlighting inoculum-specific microbial contributions to VOC production.

Spearman correlation analysis between species abundance and volatile organic compounds (VOCs) detected by GC-MS. a Correlations based on metagenomic species abundance. b Correlations based on metaproteomic species abundance.
Consistent with the trends observed in the metabolite analysis, PCoA of VOC profiles using both Canberra and Euclidean distance metrics revealed distinct clustering of samples by fermentation time and inoculum type (Fig. 7c, d). Euclidean distance, which emphasizes absolute differences through squared values, showed a separation between inocula at 48 h. In contrast, the Canberra distance, which is weighted by relative magnitudes, shows a better separation by sampling time.
Discussion
The divergent microbial succession patterns in WK001 and WK018 may, in part, be attributed to differences in sucrose utilization strategies employed by their dominant fermenters. In WK001, S. Cerevisiae likely plays a pivotal role in shaping community development by hydrolyzing sucrose into glucose and fructose via invertase enzymes (SUC2), which are secreted into the periplasmic space21,22. This extracellular activity generates a pool of freely accessible monosaccharides that can be utilized by LAB and AAB1, supporting a dynamic and cooperative succession process (Fig. 1a). Additionally, certain LAB, such as Len. hilgardii are known to express extracellular dextransucrases, which convert sucrose into the glucose polymer dextran, while releasing free fructose4,5,19. These interactions contribute to a shared metabolic environment conducive to microbial diversity.
In contrast, WK018, dominated by Zymomonas, displayed lower concentrations of glucose and fructose, suggesting reduced availability of these sugars to other community members, in particular LAB and AAB. Zymomonas expresses sucrases (SacC), which cleave sucrose into glucose and fructose in the periplasmic space23, and levansucrases, which transfer the fructosyl group from sucrose to the EPS levan, releasing glucose24. Notably, Zymomonas possesses a high affinity glucose transport system (glucose Km = 13 mM; fructose Km = 200 mM25), and preferentially consumes glucose over fructose25. Due to its high metabolic flux, Zymomonas depletes sugars from the environment more efficiently than Saccharomyces26, potentially consuming equal to one-third of its biomass in glucose per minute27. This faster mode of sugar utilization by Zymomonas likely reduces opportunities for cross-feeding, leading to the more constrained and self-sustaining community structure observed in WK018 (Fig. 1b). Although Zymomonas’ high ethanol production may support AAB growth at later fermentation stages, these were not captured within the timeframe of this study. These contrasting metabolic strategies highlight how early-dominant taxa can shape resource availability and interspecies interactions, promoting either open, cooperative networks or closed, competitive environments. Such functional traits likely underpin the observed differences in ecological succession and community stability during WK fermentation.
In both WK001 and WK018 communities, Len. hilgardii was more abundant on the WK grains than in the surrounding liquid, indicating a strong attachment to the grain matrix (Fig. 2). In contrast, Lac. paracasei appeared to disperse more readily into the liquid phase. These observations support a niche partitioning model, in which Len. hilgardii functions as a grain-associated specialist, while Lac. paracasei occupies a more planktonic niche. The strong attachment of Len. hilgardii to the grain matrix reinforces its proposed role as a key species for grain growth, consistent with prior reports showing its ability to produce the EPS that forms the structural scaffold of WK grains4 and its strong positive correlation with grain biomass among 69 characterized WK microbiomes6.
Metagenomic sequencing offers valuable insights into the taxonomic composition and functional potential of microbial communities. However, it does not necessarily reflect the actual functional contributions of individual taxa, as gene presence does not guarantee protein expression, and expression levels can vary significantly both within and across species. In our study, we observed a divergence between taxonomic profiles derived from metagenomics and the protein abundances measured by metaproteomics, particularly with regard to yeast species (Figs. 1 and 3). In both WK001 and WK018, yeasts contributed to a 4- and 19-fold greater abundance of proteins than would be inferred from metagenomic data. This discrepancy, commonly reported in multi-omics studies, highlights the limitations of relying solely on DNA-based methods to infer relative microbial activity or ecological function28,29.
Several factors can contribute to the underrepresentation of the importance of yeasts in our metagenomic datasets. First, the substantial differences in genome size and cell volume between yeasts and bacteria could influence their relative contributions to community function. For instance, S. cerevisiae possesses a genome of approximately 12.1 Mb (GCF_000146045.2) and a cell volume of 30–70 µm³ during bud initiation30, whereas typical bacteria genomes and cell volumes are considerably smaller. The model bacterium Escherichia coli, for example, has a genome size of 4.6–5.6 Mb (GCF_000005845.2 and GCF_000008865.2) and a cell volume of 0.46–0.71 µm³ 31. Thus, S. cerevisiae has an estimated cell volume approximately 42- to 152-fold greater than E. coli. Given these differences, it is reasonable to infer that a single yeast cell may exert a disproportionately larger metabolic impact on fermentation compared to a bacterial cell. In addition, methodological bias in sample preparation protocols for metagenomic and metaproteomic workflows can influence taxonomic representation32,33. For instance, DNA extraction protocols using chemical and mechanical lysis may be less effective for yeasts than enzymatic lysis methods32. Similar biases may affect protein extraction and detection efficiency33. These findings reinforce the importance of integrating multi-omics approaches to accurately characterize microbial ecosystems. While metagenomics provides a structural and functional blueprint of the community, it may not capture the functional significance of specific taxa. Metaproteomics, by contrast, offers a more direct readout of protein expression, providing insights into the active metabolic roles of community members. Together, these complementary methods yield a more comprehensive understanding of microbial community structure, function, and dynamics.
Despite different community structures, both WK fermentations showed comparable reductions in pH and similar grain growth. Moreover, core metabolic functions, such as global metabolic pathways, amino acid metabolism, and carbohydrate metabolism were conserved at community level across both WK fermentations and remained largely stable over the sampling period (Fig. 4a–c). This conservation of fundamental metabolic activity is further supported by the observation that only two metabolites showed significant correlations with metagenomic species abundance (Supplementary Fig. 4a). Major metabolites of the WK fermentation, such as acetate, lactate, ethanol, sucrose, glucose and fructose mostly lack any significant correlations on the species level (Supplementary Fig. 4). These findings are consistent with previous studies reporting the conservation of core metabolic features in WK, even when initiated with different inocula6, highlighting the presence of functional redundancy and overall robustness within the microbial community.
In contrast, more specialized metabolic processes, such as cofactor and vitamin metabolism exhibited greater variation between community structures and over time (Fig. 4d). Similarly, we observed a higher number of significant correlations between volatile organic compounds and microbial species (Fig. 9), suggesting that distinct WK communities could be designed to produce diverse flavor profiles while maintaining conserved core metabolic functions. These differences in specialized metabolites, such as vitamins, could be of importance if WK grains are used in clinical studies to investigate specific health outcomes. Beyond community-level metabolism, metaproteomics enables the analysis of species-specific contributions to metabolic functions, providing additional insights into microbial interactions and resource-sharing dynamics. While microbial interactions have been explored for select combinations of yeast and LAB20,34, comprehensive studies encompassing broader community compositions remain limited.
In this study, we demonstrated the microbial stability of inocula containing Zymomonas, in contrast to the microbial succession observed within yeast-LAB-AAB communities. Despite microbial composition differences, core metabolic functions and associated products remain conserved across these communities, whereas certain metabolites, such as VOCs, exhibit species-specific patterns. These findings offer novel insights into the rational design of WK starter cultures, enabling the development of fermentations with consistent performance and tailored flavor profiles. Moreover, this work provides a conceptual and methodological framework applicable to the study and optimization of microbial communities in other fermented foods.
Methods
Two WK communities, WK001 and WK018, were sourced from private households in Ireland and the United Kingdom, respectively6.
Fermentations were performed following the protocol described by Breselge et al.6 with the following modifications: fermentations were set up in parallel, with two independent replicates for each community (WK001 and WK018). Each fermentation was carried out in a 1 L bottle containing 750 ml of WK media. Bottles were sealed with lids fitted with 0.2 μm membrane filters to allow gas exchange while preventing contamination. Fermentations were inoculated with 45 g of WK grains and incubated at 21 °C. The 0 h liquid samples were collected approximately 10 min after inoculation. Grain samples were obtained from the inoculum prior to the start of fermentation.
DNA extractions, library preparations and sequencing
Metagenomic DNA was extracted from 15 ml of WK liquid or 100 mg WK grains using the DNeasy PowerSoil Pro Kit (Qiagen, 47016) following the protocol described in Breselge et al.6. Library preparation was performed using the Nextera XT DNA Library Preparation Kit (Illumina, FC-131-1096) and Nextera XT Index Kit v2 (Illumina, FC-131-200X), according to manufacturer’s instructions. Prepared libraries were sequenced on an Illumina NextSeq500 platform using the 300-cycle High Output v2 kit.
Bioinformatics
Raw sequencing reads were processed using MetaWRAP (v1.3.235) for quality control and removal of host-derived sequences by mapping against the human reference genome (hg38). Clean reads were used for taxonomic profiling with inStrain (36), employing a custom WK-specific reference database as previously described in Breselge et al.6.
Metaproteomics
Protein extraction and sample preparation were performed using the suspension trapping (STrap) protocol, following previously described methods37,38,39 with minor modifications for application to WK. Briefly, 4 mL of each sample, prepared in duplicate, was centrifuged at 13,600 × g for 10 min at 4 °C, and pellets were washed with Ringer solution. The cell pellet was then resuspended in 150 µL of lysis buffer (4% SDS, 100 mM Tris–HCl, 10 mM DTT), and the samples were lysed by bead beating (0.2 g of 106 μm glass beads, 140 U.S. sieve, Sigma, 3 cycles at 6.5 m/s for 60 s; FastPrep-24™). Subsequently, the lysate was centrifuged at 13,600 × g for 10 min, and the supernatant was sonicated (240 W for 3 min no heating, Bransonic Ultrasonic Cleaner, Model 2510E-MTH, Danbury, CT, USA). Protein concentration was measured using a NanoDrop One spectrophotometer (Thermo Scientific, Madison, WI, USA) and adjusted to 0.3 mg/mL. Briefly, 20 μL of the suspension (30 μg of protein) was incubated at 95 °C for 10 min (SimpliAmp™ Thermal Cycler, Applied Biosystems, Life Technologies), then cooled to room temperature. Alkylation was performed with 100 mM iodoacetamide for 20 min at room temperature in the dark. The samples were acidified with 12.15% phosphoric acid. Acidified samples were combined with 160 μL of STrap solution (1:10 methanol, 100 mM Tris-HCl, pH 7.1) and loaded into pipette-tip columns (Eppendorf Research Plus, G-3 pack) containing C18 resin (2215–C18, Empore, CDS, Oxford, PA, USA) and micro-quartz fiber paper (Ahlstrom Munksjö, Helsinki, Finland).
Peptides were sequenced using LC-MS/MS. Briefly, dried peptides were reconstituted in loading buffer (0.05% trifluoroacetic acid, 2% acetonitrile), sonicated at 240 W for 10 min without heating, and adjusted to a final concentration of 0.2 mg/mL. Peptide separation and analysis were conducted on a nanoElute UPLC system (Bruker) coupled to a timsTOF Pro mass spectrometer, following the protocol described by Porcellato et al.38. Chromatographic separation was achieved using a PepSep Reprosil C18 column (25 cm × 75 µm, 1.5 µm, 100 Å) at 50 °C with a 99-min gradient. The mass spectrometer operated in PASEF mode with previously reported parameters, including a mass range of 100–1700 m/z, 10 PASEF ramps per cycle, and CID energy ranging from 27 to 45 eV.
Raw LC-MS/MS data were processed using MaxQuant (version 2.0.3.1), employing the label-free quantification (LFQ) algorithm. The false discovery rates were set to 0.01 at both peptide and protein levels. Protein identification required a minimum of two peptides, at least one unique and one unmodified, following criteria outline by Cox et al.40, Smaczniak et al.41, and Wendrich et al.42. LFQ intensities were log2-transformed and analyzed in technical duplicates.
For database construction, clean metagenomic reads from multiple time points were merged for each WK sample and co-assembled into contigs using metaSPAdes43. Contigs longer than 5000 bp were classified as prokaryotic or eukaryotic using EukRep44. Prokka45 was used to annotate predicted protein sequences from prokaryotic contigs, while YGAP46 was applied to eukaryotic contigs. Taxonomy assignments of predicted protein sequences were performed using a custom TBLASTN47 database, based on previously identified species.
The “ProteinGroups” output file from MaxQuant was used for downstream analysis. Contaminants and reverse identifications were removed, and only proteins consistently detected in duplicate samples were included. Normalized LFQ intensities were analyzed in RStudio, and proteins were annotated based on biological processes using the UniProt database and Gene Ontology databases. For putative identification, BLAST search against the UniProt were conducted, with top-scoring hit (preferably reviewed entries from Swiss-Prot) used for protein annotation.
Metabolite analysis
Metabolite analysis was performed as previously described in ref.6. In brief, one sample per time point for each WK, along with one media control, was prepared by centrifugation and filtration, followed by ¹H-NMR analysis using a 600-MHz spectrometer. Spectra were processed with Chenomx NMR Suite (v7.7), and 29 metabolites were identified and quantified using the Chenomx 600-MHz Library and the Human Metabolome Database.
Volatile organic compound (VOC) analysis
VOC analysis was performed as previously described in ref. 6. In brief, one sample per time point for each WK, as well as one media control, was analyzed in technical triplicate and averaged. VOCs were extracted using headspace SPME and analyzed by GC-MS. Compounds were identified by comparison with spectral libraries and authentic standards, and data were processed using the MetaMS pipeline.
Statistical analysis
All statistical analysis and data visualization were performed in R (version 4.3.3). Relative species abundance was calculated based on taxonomic coverage48. If not otherwise indicated, metagenomics and metaproteomics data are the average of two parallel fermentation replicates. Data were visualized using the ggplot2 and pheatmap packages. Hierarchical clustering was conducted using complete linkage. Beta diversity and PCoA were computed using the vegan package. Spearman’s rank correlation was used for association analysis, with p-value adjusted for multiple testing using the Benjamini–Hochberg method. Statistical significance was reported as: p < 0.05 (*), p < 0.01 (**), and p < 0.001 (***).
Data availability
The shotgun metagenomics sequences for water kefir have been deposited under BioProject accession number PRJNA1023503. All additional data supporting the findings of this study, including those used to generate figures and results, are provided Supplementary Data 1 available in the online version of this manuscript. Code is made available at https://github.com/Samuel-Breselge/2025_Water_Kefir_Multi-omics.
References
-
Lynch, K. M. et al. An update on water kefir: microbiology, composition and production. Int. J. Food Microbiol. 345, 109128 (2021).
-
Bozkir, E. et al. Challenges in water kefir production and limitations in human consumption: a comprehensive review of current knowledge. Heliyon 10, e33501 (2024).
-
Fels, L. et al. Structural characterization of the exopolysaccharides from water kefir. Carbohydr. Polym. 189, 296–303 (2018).
-
Waldherr, F. W. et al. Identification and characterization of a glucan-producing enzyme from Lactobacillus hilgardii TMW 1.828 involved in granule formation of water kefir. Food Microbiol. 27, 672–678 (2010).
-
Bechtner, J. et al. Identification and comparison of two closely related dextransucrases released by water kefir borne Lactobacillus hordei TMW 1.1822 and Lactobacillus nagelii TMW 1.1827. Microbiology 165, 956–966 (2019).
-
Breselge, S. et al. The core microbiomes and associated metabolic potential of water kefir as revealed by pan multi-omics. Commun. Biol. 8, 415 (2025).
-
Panesar, P. S., Marwaha, S. S. & Kennedy, J. F. Zymomonas mobilis: an alternative ethanol producer. J. Chem. Technol. Biotechnol. 81, 623–635 (2006).
-
Liu, L. et al. The potential use of Zymomonas mobilis for the food industry. Crit. Rev. Food Sci. Nutr. 64, 4134–4154 (2024).
-
Laureys, D. et al. The buffer capacity and calcium concentration of water influence the microbial species diversity, grain growth, and metabolite production during water kefir fermentation. Front. Microbiol. 10, 2876 (2019).
-
Laureys, D. & De Vuyst, L. Microbial species diversity, community dynamics, and metabolite kinetics of water kefir fermentation. Appl. Environ. Microbiol. 80, 2564–2572 (2014).
-
Arrieta-Echeverri, M. C. et al. Multi-omics characterization of the microbial populations and chemical space composition of a water kefir fermentation. Front. Mol. Biosci. 10, 1223863 (2023).
-
Verce, M., De Vuyst, L. & Weckx, S. Shotgun metagenomics of a water kefir fermentation ecosystem reveals a novel Oenococcus species. Front. Microbiol. 10, 479 (2019).
-
Patel, S. H. et al. A temporal view of the water kefir microbiota and flavour attributes. Innov. Food Sci. Emerg. Technol. 80, 103084 (2022).
-
Leech, J. et al. Fermented-food metagenomics reveals substrate-associated differences in taxonomy and health-associated and antibiotic resistance determinants. mSystems 5, e00522-20 (2020).
-
Yerlikaya, O., Akan, E. & Kinik, Ö. The metagenomic composition of water kefir microbiota. Int. J. Gastron. Food Sci. 30, 100621 (2022).
-
Oren, A. & Garrity, G. Notification of changes in taxonomic opinion previously published outside the IJSEM. Int. J. Syst. Evolut. Microbiol. 70, 4061–4090 (2020).
-
Riesco, R. & Trujillo, M. E. Update on the proposed minimal standards for the use of genome data for the taxonomy of prokaryotes. Int. J. Syst. Evol. Microbiol. 74, 006300 (2024).
-
Sahm, H., Bringer-Meyer, S. & Sprenger, G.A. The genus Zymomonas. in The Prokaryotes: Proteobacteria: Alpha and Beta Subclasses Vol. 5 (eds Dworkin, M. et al.) 201–221 (Springer, 2006).
-
Bechtner, J. et al. Living the sweet life: how Liquorilactobacillus hordei TMW 1.1822 changes its behavior in the presence of sucrose in comparison to glucose. Foods 9, 1150 (2020).
-
Bechtner, J. et al. Proteomic analysis of Lactobacillus nagelii in the presence of Saccharomyces cerevisiae isolated from water kefir and comparison with Lactobacillus hordei. Front. Microbiol. 10, 325 (2019).
-
Marten, M. R. & Seo, J.-H. Localization of cloned invertase in Saccharomyces cerevisiae directed by the SUC2 and MFα1 signal sequences. Biotechnol. Bioeng. 34, 1133–1139 (1989).
-
Lagunas, R. Sugar transport in Saccharomyces cerevisiae. FEMS Microbiol. Rev. 10, 229–242 (1993).
-
Kannan, R. et al. Molecular cloning and characterization of the extracellular sucrase gene (sacC) of Zymomonas mobilis. Arch. Microbiol. 163, 195–204 (1995).
-
Santos-Moriano, P. et al. Levan versus fructooligosaccharide synthesis using the levansucrase from Zymomonas mobilis: effect of reaction conditions. J. Mol. Catal. B Enzym. 119, 18–25 (2015).
-
Parker, C. et al. Kinetics of sugar transport and phosphorylation influence glucose and fructose cometabolism by Zymomonas mobilis. Appl. Environ. Microbiol. 63, 3519–3525 (1997).
-
Abate, C. et al. Ethanol production by a mixed culture of flocculent strains of Zymomonas mobilis and Saccharomyces sp. Appl. Microbiol. Biotechnol. 45, 580–583 (1996).
-
Snoep, J. L. et al. Control of glycolytic flux in Zymomonas mobilis by glucose 6-phosphate dehydrogenase activity. Biotechnol. Bioeng. 51, 190–197 (1996).
-
Wang, W. -L. et al. Application of metagenomics in the human gut microbiome. World J. Gastroenterol. 21, 803 (2015).
-
Lin, H. et al. Proteomics and the microbiome: pitfalls and potential. Expert Rev. Proteom. 16, 501–511 (2019).
-
Johnston, G. C. et al. Regulation of cell size in the yeast Saccharomyces cerevisiae. J. Bacteriol. 137, 1–5 (1979).
-
Kubitschek, H. E. Cell volume increase in Escherichia coli after shifts to richer media. J. Bacteriol. 172, 94–101 (1990).
-
Keisam, S. et al. Quantifying the biases in metagenome mining for realistic assessment of microbial ecology of naturally fermented foods. Sci. Rep. 6, 34155 (2016).
-
Leary, D. H. et al. Which metaproteome? The impact of protein extraction bias on metaproteomic analyses. Mol. Cell. Probes 27, 193–199 (2013).
-
Stadie, J. et al. Metabolic activity and symbiotic interactions of lactic acid bacteria and yeasts isolated from water kefir. Food Microbiol. 35, 92–98 (2013).
-
Uritskiy, G. V., DiRuggiero, J. & Taylor, J. MetaWRAP—a flexible pipeline for genome-resolved metagenomic data analysis. Microbiome 6, 1–13 (2018).
-
Olm, M. R. et al. InStrain profiles population microdiversity from metagenomic data and sensitively detects shared microbial strains. Nat. Biotechnol. 39, 727–736 (2021).
-
Moreira, L.d.P.D. et al. Interactions between Starmerella bacillaris and Saccharomyces cerevisiae during sequential fermentations influence the release of yeast mannoproteins and impact the protein stability of an unstable wine. Food Chem. 440,138311 (2024).
-
Porcellato, D. et al. Impact of microbial milk quality on mesophilic starter culture metabolism: a metaproteomics approach. Int. Dairy J. 159, 106070 (2024).
-
da Silva Duarte, V. et al. Database selection for shotgun metaproteomic of low-diversity dairy microbiomes. Int. J. Food Microbiol. 418, 110706 (2024).
-
Cox, J. et al. Accurate proteome-wide label-free quantification by delayed normalization and maximal peptide ratio extraction, termed MaxLFQ. Mol. Cell. Proteom. 13, 2513–2526 (2014).
-
Smaczniak, C. et al. Proteomics-based identification of low-abundance signaling and regulatory protein complexes in native plant tissues. Nat. Protoc. 7, 2144–2158 (2012).
-
Wendrich, J. R. et al. In vivo identification of plant protein complexes using IP-MS/MS. in Plant Hormones: Methods and Protocols (eds Kleine-Vehn, J. & Sauer, M.) 147–158 (Springer, 2017).
-
Nurk, S. et al. metaSPAdes: a new versatile metagenomic assembler. Genome Res. 27, 824–834 (2017).
-
West, P. T. et al. Genome-reconstruction for eukaryotes from complex natural microbial communities. Genome Res. 28, 569–580 (2018).
-
Seemann, T. Prokka: rapid prokaryotic genome annotation. Bioinformatics 30, 2068–2069 (2014).
-
Proux-Wéra, E. et al. A pipeline for automated annotation of yeast genome sequences by a conserved-synteny approach. BMC Bioinform. 13, 237 (2012).
-
Gertz, E. M. et al. Composition-based statistics and translated nucleotide searches: Improving the TBLASTN module of BLAST. BMC Biol. 4, 41 (2006).
-
Sun, Z. et al. Challenges in benchmarking metagenomic profilers. Nat. Methods 18, 618–626 (2021).
Acknowledgements
The P.D.C. laboratory acknowledges support from the European Union’s Horizon 2020 research and innovation programme through the MASTER project (Grant No. 818368). Additional funding was provided by Science Foundation Ireland (SFI) under Grant No. SFI/12/RC/2273_P2 for APC Microbiome Ireland, and jointly with the Irish Department of Agriculture, Food and the Marine through the VistaMilk project (Grant No. SFI/16/RC/3835). Support was also received through the Food for Health Ireland (FHI)-3 initiative (Grant No. TC/2018/0025), funded by Enterprise Ireland in partnership with industry collaborators; the Institute for the Advancement of Food and Nutritional Sciences (Grant No. NA-AGFOODDEVELAUTH20201216) and the European Union’s Horizon Europe research and innovation programme under grant agreement No 101060218, DOMINO—“Harnessing the microbial potential of fermented foods for healthy and sustainable food systems”. L.B. and X.Y. gratefully acknowledge funding from HRB/SFI under the US-Ireland R&D Partnership Programme (Grant No. USIRL-2019-1). L. de P.D.M. and D.P. gratefully acknowledge financial support from the Faculty of Chemistry, Biotechnology and Food Sciences at NMBU. We are grateful to the staff responsible for maintaining the Teagasc high-performance computing cluster.
Ethics declarations
Competing interests
The laboratory directed by P.D.C. has received research funding from FrieslandCampina, PrecisionBiotics Group, PepsiCo, and Danone. P.D.C. has also received support from PepsiCo, Arla, Danone, Yakult, AG1, and H&H to attend and speak at scientific conferences. In addition, P.D.C. is a co-founder and serves as Head of Microbiology of SeqBiome. S.B. and P.D.C. have filed a patent application related to the production of water kefir using pitched microbial communities.
Additional information
Publisher’s note Springer Nature remains neutral with regard to jurisdictional claims in published maps and institutional affiliations.
Supplementary information
Rights and permissions
Open Access This article is licensed under a Creative Commons Attribution-NonCommercial-NoDerivatives 4.0 International License, which permits any non-commercial use, sharing, distribution and reproduction in any medium or format, as long as you give appropriate credit to the original author(s) and the source, provide a link to the Creative Commons licence, and indicate if you modified the licensed material. You do not have permission under this licence to share adapted material derived from this article or parts of it. The images or other third party material in this article are included in the article’s Creative Commons licence, unless indicated otherwise in a credit line to the material. If material is not included in the article’s Creative Commons licence and your intended use is not permitted by statutory regulation or exceeds the permitted use, you will need to obtain permission directly from the copyright holder. To view a copy of this licence, visit http://creativecommons.org/licenses/by-nc-nd/4.0/.
About this article

Cite this article
Breselge, S., de Paula Dias Moreira, L., Skibinska, I. et al. Water kefir multi-omics reveals functional redundancies despite taxonomic differences and the underappreciated contribution of yeast. npj Sci Food 9, 265 (2025). https://doi.org/10.1038/s41538-025-00624-3
-
Received:
-
Accepted:
-
Published:
-
Version of record:
-
DOI: https://doi.org/10.1038/s41538-025-00624-3