Introduction
Prickly ash is a perennial deciduous small tree of Rutaceae and Zanthoxylum, of both medicinal and edible value. It has been listed as one of the characteristic economic forest tree species cultivated in China1. With the optimization and upgrading of China ‘s agricultural industrial structure and the advancement of the Grain for Green Project, prickly ash has emerged as a dominant tree species, with its rich germplasm resources, broad development prospects, and strong stress resistance. It plays a vital role in many aspects, such as the remediation of barren hills, the improvement of ecological environment, poverty alleviation, and the implementation of rural revitalization strategy2. There are about 250 species of prickly ashin the world. As one of the important distribution areas of Zanthoxylum, China has abundant prickly ashplant resources, including about 50 species, 13 varieties, and 2 variants3. China has a long cultivation history of prickly ash. Because of its complex variation characteristics and its adaptation to various ecological environments in the long-term evolution process, it has formed rich ecological types. After a long period of natural selection and artificial targeted cultivation, 60 cultivated varieties and types have now been derived, among which the representative ones include Da Hong Pao, Xiao Hong Pao, Thornless Pepper, White Sand Pepper, Qin ‘an No.1, Jujube Pepper, and Bean Pepper, among others4. However, at present, the classification and naming of prickly ash resources in various regions mostly follow traditional common names, which leads to issues such as ambiguous definition of group concepts, unclear interspecific boundary, unclear genetic background and genetic relationship of intraspecific/interspecific populations5, and the phenomenon of homonym and homonymous foreign body, which hinders the efficiency of systematic identification and development and utilization of germplasm resources6. Moreover, the molecular genetic research foundation of prickly ash is relatively weak, and its development level lags substantially behind that of spicy crops, such as Capsicum annuum7. Therefore, utilizing molecular biology techniques, precisely and efficiently identifying the germplasm of prickly ash at the genetic level is proving to be crucial in accelerating genetic improvement, preservation, and utilization of core resources.
Based on the study of the genetic diversity of various species, the widely used molecular markers currently include RAPD, AFLP, ISSR, ITS, SSR, among others8. Simple sequence repeats (SSR), also known as microsatellite sequences, generally refer to repeated DNA fragments formed by tandem bases of 2 ~ 5 bp (in a few cases, 1 ~ 6 bp) length9. According to their origin, SSR markers can be divided into Genormic-SSR and ex-pressed sequence tags-SSR, EST-SSR. Genormic-SSR is developed from genomic DNA sequences, and EST-SSR is derived from the coding region of the gene, which can directly reveal the genetic variation of functional genes. In addition, EST-SSR markers also have outstanding advantages such as high cost-effectiveness, convenient development, and strong versatility among related species10.Compared with other molecular markers, EST-SSR markers have many outstanding advantages, including rich site distribution, excellent polymorphism, high resolution, good repeatability, and co-dominant genetic characteristics. They are not only easy to detect but also possess strong discrimination ability, are not affected by environmental conditions, and the operation process is simple. The large amount of data obtained by EST-SSR molecular markers are not only easy to read and analyze but also clearly reflect the diverse associations between groups and individuals10. These markers have demonstrated material value in the collection and preservation of germplasm resources. Moreover, in a series of research fields, such as analysis of genetic diversity, construction of genetic linkage maps, and identification of kinship among species, EST-SSR molecular markers play an indispensable role, providing key technical support for the in-depth development of related research11. Thus far, the application scope of EST-SSR molecular marker technology has expanded to include an increasing number of species. For instance, in the field of woody plants, researchers have conducted in-depth analyses of EST-SSR loci and related sequence characteristics of species such as hydrangea12, Jatropha curcas13, and Phyllanthus emblica14. Among herbaceous plants, EST-SSR locus information and sequence characteristics of species such as Cucumber15, Melon16, and Lotus17 have also been systematically analyzed, and corresponding EST-SSR primers have been successfully developed, providing valuable genetic resources for related research on various species. In a study on Zanthoxylum, Aiming at the germplasm resources of prickly ash in Shaanxi, Shanxi, Yunnan, Sichuan and Gansu provinces, Li et al.18 analyzed the genetic polymorphism, population structure and genetic evolution relationship of prickly ash by SRAP Gene marker identification technology. Kong19 used SCoT markers to analyze the genetic diversity, cluster analysis, and principal coordinate analysis (PCoA) of 48 prickly ash germplasms and studied the correlation between genetic and phenotypic characteristics. Deng et al20 used EST-SSR molecular markers to explore the quantitative characteristics of loci, primer effectiveness, and polymorphisms of Zanthoxylum bungeanum and Zanthoxylum armatum, and provided a theoretical basis for variety identification and genetic relationship analysis. Li21 used ISSR molecular marker technology to carry out genetic differentiation and cluster analysis on 12 natural prickly ashdissitum germplasm resources to explore the level of genetic diversity and differentiation of the population. From prior studies, it is evident that the current research on molecular markers of prickly ash mainly focuses on SRAP, SCoT, ISSR, and other fields; however, research on the genetic diversity, population structure, and genetic relationship of germplasm resources through EST-SSR molecular marker technology is rarely reported.
Based on this foundation, the present study employed EST-SSR molecular marker technology, using the transcriptome sequence of prickly ash as a reference, to analyze the genetic diversity and population structure of 35 prickly ash samples at the DNA level. The objectives of the present study were to conduct an in-depth investigation of the genetic composition and evolutionary history of the population, construct a genetic map of prickly ash, and facilitate the identification and conservation of its germplasm resources, thereby providing a solid scientific and theoretical basis for future research and applications.
Materials and methods
Experimental materials
The experimental materials were mainly collected from the prickly ash resource garden of Chongqing University of Arts and Sciences in Yongchuan District, Chongqing City. There were a total of 35 varieties, including ‘Rongchang thornless,’ ‘Hani pepper,’ ‘Lianfeng Pepper, ‘Japanese pepper,’ among others. When collecting samples, those pepper trees with robust growth and unaffected by pests or diseases were selected. Their fresh and tender leaves were picked, quickly frozen in liquid nitrogen, and stored in a low-temperature refrigerator at − 80 °C ultra-low temperature freezer. Detailed information on the prickly ash varieties is provided in Table 1.
Experimental equipments and reagents
The main equipment of the experiment includes vortex oscillator (Scilogex, Rocky Hill, CT, USA), agarose gel electrophoresis (Junyi Dongfang Electrophoresis Equipment Co., Ltd., Beijing, China), PCR instrument (Analytik Jena AG, Jena, Germany), centrifuge (Xiangyi Laboratory Instrument Development Co., Ltd., Changsha, China) and Multifunctional imaging system (Tanon Life Science Co., Ltd., Shanghai, China).
The main reagents of the experiment includes BG DNA/RNA Extraction Lysis Buffer, BGMG For RNA, DEPC-Treated ddH2O, WB1 and WB2 (Baoguang Biotechnology Co., Ltd., Chongqing, China), ethanol (Macklin Biochemical Technology Co., Ltd., Shanghai, China), 2xTaq PCR MasterMix and Gelred nucleic acid dyes (Bomad Gene Technology Co., Ltd., Beijing, China).
Experimental methods
Genomic DNA extraction
In this study, genomic DNA was isolated from 35 tender leaf samples of prickly ash by magnetic bead genomic DNA extraction kit (Baoguang Biotechnology Co., Ltd., Chongqing, China ). The quality of the obtained DNA was evaluated by NanoDROP 8000 ultramicro spectrophotometer. The A260/A280 ratios of all samples were between 1.8 and 2.0, indicating that the DNA purity met the requirements. Subsequently, the concentration of DNA solution was standardized to 50 ng/µL and stored at 4 °C for subsequent experiments.
Prickly ash transcriptome sequencing and assembly
In this experiment, Illumina HiSeq2000 high-throughput sequencing platform was used to sequence the transcriptome of prickly ash transcriptome sequencing and assembly. Total RNA extraction, purification, library construction and sequencing were completed by Beijing Nuohe Zhiyuan Technology Co., Ltd., Beijing, China. After removing the sequencing adaptors and low-quality sequences from the raw reads, the obtained clean reads were spliced using the assembly software Trinity, and de novo assembled to obtain transcripts. The longest transcript of each gene was used as Unigene, and a total of 245,286 unigenes were obtained, which were used as the basis for identifying EST-SSR loci.
EST-SSR loci mining and primer design
EST-SSR loci mining was performed on Unigene of prickly ash transcriptome using MISA (http://pgrc.ipk-gatersleben.de/misa/). The screening conditions included 10 or more repetitions of a single base. Two bases were repeated six times or more, three bases five times or more, four bases five times or more, five bases five times or more, and six bases five times or more. By conducting statistical analysis of the relevant EST-SSR information and comprehensively considering the occurrence frequency and repetition times of repeated primers, some unigene sequences were screened out. The corresponding primers were designed using Primer 3.0, and 30 randomly selected pairs of primers were synthesized by Bioengineering Co., Ltd. (Shanghai, China).
PCR amplification system and procedure
PCR reaction system The PCR reaction system comprised a total volumeof 25 µL; 1 µL of prickly ash genomic DNA template, 0.5 µL each of the forward and reverse primers, 12.5 µL of 2xTaq PCR MasterMix, and 10.5 µL of ultrapure water.
PCR amplification procedure and result detection The PCR conditions are listed as follows: pre-denaturation at 94 °C for 5 min, denaturation at 94 °C for 30 s, annealing at 53 °C for 30 min, extension at 72 °C for 1 min, 35 cycles, extension at 72 °C for 5 min, and storage at 4 °C. After the end of the reaction, 5 µL-10 µL of the reaction product was taken, and 1% agarose gel electrophoresis was performed in 1 xTAE buffer at 110 V voltage for 30 s, and the size of the band was determined by using the DL2000 DNA Marker (#3427A) of Baori Medical Biotechnology Co., Ltd., Beijing, China.
Data statistics and analysis
Based on the electrophoresis diagram of the PCR amplification products, those with clear and repeatable bands were marked as ‘1, those without bands or with indistinct and unclear bands were marked as ‘0, and the original matrix was constructed. The genetic diversity of prickly ash was analyzed using POPgene v1. 3222 software, and the genetic consistency and genetic distance of prickly ash were calculated using NTSYS-pc 2.1023 software to obtain genetic consistency and genetic distance matrices. The ChiPlot (https://www.Chiplot.online) creates heat maps of genetic consistency and distance matrices. UPGMA cluster analysis was carried out on prickly ash germplasm resources using NTSYS-pc 2.10 software, and a genetic cluster diagram was constructed using iTOL v6 tool (https://itol.embl.de) and MEGA6 v6.0.24 Principal coordinate analysis and AMOVA analysis were performed using GenAlEx 6.50225 software.
Results
The number and distribution characteristics of EST-SSR in prickly ash transcriptome
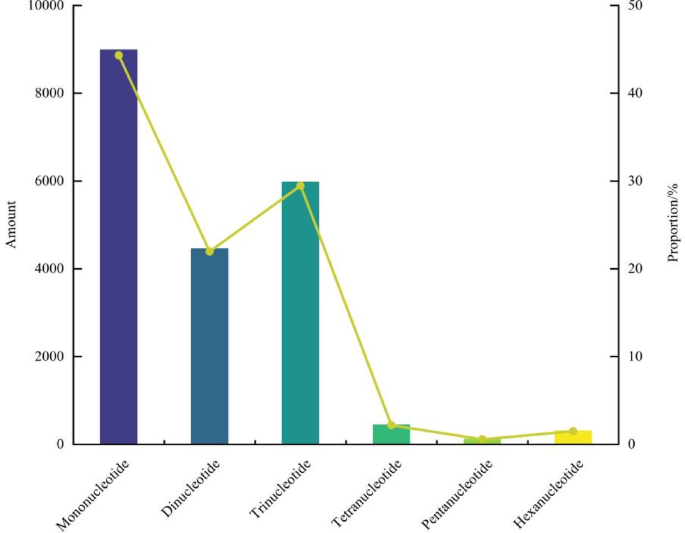
The EST-SSR loci were mined by MISA software from 245,286 Unigene sequences obtained by transcriptome sequencing of prickly ash. It was found that 36,656 sequences contained 20,271 EST-SSR loci. The occurrence frequency of EST-SSR (the ratio of the number of unigenes with EST-SSR loci to the total number of unigenes) was 14.94%, and the distribution frequency of EST-SSR loci (the ratio of the total number of EST-SSR loci to the total number of unigenes) was 8.26%. Among the detected EST-SSR repeat types, both single-nucleotide and hexanucleotide repeats were present; however, there were significant differences in their occurrence frequencies (Fig. 1). There were 8984 single-nucleotide repeats, which were the dominant repeat type at the EST-SSR sites, accounting for 44.32% of the total number of EST-SSR sites. The number of EST-SSR sites of dinucleotide and trinucleotide repeat types were 4453 (21.97%) and 5,973 (29.47%), respectively, which were significantly higher than those of tetranucleotide repeat (442,2.18%) and hexanucleotide repeats (304,1.50%). The number of pentanucleotide repeats was the lowest (115).

Distribution of EST-SSR repeat motifs of prickly ash.
EST-SSR motif repeat types and frequency characteristics of the prickly ash transcriptome
Through a systematic analysis of the distribution characteristics of EST-SSR sites in prickly ash (Table 2), the results showed that single-nucleotide repeat motifs dominated, among which the number of A/T motifs was significantly higher than that of other types, accounting for 44.11% of all EST-SSR sites. The number of C/G motifs was relatively small, accounting for only 0.21%. Among the dinucleotide repeat motifs, AG/CT belongs to the most important repeat pattern, accounting for 11.35% of all EST-SSR loci. Among the trinucleotide repeat moths, AAG/CTT and AAT/ATT accounted for significant proportions (579 and 510, respectively), representing 2.86% and 2.52% of the total EST-SSR sites, respectively. Among the tetraconucleotide repeat motifs, AAAT/ATTT was the most abundant. The repetitive pentanucleotide and hexanucleotide motifs were relatively abundant; however, the distribution frequencies of each motif were relatively uniform and did not show a significant frequency advantage.
EST-SSR primer screening and polymorphism analysis
Based on the unigene sequence of prickly ash, 30 pairs of EST-SSR primers were designed by Primer3.0 (Table 3). The amplification products were detected by PCR amplification and agarose gel electrophoresis. Eventually, 22 pairs of primers amplified clear bands, with a primer amplification rate of 73.33% (Fig. 2). The 22 pairs of primers were used to conduct PCR amplification and electrophoretic detection on 35 samples of prickly ash materials. The research results showed that 22 pairs of primers were used to amplify 105 clear bands, of which 99 were polymorphic bands, and the polymorphism rate reached 90.99%. The number of amplification bands of the primers followed a normal distribution and ranged from two to eight. On an average, 4.8 primers were amplified per pair. Among the primers tested, primer C12 exhibited the highest amplification efficiency. However, the amplification efficiencies of the primers C3, C13, and C30 were the lowest, with only one amplification.

Agarose gel electrophoresis results of partial amplification products of primer C26. Marker: DNA molecular marker; Note:1–14: Corresponding to the 1–14 prickly ash materials in Table 1; 100 bp-2000 bp represents the molecular weight.(The complete and clear image has been presented in the supplementary material.)
Genetic diversity analysis of prickly ash germplasm
The genetic diversity of the 35 prickly ash germplasm resources was analyzed using 22 pairs of primers (Table 4). The results showed that 42 alleles (Na) were amplified by 22 pairs of primers, and the observed number of alleles (Na) ranged from 1.50 to 2.00, with an average of 1.91. The effective number of alleles (Ne) ranged from 1.01 to 1.80, with an average of 1.44 alleles per locus. The Nei ‘s genetic diversity index (H) ranged from 0.01 to 0.44, with an average of 0.27. The Shannon Information Index (I) ranged from 0.04 to 0.63, with an average of 0.41,the fluctuation range of PIC was 0.01–0.35, with an average of 0.25. Among the 22 pairs of primers, the effective number of alleles (Ne), Nei ‘s genetic diversity index (H), Shannon Information Index (I),and PIC of primer C25 were the highest, indicating that primer C25 had stronger resolution in revealing the genetic differences of prickly ash germplasm. The results of genetic diversity analysis showed that 22 pairs of primers had good polymorphism, and their allele variation characteristics could effectively analyze the genetic structure of the prickly ash population and provide reliable technical support for genetic relationship identification.
Genetic relationship of prickly ash germplasm
Genetic consistency and distance are the core parameters for quantifying kinship closeness between populations. When the genetic distance approaches 0 and the genetic consistency approaches 1, the gene pools of the two almost overlap and the kinship is close. Conversely, a significant increase in genetic distance and a significant decrease in genetic consistency indicates that the two share very few or even completely independent genetic components and have distant kinship. The results showed that the genetic consistency among the 35 test materials ranged from 0.3200 to 0.9111, and the genetic distance ranged from 0.0931 to 1.1394. Among them, the ‘August red’ from Yuncheng, Shanxi Province, and the ‘Sanchahe pepper’ from Qujing, Yunnan Province, had the highest genetic consistency (0.9111), the smallest genetic distance (0.0931), and the closest genetic relationship. The genetic consistency between ‘Yongqing No. 1’ from Yongshan, Yunnan, and ‘Yunnan green pepper’ from Zhaotong, Yunnan, is the lowest (0.3200), the genetic distance is the greatest (1.1394), and the genetic relationship is the farthest (Fig. 3 and 4).

Heat map of genetic identity coefficients of 35 prickly ash.

Heat map of genetic distance coefficients of 35 prickly ash.
Analysis of UPGMA clustering results of prickly ash germplasm
The Cophenetic value reflects the reduction degree of the clustering tree to the original data through the mapping relationship of the genetic distance matrix. The Cophenetic correlation coefficient (R) is the core index to quantify this reduction degree. Combined with the size of R value and significance test (T value, P value), the reliability of clustering results can be comprehensively judged. It can be seen from Fig. 5 that the Cophenetic correlation coefficient was 0.79, the T value was 7.87, and the P value was < 0.05. The results of the cluster analysis were ideal. The conclusion of this experiment was highly reliable and could better reflect the genetic relationships between the test materials, which could be used as the basis for subsequent analyses.

Correlation of cluster analysis of prickly ash germplasm resources.
Based on the amplification data of 22 pairs of polymorphic primers, UPGMA cluster analysis of 35 prickly ash germplasm resources was carried out by NTSYS-pc 2.10, and the genetic cluster map was beautified by iTOL v6 tool and MEGA6 v6.0 software. Finally, the genetic cluster map of EST-SSR markers was obtained (Fig. 6). From the EST-SSR marker clustering graph, it can be seen that the 35 germplasm resources of prickly ash are divided into 4 major groups: Group I includes a total of 13 germplasm samples, such as ‘Hanyuan pepper’ from Ya ‘an, Sichuan Province, ‘September red’ from Jiaozuo, Henan Province, ‘Asakura mountain pepper’ from Asakura, Japan, ‘Tianshui thornless’ from Tianshui, Gansu Province, ‘August red’ from Yuncheng, Shanxi Province, ‘Yinhong pepper’ from Zunyi, Guizhou Province, ‘Lion’s head pepper’ from Tongchuan, Shaanxi Province, and ‘Yongqing No. 2’ from Yongshan, Yunnan Province. The second group contained 20 pepper germplasm samples, of which two were from Sichuan, one from Gansu, three from Shaanxi, seven from Yunnan, and the rest from Chongqing. The third and fourth groups respectively have only one germplasm each of ‘Yunnan green pepper’ from Zhaotong, Yunnan and ‘Yongqing No.1’ from Yongshan, Yunnan. The results of the cluster analysis showed that some germplasm resources from the same region did not cluster together, whereas some germplasms from different regions were classified into the same group. The reason for this phenomenon might be that germplasms from different regions have similar evolutionary origins, or that gene exchange occurred during the long-term process of natural selection.

Genetic clustering map of 35 prickly ash materials using EST-SSR markers.
Principal coordinate analysis of PCoA in prickly ash germplasm
To explore the genetic evolution and similarity degree of different groups of prickly ash in the present study, based on cluster analysis, GenAlEx 6.502 software was used to conduct principal coordinate analysis (PCoA) on the four classified groups of prickly ash according to Nei’s genetic distance. The analysis results (Fig. 7) showed that the contribution rate of the first principal coordinate to the total genetic variation of prickly ash germplasm was 38.90% and that of the second principal coordinate was 13.44%. The cumulative contribution rate of the characteristic values of the two principal coordinates was 52.34%. In a planar coordinate graph, the positions of each sample point and the distances between them visually reflect the closeness of the genetic relationships among the different germplasms. The 35 germplasms of prickly ash can roughly be divided into four regions. The distribution of the first and second groups was relatively concentrated, whereas the third and fourth groups had the greatest genetic distance, farthest kinship, and significant differences in genetic background. The results of UPGMA cluster analysis and PCoA were highly consistent, and the conclusions of the two methods could be mutually verified.

Principal coordinate analysis of four prickly ash groups based on EST-SSR genetic distance.
AMOVA molecular variance analysis
The results of AMOVA molecular variance analysis showed that (Table 5) : The genetic variation of prickly ash mainly came from within the individual, accounting for 79.80% of the total variation. This indicates that the developed EST-SSR markers have high polymorphism and high individual heterozygosity at the individual level of prickly ash. The genetic variation among populations accounted for 12.40% of the total variation, and the variation among individuals within populations accounted for 7.80%. The population genetic differentiation coefficient (Fst) calculated based on the variance component was 0.12. According to the general standard, the Fst value is 0 ~ 0.05, indicating that the genetic differentiation between populations is very small ; the Fst value was 0.05–0.15, indicating that there was moderate genetic differentiation among populations. The Fst value was 0.15–0.25, indicating that the genetic differentiation between populations was obvious. The Fst value of this experiment was greater than 0.05, indicating that there was a moderate degree of genetic differentiation among prickly ash populations.
Discussion
Quantitative characteristics of EST-SSR loci
With the rapid development of high-throughput sequencing technology, biomics data for numerous crops have been successively released. Driven by this, considerable progress has been made in research fields, such as gene-expression levels, gene function localization, and molecular marker development26. At the same time, this has also promoted the in-depth development of research on genetic diversity analysis, germplasm resource identification, fine genetic map construction, and molecular-assisted breeding27. In this study, a total of 245,286 Unigene sequences were obtained by sequencing the transcriptome of prickly ash. After the search and analysis, 36,656 sequences were found to contain 20,271 EST-SSR loci. The occurrence frequency of EST-SSR was 14.94%, which was higher than that of Citrus maxima (14.69%)28 and Fructus Aurantii (2.96%)29, but lower than that of Dendrobium hybrida (31.53%)30. The distribution and frequency of EST-SSR loci varies among species. The reasons for this result may involve multiple aspects: the occurrence frequency of EST-SSR will gradually decrease as the species genome increases31, and different EST-SSR search criteria will result in significant differences in the frequency of EST-SSR occurrence, as calculated. In addition, the differences in the number and types of EST-SSR sequences and other data volumes analyzed and statistically analyzed might also contribute to this result32. Previous studies have shown that EST-SSR sites in most plants are mainly single-nucleotide, dinucleotide, and trinucleotide repeat types33. In the present study, single-nucleotide repeats were the dominant repeat type at the EST-SSR sites, accounting for 44.32% of the total number of EST-SSR sites. This was followed by trinucleotide repeats (29.47%) and dinucleotide repeats (21.97%); The total number of EST-SSR loci composed of these three repetitive types accounted for 95.76% of the total number of EST-SSR loci. In single-nucleotide repeats, the number of A/T motifs was significantly higher than that of the other types, accounting for 44.11% of total EST-SSR sites. The results of the present study are consistent with those of Huang et al.34, Fu et al.35, and Deng et al.20.
Genetic diversity of prickly ash populations
The study of plant genetic diversity not only helps to screen new germplasm resources with relative advantages or uniqueness36 but also provides an important method for the protection and utilization of plant resources. Compared with traditional morphological and physiological trait analyses, DNA-based molecular marker technology can more directly and accurately reflect the genetic variation of species37.
The level of primer polymorphism is a key factor in evaluating the applicability of EST-SSR markers. Zhao et al.38 screened 12 pairs of clear and bright primers with stable bands using 100 pairs of ISSR primers; primer amplification efficiency was 12%. There were 94 polymorphic bands, with a polymorphism rate of 73.44%. In the present study, 22 pairs of EST-SSR primers that could amplify clear bands were screened from 30 pairs, and the amplification efficiency of these primers was 73.33%. One hundred and five clear bands were amplified using 22 pairs of primers, of which 99 were polymorphic, with a polymorphism rate of 90.99%. Among the primers tested, primer C12 exhibited the highest amplification efficiency (8. In the present study, the amplification efficiency of EST-SSR primers (73.33%) was much higher than that of ISSR primers (12%) in Zhao Jingke’s study, and the polymorphism rate (90.99%) was also significantly higher than the latter (73.44%). This indicated that the EST-SSR primers screened herein performed better in terms of polymorphism and amplification effects. The EST-SSR molecular markers have higher applicability and can be used for genetic diversity analysis of prickly ash. The high amplification efficiency of primer C12 makes it likely to have a higher application value in subsequent studies.
The observed number of alleles (Na), effective number of alleles (Ne), Nei ‘s genetic diversity index (H), and Shannon Information Index (I) are key indicators for evaluating genetic diversity. These indicators comprehensively reflect the genetic variation in a population from different perspectives and are commonly used as important measurement tools in genetic diversity research39. Li40 studied 12 prickly ash germplasms. The average number of observed alleles (Na) was 1.76, the average number of effective alleles (Ne) was 1.40, the average value of Nei ‘s genetic diversity index (H) was 0.24, and the average value of Shannon Information Index (I) was 0.37; in the present study, the mean values of various genetic parameters were as follows: the number of observed alleles (Na) was 1.91, the number of effective alleles (Ne) was 1.44, the Nei’s genetic diversity index (H) was 0.27, and the Shannon information index (I) was 0.41. Among all the tested primers, the effective allele number (Ne), Nei’s genetic diversity index (H), Shannon Information Index (I),and PIC of primer C25 were all the highest. The genetic diversity indexes obtained in the present study were higher than those of previous studies, indicating that the genetic diversity of this study population was richer and the evaluation of genetic diversity was more effective. This difference may be attributed to the increase in the number of samples and a wider range of sample sources. A larger sample size usually covers the genetic variation in a population more fully, thereby detecting more alleles and higher genetic diversity, whereas a wider range of sample sources increases the likelihood of genetic variation between germplasms. Primer C25 showed excellent performance in the detection of genetic diversity of prickly ash germplasm, which implies that the primer may be more efficient in amplifying alleles with high genetic variation and is suitable for the analysis of genetic diversity of prickly ash germplasm. These results provide a valuable reference for the selection of primers for subsequent similar studies.
Genetic relationship of prickly ash populations
Genetic consistency and distance are core quantitative indicators for evaluating the degree of genetic association among different populations41. In the present study, some germplasms had the same or similar origins, but the genetic consistency was relatively low, and the genetic relationship was distant. For instance, the genetic consistency between ‘Yongqing No.1’ from Yongshan, Yunnan, and ‘Yunnan green pepper’ from Zhaotong, Yunnan, is the lowest (0.3200), the genetic distance is the greatest (1.1394), and the genetic relationship is the farthest. The genetic consistency of ‘Cold-resistant No. 2’, ‘Huanghua pepper’, and ‘Lianfeng pepper,’ which originated from the same place as ‘Yongqing No. 1’, is 0.4773, 0.4800, and 0.4884 respectively, indicating a relatively distant genetic relationship. Some germplasm lines have different sources and geographical locations; however, they have a high degree of genetic consistency and relatively close genetic relationships. For instance, the ‘August red’ from Yuncheng, Shanxi Province, and the ‘Sanchahe pepper’ from Qujing, Yunnan Province, although separated by approximately 1600 km, exhibit the highest genetic consistency (0.9111) and the smallest genetic distance (0.0931), showing the closest genetic relationship. The underlying reason may be that the genetic relationship of prickly ash populations is affected by multiple factors, such as historical introduction, artificial gene flow, ecological selection, and breeding methods. Li et al.18 pointed out that there is a phenomenon of ‘interactive introduction’ in the long-term cultivation of prickly ash and that artificial breeding can significantly reduce the genetic distance between different provinces. We speculate that the high genetic similarity observed between Yuncheng, Shanxi and Qujing, Yunnan may be related to the convenient transportation between the two places and their historical status as the distribution center of prickly ash. These factors may promote the frequent exchange of germplasm resources. On the contrary, although Yongshan and Zhaotong are geographically adjacent, they are located in the dry-hot valley of Jinsha River and Wumeng Mountain area. This geographical condition may lead to a certain spatial isolation and limit contemporary gene exchange, thus exacerbating genetic differentiation. This model suggests that historical trade and contemporary transportation networks may be important factors in shaping the genetic structure of prickly ash, but this conclusion still needs to be verified by combining historical data with more in-depth population genetics analysis.
Population group structure of prickly ash
The population genetic structure of a specific species is closely related to its origin, evolution, and natural distribution pattern, and provides a key basis for explaining the phylogenetic relationships between species42. In the present study, UPGMA cluster analysis and PCoA were combined to determine whether the genetic relationship between prickly ash germplasm resources was related to their geographical origin; however, this was not inevitable and could not be directly classified by geographical origin. For instance, in the second group, all seven germplasm lines from Chongqing were clustered into one category, and three of the four germplasm lines from Shaanxi were clustered into one category. However, some germplasm resources from different geographical sources have similar genetic distances and are clustered together, such as the ‘Tianshui thornless’ from Tianshui, Gansu Province, and the ‘Asakura mountain pepper’ from Japan, the ‘Lion’s head pepper’ from Tongchuan, Shaanxi Province, and the ‘Yinhong pepper’ from Zunyi, Guizhou Province, as well as the ‘August red’ from Yuncheng, Shanxi Province, and the ‘Sanchahe pepper’ from Qujing, Yunnan Province. Moreover, some homologous germplasms have not gathered together, such as the ‘Hani pepper’ and ‘Large-leaf Water Pepper’ from Honghe, Yunnan, the ‘Small pepper’ and ‘Hanyuan pepper’ from Ya ‘an, Sichuan, as well as the ‘Yunlin No. 1’ and ‘Yunlin No. 2’ from Kunming, Yunnan. Cluster analysis of 33 prickly ash germplasms by Hou et al.43 showed that genetic relationships did not exhibit a pattern of aggregation based on geographical location. Li et al.44 classified 48 prickly ash germplasms into five major groups but failed to achieve complete differentiation of all materials. Gu et al.45 used SSR markers to analyze 21 prickly ash germplasms, and found that the genetic relationship between individuals from the same source may not be similar, and the clustering results did not reflect significant regional differences. Zhao et al.38 used ISSR markers to construct the core germplasm of prickly ashschinifolium and confirmed that there was no significant correlation between genetic and geographical distances among populations. The analysis of 54 Allium sativum strains based on SSR markers by Shuai et al.46 did not find that the genetic relationships were clustered according to geographical origin. Zhao et al.47 studied SSR molecular markers in 143 Camellia sinensis specimens. The results showed that most germplasm lines lacked clear regional characteristics and that their clustering patterns were mainly dominated by non-geographical factors. The results of the present study are consistent with those of previous studies. This may be because early artificial introduction led to the sharing of similar genetic backgrounds in some producing areas, and high-frequency gene exchange under long-term human intervention drove cross-regional gene flow. Therefore, in the future, the excavation and utilization of cross-regional germplasm resources should be strengthened, and common dominant loci should be located using molecular markers for breeding. It is necessary to further screen highly polymorphic primers to enhance the differentiation efficiency of various resources and systematically improve the identification accuracy of prickly ash germplasm.
AMOVA molecular variance analysis of prickly ash
In this study, the genetic variation of prickly ash germplasm resources was analyzed by AMOVA analysis, and the distribution pattern of genetic diversity was revealed. The results showed that the genetic variation of prickly ash mainly existed at the individual level (79.8%), while the differentiation among populations was at a moderate level (Fst = 0.12). The high genetic variation in individuals indicated that the prickly ash individuals studied generally had high heterozygosity, which may be related to the reproductive characteristics of cross-pollination. At the same time, it also reflects that the EST-SSR markers developed in this study show good applicability in revealing the genetic diversity of prickly ash at the individual level. In addition, moderate genetic differentiation among populations indicated that although populations from different geographical origins have produced a certain genetic structure, there may still be a certain degree of gene flow among them. This may be due to natural processes such as insect pollination and bird seed dispersal, as well as historical artificial introduction and cultivation.
Conclusion
In this study, 20,271 EST-SSR loci were screened from 245,286 Unigenes by sequencing the transcriptome of prickly ash, which were mainly mononucleotide, dinucleotide and trinucleotide. Thirty pairs of primers were randomly selected for polymorphism screening of 35 prickly ash germplasms, and 22 pairs of polymorphic primers were obtained. Using UPGMA cluster analysis, 35 prickly ash germplasm lines were divided into four groups. The polymorphic markers screened herein can effectively reflect the genetic association and genetic diversity among prickly ash germplasms and provide marker resource reserves for the construction of genetic maps and the identification of germplasm resources.
Data availability
The datasets generated and/or analyzed during the current study are available in the [NCBI-SRA] repository, [www.ncbi.nlm.nih.gov/sra, Accession: SRX22124282—SRX22124296].
References
-
Wei, K. Small Zanthoxylum bungeanum leads to a big industry. Land Green. 295, 42–43 (2018).
-
Hou, N. Genetic Variation Analysis of Multi-level Germplasm Resources of Zanthoxylum bungeanum (Northwest A&F University, 2019).
-
Guo, J. Y. & Tian, C. R. Analysis of the current situation and prospect of Zanthoxylum bungeanum development and utilization. Food Res. Dev. 18, 167–170 (2008).
-
Li, Y. et al. Non-destructive detection of alkaloids and volatile oil content in Zanthoxylum bungeanum by near-infrared spectroscopy. Food Ind. 33, 122–125 (2012).
-
Ban, M. H. et al. Brief description of the sorting results of local Zanthoxylum bungeanum varieties in Gansu Province. Gansu Agric. Sci. Technol. 6, 80–81 (2017).
-
Feng, S.J. Research on the Genetic Structure and Phylogeny of Zanthoxylum bungeanum (Northwest A&F University, 2017).
-
Wei, B.Q. Genetic and candidate Gene identification of Recovery of Cytoplasmic Male Sterility in Zanthoxylum bungeanums (Gansu Agricultural University, 2017).
-
Wang, Z. Y. et al. Analysis of genetic diversity of Crape myrtle based on fluorescent SSR labeling. J. Nanjing For. Univ. 47, 61–69 (2023).
-
Xue, B. W. et al. Analysis of SSR locus Information in the transcriptome of Water Chestnut. J. Plant Resour. Environ. 19, 4437–4442 (2021).
-
Wang, L. et al. Analysis of genetic diversity and population genetic Structure of free-pollinated progeny of Blueberry variety ‘Lanmei No.1’ based on SSR markers. J. Plant Resour. Environ. 31, 35–43 (2022).
-
Zhong, X. et al. Development of EST-SSRs based on the transcriptome of Castanopsis carlesii and cross-species transferability in other Castanopsis species. PLoS ONE 18, 28 (2023).
-
Zhou, M. et al. Establishment and application of SSR molecular marker system for Hydrangea. J. South. Agric. 12, 1–17 (2025).
-
Gu, Y. Y. et al. Analysis of SSR Characteristics in the transcriptome of Jataegus tomentosa and development and application of its molecular markers. J. South. Agric. 14, 1–14 (2025).
-
Wang, J. C. et al. Genetic diversity analysis and core germplasm construction of Phyllanthus emblica based on SSR markers. J. Fruit Sci. 23, 1–21 (2025).
-
Li, X. J. et al. Disease resistance identification and genetic diversity analysis of Cucumber Germplasm resources. J. South China Agric. Univ. 24, 1–15 (2025).
-
Hao, F. M. et al. Identification of seed purity of Melon hybrids using SSR molecular markers. North. Hortic. 16, 8–16 (2025).
-
Jiang, S. H. et al. Development and genetic diversity analysis of SSR molecular markers in Ginger lily. Fujian Trop. Crops Sci. Technol. 50, 1–4 (2025).
-
Li, L. X. et al. Analysis of genetic diversity and population structure of Zanthoxylum bungeanum germplasm resources based on SRAP markers. Acta Agric. Boreali-Sin. 31, 122–128 (2016).
-
Kong, L.J. Analysis and Identification of Zanthoxylum bungeanum Germplasm Resources Based on SCoT Markers (Northwest A&F University, 2022).
-
Deng, Y. C. et al. Development of EST-SSR markers for species of the genus Zanthoxylum bungeanum based on transcriptome sequencing. J. Northwest A & F Univ. 47, 16–24 (2019).
-
Li, M. ISSR Study on Genetic Diversity of Zanthoxylum bungeanum Shell (Central South University of Forestry and Technology, 2013).
-
Yeh, F. C., Yang, R. C., Boyle, T. J. B. & Ye, Z. H. POPGENE version 1.32: Microsoft Windows-based freeware for populations genetic analysis. (University of Alberta, 1999).
-
Rohlf, F. J. NTSYspc: numerical taxonomy and multivariate analysis system, version 2.0. Exeter Software http://www.exetersoftware.com/cat/ntsyspc/ntsyspc.html (1998).
-
Kumar, S., Stecher, G. & Tamura, K. MEGA7: Molecular evolutionary genetics analysis version 7.0 for bigger datasets. Mol. Biol. Evol. 33, 1870–1874 (2016).
-
Song, Y. et al. Analysis of genetic diversity and genetic structure of Bupleurum based on SSR molecular markers. Acta Pharm. Sin. 57, 1193–1202 (2022).
-
Cristancho, M. & Escobar, C. Transferability of SSR markers from related Uredinales species to the coffee rust Hemileia vastatrix. GMR. Genet. Mol. Res. 7, 1186–1192 (2008).
-
Huang, Q. L. et al. Analysis of SSR distribution and sequence characteristics in the transcriptome of Pomelo Pulp. J. South. Agric. 56, 583–591 (2025).
-
Liang, M. et al. De novo transcriptome assembly of pummelo and molecular marker development. PLoS ONE 10, 12 (2015).
-
Yang, C. X. et al. Development of EST-SSR marker of Aurantii Fructus. J. Plant Resour. Environ. 9, 123–127 (2011).
-
Lin, R. Y. et al. Analysis of SSR locus information in the transcriptome of Dendrobium officinale water hibiscus. North. Hortic. 10, 1–8 (2025).
-
Morgante, M., Hanafey, M. & Powell, W. Microsatellites are preferentially associated with nonrepetitive DNA in plant genomes. Nat. Genet. 30, 194–200 (2002).
-
Qian, L. H. et al. Development of SSR markers based on the transcriptome sequence of Polygonatum odoratum and their application in the analysis of Polygonatum resources. Jiangsu J. Agric. Sci. 39, 1120–1131 (2023).
-
Biet, E., Sun, J. & Dutreix, M. Conserved sequence preference in DNA binding among recombination proteins: an effect of ssDNA secondary structure. Nucleic Acids Res. 27, 596–600 (1999).
-
Huang, Q. L. et al. Chloroplast genome and Structure Analysis of Huazhou. Pomelo South China Fruits 54, 1–8 (2025).
-
Fu, G. et al. Analysis of SSR characteristics and molecular marker development of the full-length transcriptome of Echeveria fasciata. Acta Pratacult. Sin. 34, 107–119 (2025).
-
Qu, K. et al. Research on the genetic diversity of the natural population of Fraxus chinensis based on SRAP molecular markers. J. Beijing For. Univ. 42, 40–50 (2020).
-
Gan, L. et al. Analysis of genetic diversity of Oilseed Germplasm resources based on SRAP molecular markers. J. South. Agric. 52, 1798–1805 (2021).
-
Zhao, J.K. Genetic Diversity Analysis of Zanthoxylum bungeanum and Construction of Core Germplasm (Wuhan University, 2021).
-
Tian, H. H. et al. Study on genetic diversity of Wild Acacia resources in Guizhou province. J. Southwest For. Univ. 43, 39–46 (2023).
-
Li, L.X. Development of SSR Molecular Markers Based on the Transcriptome Sequence of Zanthoxylum bungeanum and Identification of Germplasm Resources (Northwest A&F University, 2017).
-
Zhang, R. et al. Construction of DNA Fingerprinting and genetic diversity analysis of Elymus nutans forage grasses. J. North. Agric. 47, 1–8 (2019).
-
Essid, A. et al. Assessment of genetic diversity of thirty Tunisian fig (Ficus carica L.) accessions using pomological traits and SSR markers. Mol. Biol. Rep. 48, 335–346 (2021).
-
Hou, L. X. et al. Analysis of SSR Information in the transcriptome of Zanthoxylum bungeanum and development of its molecular markers. J. Agric. Biotechnol. 26, 1226–1236 (2018).
-
Li, J. H. et al. Analysis of genetic diversity and population structure of Zanthoxylum bungeanum germplasm resources based on SRAP and ISSR markers. Seed 44, 10–18 (2025).
-
Gu, L. P. et al. Diversity analysis of phenotypic traits and SSR markers of 21 Zanthoxylum germplasm resources. J. West China For. Sci. 53, 22–28 (2024).
-
Shuai, Z. B. et al. genetic diversity analysis and fingerprint atlas construction of 54 Garlic germplasm resources based on SSR markers. J. Sichuan Agric. Univ. 43, 267–277 (2025).
-
Zhao, Y. X. et al. Analysis of genetic diversity and kinship of ‘Tianshan CAI Cha’ based on SSR markers. J. Trop. Subtrop. Bot. 50, 1–11 (2025).
Acknowledgements
We would like to express our gratitude to the Chongqing University of Arts and Sciences for providing the prickly ash materials for this study.
Funding
This study was supported by the National Natural Science Foundation of China (No. 32401627), Science and Technology Research Program of Chongqing Municipal Education Commission (KJZD-K202401308), Natural Science Foundation of Chongqing (CSTB2024NSCQ-MSX1109), Chongqing University of Arts and Sciences Graduate Research Innovation Project (CUAS-GSG2024023). The funders played no role in the study design, data collection, data analysis, data interpretation, or manuscript writing.
Ethics declarations
Competing interests
The authors declare no competing interests.
Additional information
Publisher’s note
Springer Nature remains neutral with regard to jurisdictional claims in published maps and institutional affiliations.
Supplementary Information
Rights and permissions
Open Access This article is licensed under a Creative Commons Attribution-NonCommercial-NoDerivatives 4.0 International License, which permits any non-commercial use, sharing, distribution and reproduction in any medium or format, as long as you give appropriate credit to the original author(s) and the source, provide a link to the Creative Commons licence, and indicate if you modified the licensed material. You do not have permission under this licence to share adapted material derived from this article or parts of it. The images or other third party material in this article are included in the article’s Creative Commons licence, unless indicated otherwise in a credit line to the material. If material is not included in the article’s Creative Commons licence and your intended use is not permitted by statutory regulation or exceeds the permitted use, you will need to obtain permission directly from the copyright holder. To view a copy of this licence, visit http://creativecommons.org/licenses/by-nc-nd/4.0/.
About this article

Cite this article
Liu, J., Zhuo, S., Xiang, S. et al. Analysis of EST-SSR characteristics of prickly ash transcriptome and development of molecular markers. Sci Rep 15, 43545 (2025). https://doi.org/10.1038/s41598-025-27550-4
-
Received:
-
Accepted:
-
Published:
-
Version of record:
-
DOI: https://doi.org/10.1038/s41598-025-27550-4