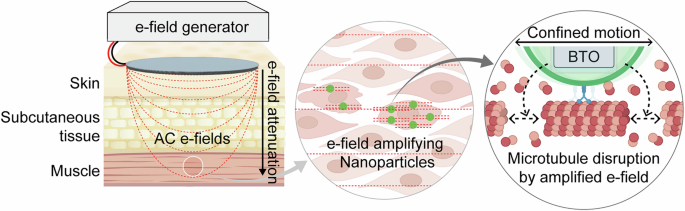
Introduction
Recent advances in pharmacology have integrated electronic devices due to factors such as portability, software development, precise modulation of physical stimuli, high accessibility, and potential for non-invasive therapies1,2. One such advancement involves electric field (e-field)-based therapies, including tumor-treating fields (TTFields), which have emerged as potentially promising cancer treatments3,4. TTFields employ relatively weak alternating currents (AC, 1–3 V cm⁻¹, 100–300 kHz) to disrupt mitotic spindle formation, suppressing cancer cell proliferation, with notable application in glioblastoma therapy5,6,7. Despite these developments, the clinical application of TTFields presents several challenges: (i) limited tissue penetration, which restricts uniform delivery of effective e-field intensities to deeper tumor areas; (ii) insufficient spatial resolution or specificity, complicating precise cellular targeting; and (iii) potential heat generation that could result in unintended thermal effects on healthy tissues8,9,10. Addressing these issues requires further research into strategies to improve the efficacy and safety of TTFields.
Theoretically, the penetration depth of AC e-field (dp) is governed by the skin depth (δ) equation, which depends on variables including frequency (f) and the electrical properties of the medium ((delta =sqrt{rho /pi fmu }); ρ: electrical resistivity, μ: permeability of the surrounding medium). TTFields (100–300 kHz) offer moderate penetration, though their effectiveness is influenced by the complex electrical properties of biological tissues. In highly conductive tissues, rapid e-field attenuation restricts penetration, limiting the field at the target site11,12. Increasing field strength may inadvertently cause greater exposure to healthy tissues, whereas retaining it could lead to inadequate delivery due to exponential decay (({E(d}_{p})={E}_{0}{e}^{-{d}_{p}/delta }) where E0: initial e-field). Ferroelectric nanoparticles (NPs) offer a strategy to locally amplify the e-field without increasing overall exposure levels.
We hypothesized that barium titanate (BTO) is a promising candidate due to its superior ferroelectric properties and high dielectric constant, which can amplify external e-fields locally13,14,15. These ferroelectric properties originate from its non-centrosymmetric tetragonal crystal phase, distinguishing it from the paraelectric cubic phase16,17. In Addition, BTO demonstrates chemical stability under physiological conditions, making it suitable for biomedical applications.
In this study, surface-engineered tetragonal phase BTO nanoparticles (tBTO NPs) are investigated as an innovative platform to locally amplify weak e-fields penetrating tissues, thereby enabling precise control at the cellular level while minimizing cytotoxic side effects.
The key components of the NP-based TTFields system include (Fig. 1): (i) tBTO NPs to enhance local e-field amplification by leveraging their high dielectric constant and ferroelectric properties18; (ii) Surface chemistry, allowing for the incorporation of functional groups that provide colloidal stability, target delivery, and optical imaging capabilities19,20,21; and (iii) an e-field generator designed to produce frequencies that sufficiently penetrate tissues without inducing thermal damage22,23. The parameters of this system are based on established AC e-field therapy. In contrast to direct current fields, which are limited by shallow tissue penetration due to charge shielding and can induce cytotoxic reactions such as electrolysis, AC fields deliver energy to deeper tissues while maintaining biocompatibility. Collectively, our findings highlight the potential of integrating ferroelectric nanomaterials with TTFields as an innovative strategy for non-invasive and targeted cancer therapies.

The illustration demonstrated the e-field generator and the e-field attenuation. The inset showed how ferroelectric nanoparticles enhance the local e-field to achieve a therapeutic effect. AC alternating current.
Results and discussion
Functionalized ferroelectric nanoparticles for cellular targeting: tBTO–Dye,Tf+ NPs
We synthesized ferroelectric tBTO NPs using the solvothermal method, controlling their size to ~100 nm to leverage the enhanced permeability and retention effect24,25. To improve stability and functionality, a silica (SiO2) shell was applied to the tBTO NPs, enhancing colloidal stability and providing a versatile platform for further functionalization with targeting biomolecules and fluorescent dyes (Fig. 2a)26.

(a) A schematic illustration outlines the functionalization process of tBTO NPs. b SEM and EDS elemental mapping reveal the morphology and elemental distribution of tBTO, with scale bars of 300 nm (SEM) and 50 nm (EDS). c XRD patterns confirm the crystalline structures of cBTO (JCPDS No. 31-0174) and tBTO (JCPDS No. 05-0626). d TEM images highlight the structural details of tBTO@SiO₂. e, f Zeta-potential (e) and hydrodynamic size (f) measurements show the changes in surface charge and size during functionalization for tBTO (light gray), tBTO@SiO₂ (light blue), tBTO–Dye,CO₂⁻ (dark green), and tBTO–Dye,Tf + NPs (light green). g Colocalization analysis using dark-field (DF) and total internal reflection fluorescence (TIRF) microscopy confirms the precise alignment of tBTO and Dye, validated by line profiling. h Cellular uptake analysis demonstrates effective internalization of tBTO–Dye,Tf + NPs, with fluorescence intensity measured in single cells (n = 10/group). The error bars represent mean ± standard deviation (SD). Statistical analyses include one-way ANOVA with Tukey’s post-hoc test for (e, f), and two-sided paired t tests for (h). Significance is indicated as ***p < 0.001; ****p < 0.0001; ns, not significant.
The resulting NPs exhibited a cubic shape with a size of 110 ± 20 nm (dSEM), and their elemental composition was verified via energy dispersive spectroscopy (EDS) (Fig. 2b). The tBTO NPs exhibit spontaneous polarization due to their asymmetric structure, a key property for ferroelectricity16,17. The X-ray diffraction (XRD) analysis confirmed the tBTO after the annealing of a synthesized cubic phase (cBTO) at 800 °C, with peak splitting observed ~2θ = 45° (Fig. 2c, the separation of the (002) and (200) reflection, JCPDS data No. 05-0626). Additionally, high-resolution transmission electron microscopy (HR-TEM) revealed interplanar spacings of 0.399 nm ((100) plane) and 0.402 nm ((001) plane), further supporting the tetragonal structure (Fig. S1a, b)27.
To ensure stability in culture media and introduce surface functionality, we applied a SiO2 shell. To enhance encapsulation efficiency, the surfaces of tBTO NPs were hydroxylated (-OH), confirmed using Fourier-transform infrared (FT-IR) spectroscopy through a broad band at ~3400 cm−1 (Fig. S1c)28. The Stöber method was then employed to coat the NPs with a SiO₂ shell, as confirmed by transmission electron microscopy analysis (tBTO@SiO2, Fig. 2d)29. Subsequently, two moieties were functionalized via silane chemistry: a fluorescent dye (Dye) using Dye-triethoxysilane (Dye-Si(OEt)3, Dye: 4,4-Difluoro-4-bora-3a,4a-diaza-s-indacene (BODIPY)), and carboxylate groups (-CO2−) using carboxyltriethoxysilane (CO2H-Si(OEt)3) (producing tBTO–Dye,CO2− NPs) (Fig. S2)30. Then, positively charged transferrin (Tf+) was electrostatically conjugated (tBTO–Dye,Tf+ NPs) to facilitate transferrin receptor (TfR)-mediated cellular uptake31,32.
The series of processes for surface chemistry of NPs (tBTO → tBTO@SiO₂ → tBTO–Dye,CO₂− → tBTO–Dye,Tf + NPs) was validated through the following measurements: i) Zeta-potential (Fig. 2e): The surface charge was observed at each stage. Notably, the introduction of CO2− groups resulted in the most negative charge, while the incorporation of Tf⁺ neutralized the charge, confirming successful functionalization. ii) Dynamic light scattering (Fig. 2f): Hydrodynamic size (dDLS) measurements at each stage serve as an indicator of colloidal stability. Initially, the dDLS of tBTO NPs was ~450 nm, suggesting that NPs without surface chemistry existed in an aggregated state in the solution. Subsequent surface chemistry steps reduced the dDLS to ~180 nm, indicating that the NPs became individually dispersed. iii) Fluorescence microscopy (Fig. 2g, h): The Dye attachments on individual NPs were analyzed through colocalization of scattering signals (Dark-field, DF) and fluorescence signals, demonstrating that most NPs were successfully conjugated with the Dye. Further quantitative analysis at the single-molecule level revealed that each tBTO–Dye,Tf+ NPs contained ~13 ( ± 9) Dye molecules (Fig. S3)33. iv) TfR targeting in live cells (Fig. 2h): To analyze specific targeting, we compared cellular uptake (attachment on cell membrane and internalization of tBTO–Dye,CO₂⁻ vs. tBTO–Dye,Tf⁺). Statistically significant increases in NPs uptake were observed for tBTO–Dye,Tf⁺ NPs, confirming successful targeting. This successful internalization is crucial as e-field amplification is highly localized. Confocal microscopy results confirmed this intracellular localization, revealing NPs were distributed within the cell (Fig. S4).
Surface-engineered tBTO NPs effectively inhibit cell proliferation under e-field
Through the synthesis and surface modification of NPs, we successfully stabilized ferroelectric materials in culture media, enabling imaging capabilities and targeted delivery in model cells. To confirm the inhibitory effect of tBTO–Dye,Tf+ NPs on cell proliferation under AC e-field conditions, we directly observed the cellular growth using optical microscopy.
An automated laboratory-scale system was developed for e-field stimulation of cultured cells, accommodating up to four 2D culture dishes (Fig. S5). To optimize energy efficiency, a high-performance single-crystal piezoelectric material was fabricated and utilized as the TTFields electrode34. Although the system is capable of generating voltages ranging from −48 V to +48 V, in practice, the applied voltage was limited to ±20 V to ensure that the e-field experienced by the cells did not exceed ~3 V/cm, thereby minimizing the risk of potential cellular damage. Additionally, temperature sensors were integrated into the electrodes and connected to a feedback control mechanism, allowing real-time adjustment of the applied voltage to maintain stable culture conditions and eliminate confounding thermal effects (Fig. S5a)35. As the electrodes were positioned beneath the insulating polystyrene culture dish, the applied AC field was capacitively coupled into the medium. Although this configuration reduces transmission efficiency compared to direct electrode–medium contact, the cells were nonetheless exposed directly to the effective field.
For visualization of cell, two U2OS cell lines stably expressing different fluorescent proteins (green: tubulin-EGFP, red: tubulin-mCherry) were co-cultured under identical conditions after treating the green cells with tBTO–Dye,Tf+ NPs (Fig. 3a). Under an external AC e-field (150 kHz, 3 V/cm, 3 days), the proliferation of green-labeled cells (containing tBTO–Dye,Tf+ NPs) was significantly reduced (~38%) compared to red control cells (without tBTO–Dye,Tf+ NPs) (Fig. 3b, c).

Co-culture and live-cell assays demonstrated that the efficacy of TTFields was significantly enhanced by tBTO–Dye,Tf⁺ NPs, as demonstrated through co-culture and live-cell. a A schematic illustration outlines the co-culture experiment setup, where only Green-labeled cells were treated with tBTO–Dye,Tf⁺ NPs. b, c Fluorescence images (b) and time-lapse analyses of cell ratios (c) show a noticeable reduction in proliferation in treated cells (n = 8/group). d–f The Live/Dead assay provides additional insights, with a schematic overview (d), representative fluorescence images (e), and survival rates after 72 h (f), indicating significantly reduced survival compared to the initial cell number. g, h Direct observation of cell growth at the same position further corroborates these findings, with a schematic depiction (g) and differential interference contrast images (h) illustrating inhibited growth and highlighting the robust enhancement of TTFields efficacy mediated by tBTO–Dye,Tf⁺ NPs. The error bars represent mean ± SD. Statistical analyses were performed using one-way ANOVA with Tukey’s post-hoc test. Significance is indicated as **p < 0.01, ***p < 0.001, and ****p < 0.0001; ns not significant.
This reduction in cell proliferation caused by the e-field and tBTO–Dye,Tf⁺ NPs may result from slowed proliferation rates or cell death. To clarify this, we performed a Live/Dead assay (Fig. 3d–f). After 72 h, the e-field alone led to an ~ 37% reduction in cell count compared to the control, with ~5% of cells identified as Dead. In contrast, the combined treatment of tBTO–Dye,Tf⁺ NPs and the e-field reduced the cell count by ~68%, with ~20% of cells classified as Dead. Although the assay does not capture in-situ observations, and detached dead cells during the 72-h period may have been underestimated, these findings suggest that the effects of the e-field and tBTO-Dye, Tf⁺ NPs extend beyond halting proliferation to include a significant induction of cell death. This conclusion is supported by a statistically significant decrease in the number of surviving cells and a corresponding increase in dead cells.
To further analyze cell growth, we monitored colony formation in different conditions (Fig. 3g, h). Non-treated control and cells treated with tBTO-Dye,Tf⁺ NPs (without e-field) showed no significant difference in proliferation under the microscope. However, when only the e-field was applied, a noticeable reduction in colony growth was observed, and when tBTO-Dye,Tf⁺ NPs and the e-field were combined, cell proliferation and migration appeared to nearly cease during 72 h (Fig. 3h, right). This trend was also reflected in quantitative analysis using 3-(4,5-dimethylthiazol-2-yl)-2,5-diphenyltetrazolium bromide (MTT) assays (Fig. S6). Untreated cells and cells treated with tBTO-Dye,Tf⁺ NPs (without e-field) showed no significant differences in proliferation.
Additionally, the application of the e-field resulted in a 23% reduction, and the combination of tBTO-Dye,Tf⁺ NPs and the e-field led to a 48% reduction in proliferation. These results indicate that tBTO effectively amplifies the e-field efficiency, significantly inhibiting both cell migration and growth, and quantitatively enhancing the growth-inhibitory effect of the e-field by ~2-fold. Since TTFields are reported to impede tubulin polymerization, thereby suppressing cell migration and growth, the effects observed in this study imply that the enhanced e-field amplification by tBTO-Dye,Tf⁺ NPs may have led to more efficient inhibition of tubulin polymerization36.
Investigating the role of ferroelectricity in the effective inhibition of proliferation under e-field
The observed perturbed cell growth is clearly attributed to the effects of the e-field and ferroelectric NPs, but the underlying molecular mechanisms remain unclear37. We considered three hypotheses: (1) reactive oxygen species (ROS) generation by the e-field or NPs, a known property of piezoelectric tBTO; (2) physical hindrance or intrinsic toxicity of the internalized NPs; and (3) e-field amplification by tBTO NPs, as suggested in prior TTFields studies. To investigate these possibilities, we designed and conducted targeted experiments for each (Fig. 4a).

Chemical and physical influences induce microtubule disruption around the ferroelectric NPs. The potential for tBTO–Dye,Tf⁺ NPs to disrupt microtubules through chemical and physical influences was systematically investigated. a A schematic illustration highlights the mechanisms by which ferroelectric nanoparticles may influence microtubule structures. b, c The DCFDA assay was employed to detect ROS generation, with representative fluorescence images (b) with a scale bar of 100 µm and corresponding fluorescence intensity measurements (c) revealing minimal ROS generation across different treatments (n = 30 per group). d, e ROS-induced degradation of RhB and MB was analyzed, showing concentration changes (C/C₀) for RhB (d) and MB (e). f A comparison of relative cell numbers after 72 h indicates a notable dependence on the dielectric constant of nanoparticles, with tBTO NPs (blue) exhibiting the most significant reduction, followed by cBTO NPs (green) and Au NPs (orange) (n = 8 per group). The error bars represent mean ± SD, with statistical comparisons performed using one-way ANOVA with Tukey’s post-hoc test. Significance is indicated as **p < 0.01; ***p < 0.001; ****p < 0.0001; ns, not significant.
To assess whether the applied e-field could activate the established piezocatalytic properties of tBTO, ROS generation was systematically evaluated as a potential cytotoxic mechanism38,39. First, we conducted a 2’,7’-dichlorodihydrofluorescein diacetate (DCFDA) assay, a fluorescent indicator of intracellular hydrogen peroxide (H2O2)40. Across all tested conditions, irrespective of the presence of the e-field or tBTO, DCFDA fluorescence remained negligible compared with that of the 100 µM H₂O₂ positive control (Fig. 4b, c)41.
Next, we performed more sensitive ROS-mediated dye degradation assays, which directly and immediately react with ROS, enabling the detection of transient ROS generation. Specifically, we monitored rhodamine B (RhB), which is selectively bleached by hydroxyl radicals (·OH), and methylene blue (MB), degraded by ·OH and superoxide anion radical (O2·−) (Fig. S7)42,43. No detectable dye degradation occurred under e-field conditions, indicating that ROS generation was negligible (Fig. 4d, e). In contrast, tBTO NPs generated substantial ROS under ultrasound stimulation, confirming their intrinsic piezocatalytic activity. These findings demonstrate that the therapeutic e-field does not elicit a significant piezoelectric catalytic reaction (e + O2 → O2·–, h+ + H2O → H+ + ·OH) in tBTO NPs. Furthermore, the observation that the SiO₂ shell (tBTO@SiO₂) suppresses this ultrasound-induced reaction further supports the efficacy of our surface engineering strategy in mitigating unintended chemical reactivity from external stimuli (Fig. S8). Collectively, these data indicate that ROS generation via piezocatalysis is unlikely to be the primary mechanism responsible for the therapeutic effects observed.
To precisely delineate the physical properties responsible for therapeutic amplification, we comparatively analyzed three types of NPs, each synthesized using an identical surface engineering protocol (Fig. S9)44,45. The selected NPs represented distinct physical properties: (i) Au NPs serving as the control with a low dielectric constant (ε ≈ 7) and no ferroelectricity, (ii) cBTO NPs possessing a higher dielectric constant (ε ≈ 500) but lacking ferroelectricity, and (iii) tBTO NPs with a very high dielectric constant (ε ≈ 3000) and pronounced ferroelectricity46,47,48.
The therapeutic efficacy of each NP type under an applied e-field was quantitatively assessed using an MTT assay, which revealed a clear stratification in cell growth inhibition (Fig. 4e). Notably, the negligible difference between the e-field-only and the Au NP groups confirmed that non-specific physical interference from NPs did not significantly contribute to cytotoxicity. A moderate enhancement was observed when comparing Au NPs to cBTO NPs: ~71-fold increase in the dielectric constant (from ε ≈ 7 to ε ≈ 500) yielded only an ~20% increase in growth inhibition, which can be attributed to passive concentration of the external e-field, in which a high dielectric constant distorts and focuses the field lines at the NP surface.
A markedly greater enhancement was observed when comparing cBTO and tBTO NPs. Although the dielectric constant increased by only ~6-fold (from ε ≈ 500 to ε ≈ 3000), the inhibitory effect more than doubled, from ~20% to ~52%. This disproportionate increase suggests a dominant amplification mechanism beyond passive dielectric effects. We attributed this effect to active amplification arising from the ferroelectric property of tBTO NPs, wherein their intrinsic spontaneous polarization reorients under the applied AC field and superimposes with it, resulting in a substantially augmented local therapeutic effect.
To theoretically validate the role of ferroelectricity, we conducted finite element simulations using the AC/DC module of COMSOL Multiphysics (Supplementary Note S1). The simulations qualitatively revealed that the e-field intensity becomes concentrated near the edges of the tBTO NPs. Although these results provide strong qualitative support for local field amplification, their quantitative interpretation is limited by uncertainties in material parameters such as the conductivity and permittivity of the cell culture environment. Nevertheless, the observed trend supports the hypothesis that ferroelectric polarization in tBTO NPs locally enhances the applied field and perturbs the molecular organization in their vicinity, contributing to the observed therapeutic effects.
Microtubule disruption by e-field and tBTO NPs
To investigate whether the subcellular architectures of the polar molecules near the ferroelectric NPs are altered, we employed super-resolution microscopy (SRRF, super-resolution radial fluctuation) to image the microtubules (MT, tubulin-mCherry) surrounding tBTO-Dye,Tf⁺ NPs in living cells49. MT is a well-known protein disrupted by TTFields50. In our experiments, MT were hypothesized to be the polar proteins most closely associated with the NPs during the initial hours following their internalization into the cell51. We further postulated that endosomes containing NPs would normally be transported along the MT network, but that exposure to an AC e-field could induce microtubule disorganization through the field interactions associated with the NPs (Fig. 5a).

The impact of tBTO–Dye,Tf⁺ NPs and AC e-field exposure on MT network was visualized using TIRF-SRRF. a A schematic illustration depicts the experimental setup for visualizing microtubule dynamics under TIRF-SRRF conditions. b Representative TIRF-SRRF images showing the time-dependent, color-coded lateral movements of individual tBTO–Dye,Tf⁺ NPs overlaid on MT structures (red). The images demonstrate a global disorganization of the MT network under combined e-field and NP treatment, rather than a spatially localized distuption. c Quantitative analysis compares the α values of tBTO–Dye,Tf⁺ NPs in the presence of TTFields, demonstrating a significant difference (n = 10 per group). The error bars are presented as mean ± SD, with statistical comparisons performed using a two-sided paired t test. Significance is indicated as ****p < 0.0001.
The results demonstrated a graded response depending on the treatment condition (Fig. 5b). Cells exposed to the e-field alone exhibited significantly shorter and more sparsely organized MT structures compared to untreated controls, thereby establishing the baseline effect of the e-field. When both the e-field and tBTO–Dye,Tf⁺ NPs were applied, MT disorganization became markedly more pronounced across the cellular field of view, suggesting a cooperative effect between the external field and the presence of ferroelectric NPs. These findings provide visual evidence that the amplified e-field associated with tBTO NPs contributes to broad cytoskeletal disorganization rather than a strictly localized effect.
This conclusion was further supported by tracking of endosome movement within the cells (Fig. 5c). TfR-mediated endosomes (containing tBTO-Dye,Tf⁺ NPs, green fluorescence) initially displayed directional transport along the cytoskeleton (α = 1.41, mean square displacement <r2 > ∝τα, where τ = time lag), characteristic of endosomes moved by motor proteins52. However, when the MT network becomes disorganized, the trajectories of the NPs were significantly restricted, resulting in confined diffusion (α = 0.21)53.
Collectively, these findings indicate that the amplified e-field and tBTO NPs jointly induce sidespread MT disorganization. Although direct quantification of structural damage remains challenging, these data consistently support the proposed mechanism and justify further investigation of its functional cellular consequences.
Quantitative analysis of cellular behavior under e-field and tBTO NPs
Typically, MT disruption leads to impediments in cell migration, proliferation, and morphology54,55,56. To quantitatively analyze these effects, we tracked cells using an optical microscope to assess migration, proliferation, and morphological changes (Fig. 6a). Multiple single cells within a field of view were simultaneously tracked, with positional data, cell count, and cell area recorded over time. For this, we used artificial intelligence-based single-cell tracking algorithms (Fig. S10). The positional data (x, y) were converted into displacement (D) to quantify migration, the cell count (N) was analyzed to measure proliferation, and the area (A) provided insights into cell shrinkage.

Cellular behavior analysis for quantification of microtubule destruction. The effects of microtubule destruction on cellular behavior were quantified through analyses of displacement (D), cell number (N), and area (A). a A schematic illustration outlines the parameters measured to evaluate cellular responses. b Cell trajectories were tracked under different treatments, providing insights into changes in migration patterns. c–e Quantitative comparisons were made for migration speed (c), proliferation rate (d), and cell size (e) over 72 hours, highlighting distinct responses to treatments. Groups included controls (black), TTFields alone (red), TTFields with tBTO–Dye,Tf⁺ NPs (blue), and standard drugs, nocodazole (green) and paclitaxel (yellow) (n = 50 per group). The combined treatment of TTFields with tBTO–Dye,Tf⁺ NPs exhibited significantly enhanced effects compared to other conditions. The error bars are presented as mean ± SD, and statistical analyses were conducted using one-way ANOVA with Tukey’s post-hoc test. Significance is indicated as ****p < 0.0001; ns not significant.
The results demonstrated that both e-field and tBTO-Dye,Tf⁺ NPs treatments significantly reduced cell migration speeds, consistent with previous results (Fig. 6b). Quantitatively, e-field alone reduced migration speed by 30.3% compared to the control, while e-field combined with tBTO-Dye,Tf⁺ NPs led to a 68.4% reduction.
We compared these findings to the phenotypic changes observed in cells treated with microtubule polymerization inhibitors (nocodazole) and stabilizers (paclitaxel) (Fig. 6c)57,58. Although these two molecules affect tubulin through opposing mechanisms, both inhibit migration and proliferation while causing cell shrinkage, depending on their concentrations. By comparing the results with the calibration curves for these drugs, we found that the effects of e-field alone on cell migration were equivalent to 0.9 nM paclitaxel or 0.21 μM nocodazole. In contrast, the combined treatment of e-field and tBTO-Dye,Tf + NPs corresponded to 4.0 nM paclitaxel or 0.95 μM nocodazole. These results indicate that tBTO enhanced the e-field effects by ~4.5-fold.
We also quantified cell proliferation (N/N0, Fig. 6d) and cell morphology (A, Fig. 6e) using the same approach. In each experiment, the corresponding concentrations of nocodazole and paclitaxel varied slightly within the margin of error, depending on the specific phenotype measured. However, in all cases, the consistent trend was that tBTO amplified the effects of the e-field.
For cell proliferation, a noteworthy observation was that the e-field amplification effect of tBTO was not apparent during the first 24–48 h but became significant afterward (Fig. 6d). This suggests that while the e-field alone can exert relatively immediate effects on cell migration and focal adhesion, its impact on cell growth requires cumulative stimuli or prolonged exposure. These prolonged effects may be necessary to disrupt intracellular signaling pathways and transport mechanisms critical for cell growth or to surpass the threshold required to induce growth inhibition. These results suggest that physical stimuli, such as e-field, and the amplification of their effects may operate in a stepwise or nonlinear manner. This phenomenon naturally arises from the interactions between physical stimuli and cellular components. Therefore, such variables could serve as therapeutic tunable parameters and critical factors for preventing side effects in the development of future medical technologies utilizing electronic devices.
This study introduces a novel approach using ferroelectric BTO NPs to enhance the efficacy of e-field-based therapies, particularly supporting the TTFields technology, with significant potential for advancing cancer treatment, especially in brain tumors.
First, we demonstrated precise control over the stability and cellular targeting of ferroelectric NPs through surface chemical engineering. This surface modification strategy ensures uniform colloidal dispersion and effective local amplification of an e-field. Moreover, the platform presents a foundational surface chemistry that can be extended to include conjugation with small-molecule drugs, protein-based therapies, and antibodies, offering versatile applicability in future biomedical innovations.
Second, we experimentally validated the critical role of ferroelectricity in amplifying the e-field. Comparative studies with non-ferroelectric Au and low-ferroelectric cBTO NPs clearly established the essential role of tBTO NPs, due to their superior ferroelectric properties, in disrupting microtubule dynamics and suppressing cell proliferation. Numerical simulations further corroborated these findings, showing more than a two-fold local amplification of the e-field near the tBTO NPs.
In addition, advanced super-resolution microscopy and AI-based single-cell tracking enabled quantitative measurements of the effects of NPs and e-field on cellular migration, proliferation, and morphology. These analyses suggest that physical stimuli may exert nonlinear effects, providing a basis for developing tunable parameters in future electromagnetic-based medical technologies.
This study provides a foundation for developing targeted e-field therapies. While conducted in vitro, challenges such as targeted delivery and long-term safety remain before clinical use. Future strategies could include systemic or intratumoral delivery, and improved targeting through advanced surface engineering such as antibody conjugation59,60,61. Therefore, this work establishes the core principles and a quantitative framework to advance next-generation e-field therapies toward clinical application.
Methods
Synthesis of BTO NPs
To synthesize cBTO NPs, a solvothermal technique, adapted from a previously documented method, was employed to produce BTO NPs. The process began with the preparation and mixing of two solutions: 20 mL of a 2.5 M titanium(IV) butoxide solution in ethanol. Afterward, 7 mL of NH3OH solution was introduced gradually while stirring continuously. The mixed solution was heated at 200 °C for 48 h in a 100-mL Teflon-lined stainless-steel autoclave. Once the mixture was naturally cooled to ambient temperature, the product was extracted by centrifugation. It was then meticulously washed with acetic acid and high-purity ethanol. Finally, the products were dried in an oven at 80 °C for 24 h. To induce the phase transition from cBTO to tBTO, the synthesized cBTO was heated at 800 °C for 10 h in an air-filled tube furnace. The resultant was then cooled to room temperature.
Synthesis of tBTO@SiO2
To enhance the encapsulation efficiency, we performed hydroxylation prior to SiO₂ coating. Specifically, 10 mg of tBTO powder was dispersed in 20 mL of a H₂O₂ solution after 30 min of sonication. The mixture was subsequently heated in a silicone oil bath at 85 °C for 6 h under reflux. After cooling naturally to ambient temperature, the product was washed with DI water and ethanol. Subsequently, the Stöber technique was employed to synthesize tBTO@SiO₂. Initially, 1 mL of 1.2 nM hydroxylated tBTO was combined with 39 mL of ethanol. Then, 400 µL of 28% NH₃OH solution was introduced and vigorously agitated. A total of 150 µL of 10 mM TEOS in ethanol was added to three separate aliquots at 30-min intervals, and the solution was incubated for 3 h. The resultant was washed with ethanol and resuspended in DI water.
Synthesis of BODIPY-Si(OEt)3
In an oven-dried flask under N2, 15 mL of 1.0 M solution of bromobenzene in anhydrous THF was added dropwise to 12 mL of 1.25 M magnesium in anhydrous THF. Following complete magnesium consumption, pyrrole (1.00 g, 15.0 mmol) was introduced, and the mixture underwent agitation for 3 h in darkness at ambient temperature. 45 mL of 0.13 M 10-undecenoyl chloride solution in anhydrous THF was added, and the mixture was subjected to continuous stirring throughout the night. The reaction was terminated using saturated aqueous NH4Cl, and the mixture was extracted with ethyl acetate. The resultant was rinsed with DI water, dried over sodium sulfate, and filtered. The solvent was then removed under vacuum. The resulting residue was purified by silica gel chromatography using 10% ethyl acetate in hexane (Rf = 0.3). The pale brown oil was yielded by solvent evaporation and in vacuo (0.94 g, 67%). 1H NMR (400 MHz, CDCl3) δ 10.56 (s, 1H), 7.06 (d, J = 3.2 Hz, 1H), 6.94 (d, J = 4.1 Hz, 1H), 6.26 (q, J = 2.1 Hz, 1H), 5.82 (ddt, J = 17.1, 11.3, 5.3 Hz, 1H), 5.10–4.72 (m, 2H), 2.79 (t, J = 7.6 Hz, 2H), 2.6–2.22 (dt, J = 29.0, 7.5 Hz, 14H).
1 (0.82 g, 3.52 mmol) and 2,4-dimethylpyrrole (0.33 g, 3.52 mmol) were combined in DCM with magnetic stirring. Under inert condition, the mixture was cooled to 0 °C, 0.69 mL of 10.7 M phosphoryl chloride aqueous solution was introduced dropwise. The mixture was stirred for 1 h and then allowed to stir under ambient conditions overnight. After careful addition of water, the organic phase was thoroughly washed and subsequently dried over anhydrous magnesium sulfate. The solvent was then eliminated under vacuum, and the resulting intermediate was subjected to vacuum drying at 50 °C overnight. The intermediate was subsequently dissolved in anhydrous DCM in a flame-dried flask. Under an inert atmosphere and temperature, a 3.18 mL of triethylamine and a 3.9 mL of trifluoride diethyl etherate were introduced dropwise to the intermediate solution. The mixture was then stirred at an ambient temperature for 6 h. The reaction was quenched and purified by adding sufficient DI water. The product was dried over magnesium sulfate and kept under a vacuum. The final product was isolated via silica gel chromatography using 15% ethyl acetate in hexane (Rf = 0.4). The brown oil was isolated by solvent evaporation and in vacuo (0.55 g, 43%). 1H NMR (400 MHz, CDCl3) δ 7.52 (s, 1H), 6.98 (d, J = 3.9 Hz, 1H), 6.36 (dd, J = 4.1, 2.3 Hz, 1H), 6.09 (s, 1H), 5.89–5.72 (td, J = 17.0, 6.9 Hz, 1H), 5.05–4.91 (dd, J = 23.7, 13.6 Hz, 2H), 3.04–2.83 (m, 2H), 2.60–2.55 (s, 3H), 2.47–2.40 (s, 3H).
In an oven-dried flask under N2 atmosphere, 2 (0.1 g, 0.3 mmol) was combined with toluene and a magnetic stirrer. The solution was supplemented with triethoxysilane (0.9 mmol) and Karstedt’s catalyst (platinum (0)-1,3-divinyl-1,1,3,3-tetramethyldisiloxane; 2% Pt in xylenes, 0.01 mL, 0.43 mmol Pt). The mixture was then heated to 50 °C and agitated for 12 h. Continued agitation was followed by TLC analysis (10% ethyl acetate in hexanes Rf = 0.3). The resulting solution was applied directly to a silica gel column using ethyl acetate in hexane. Following solvent evaporation and treatment in vacuo, a pale brown oil was obtained (0.06 g, 41% yield). 1H NMR (400 MHz, CDCl3) δ 7.60 (s, 1H), 7.06 (d, J = 3.9 Hz, 1H), 6.43 (dd, J = 4.1, 2.1 Hz, 1H), 6.16 (s, 1H), 3.82 (q, J = 7.0 Hz, 6H, 2.98–2.86 (m, 2H), 2.60-2.54 (s, 3H), 2.47–2.39 (s, 3H).
Synthesis of tBTO-Dye,Tf+
The synthesis of tBTO-Dye and CO₂H was achieved through silanol condensation. Initially, 200 µL of 0.6 nM tBTO NPs@SiO₂ was combined with 1 µL of 28% NH₃OH solution in a 1.5 mL container. Following a 10-min interval, 1 µL of carboxyethylsilanetriol (2.5% aqueous solution) and 1 µL of 9.45 mM BODIPY-Si(OEt)₃ were added sequentially. The mixture was allowed to react overnight. Subsequently, the reaction mixture was washed with ethanol and resuspended in DI water.
The synthesis of Dye- and transferrin (Tf)-conjugated tBTO NPs@SiO₂ (tBTO-Dye,Tf+) was conducted with minor modifications to a previously described protocol. Briefly, 10 µL of 1 mM holo-transferrin solution was combined with 10 µL of the newly synthesized 30 nM tBTO-Dye,CO₂H and 10 µL of MES buffer (pH 5.7). The mixture was then agitated for 12 h. Subsequent purification was achieved by centrifugation, after which the resulting product was suspended in DMEM and immediately utilized. An identical procedure was employed for the preparation of the cBTO-Dye,Tf+ conjugate.
Synthesis of Au-Dye,Tf
Au NPs were synthesized following a modified approach based on a previously reported method62. Initially, a solution comprising 0.25 mM HAuCl₄ and 100 mM CTAB in 10 mL of water was prepared and homogenized. A freshly prepared 0.6 mL of 10 mM NaBH₄ solution was rapidly introduced, resulting in an instantaneous color transition to brown. The mixture was agitated for 2 min and then kept at 27 °C for 3 h. Subsequently, 1.5 mL of 100 mM ascorbic acid, and 50 µL of CTAB-Au solution were added to 2 mL of 200 mM CTAC. This was followed by a single injection of 2 mL of 0.5 mM HAuCl₄. The reaction was carried out for 15 min. The resulting product was washed with DI water, and resuspended in 1 mL of 20 mM CTAC, yielding 10 nm Au nanospheres. Next, 130 µL of 10 mM ascorbic acid, and 10 µL of the seed solution were added to 2 mL of 100 mM CTAC. Subsequently, 2 mL of 0.5 mM HAuCl₄ was added dropwise. The mixture was maintained for 10 min. The resulting 46 nm Au nanospheres were washed with DI water and resuspended in 0.86 mL of DI water. Finally, 130 µL of 10 mM ascorbic acid, and 100 µL of the 46 nm seed solution were added to 2 mL of 100 mM CTAC. This was followed by the dropwise addition of 2 mL of 0.5 mM HAuCl₄. The mixture was maintained for 10 min. The final product was washed and stored with DI water.
The synthesis of Au NPs@SiO₂ was conducted using a previously described method with minor modifications. Initially, 200 µL of 7 nM freshly prepared Au NPs were introduced into 8.8 mL of DI water. Subsequently, 88 µL of 0.1 M NaOH solution was added, followed by the introduction of 80 µL of a 20 v/v% TEOS-in-methanol solution. The mixture was then incubated for 30 min, after which two additional aliquots of the TEOS solution were introduced at identical intervals. The solution was left undisturbed for 3 days. The final product was obtained by centrifugation, and the resulting pellet was resuspended in ethanol. The preparation of Au-Dye,Tf+ followed the same protocol as described above.
Characterization
The synthesized NPs were subjected to comprehensive analysis utilizing various advanced techniques. Field-emission transmission electron microscopy (FE-TEM; Hitachi HF-3300) at 300 kV and field-emission scanning electron microscopy (FE-SEM; Hitachi S-4800) at 3 kV were employed for imaging. XRD (Panalytical Empyrean) with Cu Kα radiation provided structural information. The optical properties were examined using UV–Vis spectroscopy (Agilent Cary 8454), while the functional groups were identified using FT-IR (Thermo Scientific Nicolet Continuum). The extinction coefficient was determined by inductively coupled plasma-optical emission spectroscopy (ICP-OES; PerkinElmer Optima 7300DV & Avio 500). For TEM analysis, NPs were deposited on a Cu grid cleaned with O2 plasma (Gatan 950 M) to eliminate contaminants. Zetasizer nanoseries (Malvern, MAL1160456) was used to measure the effective surface charge and hydrodynamic size of the NPs.
Cell culture and sampling
U2OS cells were cultured in T25 flasks containing DMEM supplemented with FBS, penicillin, and streptomycin. The cells were sub-cultured for 3–4 day intervals and incubated at 37 °C in a humidified incubator (Binder, Model C 170) with 5% CO₂. For all experiments, the cells were grown on Collagen I-coated glass substrates (Marienfeld, 0111580). After seeding 5 × 10³ U2OS cells per substrate under identical conditions, 100 µg/mL of NPs-Dye,Tf+ was added after a minimum of 12 h of initial culture. The samples were subsequently incubated for 30 min at 37 °C and rinsed five times with DMEM supplemented with 10% FBS.
TTFields experiments
A 4-channel electric field generator was constructed and integrated into a laboratory-automated system controlled by LabVIEW software. Cells in glass-bottom dishes were positioned on a ceramic dish for TTFields. The ceramic dish, connected to the TTFields generator, was incubated at 37 °C in an incubator with continuous temperature monitoring to assess the potential electric field-induced heating effects. To determine the optimal parameters for the U2OS cells, TTFields were applied at a constant field strength (3 V/cm) across various frequencies (100–500 kHz). Subsequent to these initial experiments, all further TTField studies were conducted under standardized conditions (150 kHz, 3 V/cm).
LIVE/DEAD assay
To evaluate cell viability, a LIVE/DEAD assay was conducted under three experimental conditions: control, TTFields only, and TTFields with tBTO-Dye,Tf+. Cells cultured on glass substrates were incubated for 3 days, then exposed to 2 mL of LIVE/DEAD solution containing 1 μM calcein acetoxymethyl ester (Calcein-AM) and 2 μM ethidium homodimer-1 (EthD-1) in D-PBS. Following a 45-min incubation period, fluorescence images were acquired in the green and red channels, indicating live and dead cells, respectively.
MTT assay
To evaluate cell viability under different experimental conditions, a 5 mg/mL MTT solution was prepared by dissolving MTT powder in PBS, followed by filtration through a 0.2 µm membrane prior to use. All MTT assay was performed after 3 days under various experimental conditions. After 3 days of incubation, the culture medium was aspirated, and 200 μL of MTT solution (diluted 1:10 in DMEM) was added. Following a 1 h incubation period, the MTT solution was carefully removed and 200 μL of DMSO was introduced to solubilize the formazan crystals. The specimens were agitated for 15 min, and the absorbance at 540 nm was measured using a plate reader.
DCFDA assay
The DCFDA assay was conducted to assess the production of ROS. The experimental groups were incubated for 3 days. Subsequently, the cells were exposed to a 25 μM DCFDA solution for 45 min and incubated at 37 °C. The cells were rinsed with PBS and immersed in 1 mL phenol red-free DMEM supplemented with FBS, penicillin, and streptomycin. The samples were then positioned on a microscope. Fluorescence images were acquired using a green channel to evaluate the DCFDA signal.
Rhodamine b and methylene blue degradation
The catalytic efficiency of the tBTO NPs was evaluated through the degradation of organic dyes. A suspension was prepared by combining 1 mg of NPs with 10 mL of an organic dye solution (rhodamine B: 1 mg/L, methylene blue: 3 mg/L). The mixture was agitated in the dark overnight to achieve adsorption–desorption equilibrium prior to the introduction of external stimuli. The experiment was performed under four distinct conditions for 4 h: 1) tBTO alone, 2) TTFields combined with tBTO, 3) ultrasound with tBTO, and 4) ultrasound with tBTO@SiO₂. Ultrasonic treatment was conducted in a bath sonicator equipped with external water circulation to mitigate thermal influences. Samples were extracted at predetermined intervals and centrifuged to remove residual NPs, and the absorbance of the supernatant was measured using a UV–vis spectrophotometer (Agilent Cary 8454). The relative concentration ratio (C/C₀) was plotted against time, with C and C₀ representing the remaining and initial dye concentrations, respectively.
Nocodazole and paclitaxel treatment
To quantitatively evaluate the effects of microtubule disruption on cellular behavior, microtubule-targeting drugs were utilized, such as paclitaxel (which stabilizes microtubules) and nocodazole (which inhibits microtubules). These compounds were initially solubilized in DMSO and subsequently diluted to specific concentrations in DMEM supplemented with FBS, penicillin, and streptomycin (paclitaxel, 0.00001–1 µM; nocodazole, 0.0001–10 µM). The culture medium of pre-seeded cells was removed and replaced with a medium. For continuous observation, the samples were positioned on a pre-warmed microscope stage, and bright-field (BF) DIC images were acquired over a period of 3 days.
Optical microscopy
Imaging experiments encompassing BF, DF, epifluorescence, and total internal reflection fluorescence (TIRF) were conducted using an inverted microscope (Nikon ECLIPSE Ti2-E) equipped with a motorized stage (TI2-S-SE-E), a perfect focus system (PFS, TI2-N-ND-P), and a stage-top incubator (Okolab, UNO-T-H-PREMIXED) that regulated temperature, humidity, and CO₂ levels. Image acquisition was performed using electron-multiplying charge-coupled devices (EM-CCDs; Andor iXon Ultra 897). A laser unit (Nikon LU-N4; 405/488/561/640 nm) provided TIRF illumination, whereas DF, conventional epifluorescence, or BF imaging employed either a mercury lamp (Nikon C-HGFIE Intensilight) or an LED lamp (Nikon TI2-D-LHLED). Confocal imaging experiments were conducted using confocal laser scanning microscopy (ZEISS LSM900). 405/488/561 nm laser was selected as an excitation laser for observing nucleus/tBTO-Dye,Tf+/MT, respectively. Super-resolution microscopic images of microtubules using (SRRF) microscopy were generated by examining 100-frame TIRF image stacks using the SRRF-stream algorithm (Andor). BF differential interference contrast (DIC) and epifluorescence images were obtained using a ×10 objective lens (Nikon CFI Plan Apochromat, 0.45 NA) equipped with a DIC slider (MBH76220). A ×100 oil-immersion lens (Nikon CFI Apochromat TIRF, 1.49 NA) was used for the DF, TIRF, and SRRF imaging. For live-cell imaging, the stage-top incubator was maintained at 37 °C with 5% CO₂ and 80% humidity. All post-acquisition processing and analyses were performed using ImageJ software.
Statistical analysis
All results are presented as mean values with standard deviations based on the specified number of replicates. GraphPad Prism 8.0 was used for statistical analyses, applying two-tailed Student’s t test or one-way ANOVA with relevant post-hoc tests. The GraphPad Prism 8.0 was utilized for nonlinear curve fitting, specifically, a plateau followed by a one-phase decay. ImageJ software was used to quantify the fluorescence intensity and analyze the cell dimensions63,64.
Single-particle tracking
A U2OS cell line with stable expression of tubulin-mCherry was exposed to 100 µg/mL of BTO–Dye,Tf+. To focus on relevant signals, the analysis was restricted to NPs that coincided with microtubule locations identified through TIRF-SRRF imaging. An epifluorescence microscope was used to capture the fluorescence trajectories of the individual NPs. The imaging process was conducted for 30 s, with each frame having a 100 ms exposure and no intervals between frames. Particle trajectories were extracted from the resulting image stacks using TrackNTrace software in MATLAB 2020a65. The mean squared displacement (MSD) of BTO–Dye,Tf+ was derived from these trajectories, utilizing 50-frame segments with maximum time lag. The diffusion coefficient (D) and directionality (α) for each observed jump distance (r) sequence were assessed through MSD analysis, employing the first four points of lag time (τ) for linear fitting, as per the following equation:
$$leftlangle {{boldsymbol{r}}}^{{bf{2}}}left({boldsymbol{tau }}right)rightrangle ={bf{4}}{boldsymbol{D}}{{boldsymbol{tau }}}^{{boldsymbol{alpha }}}$$
To enhance the accuracy of D determination, the initial ten points in the MSD plot were utilized. This analytical approach facilitated the evaluation of whether nanoparticles exhibited directional or confined movement within the cellular environment.
Single-cell tracking
To visualize the nuclei, cells were subjected to a 10-minute incubation with Hoechst (5 µg/mL) in the culture medium at 37 °C. Following the removal of excess dye through three PBS washes, DIC and Hoechst fluorescence images were acquired. An artificial intelligence-based image conversion algorithm (Nikon NIS-AI) was trained utilizing 2500 paired cell images (DIC and Hoechst-stained at identical positions). Nucleus locations were determined by identifying the intensity maxima (x,y) subsequent to background subtraction and Gaussian filtering, with further refinement employing two-dimensional cubic spline interpolation. The algorithm’s performance was evaluated by comparing AI-predicted nucleus positions to those from Hoechst-stained images. Accuracy was quantified by measuring the localization error distance, and positional consistency was examined across multiple datasets. Following validation, AI-generated nuclear images were used for single-cell tracking analysis.
Data availability
The data supporting the results in this study are available within the paper and its Supplementary Information. The raw and analyzed datasets generated during the study are available for research purposes from the corresponding author upon reasonable request.
References
-
Mirvakili, S. M. & Langer, R. Wireless on-demand drug delivery. Nat. Electron. 4, 464–477 (2021).
-
Lee, H. et al. Device-assisted transdermal drug delivery. Adv. Drug Deliv. Rev. 127, 35–45 (2018).
-
Rominiyi, O. et al. Tumour treating fields therapy for glioblastoma: current advances and future directions. Br. J. Cancer 124, 697–709 (2021).
-
Mun, E. J., Babiker, H. M., Weinberg, U., Kirson, E. D. & Von Hoff, D. D. Tumor-treating fields: a fourth modality in cancer treatment. Clin. Cancer Res. 24, 266–275 (2018).
-
Kirson, E. D. et al. Disruption of cancer cell replication by alternating electric fields. Cancer Res 64, 3288–3295 (2004).
-
Kirson, E. D. et al. Alternating electric fields arrest cell proliferation in animal tumor models and human brain tumors. Proc. Natl. Acad. Sci. USA 104, 10152–10157 (2007).
-
Stupp, R. et al. NovoTTF-100A versus physician’s choice chemotherapy in recurrent glioblastoma: a randomised phase III trial of a novel treatment modality. Eur. J. Cancer 48, 2192–2202 (2012).
-
Blatt, R. et al. In vivo safety of tumor treating fields (TTFields) applied to the torso. Front. Oncol. 11, 670809 (2021).
-
Trusheim, J. et al. A state-of-the-art review and guidelines for tumor treating fields treatment planning and patient follow-up in glioblastoma. CNS Oncol. 6, 29–43 (2017).
-
Gentilal, N. & Miranda, P. C. Heat transfer during TTFields treatment: Influence of the uncertainty of the electric and thermal parameters on the predicted temperature distribution. Comput. Methods Prog. Biomed. 196, 105706 (2020).
-
Lang, S. T., Gan, L. S., McLennan, C., Monchi, O. & Kelly, J. J. P. Impact of peritumoral edema during tumor treatment field therapy: a computational modelling study. IEEE Trans. Biomed. Eng. 67, 3327–3338 (2020).
-
Yang, X. et al. Skull modulated strategies to intensify tumor treating fields on brain tumor: a finite element study. Biomech. Model. Mechanobiol. 21, 1133–1144 (2022).
-
Genchi, G. G., Marino, A., Rocca, A., Mattoli, V. & Ciofani, G. Barium titanate nanoparticles: Promising multitasking vectors in nanomedicine. Nanotechnology 27, 232001 (2016).
-
Hao, Y. et al. Significantly enhanced energy storage performance promoted by ultimate sized ferroelectric BaTiO3 fillers in nanocomposite films. Nano Energy 31, 49–56 (2017).
-
Dang, Z. M., Yuan, J. K., Yao, S. H. & Liao, R. J. Flexible nanodielectric materials with high permittivity for power energy storage. Adv. Mater. 25, 6334–6365 (2013).
-
Smith, M. B. et al. Crystal structure and the paraelectric-to-ferroelectric phase transition of nanoscale BaTiO3. J. Am. Chem. Soc. 130, 6955–6963 (2008).
-
Kwei, G. H., Lawson, A. C., Billinge, S. J. L. & Cheong, S. W. Structures of the ferroelectric phases of barium titanate. J. Phys. Chem. 97, 2368–2377 (1993).
-
Wu, L. et al. Ferroelectric BaTiO3 regulating the local electric field for interfacial stability in solid-state lithium metal batteries. ACS Nano 18, 5498–5509 (2023).
-
Albanese, A., Tang, P. S. & Chan, W. C. W. The effect of nanoparticle size, shape, and surface chemistry on biological systems. Annu. Rev. Biomed. Eng. 14, 1–16 (2012).
-
Nam, J. et al. Surface engineering of inorganic nanoparticles for imaging and therapy. Adv. Drug Deliv. Rev. 65, 622–648 (2013).
-
Gubala, V., Giovannini, G., Kunc, F., Monopoli, M. P. & Moore, C. J. Dye-doped silica nanoparticles: Synthesis, surface chemistry and bioapplications. Cancer Nano 11, 1 (2020).
-
Li, X., Liu, K., Xing, L. & Rubinsky, B. A review of tumor treating fields (TTFields): advancements in clinical applications and mechanistic insights. Radiol. Oncol. 57, 279–291 (2023).
-
Giladi, M. et al. Mitotic disruption and reduced clonogenicity of pancreatic cancer cells in vitro and in vivo by tumor treating fields. Pancreatology 14, 54–63 (2014).
-
Lee, H. W., Moon, S., Choi, C. H. & Kim, D. K. Synthesis and size control of tetragonal barium titanate nanopowders by facile solvothermal method. J. Am. Ceram. Soc. 95, 2429–2434 (2012).
-
Fang, J., Nakamura, H. & Maeda, H. The EPR effect: unique features of tumor blood vessels for drug delivery, factors involved, and limitations and augmentation of the effect. Adv. Drug Deliv. Rev. 63, 136–151 (2011).
-
Li, M. et al. Surface modification of Stöber silica nanoparticles with controlled moiety densities determines their cytotoxicity profiles in macrophages. Langmuir 35, 14688–14695 (2019).
-
Wu, J., Qin, N. & Bao, D. Effective enhancement of piezocatalytic activity of BaTiO3 nanowires under ultrasonic vibration. Nano Energy 45, 44–51 (2018).
-
Chang, S. J., Liao, W. S., Ciou, C. J., Lee, J. T. & Li, C. C. An efficient approach to derive hydroxyl groups on the surface of barium titanate nanoparticles to improve its chemical modification ability. J. Colloid Interface Sci. 329, 300–305 (2009).
-
Stöber, W., Fink, A. & Bohn, E. Controlled growth of monodisperse silica spheres in the micron size range. J. Colloid Interface Sci. 26, 62–69 (1968).
-
Gupta, G., Lee, J. & Lee, C. Y. Synthesis, crystal structure, and photophysical properties of mono nuclear and di nuclear palladium BODIPY chromophores. Bull. Korean Chem. Soc. 44, 390–394 (2023).
-
Tortorella, S. & Karagiannis, T. C. Transferrin receptor-mediated endocytosis: a useful target for cancer therapy. J. Membr. Biol. 247, 291–307 (2014).
-
Jin, S. et al. Two GPSes in a ball: Deciphering the endosomal tug-of-war using plasmonic dark-field STORM. JACS Au 2, 1596–1603 (2022).
-
Ahn, Y., Park, M. & Seo, D. Observation of reactions in single molecules/nanoparticles using light microscopy. Bull. Korean Chem. Soc. 44, 35–44 (2023).
-
Kang, S. J. L., Park, J. H., Ko, S. Y. & Lee, H. Y. Solid-state conversion of single crystals: the principle and the state-of-the-art. J. Am. Ceram. Soc. 98, 347–360 (2015).
-
Berkelmann, L. et al. Tumour-treating fields (TTFields): investigations on the mechanism of action by electromagnetic exposure of cells in telophase/cytokinesis. Sci. Rep. 9, 7362 (2019).
-
Giladi, M. et al. Mitotic spindle disruption by alternating electric fields leads to improper chromosome segregation and mitotic catastrophe in cancer cells. Sci. Rep. 5, 18046 (2015).
-
Yoon, Y. N., Lee, D. S., Park, H. J. & Kim, J. S. Barium titanate nanoparticles sensitise treatment-resistant breast cancer cells to the antitumor action of tumour-treating fields. Sci. Rep. 10, 2560 (2020).
-
Zhu, P., Chen, Y. & Shi, J. Piezocatalytic tumor therapy by ultrasound-triggered and BaTiO3-mediated piezoelectricity. Adv. Mater. 32, 2001976 (2020).
-
Wang, Y. et al. Piezo-catalysis for nondestructive tooth whitening. Nat. Commun. 11, 1328 (2020).
-
Eruslanov, E. & Kusmartsev, S. Identification of ROS using oxidized DCFDA and flow-cytometry. Methods Mol. Biol. 594, 57–72 (2010).
-
Lee, K. et al. Sunlight-activatable ROS generator for cell death using TiO2/ c-Si microwires. Nano Lett. 21, 6998–7004 (2021).
-
Wu, T., Liu, G., Zhao, J., Hidaka, H. & Serpone, N. Photoassisted degradation of dye pollutants. V. Self-photosensitized oxidative transformation of Rhodamine B under visible light irradiation in aqueous TiO2 dispersions. J. Phys. Chem. B 102, 5845–5851 (1998).
-
Houas, A. et al. Photocatalytic degradation pathway of methylene blue in water. Appl. Catal. B Environ. 31, 145–157 (2001).
-
Mao, Z. et al. Titanium dioxide nanoparticles alter cellular morphology via disturbing the microtubule dynamics. Nanoscale 7, 8466–8475 (2015).
-
Choudhury, D. et al. Unprecedented inhibition of tubulin polymerization directed by gold nanoparticles inducing cell cycle arrest and apoptosis. Nanoscale 5, 4476–4489 (2013).
-
Yan, B. & Yang, Y. Comment on “simulation of the optical absorption spectra of gold nanorods as a function of their aspect ratio and the effect of the medium dielectric constant. J. Phys. Chem. B 107, 3237910–3237910 (2003).
-
Johnson, P. B. & Christy, R. W. Optical constants of the noble metals. Phys. Rev. B 6, 4370–4379 (1972).
-
Petrovsky, V., Petrovsky, T., Kamlapurkar, S. & Dogan, F. Dielectric constant of barium titanate powders near curie temperature. J. Am. Ceram. Soc. 91, 3590–3592 (2008).
-
Gustafsson, N. et al. Fast live-cell conventional fluorophore nanoscopy with ImageJ through super-resolution radial fluctuations. Nat. Commun. 7, 12471 (2016).
-
Li, X. et al. Electrodynamic interaction between tumor treating fields and microtubule electrophysiological activities. APL Bioeng. 8, 026118 (2024).
-
Jin, M. & Snider, M. D. Role of microtubules in transferrin receptor transport from the cell surface to endosomes and the Golgi complex. J. Biol. Chem. 268, 18390–18397 (1993).
-
Hancock, W. O. Bidirectional cargo transport: moving beyond tug of war. Nat. Rev. Mol. Cell Biol. 15, 615–628 (2014).
-
Burov, S., Jeon, J. H., Metzler, R. & Barkai, E. Single particle tracking in systems showing anomalous diffusion: The role of weak ergodicity breaking. Phys. Chem. Chem. Phys. 13, 1800–1812 (2011).
-
Etienne-Manneville, S. Microtubules in cell migration. Annu. Rev. Cell Dev. Biol. 29, 471–499 (2013).
-
Hyman, A. A. & Karsenti, E. Morphogenetic properties of microtubules and mitotic spindle assembly. Cell 84, 401–410 (1996).
-
Rodriguez, O. C. et al. Conserved microtubule-actin interactions in cell movement and morphogenesis. Nat. Cell Biol. 5, 599–609 (2003).
-
Vasquez, R. J., Howell, B., Yvon, A. M. C., Wadsworth, P. & Cassimeris, L. Nanomolar concentrations of nocodazole alter microtubule dynamic instability in vivo and in vitro. Mol. Biol. Cell 8, 973–985 (1997).
-
Belotti, D. et al. The drug paclitaxel has antiangiogenic. Clin. Cancer Res. 2, 1843–1849 (1996).
-
Tomasini, L., Ferrere, M. & Nicolas, J. Subcutaneous drug delivery from nanoscale systems. Nat. Rev. Bioeng. 2, 501–520 (2024).
-
Erthal, L. C., Shi, Y., Sweeney, K. J., Gobbo, O. L. & Ruiz-Hernandez, E. Nanocomposite formulation for a sustained release of free drug and drug-loaded responsive nanoparticles: an approach for a local therapy of glioblastoma multiforme. Sci. Rep. 13, 5094 (2023).
-
Arruebo, M., Valladares, M. & González-Fernández, Á. Antibody-conjugated nanoparticles for biomedical applications. J. Nanomater. 2009, 439389 (2009).
-
Zheng, Y., Zhong, X., Li, Z. & Xia, Y. Successive, seed-mediated growth for the synthesis of single-crystal gold nanospheres with uniform diameters controlled in the range of 5-150 nm. Part. Part. Syst. Charact. 31, 266–273 (2014).
-
Schneider, C. A., Rasband, W. S. & Eliceiri, K. W. NIH Image to ImageJ: 25 years of image analysis. Nat. Methods 9, 671–675 (2012).
-
Schindelin, J. et al. Fiji: An open-source platform for biological-image analysis. Nat. Methods 9, 676–682 (2012).
-
Stein, S. C. & Thiart, J. TrackNTrace: A simple and extendable open-source framework for developing single-molecule localization and tracking algorithms. Sci. Rep. 6, 73947 (2016).
Acknowledgements
This work is supported by the National Research Foundation of Korea (NRF) grants funded by the Korean Government (Ministry of Science and ICT, RS-2024-00355795, 2020M3A9D8038014, and Ministry of Trade, Industry and Energy RS-2024-00438956), Internal Research Program of Electronics and Telecommunications Research Institute (22YR1420, 24RR1410), and the POSTECH Basic Science Research Institute grant of NRF (RS-2021-NR060139).
Ethics declarations
Competing interests
The authors declare no competing interests.
Additional information
Publisher’s note Springer Nature remains neutral with regard to jurisdictional claims in published maps and institutional affiliations.
Supplementary information
Rights and permissions
Open Access This article is licensed under a Creative Commons Attribution-NonCommercial-NoDerivatives 4.0 International License, which permits any non-commercial use, sharing, distribution and reproduction in any medium or format, as long as you give appropriate credit to the original author(s) and the source, provide a link to the Creative Commons licence, and indicate if you modified the licensed material. You do not have permission under this licence to share adapted material derived from this article or parts of it. The images or other third party material in this article are included in the article’s Creative Commons licence, unless indicated otherwise in a credit line to the material. If material is not included in the article’s Creative Commons licence and your intended use is not permitted by statutory regulation or exceeds the permitted use, you will need to obtain permission directly from the copyright holder. To view a copy of this licence, visit http://creativecommons.org/licenses/by-nc-nd/4.0/.
About this article

Cite this article
Cho, J., Ahn, Y., Park, M. et al. Targeted amplification of alternating electric fields using ferroelectric nanoparticles. npj Biomed. Innov. 2, 45 (2025). https://doi.org/10.1038/s44385-025-00056-4
-
Received:
-
Accepted:
-
Published:
-
Version of record:
-
DOI: https://doi.org/10.1038/s44385-025-00056-4