Introduction
Edible fungi exhibit asexual reproduction characteristics, and thus, tissue separation methods are commonly employed for cultivation and systematic breeding in the field of edible fungi. However, this approach leads to low genetic diversity, close genetic relationships, and severe homogenization among the strains. Moreover, it poses significant challenges to the effective protection of intellectual property rights for breeders. For instance, during the circulation of enoki mushroom (Flammulina velutipes) varieties, the phenomenon of chaotic variety naming frequently occurs1. This issue is prevalent in many countries, presenting substantial challenges for the protection of commercial cultivation varieties2. Naematelia aurantialba, as an edible fungus, also faces similar problems. Given the limitations of traditional variety identification methods, such as insufficient accuracy and high labor intensity3, there is an urgent need to adopt new methods for identification to safeguard the intellectual property rights of N. aurantialba varieties.
DNA molecular markers, characterized by their polymorphism, high accuracy, high precision, and insensitivity to environmental factors, have become essential tools for breeders to conduct genetic diversity analysis, variety improvement, and variety identification4. Commonly used molecular markers currently include Restriction Fragment Length Polymorphism (RFLP)5, Random Amplified Polymorphic DNA (RAPD)6, Sequence Characterized Amplified Region (SCAR)7, Simple Sequence Repeat (SSR)8, Insertion/Deletion (INDEL)9, Single Nucleotide Polymorphism (SNP)10, and Multinucleotide Polymorphism (MNP)11. These markers have been widely applied in plant variety identification and used to construct fingerprint profiles. For example, their applications in tobacco (Nicotiana tabacum L.)12, honeysuckle (Lonicera japonica Thunb.)13, and passion fruit (Passiflora spp.)14 have provided significant reference value for the identification of these germplasm resources.
In the field of edible fungi, different molecular markers have begun to be used for strain identification studies. For instance, RFLP and SCAR markers have been employed for amplification and identification of F. filiformis strains15,16. However, these markers suffer from limitations such as weak polymorphism and poor stability, which restrict their application scope17. With the rapid development of next-generation high-throughput sequencing technologies, SNP markers, characterized by their abundance, high polymorphism, and ease of detection, have gradually gained widespread application and are considered the most promising DNA molecular markers18,19. Building on this, MNP markers, which distinguish individuals by combining multiple SNPs and analyzing the alleles of each SNP, have been applied in edible fungi20. Additionally, INDEL markers, which can be identified alongside SNP markers, are expected to complement SNP markers for individual identification due to their insertion/deletion characteristics. Currently, the application of these next-generation molecular markers in N. aurantialba is still limited, but their use may provide new insights for the identification of N. aurantialba germplasm resources and the protection of intellectual property rights.
In this study, we conducted whole-genome resequencing of 36 N. aurantialba strains to identify their genetic diversity and core variant sites (MNP, SNP, and INDEL). Based on the gene sequence data, a total of 108 core MNPs (comprising 333 SNPs), 54 core SNPs, and 40 core INDEL sites were identified. By calculating the genetic similarity among strains and constructing fingerprint profiles based on these core variant sites, the similarities and differences among individual strains were clearly demonstrated. Moreover, although this study focused solely on N. aurantialba, the approach of combining core MNPs, core SNPs, and core INDELs can be extended to other species, forming a pattern of mutual supplementation and validation of different variant characteristics.
Materials and methods
Strain information and sources
This study utilized 36 germplasm resources of N. aurantialba as experimental materials, including 18 heterokaryon strains and 18 monokaryotic strains. Of these, 31 strains were provided by Yunnan Junshijie Biotechnology Co., Ltd., while the remaining five heterokaryon strains were collected from the market, primarily from Yunnan Province, China. The materials originated from Yunlong County in Dali Bai Autonomous Prefecture, Yiliang County in Kunming City, Yongren County in Chuxiong Yi Autonomous Prefecture, Ninglang Yi Autonomous County in Lijiang City, and Xundian Hui and Yi Autonomous County in Kunming City (Supplementary Table 1).
Genotype data analysis
Spore-like samples were collected from the strains for sequencing. The resequencing of the strains was completed by BGI Genomics Co., Ltd., Shenzhen. Data filtering was performed using SOAPnuke21 to obtain valid data, followed by quality control using Trimmomatic 0.3922. The cleaned data were aligned to the reference genome Ns_27 (NCBI project number: PRJNA1264744) (https://www.ncbi.nlm.nih.gov/sra/SRX28863877[accn]) using BWA 0.7.1723 generating SAM files. The reference genome and annotation information used can also be found in Supplementary File 1–4. SAMtools 1.2224 was then used to convert the SAM files to BAM files, which were sorted and duplicates removed. Each strain was analyzed separately to ensure the accuracy of individual variants. GATK 4.525 was used to merge the BAM files of each strain and perform variant detection to obtain SNP and INDEL data. All analyses were conducted using default parameters. VCFtools 0.1.1726 was further employed to filter the SNP data based on criteria of missing rate exceeding 20% and minor allele frequency below 0.05; INDEL data were not filtered using these criteria. Ultimately, 131,632 SNPs and 21,724 INDELs distributed across 12 chromosomes were obtained for subsequent analysis.
Population structure analysis
PLINK 1.927 was used to convert the SNP genotype data into binary format. ADMIXTURE 1.328 was subsequently employed for population structure analysis to infer the optimal K value. The parameter settings included five-fold cross-validation; a random seed of 43; estimation of individual ancestry proportions using the relaxation algorithm; acceleration of convergence using the Quasi-Newton method; termination of point estimation when the change in the objective function was less than 0.0001; and computation of point estimates only without standard error estimates. Subsequently, the inferred population structure was sorted and effectively visualized using the pophelper R package29. Additionally, TASSEL 5.030 was used to conduct phylogenetic tree and principal component analysis (PCA) on the genotype data. The phylogenetic tree was constructed using the neighbor-joining (NJ) method, while PCA was based on the covariance matrix.
Core (MNP, SNP, INDEL) screening, fingerprint profile construction, and genetic similarity
A sliding window length of 100 bp was set to detect the windows containing 2 to 10 SNPs. The windows with polymorphism information content (PIC) less than 0.4 and overlapping regions were removed. Ultimately, highly polymorphic MNP markers were selected based on the criterion of at least 50 kb spacing between adjacent windows. Similarly, highly polymorphic SNPs were screened using the criteria of PIC less than 0.4 and at least 50 kb spacing between adjacent windows. Due to the insertion/deletion characteristics of INDELs, they were not filtered based on PIC or window spacing. For detailed screening codes, please refer to Supplementary File 5. SnpEff 5.231 was used to annotate the screened MNPs, SNPs, and INDELs. Sites located in the coding region and identified as missense variants were defined as core MNPs and core SNPs, while INDEL sites in the coding region were defined as core INDELs. The selected core sites were then combined to construct fingerprint profiles.
All core sites of different types from each strain were extracted, and pairwise comparisons were performed between each test strain and the other strains to calculate genetic similarity using the following formula:
$$GS=frac{n}{N} times 100{{% }}$$
where GS represents genetic similarity, n is the number of identical core genotype sites, and N is the total number of core genotype sites.
Results
Types and distribution of variant sites
A total of 131,632 SNPs and 21,724 INDELs distributed across 12 chromosomes were identified through variant detection and screening (Table 1). Chromosome 1 had the highest number of SNPs and INDELs, with 20,796 SNPs and 3,249 INDELs, respectively. In contrast, Chromosome 9 had the lowest coverage, with only 107 SNPs and 100 INDELs. This indicates that Chromosome 1 has a higher mutation frequency, whereas Chromosome 9 has a lower mutation frequency.
Population structure and genetic differentiation analysis of N. aurantialba based on SNP markers
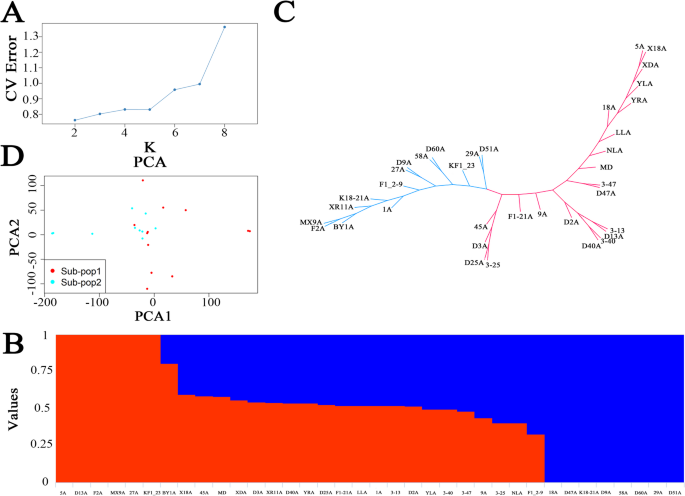
The results of the population structure are shown in Figs. 1 A and B. When K = 2, the cross-validation error was the lowest, theoretically representing the optimal K value. Therefore, this study selected K = 2 as the optimal value. The phylogenetic tree divided the strains into two clusters: Cluster 1 comprised 22 strains, and Cluster 2 comprised 14 strains (Fig. 1 C). PCA also supported this clustering result, with significant genetic differences observed between Cluster 1 and Cluster 2 (Fig. 1 D).

Genetic diversity analysis of 36 strains based on SNPs. (A) Relationship between cross-validation error and K value. (B) Population structure of 36 strains when K = 2. (C) The phylogenetic tree of 36 strains is based on SNPs. (D) Principal component analysis of 36 strains.
Number of core variant sites and phylogenetic tree analysis
The number of highly polymorphic variant sites and core variant sites identified on different chromosomes is shown in Table 2. A total of 343 highly polymorphic MNP sites, covering 1,120 SNPs with an average of 3.27 SNPs per MNP, were detected across the 12 chromosomes. Chromosome 1 had the highest number of highly polymorphic MNPs, with 50, while Chromosomes 7 and 9 had the lowest, each with 8. Based on these highly polymorphic MNPs, 108 core MNPs, comprising 333 SNPs with an average of 3.08 SNPs per core MNP, were further screened out, excluding Chromosome 7. Chromosome 2 had the highest number of core MNPs, with 18, while Chromosomes 9 and 12 had the lowest, each with 2.
Additionally, 343 highly polymorphic SNPs were detected across the 12 chromosomes, with Chromosome 1 having the highest number of highly polymorphic SNPs, at 51, and Chromosome 9 having the lowest, with only 5. Based on these highly polymorphic SNPs, 54 core SNPs were further screened out, excluding Chromosome 7. Chromosome 1 had the highest number of core SNPs, with 12, while Chromosome 9 had the lowest, with only 1.
Due to the unique nature of INDELs, no high polymorphism screening was performed on them. Instead, the 21,724 INDELs were directly annotated to obtain core INDELs. A total of 40 core INDELs were further screened out across 10 chromosomes, excluding Chromosomes 3 and 9. Chromosome 1 had the highest number of core INDELs, with 10, while Chromosomes 4, 6, 8, and 11 had the lowest, each with 2. These screened core variant sites will be used for subsequent analyses.
The phylogenetic trees constructed using different genetic markers show that the evolutionary trees based on core MNPs (Fig. 2 B), core INDELs (Fig. 2 C), and core SNPs (Fig. 2 D) are generally consistent with the evolutionary tree based on the 131,632 SNPs (Fig. 2 A). Although some differences exist between core INDELs and other variant sites, possibly due to the characteristics of insertions and deletions, overall, the screened core variant sites are representative and can reflect the characteristics of the strains.

Phylogenetic tree of 36 strains. (A) Phylogenetic tree of 36 strains based on SNPs. (B) Phylogenetic tree of 36 strains based on core MNPs. (C) Phylogenetic tree of 36 strains based on core SNPs. (D) Phylogenetic tree of 36 strains based on core INDELs.
Fingerprint profile construction and genetic similarity
Combining different core genetic markers to construct their respective fingerprint profiles can intuitively show the relationships among the materials. The fingerprint profiles of core MNPs (Fig. 3 A), core SNPs (Fig. 3 B), and core INDELs (Fig. 3 C) all show a highly consistent trend. In particular, strains 18 A, 5 A, LLA, NLA, X18A, XDA, YLA, and YRA showed almost identical results in all three types of core genetic markers, and these eight strains correspond exactly to Cluster 1 in the clustering results. Additionally, strains 1 A, BY1A, F2A, K18-21 A, MX9A, and XR11A also showed similar results and correspond exactly to Cluster 2 in the clustering results. Notably, these strains are all heterokaryon and likely asexually propagated strains, and their positions are very close in the PCA results (Fig. 1 D). Detailed information on the fingerprint profiles of different core genetic markers is provided in Supplementary Table 2.

DNA fingerprinting of 36 strains. (A) Based on a combination of 108 core MNPs (totaling 333 SNPs). (B) Based on a combination of 54 core SNPs. (C) Based on a combination of 40 core INDELs. Homozygous genotypes C/C, A/A, T/T, and G/G are represented by blue, red, yellow, and purple, respectively; heterozygous genotypes are represented by gray; missing genotypes are represented by green; and unknown genotypes are represented by white.
The results of genetic similarity are shown in Fig. 4. Using 108 core MNPs, the genetic similarity among the 36 strains ranged from 1.05% to 100% (Fig. 4 A). The heterokaryon strains 18 A, 5 A, LLA, NLA, X18A, XDA, YLA, and YRA in Cluster 1 had genetic similarities between 99.10% and 100%, while the heterokaryon strains 1 A, BY1A, F2A, K18-21 A, MX9A, and XR11A in Cluster 2 had genetic similarities between 97.60% and 99.10%, indicating that these strains are likely the same strain. The genetic similarities of monokaryotic strains were mostly between 33.94% and 69.82%, but the genetic similarities between 3-13 and D13, 3–25 and D25, 3–40 and D40, and 3–47 and D47 were as high as 99.70%, 99.85%, 99.70%, and 99.40%, respectively, indicating that these monokaryotic strains are also likely the same strain. The genetic similarities based on core SNPs (Fig. 4 B) and core INDELs (Fig. 4 C) also showed similar results. For strains with high genetic similarity identified by core MNPs, the same high similarity was also identified by core SNPs and core INDELs, achieving complementary validation results.

Genetic similarity of 36 strains. (A) Genetic similarity based on 108 core MNPs. (B) Genetic similarity based on 54 core SNPs. (C) Genetic similarity based on 40 core INDELs.
Discussion
Relationships among 36 N. aurantialba strains based on SNP analysis
SNPs are commonly used markers in plant genetics research, reflecting genetic diversity among species and genetic drift during breeding processes32,33. In this study, the relationships among 36 strains of N. aurantialba were analyzed based on SNPs, revealing that when K = 2, the genetic relationships among individuals were finely delineated, a result that was also corroborated by the phylogenetic tree and PCA. The analysis of population structure among strains can elucidate the genetic diversity within populations and facilitate a deeper understanding of genetic differences among individuals, thereby optimizing breeding programs. Introducing genetic variation into progeny can be achieved by crossbreeding individuals with distinct genetic backgrounds. However, the current study is limited in its selection of strain materials, relying solely on domesticated cultivars without incorporating wild strains. Moving forward, we will collect a broader range of wild germplasm resources, covering diverse geographical regions, ecological environments, and ecological types. This effort will provide a more comprehensive scientific basis for the systematic classification of strains, research on ecological adaptability, and the conservation and sustainable use of genetic resources. Additionally, we plan to conduct genome-wide association studies to identify functional genes related to phenotypes and support gene-engineering-assisted breeding. We will also pursue pan-genomic research to refine genomic information and elucidate evolutionary processes such as domestication, selection, and gene loss among populations. Moreover, we will employ artificial intelligence technologies to construct data-driven strategies from the perspectives of genetic data integration, intelligent algorithm application, and phenotyping, thereby providing a more in-depth understanding of the relationships among strains.
Benchmark consideration of core sites
With the completion of N. aurantialba genome sequencing, the number of available gene sequences has increased rapidly34. SNPs in coding regions can affect gene expression and function through various regulatory mechanisms, thereby influencing individual phenotypes. Meanwhile, marker genes and core gene sets are currently widely used35,36. However, the core sites selected often lack a comparative benchmark. The whole-genome SNP tree can serve as a benchmark reflecting the accuracy of population strain-level differentiation37. In this study, the core sites selected were used to construct a phylogenetic tree, which was compared with the phylogenetic tree constructed using whole-genome SNPs. The results showed that the phylogenetic trees formed by core MNPs and core SNPs were similar to those formed by whole-genome SNPs, indicating that with whole-genome SNPs as a benchmark, both core MNPs and core SNPs can effectively reflect strain characteristics. In contrast, the phylogenetic tree constructed using core INDELs showed some differences compared with that constructed using whole-genome SNPs. This may be due to the characteristics of insertions and deletions, which prevent them from fully reflecting strain characteristics. However, overall, core INDELs still show a certain degree of similarity with whole-genome SNPs, so INDELs can be considered as supplementary features. Additionally, due to the limited number of variation sites obtained for SNPs and INDELs after quality control filtering on chromosomes 7 and 9, with 209 and 107 SNPs, and 134 and 100 INDELs respectively, the subsequent identification of high-quality core MNPs, core SNPs, and core INDELs became scarce, and core loci were not obtained on these chromosomes. This may be due to extensive gaps in the reference genome across these chromosomes. It is necessary to collect more diverse strains with rich genetic backgrounds for pan-genome analysis to establish a more comprehensive, complete, and representative gene pool. Moreover, when screening core INDELs, only 40 out of over ten thousand INDEL sites were identified as core INDELs within coding regions, indicating a very low coverage rate of INDEL sites located in coding regions, leading to the absence of core INDELs on chromosomes 3 and 9. Despite this, the identified core MNPs, core SNPs, and core INDELs, although not fully covering all chromosomes—for instance, no core MNPs and core SNPs on chromosome 7, and no core INDELs on chromosomes 3 and 9—interestingly cover all chromosomes when combined, achieving a complementary effect.
Genetic similarity among strains
Liu et al. studied 106 cultivated varieties of Agaricus bisporus and divided them into 12 pedigrees, calculating the genetic similarity of strains in each pedigree. The results showed that the genetic similarity varied, with the highest average genetic similarity in Pedigree G4, reaching 98.1%38. Liu et al. also analyzed 232 strains of Flammulina filiformis and divided them into 22 pedigrees. The average genetic similarity in Pedigrees 1, 2, and 19 was the highest, exceeding 91%, and the highest genetic similarity between individual strains reached 98.6%20. Ling et al. calculated the genetic similarity of Lentinula edodes strains and found that the genetic similarity between different pedigree varieties was greater than 94.54%, with some varieties even reaching 100%3. In this study, the genetic similarity results of some pedigree strains showed a similar trend to the above studies. For example, for strains (18 A, 5 A, LLA, NLA, X18A, XDA, YLA and YRA) in Cluster 1, the average genetic similarity calculated by core MNPs, SNPs, and INDELs reached 99.59%, 98.84%, and 98.89%, respectively; for strains (1 A, BY1A, F2A, K18-21 A, MX9A and XR11A) in Cluster 2, the average genetic similarity calculated by core MNPs, SNPs, and INDELs reached 98.80%, 98.92%, and 99.59%, respectively. Each site contains two alleles, and the combination of these sites can reach trillions of combinations. It is unimaginable to identify strains with a genetic similarity of over 97%, and even up to 100%, among so many combinations. Moreover, the genetic similarity identified by core MNPs, core SNPs, and core INDELs in these strains was all above 97%, and it might be considered that these strains were all products of tissue separation and could be regarded as the same strain. Moreover, strains can be identified by three different types of variant sites. Therefore, when identifying varieties, perhaps the profiles constructed by the three methods can be attached together. This is similar to human fingerprints, irises, and facial recognition; although they have different characteristics, they can all be used for identification. In addition, the development of single-strain-specific markers associated with phenotypic traits could be pursued. Functional markers linked to the characteristics of N. aurantialba have already been identified39. The integration of these markers into our approach would provide comprehensive and multifaceted protection of intellectual property rights. Furthermore, within both heterokaryon and monokaryotic strains, heterokaryon strains demonstrate greater genetic similarity compared to monokaryotic strains. This may primarily be due to heterokaryon strains being obtained through asexual reproduction, which circumvents meiosis and thus maintains the integrity of the reproductive system. In contrast, monokaryotic strains originate from the spore production of heterokaryon strains, having undergone meiosis, and consequently acquiring increased genetic variation through recombination and genetic material exchange. This likely also accounts for the observation that genetic similarity among heterokaryon strains is mostly above 97%, whereas that of monokaryotic strains is typically around 50%.
This method has a good identification effect on both heterokaryon and monokaryotic strains. For example, in monokaryotic strains 3–13 and D13, 3–25 and D25, 3–40 and D40, and 3–47 and D47, the genetic similarity was all above 99%, and they can be considered as the same strain. The resequencing data of these strains came from different batches and sequencing depths, but high similarity could still be identified. This indicates that samples are not limited by time and space, and as long as they are asexually propagated, they can be identified. At present, most studies still use PCR amplification to identify strains, which is still applicable, but resequencing genotype data can also be used for identification. Thanks to the small genome size of edible fungi, it is more conducive to resequencing. In addition, the rapid development of sequencing technology has led to lower prices and higher sequencing efficiency, allowing the resequencing data of strains to be obtained at a lower cost and in a shorter time. By integrating these data, the differences among strains can be clearly seen, and genetic similarity can be calculated. If a big data analysis platform could be constructed and all declared strains were included in it, it would be more meaningful. In summary, this study constructed multiple types of fingerprint profiles for 36 N. aurantialba strains, which can clearly show the differences among strains and identify genetic similarity, effectively judge the acquisition methods of strains, and provide valuable information for tracing and sourcing. In addition, the idea of constructing multiple fingerprint profiles can also be extended to other edible fungi, considering from multiple types, methods, and angles to protect intellectual property rights.
Data availability
The datasets generated and/or analyzed during the current study are available in the NCBI database with accession numbers PRJNA1266402 and PRJNA1358302.
References
-
Wang, P. M. et al. Phylogeny and species delimitation of flammulina: taxonomic status of winter mushroom in East Asia and a new European species identified using an integrated approach. Mycological Progress. 17, 1013–1030. https://doi.org/10.1007/s11557-018-1409-2 (2018).
-
Sonnenberg, A. S. M., Baars, J. J. P., Gao, W. & Visser, R. G. F. Developments in breeding of agaricus bisporus var. Bisporus: progress made and technical and legal hurdles to take. Appl. Microbiol. Biotechnol. 101, 1819–1829. https://doi.org/10.1007/s00253-017-8102-2 (2017).
-
Ling, Y. et al. Evolutionary relationship and a novel method of efficient identification of lentinula Edodes cultivars in China. Mycosphere 13, 56–85. https://doi.org/10.5943/mycosphere/si/1f/3 (2023).
-
Alcaraz, M. L. & Hormaza, J. I. Molecular characterization and genetic diversity in an avocado collection of cultivars and local Spanish genotypes using SSRs. Hereditas 144, 244–253. https://doi.org/10.1111/j.2007.0018-0661.02019x (2007).
-
Nei, M. & Li, W. H. Mathematical model for studying genetic variation in terms of restriction endonucleases. Proceedings of the National Academy of Sciences. ;76:5269–5273. (1979). https://doi.org/10.1073/pnas.76.10.5269
-
Williams, J. G. K., Kubelik, A. R., Livak, K. J. & Rafalski JAntoni, Tingey, S. V. DNA polymorphisms amplified by arbitrary primers are useful as genetic markers. Nucleic Acids Res. 18, 6531–6535. https://doi.org/10.1093/nar/18.22.6531 (1990).
-
Liu, J. Y., Ying, Z. H., Liu, F., Liu, X. R. & Xie, B. G. Evaluation of the use of SCAR markers for screening genetic diversity of lentinula Edodes strains. Curr. Microbiol. 64, 317–325. https://doi.org/10.1007/s00284-011-0069-0 (2012).
-
Lee, H. Y., Moon, S., Ro, H. S., Chung, J. W. & Ryu, H. Analysis of genetic diversity and population structure of wild strains and cultivars using genomic SSR markers in lentinula Edodes. Mycobiology 48, 115–121. https://doi.org/10.1080/12298093.2020.1727401 (2020).
-
Avellaneda, L. L. et al. Development of a novel five dye insertion/deletion (INDEL) panel for ancestry determination. Int. J. Legal Med. 138, 1233–1244. https://doi.org/10.1007/s00414-024-03196-1 (2024).
-
Choudhury, D. R. et al. SSR and SNP marker-based investigation of Indian rice landraces in eelation to their genetic diversity, population structure, and geographical isolation. Agriculture 13, 823. https://doi.org/10.3390/agriculture13040823 (2023).
-
Fang, Z. et al. Multiple nucleotide polymorphism DNA markers for the accurate evaluation of genetic variations. BioRxiv https://doi.org/10.1101/2021.03.09.434561 (2021).
-
Wang, Y. et al. Construction of a SNP fingerprinting database and population genetic analysis of cigar tobacco germplasm resources in China. Front. Plant Sci. 12, 618133. https://doi.org/10.3389/fpls.2021.618133 (2021).
-
Li, J. et al. Construction of SNP fingerprint and population genetic analysis of honeysuckle germplasm resources in China. Front. Plant Sci. 14, 1080691. https://doi.org/10.3389/fpls.2023.1080691 (2023).
-
Wu, F. et al. Genetic diversity analysis and fingerprint construction for 87 Passionfruit (Passiflora spp.) germplasm accessions on the basis of SSR fluorescence markers. Int. J. Mol. Sci. 25, 10815–10815. https://doi.org/10.3390/ijms251910815 (2024).
-
Palapala, V. A., Aimi, T., Inatomi, S. & Morinaga, T. ITS-PCR‐RFLP method for distinguishing commercial cultivars of edible mushroom, flammulina velutipes. J. Food Sci. 67, 2486–2490. https://doi.org/10.1111/j.1365-2621.2002.tb08763.x (2002).
-
Su, H., Wang, L., Liu, L., Chi, X. & Zhang, Y. Use of inter-simple sequence repeat markers to develop strain-specific SCAR markers forflammulina velutipes. J. Appl. Genet. 49, 233–235. https://doi.org/10.1007/bf03195619 (2008).
-
Xu, J. Fundamentals of fungal molecular population genetic analyses. Curr. Issues. Mol. Biol. 8, 75–89. https://doi.org/10.21775/cimb.008.075 (2006).
-
Azizi, M. M. F., Lau, H. Y. & Abu-Bakar, N. Integration of advanced technologies for plant variety and cultivar identification. J. Biosci. 46, 91. https://doi.org/10.1007/s12038-021-00214-x (2021).
-
Li, P., Guo, M., Wang, C., Liu, X. & Zou, Q. An overview of SNP interactions in genome-wide association studies. Brief. Funct. Genomics. 14, 143–155. https://doi.org/10.1093/bfgp/elu036 (2014).
-
Liu, F. et al. Development of multiple nucleotide polymorphism molecular markers for Enoki mushroom (Flammulina filiformis) cultivars identification. J. Fungi. 9, 330. https://doi.org/10.3390/jof9030330 (2023).
-
Chen, Y. et al. SOAPnuke: a mapreduce acceleration-supported software for integrated quality control and preprocessing of high-throughput sequencing data. GigaScience 7, 1–6. https://doi.org/10.1093/gigascience/gix120 (2017).
-
Bolger, A. M., Lohse, M. & Usadel, B. Trimmomatic: a flexible trimmer for illumina sequence data. Bioinformatics 30, 2114–2120. https://doi.org/10.1093/bioinformatics/btu170 (2014).
-
Li, H. & Durbin, R. Fast and accurate long-read alignment with Burrows–Wheeler transform. Bioinformatics 26, 589–595. https://doi.org/10.1093/bioinformatics/btp698 (2010).
-
Danecek, P. et al. Twelve years of samtools and BCFtools. GigaScience 10, giab008. https://doi.org/10.1093/gigascience/giab008 (2021).
-
McKenna, A. et al. The genome analysis toolkit: a mapreduce framework for analyzing next-generation DNA sequencing data. Genome Res. 20, 1297–1303. https://doi.org/10.1101/gr.107524.110 (2010).
-
Danecek, P. et al. The variant call format and vcftools. Bioinformatics 27, 2156–2158. https://doi.org/10.1093/bioinformatics/btr330 (2011).
-
Chang, C. C. et al. Second-generation PLINK: rising to the challenge of larger and richer datasets. GigaScience 4, 7. https://doi.org/10.1186/s13742-015-0047-8 (2015).
-
Alexander, D. H., Novembre, J. & Lange, K. Fast model-based Estimation of ancestry in unrelated individuals. Genome Res. 19, 1655–1664. https://doi.org/10.1101/gr.094052.109 (2009).
-
Francis, R. M. Pophelper: an R package and web app to analyse and visualize population structure. Mol. Ecol. Resour. 17, 27–32. https://doi.org/10.1111/1755-0998.12509 (2017).
-
Bradbury, P. J. et al. TASSEL: software for association mapping of complex traits in diverse samples. Bioinformatics 23, 2633–2635. https://doi.org/10.1093/bioinformatics/btm308 (2007).
-
Cingolani, P. et al. A program for annotating and predicting the effects of single nucleotide polymorphisms, snpeff: SNPs in the genome of drosophila melanogaster strain w1118; iso-2; iso-3. Fly 6, 80–92. https://doi.org/10.4161/fly.19695 (2012).
-
Shavrukov, Y. Comparison of SNP and CAPS markers application in genetic research in wheat and barley. BMC Plant Biol. 16, 11. https://doi.org/10.1186/s12870-015-0689-9 (2016).
-
Thomson, M. J. High-throughput SNP genotyping to accelerate crop improvement. Plant. Breed. Biotechnol. 2, 195–212. https://doi.org/10.9787/pbb.2014.2.3.195 (2014).
-
Sun, T. et al. Whole genome sequencing and annotation of naematelia aurantialba (basidiomycota, edible-medicinal fungi). J. Fungi. 8, 6. https://doi.org/10.3390/jof8010006 (2021).
-
Abarenkov, K. et al. The UNITE database for molecular identification of fungi – recent updates and future perspectives. New Phytol. 186, 281–285. https://doi.org/10.1111/j.1469-8137.2009.03160.x (2010).
-
Dupuis, J. R., Roe, A. D. & Sperling, F. A. Multi-locus species delimitation in closely related animals and fungi: one marker is not enough. Mol. Ecol. 21, 4422–4436. https://doi.org/10.1111/j.1365-294x.2012.05642.x (2012).
-
Simar, S. R., Hanson, B. M. & Arias, C. A. Techniques in bacterial strain typing. Curr. Opin. Infect. Dis. 34, 339–345. https://doi.org/10.1097/qco.0000000000000743 (2021).
-
Liu, F. et al. A new method for constructing high-resolution phylogenomic topologies using core gene‐associated MNP markers: a case study from agaricus bisporus. Microb. Biotechnol. 18, e70070. https://doi.org/10.1111/1751-7915.70070 (2025).
-
Zeng, Y. et al. Aeronautical mutagenesis and whole-genome resequencing reveal the genetic basis of color change in naematelia aurantialba. Mycobiology 53, 539–549. https://doi.org/10.1080/12298093.2025.2526939 (2025).
Funding
This research was funded by the Yunnan Province (Rare Edible Fungi) Enterprise Technology Center Special Fund Project (grant number: JSJ2023016KJ).
Ethics declarations
Competing interests
The authors declare no competing interests.
Additional information
Publisher’s note
Springer Nature remains neutral with regard to jurisdictional claims in published maps and institutional affiliations.
Supplementary Information
Rights and permissions
Open Access This article is licensed under a Creative Commons Attribution-NonCommercial-NoDerivatives 4.0 International License, which permits any non-commercial use, sharing, distribution and reproduction in any medium or format, as long as you give appropriate credit to the original author(s) and the source, provide a link to the Creative Commons licence, and indicate if you modified the licensed material. You do not have permission under this licence to share adapted material derived from this article or parts of it. The images or other third party material in this article are included in the article’s Creative Commons licence, unless indicated otherwise in a credit line to the material. If material is not included in the article’s Creative Commons licence and your intended use is not permitted by statutory regulation or exceeds the permitted use, you will need to obtain permission directly from the copyright holder. To view a copy of this licence, visit http://creativecommons.org/licenses/by-nc-nd/4.0/.
About this article

Cite this article
Zeng, Y., Shen, Z., Cao, Y. et al. Genetic diversity analysis and multi-fingerprint map construction of Naematelia aurantialba germplasm resources. Sci Rep 15, 44308 (2025). https://doi.org/10.1038/s41598-025-28343-5
-
Received:
-
Accepted:
-
Published:
-
Version of record:
-
DOI: https://doi.org/10.1038/s41598-025-28343-5