Introduction
Lamellar gel networks (LGNs) are multiphase colloidal structures with a lamellar gel phase (Lβ), a bulk aqueous phase, hydrated solid crystals of amphiphiles, and an oil phase stabilized by a monolayer of surfactants and fatty alcohols (FAs)1. LGNs are commonly used in pharmaceutical and cosmetic products, notably in hair conditioners, due to their unique rheological behaviors and superior stability2,3. The rheological response of LGNs is primarily attributed to the Lβ phase bilayers, while their superior stability compared to other colloidal systems or emulsions is also due to the interconnected Lβ phase that prevents phase separation to occur4,5. The Lβ phase comprises regularly spaced bilayers of surfactants and long-chain (cetyl or C16, and stearyl or C18) FAs with inter-lamellar water layers5,6. The presence of surfactants supposedly prevents the crystallization of cetostearyl (C16/C18) alcohol mixture as the repulsion between the large surfactant headgroups allows them to freely rotate and hence induces rotation of neighboring cetostearyl alcohol molecules5. Commonly used surfactants are behentrimonium methosulfate (BTMS), behentrimonium chloride (BTAC), cetyltrimethylammonium chloride (CTAC), and sodium dodecyl sulfate5.
LGNs can withstand elastic deformation2, yet exhibit shear-thinning behavior above the yield stress7. Their rheological properties are highly dependent on the surfactant type, FA concentration, and the ratio of FA to surfactant8, as well as the preparation (cooling) process9. It has been shown that higher FA content increases the storage modulus (ability to store energy elastically), yield stress (amount of stress a material can withstand before permanent plastic deformation occurs), and zero-shear-rate viscosity (limiting value of viscosity describing resistance to flow at rest or under very low shear conditions) in both CTAC/FA and BTAC/FA emulsions8. The effect of counterion on the LGN property has been studied using BTMS and BTAC with the same surfactant, but methosulfate or chloride as the counterion, where the BTAC gel network was found to swell with water, but the BTMS gel network did not10. The positively charged headgroups of the surfactant in BTMS or BTAC create a repulsive force between lamellar bilayers, but the counterions in BTMS are more tightly bound to the headgroups, thus more effectively neutralizing the surface charges, leading to lower repulsion and hence much lesser swelling. The BTMS lamellar sheets are also stiffer and more difficult to break due to the lower headgroup repulsion10.
In the process of creating a product involving LGNs, it is often necessary to optimize the ratio of surfactant to FAs in the formulation to obtain the desired texture of the gel network4,11,12. Hence, it is of interest to the industry how the physical and rheological properties of the gel network are affected by the weight percentage (wt%) of surfactants in the formulation. Atomistic molecular dynamics (MD) simulations have been employed to study surfactant-FA bilayers at the molecular level. Atomistic MD simulations of cetyl alcohol or 1:1 cetostearyl alcohol have been carried out in both the absence and presence of surfactant CTAC (C16 chain), whereby the phase transition from gel to fluid phase as a function of temperature was studied12. Cetyl alcohol-only and cetostearyl alcohol bilayers are in the gel phase (high average order parameter value) below 298 K and 308 K, respectively, and in the fluid phase above these temperatures. The higher melting temperature for cetostearyl alcohol bilayer might be due to the longer stearyl alcohol that makes up 50% of the chains. In the presence of 20 mol% CTAC, a lamellar fluid phase appears above 323 K with a lower average order parameter12. Interestingly, the melting temperature of the bilayer with CTAC is higher than that of the FA bilayers, suggesting that the presence of a low molar ratio of CTAC might confer increased stability and stiffness to the resultant gel phase bilayer. However, as it is well accepted that the role of surfactants is to prevent crystallization of FA bilayers, it seems inconsistent that adding surfactants could actually make the gel phase bilayers stiffer. This warrants further study to clarify the effect of increasing surfactant content in lamellar gel phase bilayers.
In this study, we investigate how varying compositions of FAs (mixture of cetyl and stearyl alcohols) and surfactants (with a focus on BTMS) modulate the physical properties of gel phase bilayers in LGNs using atomistic MD simulations. We found that increasing the BTMS wt% leads to thicker bilayers, an increased area per lipid, and a decreased lipid order parameter in an almost monotonic manner. In contrast, both the stretching modulus and shear viscosity exhibit non-monotonic dependence on BTMS content, reaching a maximum at approximately 20 wt% and 40 wt%, respectively. This behavior arises from the competing effects of bilayer thickness and lipid order: while increased bilayer thickness tends to enhance mechanical properties, decreased lipid order parameter has the opposite effect. Our study offers new insights into the molecular-level design of LGN formations, providing valuable guidance for the development of consumer products.
Results
Surfactants induce both chain disorder and tilting of fatty alcohols in Lβ phase bilayers
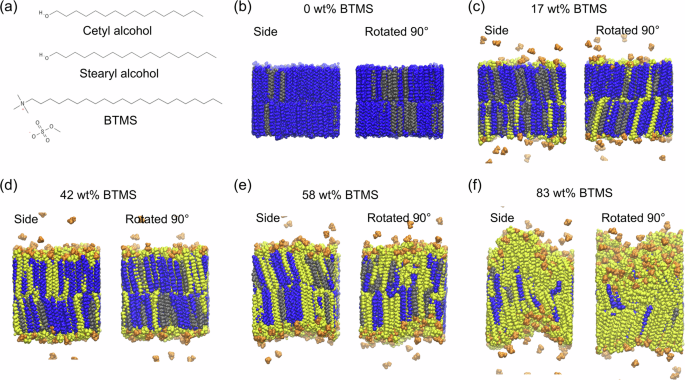
We have generated and simulated bilayers comprised of cetyl and stearyl alcohols and surfactant BTMS with different BTMS wt% (Table 1) at 298 K to obtain Lβ phase bilayers. Chemical structures of the bilayer constituents are shown in Fig. 1a. For each BTMS wt%, we have generated three bilayers with different initial distributions of the lipids, of which the bilayers with 0 wt% and 17 wt% BTMS are shown in Fig. S1 whereby the final distribution of FAs and BTMS is quite uniform. The mean-squared-displacements of the lipid species are quantified, and the diffusion coefficients computed (Fig. S2) show that the FAs are diffusing very slowly (about 0.2 × 10⁻⁸ cm2/s) in the 0 wt% or 17 wt% BTMS bilayers, which is 30-fold slower than the diffusion of phospholipids in the fluid phase obtained from MD simulations (about 6 × 10⁻⁸ cm2/s)13. Hence, the lipids in our simulated bilayers can be considered to be in the gel phase but not in the crystalline phase.

a Chemical structures of the FAs and BTMS involved in the model. BTMS consists of behentrimonium (BT) and methosulfate (MS) as counterion. b–f Representative simulation snapshots of equilibrated configurations of bilayers at 298 K (after 100 ns of MD simulation each) with varying weight percentages of BTMS. Cetyl alcohols, stearyl alcohols, BT, and MS molecules are colored gray, blue, yellow, and orange, respectively. Water molecules are omitted for clarity.
As shown in Fig. 1b–f, as a higher number of surfactants are included, the bilayer components begin to tilt relative to the bilayer normal to accommodate the longer surfactants, becoming Lβ’ phase bilayers. Methosulfate (the surfactant counterion) molecules are mostly bound on the bilayer surface to neutralize the positive charges on the surfactant headgroups. The bilayer-water interface is rather regular at lower surfactant percentages but becomes highly irregular at the highest percentage of 83 wt%.
To quantify the organization of the bilayer constituents, we computed the averaged order parameters along the hydrocarbon chains of both FAs and surfactants (atom numbered from headgroup to the end of the hydrocarbon chain). The order parameter indicates the alignment level of the hydrocarbon chains with the bilayer normal, which is determined by the degree of disorder in the hydrocarbon chains as well as the tilting level of the chains. We find that the order parameters are highest for the surfactant-free bilayer (most aligned to bilayer normal), with a broad plateau region along most of the carbon atoms in the hydrocarbon tail of the FAs (Fig. 2a). Order parameter values reduce with the increase in BTMS content but are roughly constant along most part of the fatty acid chains when BTMS content is below 58 wt%. From 58 wt% BTMS, the plateau region becomes smaller, indicating more disorder near the ends of the hydrocarbon tails, and the order parameter curves of FAs and BTMS decouple at 83 wt% BTMS, with the order parameter values of BTMS being lower and the order parameters of FAs being similar to each other. As indicated by the reduction in the order parameter for low atom indices (headgroup region), the BTMS headgroups become increasingly less aligned to the bilayer normal with the increase in the BTMS content, suggesting that the headgroups become increasingly free to orient at the surface of the bilayer.

a Plots of order parameters (S) along fatty acid hydrocarbon tails averaged over all molecules of each species and over the last 10 ns of simulation time. b Representative simulation snapshots at 100 ns showing the arrangement of cetyl alcohols as the BTMS content increases in the bilayer. Atoms are colored as follows: carbons in cyan, oxygens in red, and hydrogens in white. c Plots of the average cetyl alcohol tilting angle taken over all cetyl alcohol molecules with simulation time. d Measured average S for cetyl alcohols taken over plateau regions in (a) plotted against predicted values based on average tilt angles taken from the last 10 ns in (c).
As shown in Fig. 2b, the cetyl alcohols exhibit increasing tilt as the BTMS content increases. The cetyl alcohols have a very low tilt of around 3.4° in the absence of BTMS, and the tilt increases to about 20° as the BTMS content increases to 58 wt% (Fig. 2c). To assess the contribution of lipid tilting to the reduction of order parameter, we calculated the predicted average order parameter values based on the mean values of the tilt angles over the last 10 ns shown in Fig. 2c. The predicted order parameter values are plotted against measured average order parameter values (using plateau regions in Fig. 2a) in Fig. 2d. As the predicted values are generally close to but larger than the measured values from simulation, this implies that lipid titling plays a dominant role in determining the order parameters while lipid disorder also contributes to the reduction in order parameters.
Physical and mechanical properties of Lβ phase bilayers exhibit nonlinear variation with an increase in the weight percentage of surfactants
Next, we quantified the physical and mechanical properties of the Lβ phase bilayers. The variation of the properties with wt% BTMS are shown in Fig. 3. For the average order parameter, the order parameter profiles in Fig. 2a are averaged over each plateau region (determined based on the 17 wt% BTMS plot) for both FAs and surfactants and then averaged over these three constituents for each bilayer. The averaged order parameter increased slightly from 0 to 17 wt% BTMS and then monotonically decrease with further increase in BTMS content (Fig. 3a), with a sharper drop from 58 to 83 wt% BTMS as also reflected in the order parameter profiles in Fig. 2a. The averaged tilt angle of the lipid chains, represented by the tilt of the cetyl alcohols relative to the bilayer normal, exhibits an opposite trend to the averaged order parameter (Fig. 3b), with an increasingly larger tilt angle for the bilayers with BTMS content higher than 17 wt%. This opposite trend is consistent with our finding that the lipid tilt angle significantly contributes to the order parameter as indicated by Fig. 2d. In contrast, the bilayer area per lipid (area/lipid) monotonically increases with the increase in BTMS content (Fig. 3c). The increase in the area/lipid is partially due to the larger headgroup of BTMS compared to FAs. In addition, the decrease in lipid order and increase in chain tilting also contribute to the increased area/lipid. As BTMS is longer than FAs, having more BTMS in the bilayer contributes to an increasing bilayer thickness from 0 to 42 wt% (Fig. 3d). But when the BTMS content is larger than 42 wt%, lipid disordering and tilting become dominant, preventing the further increase in bilayer thickness.

a Averaged order parameters taken over plateau regions in each profile in Fig. 2a. b Averaged tilt angle of cetyl alcohols relative to bilayer normal as a function of BTMS wt%. c Area per lipid as a function of BTMS wt%. d Averaged bilayer thickness as a function of BTMS wt%. e Elastic modulus as a function of BTMS wt%. Mean values are calculated based on simulations of three separate Lβ phase bilayers for each BTMS wt%.
To gauge the effect of BTMS content on the mechanical properties of the gel phase bilayer, the in-plane stretching elastic modulus (KA) is computed based on area fluctuations for each bilayer and plotted against BTMS content (Fig. 3e). The KA values are comparable or higher than CTAC:cetyl alcohol bilayer in gel phase (about 2000 mN/m at 298 K)12, and significantly larger than the CTAC:cetyl alcohol bilayer and phospholipid bilayers in fluid phase (about 200 mN/m)12,14. Most importantly, the variation of KA with BTMS content is non-monotonic: KA increases from 0 to 17 wt% and decreases thereafter with the lowest KA at 83 wt% BTMS (Fig. 3e). Considering the disruptive effect of a high BTMS content on lipid packing, the decrease of KA with the increase in BTMS content is somehow expected and is in consistent with previous studies: the yield stress of BTAC:cetyl alcohol formulation with 6:5 mass ratio (55 wt% BTAC) is half of that at 2:5 mass ratio (29 wt% BTAC)11, and the storage modulus of emulsions with BTAC and cetyl/stearyl alcohols is also the lowest at the highest molar ratio of 50% BTAC8. In contrast, the stiffening effect of BTMS when its content is below 17 wt% is potentially caused by the corresponding increase in bilayer thickness, which is more significant than the increase in average order parameter. As confirmed by our additional simulations of bilayers with single-component FAs, the increase in FA chain length increases the order parameter and the bilayer thickness, while reduces the area/lipid, resulting in a monotonic increase in KA (Fig. 4). Taken together, the results suggest that the non-monotonic change in KA is primarily due to the stiffening effect of the increased bilayer thickness at low BTMS content and the softening effect of the reduced lipid order parameter as BTMS content further increases.

a Representative simulation snapshots showing the equilibrated configuration of various bilayers. The C16, C18, and C22 bilayers consist of 496, 444, and 368 molecules, respectively, with the same molecular weight of 120 kDa. b Order parameter averaged over molecules and over simulation time (last 10 ns). c–e Plots of the area/lipid, average bilayer thickness, and elastic modulus over the same simulation time intervals.
Furthermore, as repeated cycles of annealing and quenching have been shown to result in a denser, better-packed Lβ phase bilayer12, we have subjected our bilayers to five cycles of annealing (heating to 400 K for 1 ns followed by cooling to 298 K for 1 ns) and the outcome for the bilayers with 0 wt% and 17 wt% BTMS are shown in Fig. S3 and Table S1. The effect of annealing treatment on the structural and mechanical properties of our Lβ phase bilayers is minimal. The variation of KA with BTMS content mirrors averaged values using un-annealed bilayers in Fig. 3e. A similar non-monotonic effect is observed with 17 wt% and 42 wt% BTMS bilayers showing higher KA values (i.e., stiffer) than the bilayers with 0 wt% and 58 wt% BTMS.
Response of Lβ phase bilayers to shear force shows surfactant weight percentage-dependent behavior
The shear response of Lβ phase bilayers is important as the LGN undergoes shearing both during preparation and when conditioners are applied onto our hair4,15. As shown in Fig. 5a, the temporal evolution of shear stress shows a slow increase of stress followed by sharp stress relaxation for the bilayer without BTMS and those with low BTMS contents, with the time gap between neighboring stress peaks reducing with BTMS concentration. With 83 wt% BTMS, the stress-time profile is devoid of stress peaks, indicating that the bilayer is no longer stress bearing despite being still in the Lβ’ phase, as its KA value is about 10-fold larger than typical phospholipid bilayer in fluid phase14. The bilayer constituents move during shear with faster displacement along the X–Z plane at the largest Y value (see simulation snapshots in Fig. 5b for the 17 wt% BTMS bilayer), with some of the molecules undergoing sudden displacement over a short time interval (about 1 ns) during the relaxation of the first stress peak (Fig. 5a, c, d). This large displacement might be a result of the stress relaxation process analogous to a stick-slip phenomenon.

a Stress-time plots from simulated shearing of bilayers with different wt% BTMS at the lowest strain rate simulated. b Simulation snapshots showing the top views of the bilayer (along the z-axis) at different time points during shearing. A stearyl alcohol molecule is colored red to highlight the shifting of the bilayer constituents along the x-axis under shear. Periodic boundary conditions are taken into account. c Simulation snapshots taken from the simulation in (b) showing sudden displacement of two behentrimonium molecules during stress relaxation at the location of the first peak in (a). d Plots of x-location with time of the two behentrimonium molecules in (c). e Log10-Log10 plot of shear viscosity against strain rate for bilayers with different wt% BTMS. Dashed lines are linear regression fits. f Plot of log shear viscosity against wt% BTMS at a log strain rate of 7.0 s−1 obtained using linear regression fits to data in (c).
As the bilayers with BTMS exhibit significant tilting, it is important to characterize the bilayer structure and tilt angle changes during shearing and during relaxation after removal of shear. As shown in Fig. S4a, b for the 17 wt% BTMS bilayer, we find that the distribution of lipids is altered by shear and results in different distributions under different shear rates. Nevertheless, all the structures remain intact after shear. The chain tilt increases during shearing and further increases during equilibration after the removal of shear, instead of relaxing back to the initial value (Fig. S4c, d). The averaged tilt angles over the range of shear rates we used showed an initial increase from 13° (before shear) to about 20° at a shear rate of 0.05 ns−1 and remained constant beyond that (Fig. S4e).
Across the bilayers with different BTMS contents, the shear viscosity of the bilayers decreases with strain rate (used interchangeably with shear rate) on a log-log scale (Fig. 5e), which is indicative of shear-thinning behavior as reported in the literature7. As the shear viscosity versus shear strain rate can be well fitted by linear regression lines on the log-log scale, this suggests a power law relationship between shear viscosity and shear strain rate: ({eta }_{s}propto {dot{gamma }}^{n}), where the exponent n is given by the slope of the linear regression line (see Table 2). As the exponent values are close to −1, this suggests that ({eta }_{s}propto {dot{gamma }}^{-1}).
The bilayer with 83 wt% BTMS shows the lowest shear viscosity values across the range of shear rates simulated, and together with the lowest stretching elastic modulus, suggests that the bilayer with the highest wt% of surfactant is least resistant to stretching and shear forces. Its shear viscosity values are quite close to those of C16 saturated dipalmitoylphosphatidylcholine (DPPC) phospholipid bilayer in gel phase obtained at 280 K (Fig. S5): log shear viscosity of 83 wt% BTMS bilayer is −8.1 at log strain rate of 7.1 s−1 compared to −8.5 at the same log strain rate for the gel phase phospholipid bilayer. Incidentally, the stress-time profiles we obtained for the DPPC bilayer in the fluid and gel phases are also devoid of stress peaks (Fig. S5). On the other hand, the bilayer with 42 wt% BTMS shows the highest shear viscosity values across the range of strain rates simulated, suggesting that the bilayer shows the highest resistance to shear flow. Shear viscosity values obtained at the same strain rates for each system as a function of wt% BTMS show more clearly that the shear viscosity reaches a maximum at 42 wt% BTMS (Fig. 5f). This result suggests that the maximum mechanical resistance (to stretching and shear forces) of Lβ’ phase bilayers comprised of cetostearyl alcohol and BTMS occurs when the wt% of BTMS is less than 50.
Discussion
LGNs are commonly found in pharmaceutical and cosmetic products due to their unique rheological properties conferred by the lamellar gel phase, which consists of bilayers of surfactants and long-chain FAs (C16/C18). Here, we have investigated the physical and mechanical properties of the bilayers with increasing surfactant content using MD simulations, focusing on the BTMS surfactant with C22 hydrocarbon chains. From our simulations, we found that the constituent molecules in gel phase bilayers are straight and aligned with the bilayer normal in the absence of surfactants, but become increasingly tilted as the surfactant content increases. Such tilting of molecules in the Lβ phase bilayer has been reported in previous molecular simulations using BTMS and stearyl alcohol in the bilayers16. This may be a result of minimizing the hydrophobic mismatch in the lipid chain length between FAs and surfactants (4–6 carbon difference). The surfactant headgroup also showed lower order parameter values (degree of lipid chain alignment to bilayer normal, reflecting lipid chain disorder and chain tilting) compared to FAs, which indicates their larger conformational freedom. The surfactant headgroup order decreases faster than the FA headgroup order as we increase the surfactant wt%, which may be attributed to an increase in surfactant headgroup electrostatic repulsion due to their positive charges. Further, increasing surfactant content also introduces increased disorder in the molecular packing, as observed from the average order parameter plots with surfactants showing lower order parameter values than FAs at the highest surfactant wt%, as the integrity of the bilayer is compromised with the much fewer FAs present.
Our Lβ phase bilayers show nonlinear variation of physical properties (order parameter, chain tilt, area/lipid, and thickness) and mechanical properties (elastic modulus and shear viscosity) with BTMS content. As BTMS content in the bilayer is increased, the average order parameter increases from 0 to 17 wt% and decreases thereafter, which may be attributed to the tilting of lipid chains observed, which shows an opposite trend (larger tilt implies smaller order parameter). With a small fraction (17 wt%) of BTMS, the ensemble-averaged (triplicate simulations) order parameter increases slightly, and FA chain tilt reduces slightly, which suggests that the inclusion of a small fraction of longer chain BTMS induces straightening of the FAs. The ensemble-averaged area/lipid increases marginally, which may be attributed to the larger BTMS headgroups. The ensemble-averaged average thickness of the bilayer showed a significant increase due to the longer surfactant chains, which might have contributed to the increase in the ensemble-averaged elastic modulus. Our additional simulations of single-component FA bilayers indeed showed that the bilayer stiffness monotonically increases with chain length resulting in an increase in bilayer thickness and order parameter (better packing). As we increase the BTMS content to 42 wt%, the bilayer thickness increases further, together with an increase in chain tilt and a decrease in order parameter. The area/lipid also increases. However, the elastic modulus is now lower than at 17 wt%. Hence, the stiffening effect of having longer chain BTMS is negated by the increase in chain tilting and area/lipid due to larger BTMS headgroups, which resulted in a more loosely packed bilayer. Lastly, beyond 42 wt% BTMS, the bilayer thickness reaches a constant value, but the order parameter decreases more rapidly with both the chain tilt and area/lipid increasing more rapidly. This resulted in an increasingly softer bilayer. The response of the bilayer to shear also shows a nonlinear variation of log shear viscosity with wt% BTMS, with a maximum value at 42 wt%. Hence, both measures of mechanical stiffness suggest that our Lβ phase bilayers showed a nonlinear mechanical response with respect to the increase of BTMS in the bilayers. Thus, around 42 wt% might be the threshold below which thickness dominates the stiffness of the bilayers, and above which lipid packing or area/lipid effect dominates.
But how general is the observed non-monotonic variation of elastic modulus with surfactant content? What happens if the surfactant chain is not longer but of the same length as the FAs? To answer these questions, we have set up and simulated the properties of gel phase bilayers consisting of CTAC and cetyl alcohol, whereby the surfactant has the same chain length as the FAs. As shown in Fig. S6, CTAC-C16OH bilayers also show an increase in chain tilt as wt% CTAC increases. The overall trends of the average order parameter and average tilt angle are similar to our BTMS bilayers. The bilayer thickness first increases slightly, followed by a more significant drop when the CTAC content is beyond 42 wt%. Importantly, the elastic modulus also shows an increase to a maximum value (at 42 wt% CTAC) and then decreases beyond that.
In conclusion, we have investigated the effect of surfactant content on the physical and mechanical properties of surfactant-FA lamellar gel phase lipid bilayers using MD simulations and found a nonlinear variation of the properties with surfactant content. We confirm this is due to the competing effect between bilayer thickness and lipid packing order as the surfactant content in the bilayer increases. Our study thus revealed new insights into the molecular-level design of LGN formations, providing valuable guidance for the development of consumer care products involving LGNs such as hair conditioners.
Methods
Generation of Lβ phase bilayer composed of long-chain alcohols and BTMS
The procedure to generate and simulate a Lβ phase bilayer comprised of cetyl and stearyl alcohol and surfactant BTMS (C22 hydrocarbon chain) followed our previous work17. The compositions of the simulated bilayers are shown in Table 1. Each bilayer was placed in a 3D periodic box filled with water molecules based on the TIP3P water model. CHARMM-GUI webserver was used to generate topology and parameters for the FAs and surfactant18,19,20. The all-atom CHARMM force-field was used to describe inter-atomic interactions, and MD simulations were carried out using GROMACS version 2023 software21,22,23. Energy minimization using the steepest descent method was first used to remove any inter-atomic steric clashes that might be present. MD simulations were then carried out in steps with positional restraints on surfactant headgroup atoms progressively reduced to zero. Simulation time-step was increased from 0.5 to 2 fs. The system was maintained at 298 K (i.e., in the gel phase for FAs) with the Velocity-rescale thermostat with a time constant of 1.0 ps. The pressure was maintained at 1 bar using the Berendsen barostat with semi-isotropic coupling along the bilayer plane in X–Y and with a time constant of 5 ps and compressibility of 4.5 × 10⁻⁵ bar−1. Lastly, MD simulations without headgroup restraints were carried out for 100 ns using the Nose-Hoover thermostat and pressure maintained at 1 bar using the Parrinello-Rahman barostat. The simulation time-step was 2 fs with bonds involving hydrogen atoms constrained using the LINCS method. Electrostatic interactions were computed using the Particle Mesh Ewald method with a cut-off distance of 1.2 nm. Van der Waals interactions were computed using the cut-off method with forces smoothly switched to zero between 1.0 and 1.2 nm.
Calculation of physical and mechanical properties of the bilayer
The physical properties of the simulated bilayers were computed from the 90–100 ns trajectory data. Area per lipid was calculated by dividing the time-averaged X–Y box area (taken as X–Y projected bilayer area) by half the number of molecules in the bilayer. Bilayer thickness was estimated based on the difference in the averaged Z-coordinates of behentrimonium (if present) and cetyl alcohol headgroup atoms between the top and bottom monolayers, using an in-house Python script with the Z-coordinates extracted using an in-house TCL script running in visual molecular dynamics (VMD) visualization software24. The bilayer with 83 wt% BTMS showed large surface undulations, and thus a more accurate measure of the bilayer thickness was obtained by first dividing the bilayer into ten (0.5 nm thick) slices along the X-direction and then computing the thickness of each slice using the method above. The average thickness over the ten slices was then computed for the X-direction. The procedure was then repeated for the Y-direction. The two average thicknesses along X– and Y-directions were then averaged to give the final estimate of the bilayer thickness. The packing of bilayer components was quantified using the order parameter (S=left|leftlangle 3{cos }^{2}theta -1rightrangle /2right|) computed for carbon atoms ({C}_{i}), where (theta) is the angle made by the vector connecting carbon atoms ({C}_{i-1}) to ({C}_{i+1}) with the bilayer normal. The angle brackets represent averaging over molecules and over simulation time. Order parameters were computed using the GROMACS tool “gmx order.” The average tilt angle of cetyl alcohols in the bilayers relative to the bilayer normal (computed separately for each monolayer) over time was obtained using an in-house TCL script running in the VMD software based on the vector connecting the headgroup oxygen with the last carbon atom along the FA’s hydrocarbon tail.
The mechanical properties of the bilayers computed include elastic modulus and shear viscosity. The elastic modulus KA, which measures the resistance of the bilayer to in-plane stretch, was calculated using the fluctuation of the X–Y projected bilayer area as ({K}_{A}={k}_{B}Tleftlangle Arightrangle /leftlangle delta {A}^{2}rightrangle), where (leftlangle Arightrangle) is the time-averaged area, (leftlangle delta {A}^{2}rightrangle) is the mean square fluctuation, ({k}_{B}) is the Boltzmann constant, and (T) is the absolute temperature14. For the calculation of the shear viscosity, the final configuration of each bilayer at 100 ns was subjected to perpendicular shear flow via a constant deformation of the simulation box along the X-direction (X–Z plane) under a prescribed shear rate (dot{gamma })25. The shear flow generated a linear velocity profile along the Y-axis such that particles at y = 0 were not subjected to any flow, whereas particles at y = L were subjected to the largest flow at velocity (dot{gamma }L), where L is the box dimension along the Y-direction (same as along the X-direction)26. The shear viscosity was defined as the total shear force on the bilayer per unit length divided by the shear rate: ({eta }_{s}=({F}_{mathrm{bilayer}}/L)/dot{gamma })26. The total shear force on the bilayer was, in turn, defined as the total force minus the contribution from solvent,
$${F}_{bilayer}=-leftlangle {P}_{{XY}}rightrangle {L}^{2}-{eta }_{w}dot{gamma }Lleft({L}_{perp }-{h}_{s}right)$$
where (leftlangle {P}_{{XY}}rightrangle) is the time-averaged value of the off-diagonal element of the pressure tensor ({P}_{{XY}}) computed using the GROMACS tool “gmx energy,” ({eta }_{w}) is the viscosity of water taken to be 0.32 × 10⁻³ Pa s for TIP3P water model at 298 K taken from simulation literature25, ({L}_{perp }) is the height of the simulation box, and ({h}_{s}) is the bilayer thickness. Calculation of the shear viscosity was carried out using an in-house Python script. The bilayer stress was calculated as (-leftlangle {P}_{{XY}}rightrangle).
Data availability
The data that support the findings of this study are available from the corresponding author upon request.
References
-
Junginger, H. E. Colloidal structures of O/W creams. Pharm. Weekbl. Sci. 6, 141–149 (1984).
-
Barry, B. W. The self bodying action of the mixed emulsifier sodium dodecyl sulfate/cetyl alcohol. J. Colloid Interface Sci. 28, 82–91 (1968).
-
Eccleston, G. M. The structure and rheology of pharmaceutical and cosmetic creams. Cetrimide creams; the influence of alcohol chain length and homolog composition. J. Colloid Interface Sci. 57, 66–74 (1976).
-
Cunningham, G. E., O’Sullivan, J. J. & Simmons, M. J. H. Exploring formulation, manufacture and characterisation techniques of lamellar gel networks in hair conditioners: a review. Adv. Colloid Interface Sci. 339, 103419 (2025).
-
Iwata, T. Lamellar gel network. In Cosmetic Science and Technology: Theoretical Principles and Applications 415–447. https://doi.org/10.1016/B978-0-12-802005-0.00025-2 (Elsevier Inc., 2017).
-
Fukushima, S., Yamaguchi, M. & Harusawa, F. Effect of cetostearyl alcohol on stabilization of oil-in-water emulsion. II. Relation between crystal form of the alcohol and stability of the emulsion. J. Colloid Interface Sci. 59, 159–165 (1977).
-
Datta, A. et al. Characterizing the rheology, slip, and velocity profiles of lamellar gel networks. J. Rheol. 64, 851–862 (2020).
-
Nakarapanich, J., Barameesangpet, T., Suksamranchit, S., Sirivat, A. & Jamieson, A. M. Rheological properties and structures of cationic surfactants and fatty alcohol emulsions: effect of surfactant chain length and concentration. Colloid Polym. Sci. 279, 671–677 (2001).
-
Colafemmina, G. et al. The cooling process effect on the bilayer phase state of the CTAC/cetearyl alcohol/water surfactant gel. Colloids Surf. A Physicochem. Eng. Asp. 597, 124821 (2020).
-
Iwata, T. & Aramaki, K. Effect of the behenyl trimethyl ammonium counterion on the lamellar gel property. IFSCC Mag. 16, 249–254 (2013).
-
Davies, A. R. & Amin, S. Microstructure design of CTAC:FA and BTAC:FA lamellar gels for optimized rheological performance utilizing automated formulation platform. Int. J. Cosmet. Sci. 42, 259–269 (2020).
-
De Oliveira, T. E. et al. Fluid bilayer phase in aqueous mixtures of fatty alcohol and cationic surfactant. Phys. Rev. Res. 2, 013075 (2020).
-
Wang, Y., Markwick, P. R. L., de Oliveira, C. A. F. & McCammon, J. A. Enhanced lipid diffusion and mixing in accelerated molecular dynamics. J. Chem. Theory Comput. 7, 3199–3207 (2011).
-
Venable, R. M., Brown, F. L. H. & Pastor, R. W. Mechanical properties of lipid bilayers from molecular dynamics simulation. Chem. Phys. Lipids 192, 60–74 (2015).
-
Cunningham, G. E., Alberini, F., Simmons, M. J. H. & O’Sullivan, J. J. Understanding the effects of processing conditions on the formation of lamellar gel networks using a rheological approach. Chem. Eng. Sci. 242, 116752 (2021).
-
Larson, R. G. & Wang, F. Free energy cost of interdigitation of lamellar bilayers of fatty alcohols with cationic surfactants from molecular dynamics simulations. J. Phys. Chem. B 125, 2389–2397 (2021).
-
Chng, C. P., Gupta, S. & Huang, C. Protonation state of a bioactive compound regulates its release from lamellar gel-phase bilayers. J. Phys. Chem. B 128, 7180–7187 (2024).
-
Jo, S., Kim, T., Iyer, V. G. & Im, W. CHARMM-GUI: a web-based graphical user Interface for CHARMM. J. Comput. Chem. 29, 1859–1865 (2008).
-
Kim, S. et al. CHARMM-GUI ligand reader and modeler for CHARMM force field generation of small molecules. J. Comput. Chem. 38, 1879–1886 (2017).
-
Lee, J. et al. CHARMM-GUI input generator for NAMD, GROMACS, AMBER, OpenMM, and CHARMM/OpenMM simulations using the CHARMM36 additive force field. J. Chem. Theory Comput. 12, 405–413 (2016).
-
Abraham, M. J. et al. GROMACS: high performance molecular simulations through multi-level parallelism from laptops to supercomputers. SoftwareX 1, 19–25 (2015).
-
Páll, S., Abraham, M. J., Kutzner, C., Hess, B. & Lindahl, E. Tackling exascale software challenges in molecular dynamics simulations with GROMACS. in Solving Software Challenges for Exascale (eds Markidis, S. & Laure, E.) 3–27. https://doi.org/10.1007/978-3-319-15976-8_1 (Springer, 2015).
-
Pronk, S. et al. GROMACS 4.5: a high-throughput and highly parallel open source molecular simulation toolkit. Bioinformatics 29, 845–854 (2013).
-
Humphrey, W., Dalke, A. & Schulten, K. VMD: visual molecular dynamics. J. Mol. Graph. 14, 33–38 (1996).
-
Zgorski, A., Pastor, R. W. & Lyman, E. Surface shear viscosity and interleaflet friction from nonequilibrium simulations of lipid bilayers. J. Chem. Theory Comput. 15, 6471–6481 (2019).
-
Shkulipa, S. A., Den Otter, W. K. & Briels, W. J. Surface viscosity, diffusion, and intermonolayer friction: simulating sheared amphiphilic bilayers. Biophys. J. 89, 823–829 (2005).
Acknowledgements
The work was financially supported by the Industry Collaboration Projects (IAF-ICP) – Research and Innovation Partnership with P&G – Joint Fund (I24HWE0023). The computational work for this article was partially performed on the resources of the National Supercomputing Centre, Singapore (https://www.nscc.sg).
Ethics declarations
Competing interests
C.H. is an Editorial Board member of npj Soft Matter.
Additional information
Publisher’s note Springer Nature remains neutral with regard to jurisdictional claims in published maps and institutional affiliations.
Supplementary information
Rights and permissions
Open Access This article is licensed under a Creative Commons Attribution-NonCommercial-NoDerivatives 4.0 International License, which permits any non-commercial use, sharing, distribution and reproduction in any medium or format, as long as you give appropriate credit to the original author(s) and the source, provide a link to the Creative Commons licence, and indicate if you modified the licensed material. You do not have permission under this licence to share adapted material derived from this article or parts of it. The images or other third party material in this article are included in the article’s Creative Commons licence, unless indicated otherwise in a credit line to the material. If material is not included in the article’s Creative Commons licence and your intended use is not permitted by statutory regulation or exceeds the permitted use, you will need to obtain permission directly from the copyright holder. To view a copy of this licence, visit http://creativecommons.org/licenses/by-nc-nd/4.0/.
About this article

Cite this article
Chng, CP., Gupta, S. & Huang, C. Effect of surfactant-fatty alcohol ratio on physico-mechanical properties of lamellar gel phase bilayers. npj Soft Matter 2, 3 (2026). https://doi.org/10.1038/s44431-025-00016-3
-
Received:
-
Accepted:
-
Published:
-
Version of record:
-
DOI: https://doi.org/10.1038/s44431-025-00016-3