Introduction
Single cells constitute the fundamental structural and functional units of living organisms, and understanding cellular activity is essential for medical innovation, including personalized medicine, precision drug delivery, disease diagnostics, and regenerative therapy1,2. While population-level studies provide valuable insights into collective behavior and network interactions, they average over diverse states and can obscure rare or transient phenotypes. In contrast, single-cell analysis enables interrogation of cellular heterogeneity and independent functional characteristics with enhanced precision, yielding deeper views of drug response variability and mechanisms underlying cancer progression, immune reactions, and antibiotic resistance3,4,5,6,7. Single-cell interrogation mainly relies on fluorescence-based approaches, most notably confocal fluorescence microscopy and flow cytometry8,9. These methods offer high specificity and sensitivity, enabling subcellular visualization of cellular structures, organelles, and molecular signatures. However, fluorescence-based approaches generally require nontrivial sample preparation, including dye labeling and fixation to preserve morphology, constraining live and dynamic measurements10. Although living cell staining strategies are applicable, phototoxicity can arise through light-driven generation of reactive oxygen species, and preparation steps can stress or damage cellular components to varying degrees, hindering the observation of native cells11,12.
Raman spectroscopy has been explored as a label-free alternative that provides molecular-specific information with strong multiplexing capacity13,14,15. This technique allows researchers to investigate cellular dynamics and spatial mapping of molecular distributions without labeling or fixation. In practice, the intrinsically small Raman scattering cross section often necessitates higher laser powers and longer integration times, which increase the risk of photodamage. Conversely, reducing power to preserve cells leads to exceedingly long acquisition times, limiting throughput and precluding studies of fast biological events in living cells. This trade-off motivates approaches that maintain the advantages of label-free spectroscopy while enabling gentle, time-resolved measurements at the single-cell level.
Surface-enhanced Raman spectroscopy (SERS) has emerged as a non-destructive and ultrasensitive technique that significantly amplifies Raman fingerprints through plasmonic hotspots16. Inelastic Raman scattering occurring within these plasmonic hotspots, coupled to surface plasmon-mediated local electromagnetic field enhancement, can push sensitivity toward the single-molecule regime17. Such ultrahigh sensitivity enables label-free identification of chemical signatures at low excitation laser power, offering non-destructive and high-throughput analysis. In addition to the Raman character of multiplexing and molecule-specific vibrational information, SERS has been applied widely in bioanalytical applications, including pathogen and extracellular vesicle detection, protein analysis, DNA/RNA sequencing, and dopamine detection18,19,20,21,22,23. Label-free SERS approaches have played a significant role in cellular analysis, including cell type classification and detection of intracellular metabolites and biomolecules24,25,26,27,28,29,30.
For single-cell SERS, both label-free and labeled nanoparticle-based strategies have been widely employed31,32,33. These approaches enable tracking of cellular uptake processes, imaging of suborganelles, and simultaneous readout of multiplexed metabolites. However, colloidal systems suffer from variable plasmonic hotspots due to random aggregation in intra- and extracellular environments, undermining reproducibility. Additionally, internalized nanoparticles are often affected by endosomal and lysosomal pathways, limiting access to the broader cytoplasmic or membrane regions, thereby hindering subcellular spatial investigations. Their performance is further modulated by environmental conditions such as pH, which affect nanoparticle stability and aggregation, and can lead to fragmentation or breakage within the cellular environment. To achieve controlled nanoparticle localization and precise subcellular targeting, labeled-SERS has been explored, yet these require prior knowledge of targets, involve costly probe synthesis, and may perturb native cellular states, potentially compromising the authenticity of biological measurements.
On the other hand, solid SERS substrates for single-cell analysis have been reported only in limited contexts, such as pH sensing and real-time monitoring of dopamine secretion34,35,36. In these configurations, cells are directly cultured on SERS-active surfaces, where a stable nano-bio interface (e.g., membrane-hotspot interface) is the key factor for reliable SERS signal acquisition. A comparative summary of representative SERS substrates, including their nanostructures, enhancement factors, and biological applications, is provided in Table S1. While 3D protruding geometries of nanostructures can significantly influence the membrane-substrate interface, simultaneously optimizing interface geometry and hotspot density remains challenging. Furthermore, although high-performance 3D SERS substrates have been reported, many platforms are not readily scalable, offer low-throughput, and provide insufficient area for embedding cells37,38,39,40. These manufacturing and design constraints have made direct molecular profiling of the extracellular environment difficult to translate into robust and practical single-cell applications.
In this work, we introduce a membrane-interfaced Au-silica SERS substrate with 3D nanotopography that enables a tight membrane-hotspot interface for spatially resolved molecular analysis of living single cells. The 3D protruding nanostructure of the multilayered Au-silica nanostructure can induce cell engulfment via vertical topography-driven membrane curvature, which serves as a biochemical cue to trigger actin reorganization through the curvature-sensitive protein FBP1741. This curvature-mediated response can induce engulfment of the cell membrane around the 3D nanoscale protrusions, resulting in a robust membrane-hotspot interface. Leveraging such a tight membrane-hotspot interface and excellent hotspot uniformity, we perform 2D SERS mapping that covers a single-cell area to achieve spatial molecular profiling at the individual living cell level. As a proof-of-concept demonstration, the platform visualizes spatial distributions of characteristic membrane-associated peaks that reflect cellular heterogeneity at the molecular scale, providing insights into spatially resolved biochemical variations within single cells. We anticipate applications in cancer cell characterization, drug response monitoring, and understanding cellular heterogeneity in disease progression.
Results
Overview of a single-cell spatial SERS analysis platform
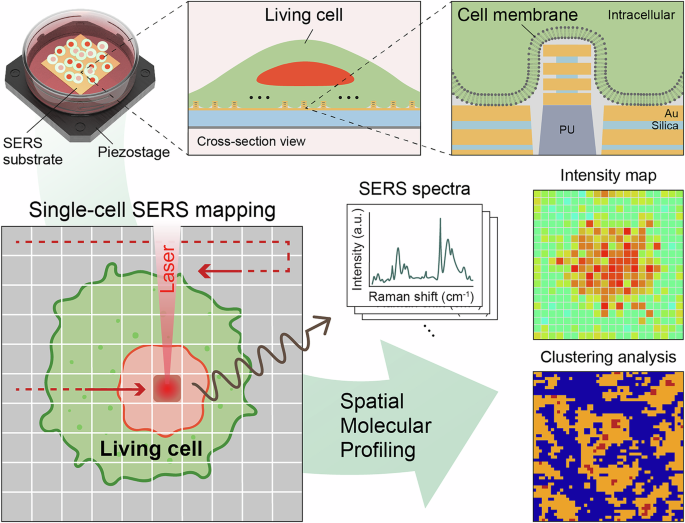
Figure 1 outlines a label-free SERS workflow for spatial molecular profiling of living single cells. We fabricated multilayered metal–insulator–metal nanoantenna arrays (Au-silica-Au) that have a wafer-scale device footprint with high SERS performance and a protruding 3D nanotopography. Living cells cultured directly on the SERS substrates engulf individual 3D nanoantennas, establishing a tight membrane–hotspot interface that supports consistent, reproducible 2D SERS mapping for single cells. The resulting maps provide molecular information of the extracellular space, enabling label-free spatial molecular profiling. We use 785 nm near-infrared excitation to suppress autofluorescence and minimize phototoxicity, and the broadband plasmonic property of multilayered nanoantennas is tuned to resonate from 785 nm to the biologically relevant Stokes-Raman region. Unsupervised clustering of pixel-wise spectra segments each single-cell into molecularly distinct domains, revealing patterns not apparent by manual inspection. This spatially resolved chemical information provides a practical handle for mechanism-focused single-cell studies, including acute stimulus responses, drug action, and metabolic state mapping.

2D SERS mapping of cell-interfaced Au-Silica SERS substrate provides intensity maps, used for subsequent statistical clustering analysis.
Characterization of Au-silica SERS substrate
In Fig. 2a, an optical image of the large-scale multilayered Au-silica SERS substrate shows a vivid diffraction pattern, and the inset scanning electron microscope image confirms uniform and periodic arrays of Au-silica nanoantennas. The surface topography of the fabricated nanopillar arrays was further characterized by atomic force microscopy (AFM) to verify their periodicity and uniformity (Fig. S1). The AFM results show consistent nanopillar arrays with a periodicity of 400 nm. Unlike SERS substrates composed of randomly aggregated nanoparticles, the periodic arrangement of nanoantennas provides uniform electromagnetic hotspots, thereby minimizing spot-to-spot variability and enhancing signal reproducibility across large areas. The cross-sectional view focused-ion beam scanning electron microscope (FIB-SEM) image at the top of Fig. 2a reveals the vertically stacked Au-silica-Au multilayer nanoantenna structure. To fabricate SERS substrates with multilayered Au-silica nanoantennas, we created a nanowell composite hard-polydimethylsiloxane (PDMS) stamp from a nanopillar-structured silicon wafer42. Next, we molded the PDMS stamp with UV-curable polyurethane (PU) to create nanopillar arrays on polyester film. Layers of gold and silica were alternately deposited by electron-beam deposition to fabricate the multilayered Au-silica nanostructures43. The gold and silica layer thicknesses were carefully optimized to achieve high hotspot density and stable membrane interfacing simultaneously. Vertically stacked layer nanoantennas were designed to support multiple plasmonic modes, including magnetic dipole resonances. Specifically, we employed 30 nm Au layers and silica insulator layers of 6, 8, and 12 nm (from bottom to top) to ensure broadband plasmonic resonance covering both the excitation (785 nm) and Stokes-Raman scattering regions. This multi-resonant configuration enables strong and stable SERS enhancement under near-infrared excitation, while maintaining biocompatibility and minimizing photodamage during live-cell measurements. Compared with other high-performance 3D SERS substrates, the soft lithography-based SERS substrates with a 16 cm2 device footprint on polyester film are cost-effective and can be readily cut into small pieces for cell studies.

a An optical image and a scanning electron microscope image of the substrate. The cross-sectional FIB-SEM image (top) shows the region marked by the red line. b Representative BZT SERS spectra obtained from the mapping measurement. c 2D SERS mapping image (20 × 20 µm2) using 1077 cm−1 peak of BZT. d FDTD-calculated reflectance spectra with different background refractive index values from 1.33 to 1.58. e Electric field intensity distribution map at 785 nm under a background refractive index of 1.38. f Calculated maximum |E|2 values at 785 nm with different background refractive index values.
To characterize SERS performance of the multilayered Au-silica SERS substrate, we performed 2D SERS mapping (400 pixels) using benzenethiol (BZT) self-assembled monolayer, a non-resonant Raman analyte, while immersing the substrate in water to mimic biological conditions. Figure 2b shows 20 representative BZT SERS spectra and displays the expected BZT signature peaks. The primary peaks at 420, 1001, 1024, 1077, and 1576 cm−1 are attributed to distinct vibrational modes in the BZT molecule44. To qualitatively assess hotspot uniformity, we plotted a 2D intensity map using the 1077 cm−1 peak (Fig. 2c). The calculated relative standard deviation is 6.9% across 400 pixel points, indicating great hotspot uniformity of Au-silica SERS substrates and supporting a reproducible SERS signal acquisition over a single-cell region.
To investigate the optical properties of the SERS substrates, we performed 3D finite-difference time-domain (FDTD) simulations. First, Fig. 2d shows calculated far-field reflectance spectra from 400 nm to 1100 nm with different background refractive index (RI) values ranging from 1.33 to 1.58 in 0.05 increments to reflect the varying local RI values of the extracellular cell membrane45,46. Multiple resonant dips appear over the wide wavelength range with different redshifting trends as the background RI increases. The peaks reveal different degrees of redshifting due to the various physical origins of plasmonic mode hybridization. The near-field electric field distribution maps are shown in Fig. S2 to visualize mode origins. The mode at near 600 nm arises from hybridization of the electric dipole localized surface plasmon (LSP) mode in multilayered nanoantennas and the surface plasmon polariton (SPP) Bloch mode in bottom multilayered nanohole arrays, both background RI-sensitive, thus redshifting as RI increases. On the other hand, two resonant dips at near 730 nm show negligible redshifting as background RI changes, consistent with SPP Bloch mode character in the nanohole arrays. The resonances at 830 and 950 nm redshift only slightly, attributable to hybridization of RI-insensitive SPP Bloch modes with RI-sensitive magnetic dipole gap modes24,47. Overall, the numerical studies show that the multilayered Au-silica SERS substrates exhibit a broadband plasmonic response that covers the excitation wavelength and extends into the biologically relevant Stokes-Raman region up to 1000 nm (2738 cm−1), helping preserve SERS performance under local RI variations of cellular membrane environment. For conventional single-resonant SERS substrates, in contrast, their SERS performances are likely to be off-resonant and significantly degraded due to different local RI values of living cells, and may provide biased quantification.
We used an excitation wavelength of 785 nm because it minimizes autofluorescence and provides high plasmonic efficiency for gold-based nanostructures. Among 532, 633, and 785 nm, electromagnetic field distribution profiles (Fig. S3) confirm that the 785 nm excitation produces stronger and more spatially confined near-field enhancement around the nanoantenna structure, validating it as the optimal wavelength for our platform. As shown in Fig. 2e, we calculated the electric field intensities and plotted a distribution map at 785 nm with a background RI value of 1.38 to mimic a cell membrane environment. The near-field map shows strong field enhancement at three vertical nanogap regions and along the nanodisk sidewalls that form direct physical contact with the cell membrane. The calculated maximum |E|2 is 1020, and using the |E|4 approximation48 yields an estimated SERS enhancement factor of 1.0 × 10⁶, sufficient to provide membrane biomolecular information in a label-free manner. To quantitatively evaluate the SERS performance, the enhancement factor of the substrate was determined using BZT48. Based on 400 mapping points in Fig. 2c, the average EF was calculated to be approximately 4.5 × 10⁶, in good agreement with simulation results.
As the local RI values of the membrane vary, we further calculated the maximum electric field intensity of Au-silica SERS substrates with different background RI values from 1.33 to 1.58. From 1.33 to 1.58 RI values with 0.05 increment, the maximum electric field intensities are 780, 1020, 1300, 1550, 1690, and 1500, respectively, indicating minimal background RI-induced SERS modulation. These numerical results support robust molecular profiling of single living cells.
Label-free spatial molecular profiling of single-cell
To demonstrate a proof-of-concept of label-free spatial molecular profiling of living single cells, we directly cultured breast cancer cells (MCF-7) onto the Au-silica multilayered SERS substrates. MCF-7 cells were selected as a representative model for this proof-of-concept demonstration because they are one of the most extensively characterized breast cancer cell lines, representing estrogen-receptor-positive luminal-type cancer. We first measured SERS spectra from individual cells to confirm that the platform can directly capture features of the extracellular environment in single living cells. Figure 3a and b present the representative SERS spectra of MCF-7 cells, and the corresponding spatial locations are star-marked in bright field images (Fig. 3c). As expected, each spectrum exhibits different spectral profiles, reflecting submicron-scale variation in the local extracellular environment and ongoing biological dynamics. Several characteristic peaks are observed, and the average spectra with the 5th–95th percentile distribution are provided in Fig. S4. To confirm that the signals originated from the membrane-associated environment rather than background noise, we measured the control spectrum obtained from culture media alone (without cells) on the SERS substrate in Fig. S5. No distinct Raman peaks characteristic of biomolecules were detected, confirming that the culture medium does not produce interfering signals and that residual media components do not significantly contribute to the observed SERS signals.

Representative SERS spectra of a cell 1 and b cell 2. The spatial locations are depicted as star marks in Fig. 3c. c Bright-field images of MCF-7 cell 1, cell 2, and cell 3, and 2D SERS intensity maps using d 679 cm−1, e 726 cm−1, and f 1121 cm−1. Intensity maps are overlaid with the corresponding bright-field images, outlined with cell morphology using white lines.
Each characteristic Raman peak in the spectra of Fig. 3a and b reports specific and comprehensive biochemical features, and we focused on three frequently observed peaks of 679, 726, and 1121 cm−1. The 679 cm−1 peak is consistent with glutathione-related vibrations, a crucial protein component of the cellular antioxidant defense system. As a biomolecule directly linked to cell survival, this peak may reflect the enhanced cancer cell survival49. The peak at 726 cm−1 corresponds to the adenine ring breathing mode, which potentially reflects local abundance from heightened adenine-containing metabolic activity and dysregulated signaling processes50. Moreover, the presence of the C-C stretching of the phospholipid peak at 1121 cm−1 is directly related to membrane components and indicative of membrane integrity and composition49. Together, such peak assignment observed at membrane-proximal sites supports an extracellular origin of the measured spectra.
Figure 3c shows bright field images of MCF-7 cells, which do not exhibit morphological signs of apoptosis (e.g., cell blebbing), indirectly supporting the biocompatibility of the Au-silica SERS substrates. To further validate the biocompatibility of the Au-silica SERS substrate, we conducted a live/dead assay (Fig. S6), which revealed no significant difference in cell viability between standard culture dishes and the SERS substrate. We conducted label-free 2D SERS mapping over 40 × 40 µm2, sufficient to cover a single-cell region with its local extracellular space, and visualized intensity maps of the three peaks (Fig. 3d–f). The detected SERS signals primarily arise from biomolecules associated with the cell membrane and its immediate pericellular environment, as the electromagnetic enhancement occurs exclusively within the nanoscale plasmonic hotspots of the 3D Au-silica nanoantennas. Given the 3D Au-silica nanoantenna topography and high cell viability, nanoantennas do not appear to penetrate the membrane and reach the intracellular region; instead, they are engulfed by the cell membrane, allowing the hotspots to interact predominantly with extracellular membrane-associated and nearby pericellular environments. To verify that no significant cell displacement occurred during the mapping process, bright-field images were captured immediately before and after SERS acquisition. As shown in Fig. S7, detectable positional drift or morphological change was minor.
To facilitate spatial distribution, the bright field images are overlaid on the maps with reduced brightness. Raw 2D SERS intensity maps are attached in Fig. S8. Overall, we observed meaningful spatial similarities between intensity maps and the overlaid bright-field images. The 2D SERS maps display that molecular signatures are not uniformly distributed, but instead exhibit localized patterns near the cell boundary or cytoplasmic region that align with cell morphology. As shown in Fig. 3d–f, cell 1 and cell 3 exhibit strong signal intensities distributed throughout the entire cell, whereas cell 2 shows relatively localized accumulation in specific regions. In addition, the spatial distributions of the characteristic molecular bands at 679, 726, and 1121 cm−1 differ within the same single cell, indicating that each molecular species exhibits a distinct localization pattern. Notably, although most high-intensity regions spatially correlate with the morphological cell boundary, some are not strictly confined to it. Given the dynamic biological activities of living cells, cell-derived pericellular biomolecules (e.g., metabolites and extracellular vesicles) in the vicinity of the membrane may occupy plasmonic hotspots. These observations demonstrate that molecular distributions are spatially heterogeneous even within a single living cell (spot-to-spot molecular heterogeneity), and that the degree of such heterogeneity varies across different individual cells, reflecting diversity in biomolecular composition and spatial organization51. To confirm reproducibility, additional single-cell SERS mappings were performed on cell 4 and cell 5 under identical conditions, as shown in Fig. S9. The overall spatial distributions and peak-specific patterns observed in these cells were consistent with those in Fig. 3c–f, supporting the reproducibility and robustness of the mapping results across multiple individual cells.
Furthermore, spatial maps of the characteristic peaks delineate biomolecular regional features and spatial analyses. For example, in the case of glutathione peak 679 cm−1 (Fig. 3d), recent studies have shown that glutathione levels decline drastically after anticancer drug treatment, indicating its potential use as a therapeutic response marker52. Mapping this peak across individual cells possibly allows visualization of spatially-resolved changes in glutathione distribution, thereby revealing drug-induced molecular alterations at the single-cell level. Similarly, spatial mapping of the 726 cm−1 (Fig. 3e) adenine ring-breathing vibration and the 1121 cm−1 (Fig. 3f) phospholipid C–C stretching band can provide a comprehensive view of localized biomolecular activities of cancer cell membranes, offering deeper insights into nucleotide metabolism and membrane lipid dynamics. However, manual inspection of such complex mapping data with molecular signatures remains subjective and human-error prone, and may lead to lab-to-lab variability and misinterpretation.
Identification of coherent molecular domains using HCA
To establish a reproducible analytical framework, we performed hierarchical clustering analysis (HCA) for unbiased spectral pattern recognition. HCA is an unsupervised machine learning technique that organizes spectral data into a hierarchical structure (dendrogram) based on similarity, allowing for objective identification of distinct molecular signatures. This method has been previously used in SERS multivariate analysis for spectral classification and spatial mapping of biochemical variations in cells53. Figure 4a, d, and g present dendrograms for cells 1, 2, and 3, respectively, illustrating how HCA systematically grouped the spectral dataset into distinct cluster populations based on spectral pattern similarity and relative peak intensity variations. The dendrogram structure reveals the hierarchical relationships between different spectral signatures, where the vertical axis represents individual spectra and the horizontal axis indicates the dissimilarity distance at which clusters merge. To maximize spectral distinction, the clustering number k was set to 3, allowing for optimal separation of distinct molecular signatures, and the three resulting clusters were assigned different colors of blue (cluster 1), yellow (cluster 2), and red (cluster 3).

Dendrograms showing spectral clustering for a cell 1, d cell 2, and g cell 3. Clustering pixel maps with three cluster groups for b cell 1, e cell 2, and h cell 3. Average SERS spectra for each cluster of c cell 1, f cell 2, and i cell 3 with shaded regions representing the 5th–95th percentile distributions.
Figure 4b, e, and h show the corresponding clustering pixel maps of cells 1, 2, and 3, demonstrating spatially coherent molecular domains. Notably, the clustered regions closely exhibit morphologies that resemble the actual cellular boundaries of each cell, supporting the reliability and biological relevance of label-free spatial molecular profiling achieved through 2D SERS mapping. Enrichment of specific clusters along the membrane further aligns with the membrane-associated components. The spatial coherence of clusters indicates that the observed peak patterns can reflect the distinct biochemical composition of the extracellular environment.
Figure 4c, f, and i show the cluster-averaged spectra of cell 1, cell 2, and cell 3, with shaded regions showing the 5th–95th percentile distributions for each cluster, thereby summarizing intracluster variability. For clusters 1 and 2, which most clearly demarcate distinct cellular regions, the principal spectral differences are observed in the intensity variations at 679 and 726 cm−1, consistent with the assignments described above. These findings further indicate heterogeneity of the corresponding biomolecules in the extracellular environments. Notably, cluster 3 (red) exhibits a distinct peak distribution, capturing localized and heterogeneous molecular signatures across membranes. This regional specificity points to spatially restricted membrane domains and can potentially enable deeper cellular interrogation. Such heterogeneity aligns with the concept of functional membrane compartmentalization and with recent reports of lipid rafts and localized signaling hubs that facilitate selective protein clustering and enhanced signal transduction in cancer cells54,55. The same HCA was also performed for cell 4 and cell 5 under identical conditions, as shown in Fig. S10. The resulting clustering maps exhibited broadly consistent molecular domain patterns and regions where the clustered boundaries roughly followed the overall cellular morphology, further supporting the general reproducibility of the analysis across multiple single cells.
Through systematic pixel-level hierarchical clustering, we demonstrated spatial molecular analysis through characteristic peak assignments while capturing overall spatial distributions across entire single cells. This spatially resolved multivariate approach yields a comprehensive interpretation of molecular fingerprints and captures complex biomolecular interactions within native cellular environments. Therefore, SERS-based spatial molecular profiling of living cells can bridge traditional Raman band assignment with data-driven multivariate approaches, establishing a reproducible framework for future label-free single-cell studies.
Discussion
We developed a membrane-interfaced 3D Au-silica SERS platform that integrates topography-induced cell engulfment with exceptional hotspot uniformity and broadband plasmonic enhancement, enabling spatially resolved molecular profiling of living single cells. The platform demonstrates uniform SERS performance (RSD = 6.9%) and mitigates the reproducibility issues of colloidal systems, which often suffer from aggregation in biological environments. The multilayered Au-silica nanoantenna design provides a broadband plasmonic response that is insensitive to variations in the local cellular RI, addressing limitations of single-resonant SERS substrates. By establishing tight membrane-hotspot interfaces through controlled 3D nanotopography, the SERS substrate yields consistent nano-bio interfaces allowing for reproducible signal acquisition from the extracellular molecular environment. The use of 785 nm near-infrared excitation can reduce phototoxicity and autofluorescence interference, critical considerations previously identified as major challenges in SERS-based cellular analysis. Label-free spatially resolved molecular profiling reveals spatial molecular heterogeneity within individual living cells, with characteristic peaks at 679, 726, and 1121 cm−1 potentially providing information regarding cellular antioxidant status, nucleotide metabolism, and membrane composition, respectively. Combined with HCA, the results provide objective identification of spatially coherent domains that correspond to cellular morphology, validating the biological relevance of label-free readouts and the platform’s ability to capture membrane-associated biochemical variations without labeling artifacts.
While the present work focuses on static molecular profiling, extending the approach to time-resolved measurements should illuminate the dynamics of cellular heterogeneity, including how molecular patterns evolve during drug exposure or stress. Additionally, systematic optimization of geometric parameters governing cell engulfment may further refine the membrane-hotspot interface and broaden applicability across cell types of diverse morphologies. In parallel, advanced AI methods for peak selection, denoising, and feature attribution could reduce operator bias and improve analytical consistency, in line with recent advances in automated SERS interpretation.
It is noted that when applying the platform to other cell types, several factors must be carefully considered, such as differences in cell adhesion, morphology, and membrane stiffness, which can influence the degree of membrane-nanostructure contact and hotspot accessibility. In particular, highly motile or weakly adherent cell types may require optimization of substrate surface chemistry or nanoantenna geometry to maintain stable cell–substrate interfaces during live-cell SERS mapping. Unambiguous peak assignment in label-free cellular SERS remains challenging because multiple biomolecules colocalize within plasmonic hotspots and contribute overlapping vibrational signatures to the measured spectra. Moreover, rigorous validation strategies, such as isotopic labeling, targeted inhibitor assays, or chemical perturbations, are generally incompatible with membrane-interfaced living cell SERS measurements, as they are likely to disrupt the nano-bio interface that is essential for membrane-associated signal acquisition. Consequently, molecular assignments in living cell studies have often been tentative, inferred from vibrational energies and prior literature under the assumption that the measured signals are cell-specific. We therefore envision that systematic and interface-preserving assays can markedly improve the feasibility and interpretability of label-free cellular SERS and extend its use to spatiotemporally-resolved analyses under diverse external stimuli.
In summary, we demonstrate a membrane-interfaced 3D Au-silica SERS platform that enables label-free extracellular mapping for spatial molecular profiling at the single-cell level. The multilayered nanoantenna arrays demonstrate exceptional hotspot uniformity and robust SERS enhancement under biologically relevant conditions. The key enabling factor is the formation of tight membrane-hotspot interfaces via 3D nanotopography-induced cell engulfment, allowing consistent and reproducible signal acquisition from the extracellular environment. Our 2D SERS mapping approach successfully captured spatial distributions of characteristic biomolecular signatures, and the implementation of HCA provides an objective framework for identifying spatially coherent molecular domains that correspond to cellular morphology and membrane compartmentalization. Therefore, we believe that the platform’s label-free and minimally perturbative operation makes it well-suited for future studies of dynamic cellular responses and for advancing our understanding of fundamental biological processes at single-cell resolution.
Methods
Fabrication of Au-silica-based SERS substrate
We initially fabricated a composite polydimethylsiloxane (PDMS) template containing nanowell arrays featuring 400 nm periodicity, 100 nm diameter, and 150 nm depth through soft lithography processes using a silicon wafer with patterned nanopillar structures. Using this PDMS template as a mold, UV-curable polyurethane (PU) was employed to create nanopillar arrays on flexible, optically transparent polyester substrates. Following a 10-minute UV exposure, additional thermal curing was conducted at 80 °C in a convection oven overnight. Subsequently, sequential deposition of gold and silica layers was performed via electron-beam evaporation techniques. Four gold layers were deposited with 30 nm thickness each, while three silica layers were deposited with thicknesses of 6 nm, 8 nm, and 12 nm from bottom to top, respectively. Chromium (1 nm) was deposited as an adhesion layer between the polymer nanopillar array and the initial gold layer, with titanium (0.7 nm) serving as adhesion layers between gold and insulator interfaces. Finally, selective etching of silica layers was achieved using a 10:1 buffered oxide etchant for 20 seconds to expose the embedded metal-insulator-metal plasmonic hotspots.
Finite-difference time domain (FDTD)
3D FDTD simulations were performed by commercial software (Ansys Lumerical Inc.). A uniform 2 nm mesh was used for x-, y-, and z-directions. The optical constants of gold were taken from Johnson and Christy. The Bloch boundary condition was used in x- and y-directions with a periodicity of 400 nm and the perfectly matched layer boundary condition was used in the z-direction. The refractive index of Silica, and PU were set as 1.5 and 1.56, respectively. The background RI value was varied from 1.33 to 1.58.
Enhancement factor (EF) calculation
The enhancement factor (EF) of the multilayered Au-SiO2 SERS substrate was evaluated using benzenethiol (BZT) as a non-resonant Raman analyte. The EF was calculated using the standard expression, EF = (ISERS/IRaman) × (NRaman/NSERS), where ISERS and IRaman represent the measured SERS and neat Raman intensities, respectively, and NSERS and NRaman denote the number of molecules contributing to each signal. NSERS was estimated as NSERS = SA × ρSERS, where SA is the illuminated surface area on the SERS substrate and ρSERS is the molecular packing density of BZT (6.8 × 10¹⁴ molecules/cm2). NRaman was determined using NRaman = A × deff × ρRaman, where A is the laser-illuminated area, deff is the effective focal depth, and ρRaman is the molecular density of neat BZT (5.9 × 10²¹ molecules/cm3). The deff value was experimentally measured using a bare silicon wafer by adjusting the objective focus in incremental steps.
Single cell culture
MCF-7 cells were grown in EMEM with 10% FBS and 2× L glutamine. Cells were grown in culture flasks at 37 °C in a 5% CO2 atmosphere. Cells were then trypsinized and seeded on Au-silica SERS substrates.
Live/dead assay
Cell viability was assessed using the LIVE/DEAD Viability/Cytotoxicity Kit (Thermo Fisher Scientific). Calcein-AM stock solution was equilibrated to room temperature and diluted with PBS (5 μL calcein-AM per 10 mL PBS). After medium removal and PBS washing, the cells in the plates were incubated with 2 mL of staining solution for 30 minutes at room temperature. Cells were then imaged using fluorescence microscopy at 494/517 nm excitation/emission wavelengths to visualize viable cells.
SERS measurement
For SERS measurements, we employed a confocal Raman microscope with 785 nm laser excitation delivered through a 20× objective (NA = 0.4). When conducting 2D SERS mapping experiments on living cells, we switched to a 20× water immersion objective (NA = 0.5) and collected spectra with a 1-second integration time per pixel across 40 μm × 40 μm scanning area. Before each measurement session, we verified instrumental calibration by confirming the silicon reference peak at 520 cm−1 to ensure spectral accuracy. We performed all experiments using a backscattering geometric configuration. The collected backscattered photons were then spectrally dispersed using a 300 groove/mm diffraction grating and captured by a CCD detector.
Data analysis
Cosmic ray removal and baseline correction were conducted. Extraction of intensities at the 679, 726, and 1121 cm−1 peaks and data truncation from 200 to 2000 cm−1 for HCA input were carried out with the R package hyperSpec. Outlier spectra were excluded before clustering; these excluded regions are displayed in gray on the HCA maps. For HCA, calculation of distance matrices, dendrograms, and clustering was performed using the stats package.
Data availability
The data associated with this study are provided in this manuscript and accompanying Supplementary Information. Raw data are available from the corresponding authors upon reasonable request.
References
-
Hoang, D. M. et al. Stem cell-based therapy for human diseases. Sig. Transduct. Target Ther. 7, 272 (2022).
-
Farah, E. N. et al. Spatially organized cellular communities form the developing human heart. Nature 627, 854–864 (2024).
-
Gambardella, G. et al. A single-cell analysis of breast cancer cell lines to study tumour heterogeneity and drug response. Nat. Commun. 13, 1714 (2022).
-
Aissa, A. F. et al. Single-cell transcriptional changes associated with drug tolerance and response to combination therapies in cancer. Nat. Commun. 12, 1628 (2021).
-
Stephenson, E. et al. Single-cell multi-omics analysis of the immune response in COVID-19. Nat. Med. 27, 904–916 (2021).
-
Li, H. et al. Single-cell pathogen diagnostics for combating antibiotic resistance. Nat. Rev. Methods Prim. 3, 6 (2023).
-
Freudiger, C. W. et al. Label-free biomedical imaging with high sensitivity by stimulated Raman scattering microscopy. Science 322, 1857–1861 (2008).
-
Moffitt, J. R. et al. High-throughput single-cell gene-expression profiling with multiplexed error-robust fluorescence in situ hybridization. Proc. Natl. Acad. Sci. 113, 11046–11051 (2016).
-
Rees, P., Summers, H. D., Filby, A., Carpenter, A. E. & Doan, M. Imaging flow cytometry. Nat. Rev. Methods Prim. 2, 86 (2022).
-
Wang, W. et al. Live-cell imaging and analysis reveal cell phenotypic transition dynamics inherently missing in snapshot data. Sci. Adv. 6, eaba9319 (2020).
-
Laissue, P. P., Alghamdi, R. A., Tomancak, P., Reynaud, E. G. & Shroff, H. Assessing phototoxicity in live fluorescence imaging. Nat. Methods 14, 657–661 (2017).
-
Mahapatra, S., Ma, S., Dong, B. & Zhang, C. Quantification of cellular phototoxicity of organelle stains by the dynamics of microtubule polymerization. View 5, 20240013 (2024).
-
Chen, C. et al. Multiplexed live-cell profiling with Raman probes. Nat. Commun. 12, 3405 (2021).
-
Kamp, M. et al. Raman micro-spectroscopy reveals the spatial distribution of fumarate in cells and tissues. Nat. Commun. 15, 5386 (2024).
-
Klein, K. et al. Label-free live-cell imaging with confocal Raman microscopy. Biophys. J. 102, 360–368 (2012).
-
Zong, C. et al. Surface-enhanced Raman spectroscopy for bioanalysis: reliability and challenges. Chem. Rev. 118, 4946–4980 (2018).
-
Ding, S.-Y. et al. Nanostructure-based plasmon-enhanced Raman spectroscopy for surface analysis of materials. Nat. Rev. Mater. 1, 16021 (2016).
-
Leong, S. X. et al. Noninvasive and point-of-care surface-enhanced Raman scattering (SERS)-based breathalyzer for mass screening of coronavirus disease 2019 (COVID-19) under 5 min. ACS Nano 16, 2629–2639 (2022).
-
Han, Z. et al. Integrated microfluidic-SERS for exosome biomarker profiling and osteosarcoma diagnosis. Biosens. Bioelectron. 217, 114709 (2022).
-
Wang, H. et al. New label-free serum exosomes detection method based on hierarchical SERS substrate for diagnosis of pancreatic cancer using AI. Sens. Actuators B Chem. 433, 137588 (2025).
-
Chen, J. et al. Ratiometric SERS biosensor for sensitive and reproducible detection of microRNA based on mismatched catalytic hairpin assembly. Biosens. Bioelectron. 143, 111619 (2019).
-
Michałowska, A. & Kudelski, A. Applications of surface enhanced Raman scattering (SERS) spectroscopy for detection of nucleic acids. Nanophotonics 13, 4577–4603 (2024).
-
Nam, W., Kim, W., Zhou, W. & You, E.-A. A digital SERS sensing platform using 3D nanolaminate plasmonic crystals coupled with Au nanoparticles for accurate quantitative detection of dopamine. Nanoscale 13, 17340–17349 (2021).
-
Nam, W. et al. Refractive-index-insensitive nanolaminated SERS substrates for label-free Raman profiling and classification of living cancer cells. Nano Lett. 19, 7273–7281 (2019).
-
Xie, Y., Wen, Y., Su, X., Zheng, C. & Li, M. Label-free plasmon-enhanced spectroscopic HER2 detection for dynamic therapeutic surveillance of breast cancer. Anal. Chem. 94, 12762–12771 (2022).
-
Wen, S. et al. Plasmonic Au nanostar Raman probes coupling with highly ordered TiO2/Au nanotube arrays as the reliable SERS sensing platform for chronic myeloid leukemia drug evaluation. Biosens. Bioelectron. 117, 260–266 (2018).
-
Lu, Y. et al. In situ spatial profiling of Cytochrome c release at the single-cell level under photothermal stress utilizing a 3D bifunctional SERS substrate. Biosens. Bioelectron. 288, 117818 (2025).
-
Nam, W. et al. Nanolaminate plasmonic substrates for high-throughput living cell SERS measurements and artificial neural network classification of cellular drug responses. ACS Appl. Nano Mater. 5, 10358–10368 (2022).
-
Nam, W. et al. Plasmonically calibrated label-free surface-enhanced Raman spectroscopy for improved multivariate analysis of living cells in cancer subtyping and drug testing. Anal. Chem. 93, 4601–4610 (2021).
-
Yu, H., Ren, X. & Nam, W. Living breast cancer subtype classification by membrane-interfacing 3D surface-enhanced Raman spectroscopy substrates with multivariate analysis. Spectrochim. Acta, Part A. 347, 127054 (2025).
-
Sun, D. et al. Label-free detection of multiplexed metabolites at single-cell level via a SERS-microfluidic droplet platform. Anal. Chem. 91, 15484–15490 (2019).
-
Cong, L. et al. Microfluidic droplet-SERS platform for single-cell cytokine analysis via a cell surface bioconjugation strategy. Anal. Chem. 94, 10375–10383 (2022).
-
Cho, J. E. & Lim, D.-K. Surface-enhanced Raman scattering for HSP 70A mRNA detection in live cells using silica nanoparticles and DNA-modified gold nanoparticles. J. Mater. Chem. B 13, 562–567 (2025).
-
Xu, M., Ma, X., Wei, T., Lu, Z.-X. & Ren, B. In situ imaging of live-cell extracellular pH during cell apoptosis with surface-enhanced Raman spectroscopy. Anal. Chem. 90, 13922–13928 (2018).
-
Choi, J.-H. et al. In situ detection of neurotransmitters from stem cell-derived neural interface at the single-cell level via graphene-hybrid SERS nanobiosensing. Nano Lett. 20, 7670–7679 (2020).
-
Zhang, Z. et al. Self-Referenced Au Nanoparticles-Coated Glass Wafers for In Situ SERS Monitoring of Cell Secretion. ACS Sens. 9, 4154–4165 (2024).
-
Kim, S. J., Jeong, J. H., Ryu, G., Eom, Y. S. & Kim, S. Engineered vertically-aligned carbon nanotube microarray for self-concentrated SERS detection. Sens. Actuators B Chem. 399, 134861 (2024).
-
Yao, C. et al. High-performance SERS substrate based on gold nanoparticles-decorated micro/nano-hybrid hierarchical structure. Mater. Today Nano 28, 100525 (2024).
-
Zhang, J., Wu, J., Wang, B., Geng, Y. & Wang, Z. A new strategy for constructing 3D hybrid graphene/Au/rectangular pyramids PMMA on a flexible SERS substrate for trace molecule detection. Sens. Actuators B Chem. 410, 135711 (2024).
-
Yun, J., Yu, H. & Nam, W. Plasmonic Nanolamination for High-Performance SERS Substrates Based on Vertically Stacked 3D Multiple Nanogaps. ACS Appl. Nano Mater. 8, 5028–5036 (2025).
-
Lou, H.-Y. et al. Membrane curvature underlies actin reorganization in response to nanoscale surface topography. Proc. Natl. Acad. Sci. 116, 23143–23151 (2019).
-
Henzie, J., Lee, M. H. & Odom, T. W. Multiscale patterning of plasmonic metamaterials. Nat. Nanotechnol. 2, 549–554 (2007).
-
Song, J., Nam, W. & Zhou, W. Scalable high-performance nanolaminated SERS substrates based on multistack vertically oriented plasmonic nanogaps. Adv. Mater. Technol. 4, 1800689 (2019).
-
Joo, T. H., Kim, M. S. & Kim, K. Surface-enhanced Raman scattering of benzenethiol in silver sol. J. Raman Spectrosc. 18, 57–60 (1987).
-
Gul, B., Ashraf, S., Khan, S., Nisar, H. & Ahmad, I. Cell refractive index: Models, insights, applications and future perspectives. Photodiagn. Photodyn. Ther. 33, 102096 (2021).
-
Mohsin, A. S. & Salim, M. B. Probing the intracellular refractive index and molecular interaction of gold nanoparticles in HeLa cells using single particle spectroscopy. Int. J. Nanomed. 13, 6019–6028 (2018).
-
Nam, W. et al. Au/SiO2-Nanolaminated plasmonic nanoantennas as refractive-index-insensitive and transparent surface-enhanced raman spectroscopy substrates. ACS Appl. Nano Mater. 4, 3175–3184 (2021).
-
Le Ru, E. C., Blackie, E., Meyer, M. & Etchegoin, P. G. Surface enhanced Raman scattering enhancement factors: a comprehensive study. J. Phys. Chem. C. 111, 13794–13803 (2007).
-
Pezzotti, G. Raman spectroscopy in cell biology and microbiology. J. Raman Spectrosc. 52, 2348–2443 (2021).
-
Movasaghi, Z., Rehman, S. & Rehman, I. U. Raman spectroscopy of biological tissues. Appl. Spectrosc. Rev. 42, 493–541 (2007).
-
Altschuler, S. J. & Wu, L. F. Cellular heterogeneity: do differences make a difference? Cell 141, 559–563 (2010).
-
Niu, B. et al. Application of glutathione depletion in cancer therapy: Enhanced ROS-based therapy, ferroptosis, and chemotherapy. Biomaterials 277, 121110 (2021).
-
van Manen, H.-J., Kraan, Y. M., Roos, D. & Otto, C. Single-cell Raman and fluorescence microscopy reveal the association of lipid bodies with phagosomes in leukocytes. Proc. Natl. Acad. Sci. 102, 10159–10164 (2005).
-
Mollinedo, F. & Gajate, C. Lipid rafts as signaling hubs in cancer cell survival/death and invasion: implications in tumor progression and therapy: thematic review series: biology of lipid rafts. J. Lipid Res. 61, 611–635 (2020).
-
Sezgin, E., Levental, I., Mayor, S. & Eggeling, C. The mystery of membrane organization: composition, regulation and roles of lipid rafts. Nat. Rev. Mol. Cell Biol. 18, 361–374 (2017).
Acknowledgements
This work was supported by the Busan Regional Innovation Systems & Education (RISE) Project 202512350001, supported by the Ministry of Education and Busan Metropolitan City, and by the Basic Science Research Program through the National Research Foundation of Korea (NRF), funded by the Ministry of Education (RS-2025-25416999).
Ethics declarations
Competing interests
The authors declare no competing interests.
Additional information
Publisher’s note Springer Nature remains neutral with regard to jurisdictional claims in published maps and institutional affiliations.
Supplementary information
Rights and permissions
Open Access This article is licensed under a Creative Commons Attribution-NonCommercial-NoDerivatives 4.0 International License, which permits any non-commercial use, sharing, distribution and reproduction in any medium or format, as long as you give appropriate credit to the original author(s) and the source, provide a link to the Creative Commons licence, and indicate if you modified the licensed material. You do not have permission under this licence to share adapted material derived from this article or parts of it. The images or other third party material in this article are included in the article’s Creative Commons licence, unless indicated otherwise in a credit line to the material. If material is not included in the article’s Creative Commons licence and your intended use is not permitted by statutory regulation or exceeds the permitted use, you will need to obtain permission directly from the copyright holder. To view a copy of this licence, visit http://creativecommons.org/licenses/by-nc-nd/4.0/.
About this article

Cite this article
Yu, H., Yun, J. & Nam, W. Spatial molecular profiling of living single-cell by membrane-interfaced 3D SERS substrates. npj Biosensing 3, 9 (2026). https://doi.org/10.1038/s44328-025-00076-5
-
Received:
-
Accepted:
-
Published:
-
Version of record:
-
DOI: https://doi.org/10.1038/s44328-025-00076-5