Data availability
Raw MS data files generated in this study can be accessed at the National Omics Data Encyclopedia with the accession code OEP00005636 (ref. 57). Supplementary Data files are available via Zenodo at https://doi.org/10.5281/zenodo.15189109 (ref. 58). A Supplementary Video is available via Zenodo at https://doi.org/10.5281/zenodo.15119433 (ref. 33). Single-cell transcriptomic data are from a previous publication59 and are available in the GEO under accession code GSE171904. Source data are provided with this paper.
Code availability
The source code of MetCell is available on GitHub (https://github.com/ZhuMetLab/MetCell) and via Zenodo at https://doi.org/10.5281/zenodo.17479598 (ref. 60) under a CC BY-NC-ND 4.0 license.
References
-
Papalexi, E. & Satija, R. Single-cell RNA sequencing to explore immune cell heterogeneity. Nat. Rev. Immunol. 18, 35–45 (2018).
-
Elmentaite, R., Dominguez Conde, C., Yang, L. & Teichmann, S. A. Single-cell atlases: shared and tissue-specific cell types across human organs. Nat. Rev. Genet. 23, 395–410 (2022).
-
Slavov, N. Unpicking the proteome in single cells. Science 367, 512–513 (2020).
-
Mund, A. et al. Deep visual proteomics defines single-cell identity and heterogeneity. Nat. Biotechnol. 40, 1231–1240 (2022).
-
Zenobi, R. et al. Single-cell metabolomics: analytical and biological perspectives. Science 342, 1243259 (2013).
-
Zhu, H. et al. Moderate UV exposure enhances learning and memory by promoting a novel glutamate biosynthetic pathway in the brain. Cell 173, 1716–1727 (2018).
-
Capolupo, L. et al. Sphingolipids control dermal fibroblast heterogeneity. Science 376, eabh1623 (2022).
-
Zheng, X. et al. Tumors evade immune cytotoxicity by altering the surface topology of NK cells. Nat. Immunol. 24, 802–813 (2023).
-
Neumann, E. K., Comi, T. J., Rubakhin, S. S. & Sweedler, J. V. Lipid heterogeneity between astrocytes and neurons revealed by single-cell MALDI-MS combined with immunocytochemical classification. Angew. Chem. Int. Ed. Engl. 58, 5910–5914 (2019).
-
Rappez, L. et al. SpaceM reveals metabolic states of single cells. Nat. Methods 18, 799–805 (2021).
-
Wang, G. et al. Analyzing cell-type-specific dynamics of metabolism in kidney repair. Nat. Metab. 4, 1109–1118 (2022).
-
Zhang, H. et al. Single-cell lipidomics enabled by dual-polarity ionization and ion mobility-mass spectrometry imaging. Nat. Commun. 14, 5185 (2023).
-
Nunes, J. B. et al. Integration of mass cytometry and mass spectrometry imaging for spatially resolved single-cell metabolic profiling. Nat. Methods 21, 1796–1800 (2024).
-
Tsuyama, N., Mizuno, H., Tokunaga, E. & Masujima, T. Live single-cell molecular analysis by video-mass spectrometry. Anal. Sci. 24, 559–561 (2008).
-
Onjiko, R. M., Moody, S. A. & Nemes, P. Single-cell mass spectrometry reveals small molecules that affect cell fates in the 16-cell embryo. Proc. Natl Acad. Sci. USA 112, 6545–6550 (2015).
-
Zhu, H. et al. Single-neuron identification of chemical constituents, physiological changes, and metabolism using mass spectrometry. Proc. Natl Acad. Sci. USA 114, 2586–2591 (2017).
-
Liu, R., Pan, N., Zhu, Y. & Yang, Z. T-Probe: an integrated microscale device for online in situ single cell analysis and metabolic profiling using mass spectrometry. Anal. Chem. 90, 11078–11085 (2018).
-
Zhang, X.-C. et al. Combination of droplet extraction and pico-ESI-MS allows the identification of metabolites from single cancer cells. Anal. Chem. 90, 9897–9903 (2018).
-
Zhang, L. & Vertes, A. Single-cell mass spectrometry approaches to explore cellular heterogeneity. Angew. Chem. Int. Ed. Engl. 57, 4466–4477 (2018).
-
Ali, A. et al. Single cell metabolism: current and future trends. Metabolomics 18, 77 (2022).
-
Lanekoff, I., Sharma, V. V. & Marques, C. Single-cell metabolomics: where are we and where are we going?. Curr. Opin. Biotechnol. 75, 102693 (2022).
-
Zhang, C., Le Devedec, S. E., Ali, A. & Hankemeier, T. Single-cell metabolomics by mass spectrometry: ready for primetime?. Curr. Opin. Biotechnol. 82, 102963 (2023).
-
Spitzer, M. H. & Nolan, G. P. Mass cytometry: single cells, many features. Cell 165, 780–791 (2016).
-
Fung, E. N. & Yeung, E. S. Direct analysis of single rat peritoneal mast cells with laser vaporization/ionization mass spectrometry. Anal. Chem. 70, 3206–3212 (1998).
-
Yao, H. et al. Label-free mass cytometry for unveiling cellular metabolic heterogeneity. Anal. Chem. 91, 9777–9783 (2019).
-
Zhang, L. et al. Single cell metabolite detection using inertial microfluidics-assisted ion mobility mass spectrometry. Anal. Chem. 93, 10462–10468 (2021).
-
Shao, Y. et al. Intact living-cell electrolaunching ionization mass spectrometry for single-cell metabolomics. Chem. Sci. 13, 8065–8073 (2022).
-
Qin, S. et al. In-depth organic mass cytometry reveals differential contents of 3-hydroxybutanoic acid at the single-cell level. Nat. Commun. 15, 4387 (2024).
-
Yugi, K. et al. Reconstruction of insulin signal flow from phosphoproteome and metabolome data. Cell Rep. 8, 1171–1183 (2014).
-
May, J. C. & McLean, J. A. Ion mobility-mass spectrometry: time-dispersive instrumentation. Anal. Chem. 87, 1422–1436 (2015).
-
Dodds, J. N. & Baker, E. S. Ion mobility spectrometry: fundamental concepts, instrumentation, applications, and the road ahead. J. Am. Soc. Mass. Spectrom. 30, 2185–2195 (2019).
-
Jeanne Dit Fouque, K. & Fernandez-Lima, F. Recent advances in biological separations using trapped ion mobility spectrometry – mass spectrometry. TrAC Trends Anal. Chem. 116, 308–315 (2019).
-
Luo, M. et al. Deep-coverage single-cell metabolomics enabled by ion mobility-resolved mass cytometry. Zenodo https://doi.org/10.5281/zenodo.15119433 (2025).
-
Liu, Z. et al. Trace, machine learning of signal images for trace-sensitive mass spectrometry: a case study from single-cell metabolomics. Anal. Chem. 91, 5768–5776 (2019).
-
Xie, Y. R., Castro, D. C., Bell, S. E., Rubakhin, S. S. & Sweedler, J. V. Single-cell classification using mass spectrometry through interpretable machine learning. Anal. Chem. 92, 9338–9347 (2020).
-
Hu, T. et al. Single-cell spatial metabolomics with cell-type specific protein profiling for tissue systems biology. Nat. Commun. 14, 8260 (2023).
-
Pan, X. et al. SCMeTA: a pipeline for single-cell metabolic analysis data processing. Bioinformatics 40, btae545 (2024).
-
Smith, C. A., Want, E. J., O’Maille, G., Abagyan, R. & Siuzdak, G. XCMS: processing mass spectrometry data for metabolite profiling using nonlinear peak alignment, matching, and identification. Anal. Chem. 78, 779–787 (2006).
-
Tautenhahn, R., Böttcher, C. & Neumann, S. Highly sensitive feature detection for high resolution LC/MS. BMC Bioinformatics 9, 504 (2008).
-
Sumner, L. W. et al. Proposed minimum reporting standards for chemical analysis Chemical Analysis Working Group (CAWG) Metabolomics Standards Initiative (MSI). Metabolomics 3, 211–221 (2007).
-
Zou, Y. et al. Illuminating NAD+ metabolism in live cells and in vivo using a genetically encoded fluorescent sensor. Dev. Cell 53, 240–252 (2020).
-
Gascon-Barré, M. et al. The normal liver harbors the vitamin D nuclear receptor in nonparenchymal and biliary epithelial cells. Hepatology 37, 1034–1042 (2003).
-
Warren, A. et al. The effects of old age on hepatic stellate cells. Curr. Gerontol. Geriatr. Res. 2011, 439835 (2011).
-
Nikopoulou, C. et al. Spatial and single-cell profiling of the metabolome, transcriptome and epigenome of the aging mouse liver. Nat. Aging 3, 1430–1445 (2023).
-
Shen, X. et al. Nonlinear dynamics of multi-omics profiles during human aging. Nat. Aging 4, 1619–1634 (2024).
-
Ding, Y. et al. Comprehensive human proteome profiles across a 50-year lifespan reveal aging trajectories and signatures. Cell 188, 5763–5784 (2025).
-
Bergman, H.-M. & Lanekoff, I. Profiling and quantifying endogenous molecules in single cells using nano-DESI MS. Analyst 142, 3639–3647 (2017).
-
Chen, Y. et al. Ultrafast microelectrophoresis: behind direct mass spectrometry measurements of proteins and metabolites in living cell/cells. Anal. Chem. 91, 10441–10447 (2019).
-
Chen, T. et al. Frequency modulation-boosted electrolaunching ionization mass spectrometry enables mass-selective single-cell metabolomics. Anal. Chem. 97, 17224–17230 (2025).
-
Bien, T., Koerfer, K., Schwenzfeier, J., Dreisewerd, K. & Soltwisch, J. Mass spectrometry imaging to explore molecular heterogeneity in cell culture. Proc. Natl Acad. Sci. USA 119, e2114365119 (2022).
-
McKinnon, J. C. et al. MALDI-2-enabled oversampling for the mass spectrometry imaging of metabolites at single-cell resolution. J. Am. Soc. Mass. Spectrom. 35, 2729–2742 (2024).
-
Giné, R. et al. HERMES: a molecular-formula-oriented method to target the metabolome. Nat. Methods 18, 1370–1376 (2021).
-
Stancliffe, E., Schwaiger-Haber, M., Sindelar, M. & Patti, G. J. DecoID improves identification rates in metabolomics through database-assisted MS/MS deconvolution. Nat. Methods 18, 779–787 (2021).
-
Kong, F. et al. Denoising Search doubles the number of metabolite and exposome annotations in human plasma using an Orbitrap Astral mass spectrometer. Nat. Methods 22, 1008–1016 (2025).
-
Giles, K. et al. A cyclic ion mobility-mass spectrometry system. Anal. Chem. 91, 8564–8573 (2019).
-
Slyper, M. et al. A single-cell and single-nucleus RNA-seq toolbox for fresh and frozen human tumors. Nat. Med. 26, 792–802 (2020).
-
Luo, M. et al. Deep-coverage single-cell metabolomics enabled by ion mobility-resolved mass cytometry. National Omics Data Encyclopedia https://www.biosino.org/node/project/detail/OEP00005636 (2025).
-
Luo, M. et al. Deep-coverage single-cell metabolomics enabled by ion mobility-resolved mass cytometry. Zenodo https://doi.org/10.5281/zenodo.15189109 (2025).
-
Yang, W. et al. Single-cell transcriptomic analysis reveals a hepatic stellate cell–activation roadmap and myofibroblast origin during liver fibrosis in mice. Hepatology 74, 2774–2790 (2021).
-
Luo, M. et al. ZhuMetLab/MetCell: 1.0.22. Zenodo https://doi.org/10.5281/zenodo.17479598 (2025).
Acknowledgements
The work was supported by the National Natural Science Foundation of China (22425404 and 92357308), Strategic Priority Research Program of the Chinese Academy of Sciences (XDB39050700), National Key R&D Program of China (2022YFC3400702), Shanghai Key Laboratory of Aging Studies (19DZ2260400), Shanghai Municipal Science and Technology Major Project and Shanghai Basic Research Pioneer Project. Z.-J.Z is a SANS Exploration Scholar. We thank G. Fan (ShanghaiTech University, China) for providing the mCherry-FiNAD-293T cell line.
Ethics declarations
Competing interests
The authors declare no competing interests.
Peer review
Peer review information
Nature Methods thanks Renmeng Liu, Oscar Yanes and the other, anonymous, reviewer(s) for their contribution to the peer review of this work. Primary Handling Editor: Arunima Singh, in collaboration with the Nature Methods team.
Additional information
Publisher’s note Springer Nature remains neutral with regard to jurisdictional claims in published maps and institutional affiliations.
Extended data
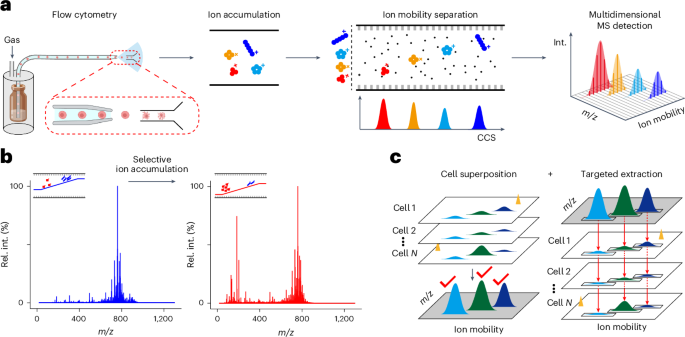
Extended Data Fig. 1 Single-cell metabolomics analysis with IM-resolved mass cytometry.
(a) Photographs of single-cell ordering in a silica capillary (left and middle panels) and the emitter of the silica capillary (right panel) in IM-resolved mass cytometry. The red arrows point to a single cell. The middle panel shows the merged image of bright-field, DIO-staining, and Hoechst-staining photographs. (b) The throughput of IM-resolved mass cytometry-based single-cell metabolomic analysis was tested with HEK293T cells, Jurkat cells, and mouse liver sinusoidal endothelial cells. Each pulsed signal from the ion chromatogram represented a single cell. (c) Data structure of IM-resolved mass cytometry: raw data consists of a continuous set of IM–MS frames (50 ms each). Within each IM–MS frame, the IM dimension is divided into 489 MS scans, each corresponding to a mass spectrum and a fixed ion mobility value and interval.
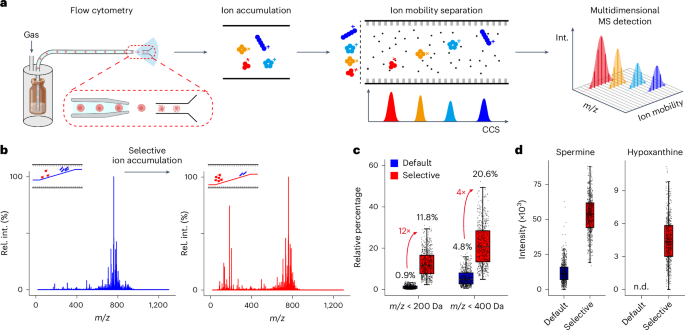
Extended Data Fig. 2 Selective ion accumulation enhanced sensitives of low-mass metabolites.
(a) Selective ion accumulation on trapped ion mobility spectrometry. Accumulation time of IM trapping was shortened from 100 ms to 50 ms to minimize the space charge effect. IM ramping voltages were adjusted to favor ion accumulation in the low mass ranges. (b) Relative percentages of ions in different mass ranges compared to the total ions. (c, d) Peak number and distribution in the averaged MS1 spectrum from 600 HepG2 cells analyzed with default ion accumulation (c) and selective ion accumulation (d), respectively. (e) Sensitivity improvement for alanine, carnitine, adenine and guanine after selective ion accumulation (N = 600 cells each). n.d., not detected. Box plots show the distribution of data as follows: the center line represents the median, the box edges indicate the first and third quartiles, and the whiskers extend to the minimum and maximum values within 1.5×IQR.
Extended Data Fig. 3 Schematic illustration of cell superposition.
Cell superposition, peak detection and targeted extracted were implemented within the same batch of data. Single-cell frames from multiple cells were combined into one cell superposition frame to enhance the SNR and robustness for peak detection. By default, the first 600 cells in the dataset are selected to construct the cell superposition frame. First, single-cell frames were aligned according to their MS scan index (spectral alignment). Second, MS spectra with the same scan index were aggregated (spectral aggregate). Third, the aggregated MS spectrum was arranged according to the scan index and combined into cell superposition frame (spectral combination). After peak detection in the cell superposition frame, peak quantifications of metabolites in each cell within the dataset were achieved through targeted extraction of specific metabolite ions from all cells one by one.
Extended Data Fig. 4 Metabolite examples for demonstrating improved SNR and robustness by cell superposition-based amplification.
(a) Improved SNRs for metabolites after cell superposition: propionylcarnitine, NAD+, glutathione and hypoxanthine. In SNR-cell number plot, grey dots represent the SNRs after superposing different cell numbers, and the red lines represent the fitted relationships between SNR and the number of cells. (b) Extracted ion mobilograms (EIMs) of two noise ions (m/z 301 and m/z 321) from one cell before cell superposition and from 600 cells after superposition. (c) Reduction in dropout rates for adenine and adenosine through application of our method (left panel). The biaxial plots showed the intensity distributions of paired metabolites-adenine and adenosine-obtained through the conventional method and our method (middle and right panels; N = 600 cells).
Extended Data Fig. 5 Schematic illustration of the MetCell workflow.
A computational tool, namely, MetCell, was developed for processing IM-resolved single-cell metabolomics data, which includes single-cell frame detection, cell superposition, peak detection, peak quantification, and metabolite annotation (see Methods for details). 1. Single-cell frame detection module detects and extracts the IM–MS frames specific to single cells (that is single-cell frames) according to the pulse EIC peaks of the marker ion (for example PC(34:1), [M + H]+; m/z = 760.5851 ± 0.0152 Da; mobility = 1.40 ± 0.05 V·s/cm2). 2. Cell superposition modules combines 600 (by default) single-cell frames into a cell superposition frame to increase the SNR and robustness of peak detection. 3. Peak detection in the cell superposition frame was achieved by identifying local maxima in each extracted ion mobilogram (EIM), which including 3 steps: selecting target ion, assembling ion mobilogram and detecting peak. The stars represent targeted ions for assembling ion mobilograms. Color dots represent adjacent and continuous MS1 data points of targeted ions. 4. In peak quantification module, MetCell extracts and integrates MS1 ions in each individual single-cell frame for quantification. 5. In metabolite annotation module, MetCell acquires MS2 spectral for metabolite candidates and annotates metabolites through the multidimensional match. 6. MS2 spectra of putative metabolite candidates were acquired in situ from single cells using parallel reaction monitoring (PRM)-PASEF. All MS2 spectra acquired for a given metabolite were aggregated into a single consensus spectrum. Illustrations in 6 created with BioRender.com.
Extended Data Fig. 6 Multidimensional annotation and validation of metabolites in single-cell metabolomics.
The annotation of each metabolite at confidence level 1 was validated by matching with chemical standards. CCS, collision cross-section; DP, dot product; Rel. int., relative intensity.
Extended Data Fig. 7 Multidimensional metabolite annotations in common cell lines.
(a) Distributions of detection peaks in the cell superposition frames for HEK293T, Jurkat, HeLa and MEF cells. Blue dots indicated putatively annotated metabolites by matching MS1 and CCS values. The barplots showed the numbers of putatively annotated metabolites, acquired MS2 spectra and identified metabolites. (b) Overlap of annotations across different cell types. (c) Statistics on the number of metabolites shared across different cell types. (d) UMAP visualization of single-cell metabolomic profiling of different cell lines. The color represented the injection order.
Extended Data Fig. 8 Quantification sensitivity of metabolites in single-cell metabolomics.
(a) The standard calibration curve for absolute quantification of adenine in HEK293T cells using LC–MS. (b) The limit of detection (LOD) for IM-resolved mass cytometry was estimated through linear regression between intensities and signal-to-noise ratios (SNRs) in single cells. The intensity of adenine at an SNR of 3—the accepted detection threshold—was converted to its corresponding attomole amount, which was defined as the limit of detection (LOD). (c) Absolute quantification of nicotinamide in HEK293T cells by LC–MS. (d) Estimation of LOD for nicotinamide on IM-resolved mass cytometry. (e) Absolute quantification of arginine in HEK293T cells by LC–MS (left panel, N = 6 replicates); determination of intracellular ranges of arginine in single cells using mass cytometry (middle panel, N = 1675 single cells); estimation of LOD of arginine on IM-resolved mass cytometry (right panel). (f) Absolute quantification of alanine in HEK293T cells by LC–MS (left panel, N = 6 replicates); determination of intracellular ranges of alanine in single cells using mass cytometry (middle panel, N = 1675 single cells); estimation of LOD of alanine on IM-resolved mass cytometry (right panel). In (b), (d), the right panel of (e) and (f), each grey dot represents a single cell. Box plots show the distribution of data as follows: the center line represents the median, the box edges indicate the first and third quartiles, and the whiskers extend to the minimum and maximum values within 1.5×IQR.
Extended Data Fig. 9 Data analysis and integration of single-cell metabolomics data of mouse livers.
(a) Distribution of 5659 detected peak (left panel) and 1576 metabolite candidates (middle panel) in the cell superposition frame of mixed liver cells. 1572 out of 1576 metabolite candidates were acquired with MS2 spectra, resulting 809 annotations in 4 confidence levels (right panel). (b) UMAP visualization of mixed liver cells before and after data integration and colored by mouse age groups. (c) The heatmap showed the average intensities of metabolic peaks from each cell type. The intensity was z-scored normalized across cell types. (d) t-SNE visualization of HSCs colored by mouse age groups. (e) Numbers of retinol-high and retinol-low HSCs from each mouse liver. (f, g) Abundance variations of PC(38:6), PE(38:6), PC(36:5) (f), PC(32:0) and PC(32:1) (g) between two HSC clusters. Among these, the retinol-high and retinol-low clusters included 864 and 2,034 individual HSCs, respectively. FC, fold change; n.s., not significant; two-sided Wilcoxon test. Box plots show the distribution of data as follows: the center line represents the median, the box edges indicate the first and third quartiles, and the whiskers extend to the minimum and maximum values within 1.5×IQR.
Extended Data Fig. 10 Multidimensional annotation and validation of metabolites from single-cell metabolomics of mouse livers.
The annotation of each metabolite at confidence level 1 was validated by matching with chemical standards. CCS, collision cross-section; DP, dot product; Rel. int., relative intensity.
Supplementary information
Source data
Rights and permissions
Springer Nature or its licensor (e.g. a society or other partner) holds exclusive rights to this article under a publishing agreement with the author(s) or other rightsholder(s); author self-archiving of the accepted manuscript version of this article is solely governed by the terms of such publishing agreement and applicable law.
About this article

Cite this article
Luo, M., Kou, T., Yin, Y. et al. Deep-coverage single-cell metabolomics enabled by ion mobility-resolved mass cytometry. Nat Methods (2026). https://doi.org/10.1038/s41592-025-02970-2
-
Received:
-
Accepted:
-
Published:
-
Version of record:
-
DOI: https://doi.org/10.1038/s41592-025-02970-2