
Main
The application of large-scale genome-wide association studies has identified thousands of complex trait loci, including many involved in autoimmune, metabolic and infectious diseases1. Computational strategies are sometimes effective at either fine-mapping statistical association signals to individual variants or prioritizing potentially functional variants4,5. These methods have been instrumental in investigating complex disease loci but fall short of accurately assigning function to non-coding variants, which account for most complex disease alleles. Accurate functionalization requires genomic editing to introduce the allele in primary cells and assess the downstream effects.
Base-pair-resolution CRISPR–Cas technologies are producing a rapidly growing toolbox to induce precise genetic modifications6. Large-scale single-cell CRISPR screening approaches in cell lines enable the identification of key regulatory elements and their genes7. Extensions of these methods have been applied to primary human haematopoietic stem cells with base-pair resolution to directly confirm variant–function links8. However, depending on the targeted site and CRISPR–Cas machinery, editing efficiency can be low, which limits the power to detect functional effects. Furthermore, experimental conditions can induce nonspecific effects in a pool of cells in which editing is being attempted; these nonspecific effects may obscure the key molecular effects driven by the edit. CRISPR screens might be more powerful if single-cell data could be obtained that effectively discriminate between edited and non-edited cells in the same pool.
Current methods assume high editing efficiency and achieve single-cell resolution by sequencing single guide RNA (sgRNA) as a proxy for genomic editing. Even with successful transduction and integration of sgRNA and CRISPR machinery, 50% of guides may be inactive2. An analysis of multiple base editors in screening format discovered a wide range of successful editing outcomes (3–58%)3, indicating that genotyping individual cells may be essential to precisely model the editing outcomes. Furthermore, these techniques cannot identify bystander and heterozygote editing, thereby reducing their power. They also rely on viral transduction, which may confound cell-state-specific effects and is challenging in primary cells9. An alternative strategy is to edit variants by using non-viral methods, such as electroporation or nanoparticle-mediated delivery of editor ribonucleoproteins or mRNA, but at the potential cost of lower efficiency10 and without the benefit of single-cell resolution.
Computational methods have been developed such as BEAN11 and Mixscape12, which resolve heterogeneous CRISPR editing. However, these methods were designed to model large effects caused by complete gene ablation and therefore may not be suitable to detect the subtle effects in a limited number of genes caused by non-coding complex disease variation.
To address these challenges, we propose that defining the functional effects of CRISPR editing requires genomic DNA information at the single-cell level in parallel with multimodal functional read-outs. Doing this at scale is difficult, because isolation of genomic DNA alongside mRNA is hindered by incompatible chemistries and reaction conditions. Previous iterations of DNA and RNA single-cell approaches have relied on low throughput and costly physical separation or targeted amplification methods13,14. Some studies have increased throughput of whole-genome and transcriptome sequencing techniques using transposase treatment of histone-depleted nuclei15,16. However, whole-genome sequencing approaches cannot reliably recover information about specifically targeted loci. Alternatively, CRISPR-induced mutations in coding regions can be identified using methods such as GoT17,18 and GoT–ChA18, which use 10x chemistry to capture regions of interest in the transcriptome or open chromatin. So far, these methods have not been applied to non-coding regions and do not jointly profile genomic DNA and gene expression.
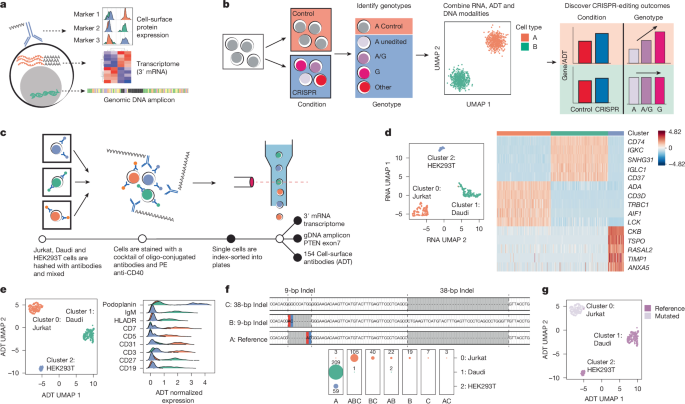
We have developed a plate-based method for the multi-omic investigation of nucleotide editing and call it CRISPR by ADT, flow cytometry and transcriptome sequencing (CRAFTseq; ADTs are antibody-derived tags) (Fig. 1a). In each cell, it assesses CRISPR editing by targeted genome sequencing and downstream functional effects in mRNA and cell-surface proteins (Fig. 1b). It does not require any specialized equipment and can be easily implemented in any genomic editing approach. Using CRAFTseq, we demonstrate high-quality, multimodal data in a mixture of cell lines and identify gene knockout effects with CRISPR ribonuclear proteins (RNPs) and base editing in HLA-DQB1 and FBXO11, respectively. In primary human naive CD4+ T cells, we use CRAFTseq to identify PTPRC knockout with base editors and discover a compensatory upregulation of CD4 protein expression. To detect causal non-coding variants, we use CRISPR to edit a B cell-specific expression quantitative trait locus (eQTL; rs2954658) in Daudi cells and a cell-state-dependent genome-wide association studies variant (rs61839660) in polarized human CD4+ T cells. Finally, we show that CRAFTseq can detect multiplexed editing outcomes in the DNA-binding domain of PAX5, and we report synergistic effects on gene expression in two independent regions. Alongside the experimental protocol, we demonstrate the power of single-cell statistical models to define the functional effects of individual non-coding alleles.

a, CRAFTseq captures targeted genomic DNA amplicons, 3′ mRNA and cell-surface protein expression by ADT. b, Deconvolution of CRISPR editing is used to identify genotypes and outcomes in mRNA and ADT expression. UMAP, uniform manifold approximation and projection. c, Schematic overview of the experimental design with a mixture of cell lines. d, UMAP representation of the top 3,000 variable genes after principal component analysis (PCA), harmonization by plate and clustering with shared nearest neighbour (SNN). A heatmap of differential gene expression between clusters is shown. Scaled and log(CP10K + 1)-normalized values are plotted. Colours represent PC-defined clusters (green, Daudi; red, Jurkat; blue, HEK293T). e, UMAP representation of 154 ADTs following PCA, harmonization by plate and clustering with SNN. Histograms of centred log ratio (CLR)-normalized ADT values per cluster are plotted. f, Identified PTEN alleles from single cells from an amplicon flanking exon 7 of PTEN. Two unique indels are present and marked. The number of cells recovered per genotype is shown faceted by ADT cluster. g, UMAP of ADT embeddings with overlaid genotype. Each point represents a single cell.
A robust multimodal single-cell approach
CRAFTseq is a quad-modal single-cell assay that sequences genomic DNA amplicons, whole transcriptome RNA and oligonucleotides tagging surface marker antibodies (ADTs) alongside flow cytometry-based cell hashing (Fig. 1a and Methods). It is efficient, being able to assay thousands of cells per week at a cost of approximately US$3 per cell. It uses a modified FLASH-seq full-length RNA-sequencing protocol to yield high-quality single-cell transcriptomes19. Key modifications include a nested PCR reaction to amplify genomic DNA regions, 3′ mRNA sequencing with barcoded oligoDTs and recovery of 154 cell-surface markers (Extended Data Fig. 1 and Supplementary Tables 1–8). Indexing flow cytometry is used to hash information on condition, cell type and individual, which allows for modelling of plate effects and other important cell-level covariates.
We applied CRAFTseq to a mixture of Jurkat, Daudi and HEK293T cells sorted into two 384-well plates (Fig. 1c and Extended Data Fig. 2). Previous reports have identified two insertion/deletion (indel) events in exon 7 of PTEN in Jurkat cells20. For this analysis, we amplified a genomic amplicon in PTEN alongside whole-transcriptome and protein expression data. Across both plates, an average of 58% of RNA reads aligned to the transcriptome. Of 768 cells, 606 passed stringent RNA quality control, and we recovered a mean of 5,089 (±71 s.e.m.) genes and 57,540 (±2,034 s.e.m.) unique molecular identifiers (UMIs) per cell, which is similar to data from the 10x Genomics platform (Methods and Extended Data Fig. 2). Clustering these 606 cells on the 3,000 most variable genes, we identified three populations with gene markers reflecting cell-line identity, for example IGKC (Daudi), CD3D (Jurkat) and CKB (HEK293T) (Fig. 1d and Supplementary Tables 9 and 10).
Of the ADT reads sequenced across both plates, 46% aligned to the ADT reference. Clustering the same 606 cells by ADT markers identified three populations with markers for B cells (Daudi, IgM+CD19+HLADR+), T cells (Jurkat, CD3+CD5+CD7+), and endothelial cells (HEK293T, podoplanin+) (Fig. 1e, Extended Data Fig. 2 and Supplementary Fig. 5). We also showed that CD40 ADT read counts correlate with flow cytometry-based antibody staining (R = 0.59) and gene expression (R = 0.36) (Extended Data Fig. 2). Overall, RNA, ADT and flow-cytometry modalities led to almost perfectly concordant cell-type calls (Extended Data Fig. 2).
We obtained high-quality targeted DNA data. We called PTEN genotypes in 605 of 768 cells with a median of 869 DNA reads per cell mapped to the amplified region (Methods and Extended Data Fig. 2). From our single-cell DNA data, we confidently called the two previously reported indels in PTEN: a 7-bp insertion and a 2-bp mutation; and a 38-bp insertion (Fig. 1f). As expected, we identified PTEN mutations in Jurkat but not in Daudi or HEK293T cells (Fig. 1f and Extended Data Fig. 2). We detected miscalled genotypes in Daudi (1.44%) but no miscalled genotypes in HEK293T cells, indicative of our platform’s high DNA calling accuracy (Fig. 1f,g). Surprisingly, our experiment revealed single-cell heterogeneity in Jurkat genotypes. To confirm this observation, we sequenced PTEN amplicons in bulk Jurkats. All three alleles were detected at frequencies similar to the those in the single-cell data (Extended Data Fig. 2).
We suspected that plate effects cause occasional miscalled genotypes. To confirm this, we mixed Jurkat and Daudi cells at varying ratios and performed CRAFTseq (Extended Data Fig. 2). We note that the frequency of incorrect genotype calls in Daudi cells is proportional to the number in Jurkat cells (Extended Data Fig. 2). Hence, we may be calling rare alleles with high specificity but lower sensitivity. In implementing this method, we recommend always including non-targeting controls in each plate to set appropriate filtering thresholds (Supplementary Notes).
Identifying genotype-dependent outcomes
In CRISPR-editing experiments, cells are cultured before analysis and secreted factors may alter the phenotype of neighbouring cells, regardless of editing outcome. As a single-cell strategy, CRAFTseq can identify changes that are linked specifically to genotype, and not the broader cell-culture environment, by accurately identifying edited cells (Fig. 1b). With this framework, we examined two distinct scenarios: editing a regulatory region upstream of HLA-DQB1 and disrupting FBXO11.
We previously identified that variant rs71542466 in HLA-DQB1 regulated gene expression21. Here, we targeted the region around this variant using CRISPR–Cas-mediated homology-directed repair (HDR) in two cell lines, with ribonucleoproteins and repair template (Fig. 2a). We stained cells with fluorophore-conjugated antibodies to tag non-targeted cells and measure HLA-DQ protein expression with indexing flow cytometry.

a, Experimental outline of HLA-DQB1 editing in HH and Daudi cells. CRISPR–Cas9 RNP and asymmetric HDR donor material was used to induce an rs71542466 (C to G) variant in the 5′-UTR of HLA-DQB1. ssODN, single-stranded oligodeoxynucleotide. b, Heatmap of editing around the sgRNA. Each row represents an individual cell. Shade (white to black) represents the frequency of modified alleles. Conditions and cell type clustering are displayed (right) with DNA editing clusters (left). c, Mean deletion size, indexing cytometry FITC-DQB1 fluorescence intensity (FI) and normalized HLA-DQB1 gene expression is plotted for each condition, cell type and editing cluster. P-values are from a one-way ANOVA using Dunn’s test for non-parametric comparison; n = 646 cells. d, Manhattan plot of LRT P-values from single-cell linear modelling of gene expression to log-normalized deletion size in Daudi and HH cells. Dotted line represents the FDR cut-off of 0.05. Each point represents a gene. e, Scatterplot of deletion size to normalized HLA-DQB1 gene expression. LRT P-values from linear modelling are plotted. f, Experimental outline of FBXO11 editing in Jurkat and Daudi cells. g, Alleles from the FBXO11 editing experiment. h, Genotype (allele combination), number of cells per genotype and normalized expression of FBXO11 faceted by ADT cluster (Jurkat or Daudi). P-values are from two-sided LRT. i, Overlap of differential genes and ADTs in Daudi cells identified with linear modelling of condition and genotype. j, Volcano plots of differentially expressed genes and ADTs. Dotted line represents the FDR cut-off of 0.05. P-values are calculated by two-sided LRT. k, Residuals of HLA-A, CD38 and CD22 with library size and plate regressed; n = 1,220 cells. P-values are derived by LRT from linear modelling of condition or genotype. *P < 0.05, **P < 0.01, ***P < 0.001, ****P < 0.0001. In all boxplots, boxes represent the interquartile range (IQR); whiskers indicate 1.5 × IQR.
We observed highly heterogeneous editing in both cell lines with DNA deletions of variable sizes (Fig. 2b). We removed cells with low-quality RNA profiles along with 15 cells with DNA insertions (Extended Data Fig. 3). We grouped DNA edits into three classes: small, medium and large with k-means clustering (Methods). After identifying cell types by clustering on ADT markers (Extended Data Fig. 3), we observed a strong association between DNA deletion class and HLA-DQB1 expression at the transcript (analysis of variance (ANOVA), P < 0.0001) and protein level (ANOVA, P < 0.0001) (Fig. 2c).
To assess editing effects on global gene expressions, we modelled the relationship between read counts and log2(deletion size + 1) using a negative binomial model (Methods). Strikingly, we observed that deletion size (P < 10−8) is specifically associated with only HLA-DQB1 and no other gene or protein (FDR > 0.05) (Fig. 2c–e). These results demonstrate that precise genomic function can be identified using CRAFTseq. Finally, we observed HDR edited cells with the intended C-to-G transition in 5 of 646 cells (Extended Data Fig. 3). Given the low efficiency, we did not detect statistically significant changes in gene or protein expression (Extended Data Fig. 3). This low efficiency of correctly edited cells with HDR is consistent with previously published results21.
Next, we explored stimulation-induced transcriptome-wide changes after disrupting FBXO11, an intracellular signalling protein. We used ABE8e base editors to induce an A-to-G transition to introduce a loss-of-function allele in 1,220 Daudi and 1,531 Jurkat cells passing quality control (Fig. 2f and Extended Data Fig. 4). We identified three genotypes corresponding to editing at the targeted nucleotide (Fig. 2g). At the single-cell level, we confirmed that editing affects gene abundance with a genotype-dependent 2.2-fold decrease in FBXO11 transcripts in Daudi cells (Fig. 2h).
We expected that the introduction of this allele and subsequent loss of FBXO11 mRNA would blunt responses to CD40L stimulation. To identify these changes, we first used a single-cell model to compare the expression of genes and ADT in condition-specific analysis (control versus CRISPR cells regardless of actual editing outcome). We discovered 168 significant genes (FDR < 0.05) and 53 significant ADTs (FDR < 0.05) when controlling for plate and library complexity in Daudi cells (Fig. 2i). However, our approach allows identification of genotype-dependent effects in the CRISPR condition. Because these cells are thus cultured in the same environment, this analysis controls for the effects of secreted factors. By modelling allele dose information in genotype-specific analysis, we identified 265 genes (FDR < 0.05) and 27 proteins (FDR < 0.05) (Fig. 2i). We observed significant downregulation of FBXO11, IGLL1, CD40 and IgM in Daudi cells (Fig. 2j), indicating the expected overall decrease in CD40L-mediated activation with negative feedback on CD40 gene and protein expression. Similar analysis in Jurkat cells, which should not respond to CD40L stimulation, did not identify any genotype-specific effects (Extended Data Fig. 4). Surprisingly, we identified some genes and proteins that are downregulated in the CRISPR condition, reflecting nonspecific environmental effects, such as HLA-A (Fig. 2k). By contrast, we observed genotype-dependent effects obscured in condition-specific analysis, such as an increase in CD38 gene expression and CD22 ADT (Fig. 2k). We were initially concerned about the relatively small effect sizes from our analysis. However, after examining previously reported single-cell and pseudobulk effect sizes from eQTL analyses, we found that our effect sizes (betas) had a similar magnitude to those reported from count-based single-cell modelling approaches (Extended Data Fig. 5). We also noted that CD45 was significantly different in condition-specific analysis and determined that hashing with fluorophore-conjugated CD45 antibodies interferes with ADT staining. As such, we advise researchers of potential competition between flow and oligo-conjugated antibodies (Supplementary Fig. 1).
Knockout in primary human CD4 T cells
Next, we assessed whether CRAFTseq can be used to investigate functional variants in primary human cells. We focused specifically on T cells and PTPRC, the gene that encodes CD45, because it is linked with inflammatory disorders including asthma, Crohn’s disease and rheumatoid arthritis22,23,24,25. To study the role of PTPRC in CD4+ T-cell activation, we isolated naive CD4+ T cells from three individuals and introduced an early stop codon (ESC) with BE4 base editors (Fig. 3a). We sorted three 384-well plates from three individuals, with 618 cells passing quality control. We used fluorophore-conjugated antibodies to track editing versus control conditions and individuals; we also confirmed assignment of individuals using genotype data derived from sequencing data and indexing flow cytometry (Supplementary Fig. 2).

a, Schematic of genomic editing in the PTPRC gene in primary human naive CD4+ T cells. BE4-NG base editors were used to induce a premature stop codon. PBMCs, peripheral blood mononuclear cells. b, Alleles from the PTPRC amplicon around the sgRNA. c, Allele combination with number of cells per condition and individual (column). Normalized expression of PTPRC is plotted by allelic combination. MFI, median fluorescence intensity. P-values are calculated by two-sided LRT. Boxes represent IQR; whiskers indicate 1.5 × IQR. d,e, Volcano plot of differential gene expression (d) and ADT expression (e) identified by linear modelling. P-values and betas from likelihood-ratio tests are plotted for the genotype analysis only. Dotted line represents the FDR cut-off of 0.05. f,g, Confirmation of results in bulk-edited CD4+ T cells with flow cytometry (f). Representative plots of CD4 versus CD45 are shown for the control and CRISPR conditions (g). The combination of CD4 and CD45 cell-surface expression is used to identify heterozygote (+/−) and homozygote (−/−) edited cells; n = 4 individuals. P-values are derived from LRT statistics from linear modelling. *P < 0.05, **P < 0.01, ***P < 0.001, ****P < 0.0001. Boxes represent IQR; whiskers indicate 1.5 × IQR.
We observed that the ESC T allele dramatically abrogated CD45 transcript and protein expression in an allele-dependent manner (Fig. 3b,c). Transcript abundance of PTPRC is reduced, probably because of nonsense-mediated decay21 (Fig. 3c). Given these large effects, we predicted that this loss-of-function allele would induce trans effects. Indeed, disruption of PTPRC altered 36 cell-surface proteins (FDR < 0.05) including increased expression of activation markers such as CD25 and CD28 (Fig. 3d,e and Extended Data Fig. 6). The PTPRC loss-of-function allele had broad effects on gene expression, with 60 genes demonstrating differential effects (FDR < 0.2). Gene-set enrichment analysis (GSEA) of these genes identified an enrichment for T helper 1 cell (TH1 cell) and activation pathways (Extended Data Fig. 7).
As a key example of a trans effect, we observed that loss of function in PTPRC markedly reduced the gene TNFRSF4 located 18 megabases from PTRPC (likelihood-ratio test (LRT), P < 10−5, β = −0.27), which is an important T cell co-stimulatory molecule expressed on regulatory T cells (Treg cells)22. Consistent with this observation, we also saw that PTPRC loss of function reduced surface marker expression for CD134 (OX40), encoded by the TNFRSF4 gene (LRT, P < 10−5, β = −0.12) (Extended Data Fig. 7).
We observed that PTPRC also induced CD4 protein expression (LRT, P < 10−16, β = 0.28). To validate this observation, we examined CD4 cell-surface expression in bulk CRISPR-edited CD4+ T cells (Fig. 3f). We confirmed the editing efficiency by flow cytometry to assay CD4 and CD45 protein expression alongside amplicon sequencing (Extended Data Fig. 7). Consistent with the single-cell results, we observed a 1.5-fold increase in CD4 cell-surface expression between the control and CRISPR conditions (P = 0.017, Wilcoxon rank test) and identified a heterozygous-edited population by flow cytometry. For the first time, we showed that loss of PTPRC in naive CD4+ T cells led to a compensatory upregulation of CD4 protein expression, consistent with previous reports that CD4 and CD45 co-localize on the cell surface26,27.
Condition-specific (control versus CRISPR) analysis identified broad changes in interferon response genes with no change in PTPRC (FDR > 0.05) (Extended Data Fig. 7). This interferon signature reflects nonspecific changes caused by culture conditions that would confound bulk editing assays.
Comparison with computational methods
We believe that single-cell genotyping is invaluable to discovering significant effects. We compared our genotype calls with Mixscape, which uses differentially expressed genes between groups of cells (CRISPR versus control) to predict editing status12. Applying Mixscape to the FBXO11 Daudi cells and the PTPRC ESC in primary T cells, we found that Mixscape did not accurately identify edited cells or differentially expressed genes (Extended Data Fig. 8).
To improve confidence in our ability to predict effect sizes and significance with our linear model, we performed bootstrapping to re-estimate confidence intervals for differentially expressed genes in the PTPRC-knockout experiment. The 95% confidence intervals calculated analytically from the linear model were concordant with those calculated from bootstrapping (Supplementary Fig. 3), indicating that the linear model is appropriate in this setting.
Defining the RPL8 eQTL causal allele
After confirming the effects of a loss-of-function allele, we wanted to genomically modify a variant that controls gene expression. We identified rs2954658 (a T-to-C transition) in the RPL8 locus that is associated with increased expression in B cell eQTL studies, and probably causal, by statistical fine-mapping analyses28,29,30 (Extended Data Fig. 9). To assess the function of this allele, we analysed 969 Daudi cells that passed quality control and confirmed a strong statistical effect of the T allele on RPL8 gene expression (P < 10−9, a 0.9-fold change; Fig. 4a–c). We did not observe a genotype effect on any other individual gene (FDR > 0.05), again highlighting the ability of our approach to identify a specific and subtle effect (Fig. 4d).

a, Schematic of genomic editing in RPL8. ABE8e base editors were used to induce the rs2954658 (T alternative to C reference) variant in Daudi cells. b, Alleles from the RPL8 amplicon around the sgRNA. c, Allelic combinations with number of cells per condition for RPL8 residuals with plate and library size regressed. The P-value is from LRT. Boxes represent IQR; whiskers indicate 1.5 × IQR. d, Manhattan plot of LRT P-values generated from single-cell linear modelling of gene expression to dosage at the targeted nucleotide (genotype analysis). Dotted line represents the FDR cut-off of 0.05. Each point represents a gene. P-values are from LRT. e, Schematic of genomic editing of rs61839660 in primary human naive CD4+ T cells polarized with TH1 or Treg conditions. BE4-NG base editors were used to induce the alternative T allele in genotyped non-autoimmune individuals. f, Alleles from the amplicon around the sgRNA, showing allelic combination with the number of cells per run and individual. g, UMAP of the top 3,000 variable genes scaled, normalized and harmonized by plate identifies three clusters. h, Residuals of IL2RA gene expression with plate, individual and library size regressed. i, Residuals of CD25+ ADT expression with plate, individual and library size regressed; n = 1,994 cells. Boxes represent IQR; whiskers indicate 1.5 × IQR. TH1 and Treg polarizations were identified by indexing flow cytometry.
To highlight the power of CRAFTseq single-cell analysis, we repeated CRISPR editing in the RPL8 and PTPRC loci with bulk RNA sequencing (Extended Data Fig. 10). We compared control with CRISPR-edited cells but could not identify significant RPL8 gene expression changes. Similarly, induction of an ESC in PTPRC resulted in widespread gene expression changes but limited relevance to T cell biology, indicative of non-genotype-dependent outcomes. This is probably caused by the secretion of inflammatory cytokines and the interaction of edited and non-edited cells in the CRISPR pool of cells before single-cell processing. CRAFTseq, unlike bulk analysis, enables a direct comparison of editing outcomes and controls for the cellular environment to determine intrinsic changes associated with genotype.
IL2RA cell-state-dependent effects
Next, we examined the effects of a non-coding autoimmune variant in IL2RA, rs61839660, which is associated with type 1 diabetes, asthma, systemic lupus erythematosus and rheumatoid arthritis24,31,32,33. Previous studies have reported that this variant may be causal and linked to downregulation of IL2RA gene expression and Treg cell differentiation34. However, others have shown that the haplotype associated with this variant increases the IL2RA protein (CD25) and gene expression35,36. Given these contradictory findings, we proposed that rs61839660 regulates IL2RA and CD25 expression in a highly context-dependent manner. We therefore investigated the effect of this variant in primary T cells polarized towards TH1 or Treg states (Fig. 4e).
We first confirmed naive human CD4+ T cell polarization and CRISPR base-editing efficiency by targeting CIITA, FOXP3 and TBX21 (Supplementary Fig. 4). We then recruited five individuals and used base editors to induce a transition at rs61839660 in isolated naive CD4+ T cells. We analysed a total of 1,994 cells across two experiments after quality control and removing cells with bystander editing outcomes (Fig. 4f). After harmonizing by experiment and plate, we created a joint embedding from differentially expressed mRNA and identified three prominent clusters that separated on proliferative status and quality (MKI67 and ACTB) (Fig. 4g and Extended Data Fig. 11). We note that proliferating cells had significantly higher levels of genes and UMIs detected, but almost equal levels of IL2RA gene and protein expression (Extended Data Fig. 11). Although cells did not cluster separately on polarization status, differentially expressed genes in TH1- and Treg-polarized cells were consistent with previously performed in vitro polarization experiments37 (Extended Data Fig. 11).
Using a single-cell model, we demonstrated that the T allele is associated with a significant increase in IL2RA only in proliferating Treg-polarized cells (LRT, P = 0.00016, 1.19-fold change; Fig. 4h). The allele also affects the expression of CD25 in non-proliferating (LRT, P = 0.005, 1.13-fold change) and proliferating (LRT, P = 0.008, 1.1-fold change) Treg cells. However, genotype has no effect in TH1-polarized cells in either CD25 protein or IL2RA (LRT, P > 0.05; Fig. 4i), indicating that this is a context-dependent regulatory variant.
Overall, we define a functional effect of the rs61839660 T risk allele in primary human CD4+ T cells in a highly context-dependent manner and highlight the utility of CRAFTseq to discover the subtle cell-state-specific changes caused by non-coding variants. The identification of this effect indicates that the disease association of this locus is driven at least in part by this allele.
Highly multiplexed editing in PAX5
Finally, we extended our approach with simultaneous multiplexed editing of two regions in PAX5, an important transcription factor in B lymphocyte development. PAX5 is characterized by a conserved paired domain consisting of an amino-terminal subdomain (NTD) and carboxy-terminal subdomains (CTD), each with DNA contact points. Previous studies have identified genes that are either activated or repressed by PAX5, including CD19, CD40, CD72, CD79A/B, BLNK, IGKC and JCHAIN38. We examined amino acid residues 16–29, exon 2 (region A) and amino acid residues 126–136, exon 3 (region B), which were embedded in the DNA contact regions of NTD and CTD, respectively. We performed multiplexed editing in these two regions with three sgRNAs to resolve critical nucleotides and amino acids important for PAX5 function (Fig. 5a).

a, Schematic for sgRNA design and multiplexed editing in the PAX5 gene. Dashed boxes indicate edited nucleotides identified in amplicon sequencing. b, Heatmap for editing outcome in Daudi cells. c, Correlation between edited nucleotides in each condition. Dashed boxes highlight adjacent nucleotides targeted by the same sgRNAs, leading to highly correlated editing outcomes. Coloured lines in the multiplexed heatmap mark edits in regions A and B. d, UMAP plots coloured by editing conditions (left) and clusters (right). e, Bar plot showing the composition of edited cells in each cluster. f, Expression of selected genes that are differentially expressed between cell clusters. P-values are derived from two-sided Wilcoxon rank-sum tests. g, Number of significant genes in negative binomial regression after Bonferroni correction (P-value cut-off = 0.05/[8 × number of genes]). Synonymous variants are shown in grey. h–j, Forest plots for the effect of each variant on three genes: VPREB3 (h), JCHAIN (i) and CD79B (j). Box plots show the effect of individual variants conditioning on all other variants; n = 1,926 cells. k,l, Forest plots for the effects of each variant on the surface protein level of CD72 (k) and HLA-DR (l). Box plots show the effect of B.29 (p.I135T) conditioning on all other variants; n = 1,004 cells. Points in forest plots represent effect size from a negative binomial model; error bars show 95% confidence intervals. Boxes show the IQR; whiskers show 1.5 × IQR. Outliers are not separately plotted; instead, all points are shown. m, The effect of A edits on B.29 gene score by linear regression. Cells were grouped by B.29 genotype and a linear regression was fitted separately in each group. P-values from the linear model are shown. Points indicate effect sizes from the linear model; error bars represent 95% confidence intervals.
First, we demonstrated multiplexed edited outcomes using CRAFTseq. In region A, we identified three nucleotides edited at high efficiency (range: 20.0–29.1%) and one nucleotide with 3.4% editing efficiency. In region B, we identified four edited nucleotides (range: 15.1–73.2%) (Fig. 5b). We calculated the genotype correlations across edited cells and found that editing at multiple sites is not entirely independent (Fig. 5c). Because adjacent variants are imperfectly correlated, we can resolve the effects of complex CRISPR editing outcomes across multiple genomic regions.
After plate integration using Harmony, we identified three cell clusters in RNA space. Cluster 0 contained almost all control cells, whereas clusters 1 and 2 were almost exclusively CRISPR-edited cells (Fig. 5d). We found that edited cells in cluster 0 were enriched for editing in region A, whereas clusters 1 and 2 were enriched for editing in region B (Fig. 5e). This indicates that PAX5 editing, especially in region B, leads to widespread transcriptomic changes. Genes significantly downregulated in clusters 1 and 2 included CD79B and VPREB3 (Fig. 5f).
To define the effects of nucleotide-level editing on gene expression, we used a single-cell negative binomial model to jointly analyse all eight induced mutations. We confirmed minimal impact on PAX5 expression (LRT, P = 0.337). Interestingly, multiplexed editing resulted in non-synonymous and synonymous amino acid changes. Synonymous mutations have a median P-value of around 0.5 across genes, indicating that these alleles have little effect. One edit in region B (B.29 p.I135T) had the largest impact on the transcriptome, inducing changes in 113 genes (Bonferroni P-value cut-off = 2.17 × 10⁻⁶) (Fig. 5g). Gene VPREB3 was significantly downregulated by both A.14 (p.V20A) and B.29 (p.I135T) (Fig. 5h and Extended Data Fig. 12), showing that DNA-binding regions in both NTD and CTD can function separately. We also found that B.29 (p.I135T) had significant yet opposite effects on expression of JCHAIN and CD79B, consistent with previous observations39 (Fig. 5i,j and Extended Data Fig. 12). PAX5 mutations also affected surface proteins such as CD72 and HLA-DR, which are known to be activated by PAX5 (Fig. 5k,l and Extended Data Fig. 12).
We next sought to define interaction effects between editing in regions A and B. Given that B.29 (p.I135T) had the largest effect on gene expression, we derived a gene score by summing the expression of the 113 genes associated with B.29 edits weighted by their corresponding effect sizes. This allowed us to aggregate potentially small effects across multiple genes, thereby increasing the statistical power to detect interactions. We found that the region A editing outcome (defined as the presence of any non-synonymous edit in A) was also associated with the B.29 gene score when B.29 edits were present (Fig. 5m) but was not associated in the absence of B.29 edits. We formally tested this interaction in a linear model and identified a significant interaction between the B.29 genotype and the A editing outcome (LRT, P = 1.72 × 10⁻⁴; Methods and Supplementary Table 11). This indicates that although B.29 edits in PAX5 alone affect the expression of many downstream genes, the presence of edits within the A locus amplifies these outcomes. Of the 113 genes in which expression was altered by editing B.29, 36 had significant interaction effects (one-sided test, LRT, q < 0.05; Methods), including RPL10 and ASTN2 (Extended Data Fig. 12 and Supplementary Table 12).
Taken together, our data show that CRAFTseq can disentangle the effects of individual edits on gene expression and surface protein in a highly multiplexed assay. Future studies will extend this work to examine the interaction of multiple non-coding autoimmune variants.
Conclusions
Scalable and flexible methods are urgently needed to investigate the rapidly emerging list of genomic variants associated with human disorders. We present CRAFTseq, a highly customizable multi-omic approach that we applied to a multitude of genomic editing techniques in cell lines and primary immune cells. To our knowledge, this is the only technique capable of capturing genomic DNA amplicons alongside transcriptome and cell-surface protein expression, providing invaluable multimodal read-outs on cell state. Future iterations of this approach will improve on scale with enhanced robotics, micro-well miniaturization or fixed nucleus and combinatorial indexing strategies. We propose that CRAFTseq can be applied on a case-by-case basis to resolve any genetic editing outcome.
This work highlights the potential of multimodal single-cell strategies incorporating accurate targeted genome sequencing to evaluate editing outcome in variant-to-function investigations. We assert that analyses on edited cells with single-cell resolution genotype and multimodal data can define both the cis and trans functions of complex trait alleles in primary human cells. Our experiments demonstrate that this strategy is well powered and precise, because each cell in the same pool of edited cells is its own independent experimental observation. Although we present analysis of CRISPR editing on largely homogeneous cell populations, future studies with editing of haematopoietic or induced pluripotent stem cells may extend this work to resolve the impact of non-coding variation on single-cell differentiation and fate. We think that as experimental and statistical single-cell methods improve, increased cell numbers and multiplexed editing will be effective in resolving causal interacting genetics in heterogeneous cellular populations to define mechanisms of disease alleles.
Methods
Cell-line cultures and genomic editing
HH cutaneous T cell lines (ATCC, CRL-2105), Jurkat E6-1 (ATCC, TIB-152) and Daudi cells (ATCC, CCL-213) were cultured in complete RPMI (cRPMI), RPMI 1640 supplemented with 10% heat-inactivated FBS and 1% non-essential amino acids, sodium pyruvate, HEPES, l-glutamine, penicillin-streptomycin and 0.1% β-mercaptoethanol. HEK293T cells (ATCC, CRL-3216) were cultured in complete DMEM, DMEM supplemented with 10% heat-inactivated FBS and penicillin-streptomycin antibiotics.
To investigate the regulatory regions around HLA-DQB1, HH and Daudi cells were genomically modified as previously described with some modifications21. In brief, 20 µM Cas9 protein (Synthego) was mixed with equal volumes of 40 µM modified sgRNA (Synthego) and incubated at 37 °C for 15 min to form RNP complexes. The sgRNA was designed using SpliceR40. HH and Daudi cells were nucleofected with 2 µl of RNPs in an Amaxa 4D nucleofector and 1 µl of ssODN repair template (SE protocol: CL-120 for HH cells; SF protocol: CA-137 for Daudi cells). Cells were immediately transferred to 24-well plates with pre-warmed media and cultured until sorting.
For Jurkat and Daudi cells targeting FBXO11, 1 µl of mRNA (2 µg µl−1) encoding the base editor ABE8e-NG was mixed with 1 µl of 40 µM modified sgRNA (Synthego). Cells were nucleofected with 2 µl of an mRNA/sgRNA mixture in an Amaxa 4D nucleofector (SE protocol: CL-120 for Jurkat cells; Daudi as above). Cells were incubated as described above in 24-well plates and cultured until sorting.
For multiplexed PAX5 editing in Daudi cells, three sgRNAs were designed for each of the two DNA binding domains (DBD), designated region A and region B. Editing was performed in region A and B separately, as well as combined. Daudi cells were nucleofected with 1 µl of 2 µg µl−1 ABE8e mRNA and 1 µl of each sgRNA (40 µM) using the reagents and protocol described above. Cells were sorted into single-cell plates seven days after nucleofection followed by CRAFTseq.
Healthy individuals, PBMC isolation and CD4+ T-cell magnetic selection
We recruited healthy individuals and processed 40–50 ml of peripheral blood under a Mass General Brigham (MGB) IRB-approved protocol (IRB# 2008P000427). PBMCs were isolated by layering Ficoll Paque (Sigma-Aldrich) underneath 1:1 PBS-diluted blood followed by centrifugation. Buffy coat layers were extracted, washed in PBS and then resuspended in cRPMI. Cells were stored by adding an equal volume of freezing medium (10% DMSO and 50% FBS in cRPMI) and frozen in liquid N2 until use. To isolate naive or total CD4+ T cells, frozen PBMCs were quickly thawed and put immediately in warm cRPMI media. Cells were washed twice and naive or total CD4+ T cells were isolated using a magnetic negative selection kit (Miltenyi, Naive CD4+ T cell isolation kit human, CD4+ T cell Isolation kit) following the manufacturer’s protocols.
CRISPR editing of primary CD4 T cells
After naive CD4+ T cell isolation, cells were stimulated with anti-CD3 and anti-CD28 Dynabeads (ThermoFisher) at a ratio of 1:1 (cell:Dynabead) in the presence of 5 ng ml−1 rhIL-2 and 10 ng ml−1 rhIL-7 (Biolegend) in 96-well U-bottom plates. After one day, cells were extracted and nucleofected with CRISPR reagents. In brief, 250,000–500,000 stimulated CD4+ T cells were nucleofected with 1 µl of mRNA (2 µg µl−1) encoding the base editor and 1 µl of sgRNA (40 µM, Synthego) in an Amaxa 4D nucleofector (P3 protocol: EH-115). After nucleofection, cells were transferred to 96-well U-bottom plates and cultured in cRPMI for 4 h. For experiments targeting PTPRC, cells were cultured for a further 5 days with 5 ng ml−1 rhIL-2 before proceeding to staining and cell sorting. For polarization experiments, cells were split into two wells and cultured with either 10 ng ml−1 rhIL-12, 5 ng ml−1 rhIL-2 and 2 µg ml−1 anti-IL4 antibody for TH1 conditions or 10 ng ml−1 rhIL-2 and 5 ng ml−1 rhTGFβ for Treg conditions.
Cell staining with indexing and oligo-conjugated antibodies
Cells were isolated, washed and resuspended in a cell staining buffer (2% FBS in PBS with 2 mM EDTA). About 500,000 to one million cells were stained with fluorophore-conjugated hashing antibodies for 20 min on ice. After staining, cells were washed and conditions pooled together. Pooled samples were then spun down and resuspended in FcX True Stain (Biolegend) (BioLegend) for 5 min at room temperature, followed by staining with the TotalSeq-A Human Universal Cocktail 1.0 (BioLegend) for 30 min on ice before washing and proceeding to single-cell sorting. A full list of antibodies and barcodes can be found in Supplementary Table 1.
Bulk DNA isolation
Cells were pelleted, resuspended in RLT+ buffer (Qiagen), flash frozen on dry ice and stored at −80 °C until processing. For DNA isolation, samples were thawed, vortexed and incubated for 5 min at room temperature before proceeding to DNA isolation using a Qiagen RNA/DNA extraction kit following the manufacturer’s protocols. After isolation, DNA concentrations were measured by spectrometry (Nanovue) and stored at −20 °C until use. For analysis of bulk DNA editing, nested PCR reactions were used to amplify 200–400 bp genomic regions of interest with custom Illumina adapters added for sequencing. Bulk samples were sequenced alongside single-cell libraries. Sequences of all primers can be found in Supplementary Table 7.
Bulk flow cytometry
Stimulated and genomically edited total CD4+ T cells were assayed for expression of key protein markers by flow cytometry on day 7 after nucleofection with a panel of fluorophore-conjugated antibodies. For all samples, cells were isolated and washed twice in PBS, and FC receptors were blocked with FcX True Stain (Biolegend) for 15 min on ice followed by staining with directly conjugated antibodies for 30 min on ice. Cells were then washed and samples were analysed on a BD LSR Fortessa. All data were processed using FlowJo before analysis in R. A full list of antibodies, clones and manufacturers can be found in Supplementary Table 8.
CRAFTseq
Lysis buffer containing 0.2% TritonX (Millipore Sigma), 1.2 U recombinant RNase inhibitor (Takeda), 1.2 mM DTT, 1 M Betaine, 6 mM dNTP and 9 mM dCTP (ThermoFisher) was added into a 384-well PCR plate using a multi-channel pipette. An Agilent Bravo was used to add 2.5 µM of a well-specific OligoDT barcode into each well, then to distribute 1 µl of barcoded lysis buffer to multiple 384-well plates. These lysis plates were sealed and stored at −20 °C until use the next day for sorting. Single cells stained with fluorophore- and oligo-conjugated antibodies were sorted into lysis plates, which were kept sealed on dry ice before being stored at −80 °C until use for a maximum of 4 weeks.
For library generation, plates were thawed and incubated at 72 °C for 3 min, then kept on ice during further processing. RT-PCR mix (4 µl) containing 1.8 µM template switch oligo (Azenta), 0.3 mM dNTP, 0.8 M Betaine, 4.8 mM DTT, 9.7 mM MgCl2, 0.8 U RNase inhibitor, Maxima H Minus reverse transcriptase, 1× KAPA HIFI buffer and 2 U KAPA HiFi HotStart DNA polymerase (Roche) was then added to each well using a MANTIS liquid dispenser (Formulatrix). After first-strand synthesis (50 °C for 1 h and 85 °C for 5 min), a mixture of ADT primers (0.05 µM) and genomic DNA-specific primers (0.2 µM) were added using an I.DOT liquid handler (Dispendix) and amplified using the following program: 98 °C for 5 min then 18–22 cycles of 98 °C for 20 s, 65 °C for 20 s and 72 °C for 6 min, followed by 72 °C for 5 min and then hold at 4 °C. After amplification, the samples were split for processing of cDNA, genomic DNA and ADT.
For genomic DNA, using the Bravo, 1 µl of product per well was taken for further amplification of genomic DNA with nested primers containing a capture oligo with well-specific barcodes. The PCR mix was distributed between plates similarly to the process used for lysis plates and contained 0.3 mM dNTP, 1× KAPA Hifi buffer, 2 U KAPA HIFI HotStart Taq and 0.4 µM region-specific capture primer, 0.4 µM region-specific P7 primer and 0.4 µM capture oligo with well-specific barcode. The DNA was amplified using the following program: 98 °C for 5 min, followed by 20 cycles of 98 °C for 20 s, 65 °C for 20 s and 72 °C for 30 s, followed by 72 °C for 5 min, then hold at 10 °C. We then pooled 2 µl of each well containing nested genomic DNA using the Bravo and purified it with 1.2× solid-phase reverse immobilization (SPRI) beads. In brief, room-temperature SPRI beads were incubated at the given ratio by volume with PCR product for 10 min, then placed on a magnet for 5 min. Supernatant was removed and the beads were washed twice with 80% freshly made ethanol, dried for up to 15 min in air and resuspended in nuclease-free water. The resuspended beads were incubated at room temperature for 5 min, then placed back on the magnet for 5 min, and the supernatant was used for following steps. The cleaned DNA was treated with thermolabile ExoI and ExoVII (NEB) to remove primers (37 °C for 30 min, then 87 °C for 5 min for ExoI denaturation) and re-cleaned with 1.2× SPRI beads.
For multiplexed PAX5 editing, to effectively amplify gDNA amplicons from both region A and region B, two inner PCR reactions were carried out for each region separately, rather than amplifying both regions simultaneously in one reaction.
For cDNA, 2 µl per well of the original amplification product was pooled using the Bravo and cleaned with 0.6× SPRI beads; the supernatant was saved for ADT sequencing. The cleaned cDNA product was treated with ExoI to remove primers (37 °C for 5 min, 85 °C for 5 min for ExoI denaturation) and cleaned again with 0.8× SPRI. cDNA concentrations were measured on a QuBit and 2 ng was used for tagmentation with a NexteraXT kit (Illumina) following the manufacturer’s directions in half-volume reactions (25 µl total).
For ADT, saved supernatant from the 0.6× SPRI clean-up was re-cleaned with 1.4× SPRI (2× total) and ExoI was treated as above. The ADT product was quantified on a QuBit.
For the final amplification of pooled samples, 2 ng of tagmented cDNA and 5 ng of genomic DNA and ADT samples underwent a final amplification step from the 3′ end with custom Illumina-compatible primers. The PCR mix contained 0.2 µM P7 and P5 custom oligos, 1× Q5 buffer, 0.5 µl Q5 Taq, 0.2 µM dNTP and water to a total volume of 25 µl. Amplification used the following programs: cDNA 72 °C for 3 min gap repair, 95 °C for 30 s, followed by 16 cycles of 95 °C for 10 s, 55 °C for 30 s and 72 °C for 30 s, followed by 72 °C for 5 min, then hold at 10 °C. Genomic DNA and ADT: 98 °C for 3 min, followed by 16 cycles of 98 °C for 15 s, 65 °C for 20 s and 72 °C for 45 s, followed by 72 °C for 10 min. All samples were re-cleaned using SPRI beads (0.8× for cDNA, 1.2× for gDNA and 1.6× for ADT) for sequencing. All sequences can be found in Supplementary Tables 1–7. The full protocol can be found in a more readable format deposited on protocols.io (https://www.protocols.io/view/craftseq-d7bk9ikw), in Supplementary Notes and Supplementary Tables 16–23.
Illumina sequencing
Before submission to sequencing at the Genomics Platform at the Broad Institute, sample DNA concentrations were quantified on a QuBit, and distributions were measured using a TapeStation (Agilent) with D5000 high-sensitivity screentapes. All DNA amplicon libraries were sequenced on a MiSeq for 300 cycles (120 R1, 180 R2). ADT amplicon libraries were pooled at 5% with the RNA libraries and sequenced on a NextSeq550 for 75 cycles (26 R1, 50 R2).
Processing and alignment of single-cell data
The I7 and I5 raw FASTQs were merged across different lanes and runs. Transcriptomic reads were then aligned to the human genome (GRCh38 2020-A) using STARsolo41 (v.2.7.6a). The resulting count matrices were imported into R. For all experiments, cells were filtered on at least 500 genes, 1,000 UMIs and fewer than 10% mitochondrial reads. Counts were log(CP10K + 1) normalized and z-score scaled. For visualization, PCA was done on the top 3,000 variable genes, as selected using variance stabilizing transformation. This was followed by batch correction using Harmony42 and dimension reduction using UMAP (uwot package)43. For index flow-cytometry analysis, raw fluorescence values were exported from index sorting as csv files and imported into R. Values were log10-normalized and analysed in R.
Kallisto kite (v.0.27.3) was used to build an ADT reference transcriptome corresponding to the ADT panel (Biolegend TotalSeq A) used and to align ADT reads44,45. UMI counts were imported into R, CLR normalized and z-score scaled. For visualization, PCA was done on CLR-normalized and scaled variable ADTs followed by plate correction using Harmony and UMAP dimension reduction on harmonized PCs.
DNA reads were demultiplexed based on cellular barcodes. Then, amplicons were aligned to the amplicon reference using CRISPResso2 (v.2.2.9)46. Allele usage statistics were calculated from CRISPResso2 outputs. For all DNA analyses, cells were filtered on a minimum number of reads (20–40) and minimum allele frequencies (12–25%) on a per-experiment basis. Assuming dizygosity, only the top two alleles after filtering were included in the analysis. If after filtering only one allele was recovered, the cell was assumed to be homozygous. Clustering of DNA editing in the DQB1 experiment (Fig. 2) was performed with supervised k-means clustering with an n of 3. For more information on processing amplicon sequencing data and genotype calling, see Supplementary Notes and Supplementary Figs. 6–23.
Linear modelling of gene and protein expression
Associations of gene and ADT expression to dosage and conditions were made using negative binomial generalized linear modelling. We modelled counts of genes or ADTs with covariates comparing null to full models. For analyses in cell lines:
$$begin{array}{c}Xsim {rm{N}}{rm{e}}{rm{g}}{rm{a}}{rm{t}}{rm{i}}{rm{v}}{rm{e}},{rm{b}}{rm{i}}{rm{n}}{rm{o}}{rm{m}}{rm{i}}{rm{a}}{rm{l}}({rm{G}}{rm{e}}{rm{n}}{rm{e}}/{{rm{A}}{rm{D}}{rm{T}}}_{i})\ {rm{N}}{rm{u}}{rm{l}}{rm{l}},{rm{m}}{rm{o}}{rm{d}}{rm{e}}{rm{l}}:{rm{l}}{rm{n}}(X)=1+{log }_{10}({{rm{n}}{rm{C}}{rm{o}}{rm{u}}{rm{n}}{rm{t}}{rm{s}}}_{i})+{beta }_{{rm{p}}{rm{l}}{rm{a}}{rm{t}}{rm{e}}}{{rm{p}}{rm{l}}{rm{a}}{rm{t}}{rm{e}}}_{i}\ {rm{F}}{rm{u}}{rm{l}}{rm{l}},{rm{m}}{rm{o}}{rm{d}}{rm{e}}{rm{l}},{rm{g}}{rm{e}}{rm{n}}{rm{o}}{rm{t}}{rm{y}}{rm{p}}{rm{e}}:{rm{l}}{rm{n}}(X)=1+{log }_{10}({{rm{n}}{rm{C}}{rm{o}}{rm{u}}{rm{n}}{rm{t}}{rm{s}}}_{i})+{beta }_{{rm{p}}{rm{l}}{rm{a}}{rm{t}}{rm{e}}}{{rm{p}}{rm{l}}{rm{a}}{rm{t}}{rm{e}}}_{i}+{beta }_{{rm{g}}{rm{e}}{rm{n}}{rm{o}}{rm{t}}{rm{y}}{rm{p}}{rm{e}}}{{rm{G}}{rm{e}}{rm{n}}{rm{o}}{rm{y}}{rm{t}}{rm{p}}{rm{e}}}_{i}\ {rm{F}}{rm{u}}{rm{l}}{rm{l}},{rm{m}}{rm{o}}{rm{d}}{rm{e}}{rm{l}},{rm{c}}{rm{o}}{rm{n}}{rm{d}}{rm{i}}{rm{t}}{rm{i}}{rm{o}}{rm{n}}:{rm{l}}{rm{n}}(X)=1+{log }_{10}({{rm{n}}{rm{C}}{rm{o}}{rm{u}}{rm{n}}{rm{t}}{rm{s}}}_{i})+{beta }_{{rm{p}}{rm{l}}{rm{a}}{rm{t}}{rm{e}}}{{rm{p}}{rm{l}}{rm{a}}{rm{t}}{rm{e}}}_{i}+{beta }_{{rm{c}}{rm{o}}{rm{n}}{rm{d}}{rm{i}}{rm{t}}{rm{i}}{rm{o}}{rm{n}}}{{rm{C}}{rm{o}}{rm{n}}{rm{d}}{rm{i}}{rm{t}}{rm{i}}{rm{o}}{rm{n}}}_{i}end{array}$$
where gene/ADT counts is raw counts in each cell i, nCounts is total gene or ADT count in cell i, plate is plate identity, genotype is dosage at the edited nucleotide (0,1,2) and condition is culture condition (CRISPR or control). For the DQB1 editing experiment, we modelled gene and ADT counts:
$$begin{array}{c}Xsim {rm{N}}{rm{e}}{rm{g}}{rm{a}}{rm{t}}{rm{i}}{rm{v}}{rm{e}},{rm{b}}{rm{i}}{rm{n}}{rm{o}}{rm{m}}{rm{i}}{rm{a}}{rm{l}}({{rm{G}}{rm{e}}{rm{n}}{rm{e}}/{rm{A}}{rm{D}}{rm{T}}}_{i})\ {rm{N}}{rm{u}}{rm{l}}{rm{l}},{rm{m}}{rm{o}}{rm{d}}{rm{e}}{rm{l}}:{rm{l}}{rm{n}}(X)=1+{log }_{10}({{rm{n}}{rm{C}}{rm{o}}{rm{u}}{rm{n}}{rm{t}}{rm{s}}}_{i})+{beta }_{{rm{p}}{rm{l}}{rm{a}}{rm{t}}{rm{e}}}{{rm{p}}{rm{l}}{rm{a}}{rm{t}}{rm{e}}}_{i}\ {rm{F}}{rm{u}}{rm{l}}{rm{l}},{rm{m}}{rm{o}}{rm{d}}{rm{e}}{rm{l}}:{rm{l}}{rm{n}}(X)=1+{log }_{10}({{rm{n}}{rm{C}}{rm{o}}{rm{u}}{rm{n}}{rm{t}}{rm{s}}}_{i})+{beta }_{{rm{p}}{rm{l}}{rm{a}}{rm{t}}{rm{e}}}{{rm{p}}{rm{l}}{rm{a}}{rm{t}}{rm{e}}}_{i}+{log }_{2}({beta }_{{rm{D}}{rm{e}}{rm{l}}{rm{e}}{rm{t}}{rm{i}}{rm{o}}{rm{n}}{rm{s}}{rm{i}}{rm{z}}{rm{e}}}{{rm{D}}{rm{e}}{rm{l}}{rm{e}}{rm{t}}{rm{i}}{rm{o}}{rm{n}}{rm{s}}{rm{i}}{rm{z}}{rm{e}}}_{i}+1)end{array}$$
where deletion size was calculated per cell i. In all cell-line analysis, genes were filtered for non-zero expression in greater than 30% of cells and a mean of 2 reads per cell. For the PTPRC editing experiments in primary human cells, we modelled:
$$begin{array}{c}Xsim {rm{N}}{rm{e}}{rm{g}}{rm{a}}{rm{t}}{rm{i}}{rm{v}}{rm{e}},{rm{b}}{rm{i}}{rm{n}}{rm{o}}{rm{m}}{rm{i}}{rm{a}}{rm{l}}({{rm{G}}{rm{e}}{rm{n}}{rm{e}}/{rm{A}}{rm{D}}{rm{T}}}_{i})\ {rm{N}}{rm{u}}{rm{l}}{rm{l}},{rm{m}}{rm{o}}{rm{d}}{rm{e}}{rm{l}}:{rm{l}}{rm{n}}(X)=1+{log }_{10}({{rm{n}}{rm{C}}{rm{o}}{rm{u}}{rm{n}}{rm{t}}{rm{s}}}_{i})+{beta }_{{rm{p}}{rm{l}}{rm{a}}{rm{t}}{rm{e}}}{{rm{p}}{rm{l}}{rm{a}}{rm{t}}{rm{e}}}_{i}+{beta }_{{rm{i}}{rm{n}}{rm{d}}{rm{i}}{rm{v}}{rm{i}}{rm{d}}{rm{u}}{rm{a}}{rm{l}}}{{rm{I}}{rm{n}}{rm{d}}{rm{i}}{rm{v}}{rm{i}}{rm{d}}{rm{u}}{rm{a}}{rm{l}}}_{i}\ {rm{F}}{rm{u}}{rm{l}}{rm{l}},{rm{m}}{rm{o}}{rm{d}}{rm{e}}{rm{l}},{rm{g}}{rm{e}}{rm{n}}{rm{o}}{rm{t}}{rm{y}}{rm{p}}{rm{e}}:{rm{l}}{rm{n}}(X)=1+{log }_{10}({{rm{n}}{rm{C}}{rm{o}}{rm{u}}{rm{n}}{rm{t}}{rm{s}}}_{i})+{beta }_{{rm{p}}{rm{l}}{rm{a}}{rm{t}}{rm{e}}}{{rm{p}}{rm{l}}{rm{a}}{rm{t}}{rm{e}}}_{i}+{beta }_{{rm{i}}{rm{n}}{rm{d}}{rm{i}}{rm{v}}{rm{i}}{rm{d}}{rm{u}}{rm{a}}{rm{l}}}{{rm{I}}{rm{n}}{rm{d}}{rm{i}}{rm{v}}{rm{i}}{rm{d}}{rm{u}}{rm{a}}{rm{l}}}_{i}+{beta }_{{rm{g}}{rm{e}}{rm{n}}{rm{o}}{rm{t}}{rm{y}}{rm{p}}{rm{e}}}{{rm{G}}{rm{e}}{rm{n}}{rm{o}}{rm{t}}{rm{y}}{rm{p}}{rm{e}}}_{i}\ {rm{F}}{rm{u}}{rm{l}}{rm{l}},{rm{m}}{rm{o}}{rm{d}}{rm{e}}{rm{l}},{rm{c}}{rm{o}}{rm{n}}{rm{d}}{rm{i}}{rm{t}}{rm{i}}{rm{o}}{rm{n}}:{rm{l}}{rm{n}}(X)=1+{log }_{10}({{rm{n}}{rm{C}}{rm{o}}{rm{u}}{rm{n}}{rm{t}}{rm{s}}}_{i})+{beta }_{{rm{p}}{rm{l}}{rm{a}}{rm{t}}{rm{e}}}{{rm{p}}{rm{l}}{rm{a}}{rm{t}}{rm{e}}}_{i}+{beta }_{{rm{i}}{rm{n}}{rm{d}}{rm{i}}{rm{v}}{rm{i}}{rm{d}}{rm{u}}{rm{a}}{rm{l}}}{{rm{I}}{rm{n}}{rm{d}}{rm{i}}{rm{v}}{rm{i}}{rm{d}}{rm{u}}{rm{a}}{rm{l}}}_{i}+{beta }_{{rm{c}}{rm{o}}{rm{n}}{rm{d}}{rm{i}}{rm{t}}{rm{i}}{rm{o}}{rm{n}}}{{rm{C}}{rm{o}}{rm{n}}{rm{d}}{rm{i}}{rm{t}}{rm{i}}{rm{o}}{rm{n}}}_{i}end{array}$$
where individual was the individual identity in cell i. Genes were filtered for non-zero expression in greater than 15% of cells. For the IL2RA editing experiments, we modelled:
$$begin{array}{c}Xsim {rm{N}}{rm{e}}{rm{g}}{rm{a}}{rm{t}}{rm{i}}{rm{v}}{rm{e}},{rm{b}}{rm{i}}{rm{n}}{rm{o}}{rm{m}}{rm{i}}{rm{a}}{rm{l}}({{rm{G}}{rm{e}}{rm{n}}{rm{e}}/{rm{A}}{rm{D}}{rm{T}}}_{i})\ {rm{N}}{rm{u}}{rm{l}}{rm{l}},{rm{m}}{rm{o}}{rm{d}}{rm{e}}{rm{l}}:{rm{l}}{rm{n}}(X)=1+{log }_{10}({{rm{n}}{rm{C}}{rm{o}}{rm{u}}{rm{n}}{rm{t}}{rm{s}}}_{i})+,({1|{rm{p}}{rm{l}}{rm{a}}{rm{t}}{rm{e}}}_{i})+({1|{rm{I}}{rm{n}}{rm{d}}{rm{i}}{rm{v}}{rm{i}}{rm{d}}{rm{u}}{rm{a}}{rm{l}}}_{i})\ {rm{F}}{rm{u}}{rm{l}}{rm{l}},{rm{m}}{rm{o}}{rm{d}}{rm{e}}{rm{l}}:{rm{l}}{rm{n}}(X)=1+{log }_{10}({{rm{n}}{rm{C}}{rm{o}}{rm{u}}{rm{n}}{rm{t}}{rm{s}}}_{i})+({1|{rm{p}}{rm{l}}{rm{a}}{rm{t}}{rm{e}}}_{i})\ ,,,+(1|{{rm{I}}{rm{n}}{rm{d}}{rm{i}}{rm{v}}{rm{i}}{rm{d}}{rm{u}}{rm{a}}{rm{l}}}_{i})+{beta }_{{rm{g}}{rm{e}}{rm{n}}{rm{o}}{rm{t}}{rm{y}}{rm{p}}{rm{e}}}{{rm{G}}{rm{e}}{rm{n}}{rm{o}}{rm{t}}{rm{y}}{rm{p}}{rm{e}}}_{i}end{array}$$
Random effects were used for individual and plate in these models with multiple runs. The R package lme4 was used to model fixed effects using the glm.nb function, and the R package MASS was used to model random effects using the glmer.nb function.
To determine the significance of these models, we used an LRT comparing the null and full models and calculated a P-value for the test statistic against the chi-squared distribution with one degree of freedom. When indicated, we corrected for multiple hypothesis testing using the Benjamini–Hochberg correction (FDR).
To model the effect of PAX5 multiplexed editing on gene expression, we used negative binomial regression to model all eight edited variants jointly, which yielded a P-value for each variant and gene. We used the Bonferroni correction to account for multiple testing considering the number of variants and the number of tested genes, using a P-value cut-off equal to 0.05/(8 × the number of genes), which equals 0.05/(8 × 3,125) = 2 × 10⁻⁶. To further validate the effect of individual variants, we used a likelihood-ratio test in which the full model contains all eight edited variants and covariates and the null model is the full model minus the specific variant of interest. We report LRT P-values in the relevant figures.
To evaluate the calibration of effect sizes and P-values learnt from the linear model and LRT, we bootstrapped the CD45 experiment using 200 replications for each gene. We used the estimated β values from this approach to define the 95% confidence intervals and nominal significance (confidence interval not containing 0) for each gene.
PAX5 interaction analysis
To test for interactions between our two edited regions in PAX5, regions A and B, we first summarized the effect of B.29 on genome-wide gene expression as a B.29 gene score: ({S}_{i}={sum }_{g}{beta }_{g}{E}_{i,g}) where Si is the gene score for cell i, βg is the effect size of B.29 on gene g in negative binomial regression and Ei,g is the expression of gene g in cell i. We then tested the interaction effect between B.29 and A edit outcome (defined as any non-synonymous edit in region A) on the B.29 gene score using a likelihood ratio test to compare the two models below:
$$begin{array}{l}{rm{N}}{rm{u}}{rm{l}}{rm{l}},{rm{m}}{rm{o}}{rm{d}}{rm{e}}{rm{l}}:{S}_{i},=,{beta }_{0}{log }_{10}({{rm{n}}{rm{C}}{rm{o}}{rm{u}}{rm{n}}{rm{t}}{rm{s}}}_{i})+{beta }_{{rm{p}}{rm{l}}{rm{a}}{rm{t}}{rm{e}}}{{rm{p}}{rm{l}}{rm{a}}{rm{t}}{rm{e}}}_{i}\ ,,,,,,+,{beta }_{A}{{rm{A}}{rm{e}}{rm{d}}{rm{i}}{rm{t}}{rm{e}}{rm{d}}}_{i}+{beta }_{B}B{.29}_{i}\ {rm{F}}{rm{u}}{rm{l}}{rm{l}},{rm{m}}{rm{o}}{rm{d}}{rm{e}}{rm{l}}:,{S}_{i},=,{beta }_{0}{log }_{10}({{rm{n}}{rm{C}}{rm{o}}{rm{u}}{rm{n}}{rm{t}}{rm{s}}}_{i})\ ,+,{beta }_{{rm{p}}{rm{l}}{rm{a}}{rm{t}}{rm{e}}}{{rm{p}}{rm{l}}{rm{a}}{rm{t}}{rm{e}}}_{i}+{beta }_{A}{{rm{A}}{rm{e}}{rm{d}}{rm{i}}{rm{t}}{rm{e}}{rm{d}}}_{i}+{beta }_{B}B{.29}_{i}+{beta }_{AB}{{rm{A}}{rm{e}}{rm{d}}{rm{i}}{rm{t}}{rm{e}}{rm{d}}}_{i}B{.29}_{i}end{array}$$
To define individual genes with interaction effects, we tested the interaction between B.29 genotype and A editing outcome:
$$begin{array}{l}{rm{N}}{rm{u}}{rm{l}}{rm{l}},{rm{m}}{rm{o}}{rm{d}}{rm{e}}{rm{l}}:{rm{l}}{rm{n}}(X)\ ,=,{beta }_{0}{log }_{10}({{rm{n}}{rm{C}}{rm{o}}{rm{u}}{rm{n}}{rm{t}}{rm{s}}}_{i})+{beta }_{{rm{p}}{rm{l}}{rm{a}}{rm{t}}{rm{e}}}{{rm{p}}{rm{l}}{rm{a}}{rm{t}}{rm{e}}}_{i}+{beta }_{A}{{rm{A}}{rm{e}}{rm{d}}{rm{i}}{rm{t}}{rm{e}}{rm{d}}}_{i}+{beta }_{B}B{.29}_{i}\ {rm{F}}{rm{u}}{rm{l}}{rm{l}},{rm{m}}{rm{o}}{rm{d}}{rm{e}}{rm{l}}:{rm{l}}{rm{n}}(X)\ ,=,{beta }_{0}{log }_{10}({{rm{n}}{rm{C}}{rm{o}}{rm{u}}{rm{n}}{rm{t}}{rm{s}}}_{i})+{beta }_{{rm{p}}{rm{l}}{rm{a}}{rm{t}}{rm{e}}}{{rm{p}}{rm{l}}{rm{a}}{rm{t}}{rm{e}}}_{i}+{beta }_{A}{{rm{A}}{rm{e}}{rm{d}}{rm{i}}{rm{t}}{rm{e}}{rm{d}}}_{i}+{beta }_{B}B{.29}_{i}\ ,,+,{beta }_{AB}{{rm{A}}{rm{e}}{rm{d}}{rm{i}}{rm{t}}{rm{e}}{rm{d}}}_{i}B{.29}_{i}end{array}$$
In this analysis, we only tested the genes that are significantly associated with B.29 genotype in our original negative binomial regression models.
Mixscape analysis
We applied Mixscape12 separately for each cell type to the FBXO11 and CD45 experiments. In each context, we ran Mixscape with three types of input to the model: experimental condition (CRISPR/control, genotyping unaware); dosage of 0 versus 1 or 2 (genotyping aware); and dosage of 0 or 1 versus 2 (genotyping aware). For processing the data for Mixscape, we followed the default RNA processing, including TP10K library size normalization, log transformation, variance stabilizing transformation selection of variable genes, variance scaling and centring of data, and PCA. We provided 40 PCs to Mixscape for calculation of the perturbation signature. To run Mixscape, we set the number of nearest neighbours for the analysis to 10, defined a log fold change threshold of 0.05 for inclusion of differentially expressed genes, and required differential expression of 2 or more genes to predict perturbation status.
To identify differentially expressed genes between predicted knockout and non-perturbed predictions by Mixscape, we performed analogous linear modelling of gene expression, as in our model associating genotype dosage with expression. However, in the Mixscape-based approach, expression association with Mixscape-predicted status was performed as below.
For the PTPRC experiment:
$$begin{array}{c}X sim {rm{Negative}};{rm{binomial}}({{rm{Gene}}}_{i})\ {rm{Null}};{rm{model}}:{rm{ln}}(X)=1+{log }_{10}({{rm{nCounts}}}_{i})+{beta }_{{rm{plate}}}{{rm{plate}}}_{i}+{beta }_{{rm{individual}}}{{rm{Individual}}}_{i}\ {rm{Full}};{rm{model}};{rm{Mixscape}}:{rm{ln}}(X)=1+{log }_{10}({{rm{nCounts}}}_{i})+{beta }_{{rm{plate}}}{{rm{plate}}}_{i}+{beta }_{{rm{individual}}}{{rm{Individual}}}_{i}+{beta }_{{rm{Mixscape}}}{{rm{Mixscape}}}_{i}end{array}$$
For the FBXO11 experiment:
$$begin{array}{c}X sim {rm{Negative}};{rm{binomial}}({{rm{Gene}}}_{i})\ {rm{Null}};{rm{model}}:{rm{ln}}(X)=1+{log }_{10}({{rm{nCounts}}}_{i})+{beta }_{{rm{plate}}}{{rm{plate}}}_{i}\ {rm{Full}};{rm{model}};{rm{Mixscape}}:{rm{ln}}(X)=1+{log }_{10}({{rm{nCounts}}}_{i})+{beta }_{{rm{plate}}}{{rm{plate}}}_{i}+{beta }_{{rm{mixscape}}}{{rm{Mixscape}}}_{i}end{array}.$$
Demultiplexing donor
Samples were genotyped on an Illumina Multi-Ethnic Genotyping Array (MEGA) or Global Screening Array (GSA). Genotyping quality control, haplotype phasing and whole-genome imputation were done for MEGA as previously described47. Analogous steps were performed for GSA, with further genotyping quality control including PHWE > 1 × 10⁻¹⁰, sample relatedness (IBD) < 0.9 and sample heterozygosity rate > 0.217. All imputed variants were filtered on minor allele frequency > 0.01 and imputation accuracy (Rsq) > 0.9 in both datasets. Variants were further pruned to the intersection of filtered variants between the two genotyping arrays. Non-biallelic variants and variants in sex chromosomes or non-exonic regions were also removed. Demuxlet (v.1.0) was run with default parameters to predict donors from genotypes. Cell donor identity was assigned using the output column SNG.1ST, corresponding to the most likely singlet identity. Cells with ambiguous donor assignments were excluded.
Gene set enrichment analysis
We performed gene set enrichment using fgsea on the results from the linear models predicting differentially expressed genes associated with dosage in the CD45 experiment and polarization status in the IL2RA experiment. We included all genes in the enrichment analysis. Gene ranks were defined according to the sign of the effect size of the associated variable (for directionality) multiplied by −log10P. For the CD45 analysis, we included the MSigDB immunological signatures (C7) pathways48 that were specific to CD4 T cells. We then filtered to the pathways that included between 15 and 500 genes. For the IL2RA analysis, we defined a Treg and TH1 pathway by determining differentially expressed genes in bulk RNA-seq from a previously published source of in vitro polarized T cells37. To perform differential expression analysis between Treg and TH1 samples, we ran DESeq2 with default parameters on the raw counts matrix. We added genes to the polarization pathways if they were nominally significant (P < 0.01) and positively associated (fold change > 1) with the given polarization condition.
Base editor mRNAs
Base editor mRNAs were generated by in vitro transcription using the HiScribe T7 High-Yield RNA synthesis kit (NEB, E2040S) by the method described previously49. NEBnext polymerase was used to PCR amplify template plasmids and install a functional T7 promoter and a 120-nucleotide polyadenine tail. Transcription reactions were set up with complete substitution of uracil by N1-methylpseudouridine (Trilink BioTechnologies, N-1080) and co-transcriptional 5′ capping using the CleanCap AG analogue (Trilink BioTechnologies, N-7113) to generate a 5′ Cap1 structure. mRNAs were purified using ethanol precipitation according to the kit’s instructions, dissolved in nuclease-free water and normalized to a concentration of 2 µg µl−1 using Nanodrop RNA quantification of diluted test samples.
Reporting summary
Further information on research design is available in the Nature Portfolio Reporting Summary linked to this article.
Data availability
The count matrices for the cell lines data are available from Zenodo at https://doi.org/10.5281/zenodo.15935857 (ref. 50). The raw sequencing data for all experiments are available at dbGAP (accession: phs004042.v1.p1). Rates of cells passing quality control and alignment rates for each modality are provided in Supplementary Tables 13–15 and Supplementary Fig. 5. The alignment rates of our data were similar to those of other high-quality datasets, including those from both 10X and other methods, indicating the high quality of the data produced by our method.
Code availability
The scripts for processing the data in this manuscript are available from GitHub at https://github.com/immunogenomics/craft-seq and Zenodo at https://doi.org/10.5281/zenodo.15425510 (ref. 51).
References
-
Sollis, E. et al. The NHGRI-EBI GWAS Catalog: knowledgebase and deposition resource. Nucleic Acids Res. 51, D977–D985 (2023).
-
Southard, K. M. et al. Comprehensive transcription factor perturbations recapitulate fibroblast transcriptional states. Preprint at bioRxiv https://doi.org/10.1101/2024.07.31.606073 (2024).
-
Arbab, M. et al. Determinants of base editing outcomes from target library analysis and machine learning. Cell 182, 463–480 (2020).
-
Baglaenko, Y., Macfarlane, D., Marson, A., Nigrovic, P. A. & Raychaudhuri, S. Genome editing to define the function of risk loci and variants in rheumatic disease. Nat. Rev. Rheumatol. 17, 462–474 (2021).
-
Schaid, D. J., Chen, W. & Larson, N. B. From genome-wide associations to candidate causal variants by statistical fine-mapping. Nat. Rev. Genet. 19, 491–504 (2018).
-
Wang, J. Y. & Doudna, J. A. CRISPR technology: a decade of genome editing is only the beginning. Science 379, eadd8643 (2023).
-
Morris, J. A. et al. Discovery of target genes and pathways at GWAS loci by pooled single-cell CRISPR screens. Science 380, eadh7699 (2023).
-
Martin-Rufino, J. D. et al. Massively parallel base editing to map variant effects in human hematopoiesis. Cell 186, 2456–2474 (2023).
-
Shirley, J. L., de Jong, Y. P., Terhorst, C. & Herzog, R. W. Immune responses to viral gene therapy vectors. Mol. Ther. 28, 709–722 (2020).
-
Raguram, A., Banskota, S. & Liu, D. R. Therapeutic in vivo delivery of gene editing agents. Cell 185, 2806–2827 (2022).
-
Ryu, J. et al. Joint genotypic and phenotypic outcome modeling improves base editing variant effect quantification. Nat. Genet. 56, 925–937 (2024).
-
Papalexi, E. et al. Characterizing the molecular regulation of inhibitory immune checkpoints with multimodal single-cell screens. Nat. Genet. 53, 322–331 (2021).
-
Macaulay, I. C. et al. G&T-seq: parallel sequencing of single-cell genomes and transcriptomes. Nat. Methods 12, 519–522 (2015).
-
Rodriguez-Meira, A. et al. Unravelling intratumoral heterogeneity through high-sensitivity single-cell mutational analysis and parallel RNA sequencing. Mol. Cell 73, 1292–1305 (2019).
-
Yu, L. et al. scONE-seq: A single-cell multi-omics method enables simultaneous dissection of phenotype and genotype heterogeneity from frozen tumors. Sci. Adv. 9, eabp8901 (2023).
-
Olsen, T. R. et al. Scalable co-sequencing of RNA and DNA from individual nuclei. Nat. Methods 22, 477–487 (2025).
-
Nam, A. S. et al. Somatic mutations and cell identity linked by genotyping of transcriptomes. Nature 571, 355–360 (2019).
-
Izzo, F. et al. Mapping genotypes to chromatin accessibility profiles in single cells. Nature 629, 1149–1157 (2024).
-
Hahaut, V. et al. Fast and highly sensitive full-length single-cell RNA sequencing using FLASH-seq. Nat. Biotechnol. 40, 1447–1451 (2022).
-
Shan, X. et al. Deficiency of PTEN in Jurkat T cells causes constitutive localization of Itk to the plasma membrane and hyperresponsiveness to CD3 stimulation. Mol. Cell. Biol. 20, 6945–6957 (2000).
-
Gutierrez-Arcelus, M. et al. Allele-specific expression changes dynamically during T cell activation in HLA and other autoimmune loci. Nat. Genet. 52, 247–253 (2020).
-
Cui, J. et al. Rheumatoid arthritis risk allele PTPRC is also associated with response to anti-tumor necrosis factor alpha therapy. Arthritis Rheum. 62, 1849–1861 (2010).
-
Liu, J. Z. et al. Association analyses identify 38 susceptibility loci for inflammatory bowel disease and highlight shared genetic risk across populations. Nat. Genet. 47, 979–986 (2015).
-
Ishigaki, K. et al. Multi-ancestry genome-wide association analyses identify novel genetic mechanisms in rheumatoid arthritis. Nat. Genet. 54, 1640–1651 (2022).
-
Olafsdottir, T. A. et al. Eighty-eight variants highlight the role of T cell regulation and airway remodeling in asthma pathogenesis. Nat. Commun. 11, 393 (2020).
-
Bonnard, M., Maroun, C. R. & Julius, M. Physical association of CD4 and CD45 in primary, resting CD4+ T cells. Cell. Immunol. 175, 1–11 (1997).
-
Mittler, R. S., Rankin, B. M. & Kiener, P. A. Physical associations between CD45 and CD4 or CD8 occur as late activation events in antigen receptor-stimulated human T cells. J. Immunol. 147, 3434–3440 (1991).
-
Fairfax, B. P. et al. Genetics of gene expression in primary immune cells identifies cell type-specific master regulators and roles of HLA alleles. Nat. Genet. 44, 502–510 (2012).
-
Momozawa, Y. et al. IBD risk loci are enriched in multigenic regulatory modules encompassing putative causative genes. Nat. Commun. 9, 2427 (2018).
-
Schmiedel, B. J. et al. Impact of genetic polymorphisms on human immune cell gene expression. Cell 175, 1701–1715 (2018).
-
Plagnol, V. et al. Genome-wide association analysis of autoantibody positivity in type 1 diabetes cases. PLoS Genet. 7, e1002216 (2011).
-
Langefeld, C. D. et al. Transancestral mapping and genetic load in systemic lupus erythematosus. Nat. Commun. 8, 16021 (2017).
-
Han, Y. et al. Genome-wide analysis highlights contribution of immune system pathways to the genetic architecture of asthma. Nat. Commun. 11, 1776 (2020).
-
Simeonov, D. R. et al. Discovery of stimulation-responsive immune enhancers with CRISPR activation. Nature 549, 111–115 (2017).
-
Goldberg, R. et al. A Crohn’s disease-associated IL2RA enhancer variant determines the balance of T cell immunity by regulating responsiveness to IL-2 signalling. J. Crohns Colitis 15, 2054–2065 (2021).
-
Võsa, U. et al. Large-scale cis– and trans-eQTL analyses identify thousands of genetic loci and polygenic scores that regulate blood gene expression. Nat. Genet. 53, 1300–1310 (2021).
-
Cano-Gamez, E. et al. Single-cell transcriptomics identifies an effectorness gradient shaping the response of CD4+ T cells to cytokines. Nat. Commun. 11, 1801 (2020).
-
Cobaleda, C., Schebesta, A., Delogu, A. & Busslinger, M. Pax5: the guardian of B cell identity and function. Nat. Immunol. 8, 463–470 (2007).
-
Castro, C. D. & Flajnik, M. F. Putting J chain back on the map: how might its expression define plasma cell development? J. Immunol. 193, 3248–3255 (2014).
-
Kluesner, M. G. et al. CRISPR-Cas9 cytidine and adenosine base editing of splice-sites mediates highly-efficient disruption of proteins in primary and immortalized cells. Nat. Commun. 12, 2437 (2021).
-
Kaminow, B., Yunusov, D. & Dobin, A. STARsolo: accurate, fast and versatile mapping/quantification of single-cell and single-nucleus RNA-seq data. Preprint at bioRxiv https://doi.org/10.1101/2021.05.05.442755 (2021).
-
Korsunsky, I. et al. Fast, sensitive and accurate integration of single-cell data with Harmony. Nat. Methods 16, 1289–1296 (2019).
-
Melville, J. et al. The uniform manifold approximation and projection (UMAP) method for dimensionality reduction. arXiv https://doi.org/10.48550/arXiv.1802.03426 (2020).
-
Booeshaghi, A. S., Min, K. H. J., Gehring, J. & Pachter, L. Quantifying orthogonal barcodes for sequence census assays. Bioinform. Adv. 4, vbad181 (2024).
-
Bray, N. L., Pimentel, H., Melsted, P. & Pachter, L. Near-optimal probabilistic RNA-seq quantification. Nat. Biotechnol. 34, 525–527 (2016).
-
Clement, K. et al. CRISPResso2 provides accurate and rapid genome editing sequence analysis. Nat. Biotechnol. 37, 224–226 (2019).
-
Sakaue, S. et al. Tissue-specific enhancer–gene maps from multimodal single-cell data identify causal disease alleles. Nat. Genet. 56, 615–626 (2024).
-
Liberzon, A. et al. Molecular signatures database (MSigDB) 3.0. Bioinformatics 27, 1739–1740 (2011).
-
Chen, P. J. et al. Enhanced prime editing systems by manipulating cellular determinants of editing outcomes. Cell 184, 5635–5652 (2021).
-
Baglaenko, Y., Raychaudhuri, S. & Mu, Z. Data for defining the function of disease variants with CRISPR editing and multimodal single cell sequencing: PTEN, FBXO11, HLA-DQB1. Zenodo https://doi.org/10.5281/zenodo.15935857 (2025).
-
Baglaenko, Y., Curtis, M. & Mu, Z. Precisely defining disease variant effects in CRISPR-edited single cells. Zenodo https://doi.org/10.5281/zenodo.15425510 (2025).
Acknowledgements
This work was supported in part by funding from the National Institutes of Health (R01AR063759, P01AI148102, U01HG012009 and 1R01HG013083) and from GSK.
Ethics declarations
Competing interests
S.R. is a founder of Mestag and an advisor to BMS, Janssen, Pfizer and Bonito Biosciences. D.R.L. is a co-founder of Beam Therapeutics, Prime Medicine, Pairwise Plants, Editas Medicine and nChroma Bio, which use or deliver genome-editing agents.
Peer review
Peer review information
Nature thanks the anonymous reviewers for their contribution to the peer review of this work.
Additional information
Publisher’s note Springer Nature remains neutral with regard to jurisdictional claims in published maps and institutional affiliations.
Extended data figures and tables
Extended Data Fig. 1 Schematic of library generation with CRAFTseq.
Schematic representations of reactions in each step are shown, with detailed explanations on the left. Three modalities are color coded: green for ADT, red for RNA (cDNA) and sky blue for genomic DNA amplicon.
Extended Data Fig. 2 Indexing flow cytometry gating, quality control, and bulk sequencing from mixture of cell lines.
(a) Indexing flow cytometry data is plotted with gating of each population shown (HEK293T PECy7-PB-; Jurkat PECy7+PB−; Daudi PECy7+PB + ). (b) Single cell RNA metrics from both plates. Cells are colored by cell identity as gated in a. Lines represent the 1000 uMI and 1000 gene cutoff used to filter cells in downstream analysis. (c) Percent mitochondrial mRNA UMI per cell per plate. Horizontal line indicates the 10% filtering cutoff. (d) Single cell ADT metrics from both plates. Cells are colored by cell identity as gated in a. Lines represent the 1000 uMI and 120 ADT cutoff used to filter cells in downstream analysis. (e) Plot of the reads per cell ranked in each plate. The horizontal line indicates the cutoff for minimum reads per cell. (f) Histogram of the percentage of each allele per cell in all cells. The horizontal line indicates the 10% allele cutoff. Plots before and after filtering are shown (g) Concordance plots of cell types defined by the different modalities. Color represents total cell number. (h) Correlation plots of CD40 protein expression by ADT sequencing, indexing flow cytometry and gene expression. R values and Pearson correlations are displayed. Color represents cell type as defined by ADT cluster. Normalization approaches described in methods. (i) Log(CP10K + 1) gene expression of PTEN per ADT cluster. Each point represents a single cell (N = 470). P value of nonparametric Kruskal-Wallis test is displayed. Boxes show the interquartile range (IQR), whiskers show the 1.5*IQR. (j) Heatmap of top variable ADTs between clusters scaled and normalized with CLR. (k) Representation of top three alleles recovered from bulk sequencing of PTEN amplicons from Jurkat cells. (l) Frequency of alleles in bulk data and single cell data. For single cell data, allele frequencies represent the mean of the identified allele in all Jurkat cells. In each cell, the percentage of reads per allele (A, B, or C shown in Fig. 1) was calculated. The mean of these values across all Jurkats is shown. The values do not sum to 100 percent as not all Jurkat cell had all three alleles. (m) Location of cell types as defined by ADT clusters across both plates. (n) Location of genotypes as defined by single cell gDNA sequencing of the PTEN amplicon. (o) Barplot of genotypes recovered per column and row. (p) Alleles identified in this data set after filtering. The A allele is the reference allele, which is the only allele that should be identified in Daudi Cells. B and C alleles are mutations identified in Jurkat cells. (q) Index flow cytometry outlining the different cell types and mixtures. (r) Number of cells in each genotype separated by indexing flow cytometry identity. (s) Number of correct genotypes calls in Daudi cells. Correct calls are those with genotype A only. Incorrect calls are everything else.
Extended Data Fig. 3 HDR corrected cells can be identified but are not different from controls.
(a) Representative plots of CRISPR vs control gating based on indexing flow cytometry. Fluorescent conjugated antibodies targeting CD45 were used to discern conditions. Cells were nucleofected with non-targeting RNP and ssODN were stained with PB-CD45 (red). All cells were stained with BV605-CD45. (b) UMAP of the top 3000 variable genes scaled, normalized, and harmonized by plate identifies three clusters (c) UMAP of all ADTs scaled, normalized, and harmonized by plate identifies three clusters. Low quality cells are labelled. (d) Heatmap of top variable genes, scaled and normalized within each cluster. (e) Heatmap of top variable ADTs scaled and normalized in each cluster. (f) Normalized HLA-DQB1 gene expression in HH and Daudi cells between reference and HDR genotypes. Boxes show the interquartile range (IQR), whiskers show the 1.5*IQR. (g) FITC DQB1 MFI in HH and Daudi cells between reference and HDR genotypes. Each dot represents a single cell (N = 329). Boxes show the interquartile range (IQR), whiskers show the 1.5*IQR. HDR corrected cells were all heterozygotes with one reference and one correct allele identified.
Extended Data Fig. 4 Indexing cytometry gating and cluster analysis of FBXO11 edited cells identifies two cell types separated by canonical markers.
(a) Representative plots of CRISPR vs control gating based on indexing flow cytometry. Non-targeting control cells were stained with PB-CD45 (blue). (b) UMAP of the top 3000 variable genes scaled, normalized, and harmonized by plate identifies three clusters. (c) UMAP of all ADTs scaled, normalized, and harmonized by plate identifies three clusters. (d) Heatmap of top variable genes, scaled and normalized within each cluster. (e) Heatmap of top variable ADTs scaled and normalized in each cluster. (f) Linear modeling of genotype and condition effects (Control vs CRISPR) in Jurkat cells. No significant (FDR < 0.05) genotype-specific genes were identified. P values are derived from likelihood-ratio test. (g) Overlap between Jurkat (blue) and Daudi (grey) specific genes. These six genes (HLA-B, MIF, TPI1, GPI, ENO1, DDIT4) may reflect changes independent of CD40L stimulation.
Extended Data Fig. 5 Concordance of pseudobulk and single-cell genotype effect sizes.
(a) Genotype effect sizes from pseudobulk and single-cell eQTL analysis were compared using Deming regression to estimate a scaling beta. (b) Z-score statistics were computed using the likelihood ratio test (LRT) p-value from the single-cell model or the nominal p-value from the pseudobulk model. The LRT p-value compares the null model (without genotype) to the full model (including genotype). Concordance between Z-scores from the single-cell and pseudobulk models was measured using Pearson’s correlation (r). (c) The violin plots represent log(CP10K + 1)-normalized single-cell expressions grouped by genotype dosage for a given gene (N = 445,790 cells), while the box plots show log2(CPM + 1)-normalized pseudobulk expressions per donor grouped by dosage for a given gene (N = 259 individuals). Boxes show the interquartile range (IQR), whiskers show the 1.5*IQR.
Extended Data Fig. 6 Clustering of PTRRC edited cells identifies broad changes in gene expression linked to proliferation and survival.
(a) UMAP of the top 3000 variable genes scaled, normalized, and harmonized by plate identifies three clusters. (b) Scaled and normalized gene expression of PTPRC. (c) Distribution of cells based on condition and genotype in RNA UMAP embedding. (d) Heatmap of top variable genes, scaled and normalized within each cluster. (e) UMAP of all ADTs scaled, normalized, and harmonized by plate. (f) Scaled and normalized ADT expression of CD45. (g) Distribution of cells based on condition and genotype in ADT UMAP embedding. (h) Heatmap of top variable ADTs, scaled and normalized within each cluster.
Extended Data Fig. 7 Gene set enrichment analysis identifies activation and Th1 programs in PTPRC knockout cells.
(a) Normalized enrichment scores of significant G7 immunological pathways in CD4 T cells. P-values are derived from fgsea and are Bonferroni- corrected. (b) Enrichment plot of naïve vs activated CD4 T cells. (c) Enrichment pot of memory CD4 vs Th1 cells. Two-sided p-values are derived from fgsea and are Bonferroni-corrected. (d) Normalized expression of TNFRSF4 by condition and genotype (N = 601 cells). (e) Normalized expression of CD134 by condition and genotype. P-values are derived from likelihood ratio statistics with linear modeling. No differences between control and CRISPR edited cells were detected (FDR > 0.05) (N = 601 cells). In all panels, boxes show the interquartile range (IQR), whiskers show the 1.5*IQR. (f) Representative plots of individual gating based on indexing flow cytometry staining with PE anti-CD81 and APC anti-CD81.Dotted lines represent the gates used to define each individual. (g) Representative plots of CRISPR vs control gating based on indexing flow cytometry of PECy7 anti-CD45. (h) Analysis of PTPRC amplicon from three bulk edited CD4 T cells. N represents non-targeting control and BE represents base-edited samples. A C to T conversion if noted in ~ 50% of reads. Data was analyzed and plotted with CRISPResso2. (i) Comparison of differential gene expression in control vs CRISPR and genotype-dependent analyses. Heatmap of normalized mean gene expression pseudobulked per individual and condition. (j) Comparison of ADT gene expression in control vs CRISPR and genotype-dependent analyses. Heatmap of normalized mean ADT expression pseudobulked per individual and condition. Unadjusted, two-sided P-values from likelihood ratio tests are plotted. Dotted line represents the FDR cut-off of 0.05.
Extended Data Fig. 8 Mixscape analysis.
(a) Heatmap comparing ground truth genotype dosage (x-axis) and Mixscape prediction assignment of a cell’s editing status (NP: non-perturbed, KO: knock-out). This panel predicts FBXO11 editing status in Daudi cells, where CRISPR vs control status was input into the Mixscape model (genotyping blind). Cells below the dotted line refer to predictions made by Mixscape, while cells above the dotted line were input into the Mixscape model as controls. Green reflects correct assignments by Mixscape and red reflects incorrect assignments. Grey reflects either assignments directly supplied to the model rather than predicted by it or, for dosage of 1, assignments that are not possible to define as accurate (i.e. if the biological interpretation of dosage of 1 is better characterized as NP or KO). (b) Same as (a), except genotyping information of Dosage 0 versus Dosage 1 or 2 was input into the Mixscape model. (c) Same as (a), except genotyping information of Dosage 0 or 1 versus Dosage 2 was input into the Mixscape model. (d) Scatterplots showing concordance of differentially expressed gene Z-scores, as calculated from our linear model using sequenced genotype (x-axis) and from an otherwise identical model where cell editing status has been assigned by Mixscape. Each plot refers to different inputs to the Mixscape model, analogous to (A-C). The solid line is the identity line. (e) Barplots displaying percentage of genes identified through differential expression of Mixscape results that are concordant with the results from our linear models using sequenced dosage (pink) and true cell editing status (brown). X-axis refers to the three different inputs supplied to Mixscape. (f-h) Same as (a-c) but for prediction of CD45 editing status in primary T cells. (i) Same as (d) for CD45. Only scatter plots corresponding to (F) and (H) are present due to Mixscape being unable to identify any KO cells in one of the inputs to Mixscape. (j) Same as (e) for CD45. Only bars corresponding to (f) and (h) are present.
Extended Data Fig. 9 Examination of the RPL8 locus using public data identifies one causal variant.
(a-b) Summary of eQTL statistics and posterior inclusion probability from Schmedial et al. Data taken from the fiveX eQTL browser. (c-d) Summary of eQTL statistics and posterior inclusion probability from TwinsUK study. All graphs were downloaded from the publid fiveX eQTL browser. The purple variant is rs2954658 used for CRISPR validation.
Extended Data Fig. 10 Bulk RNA-seq analysis for RPL8 eQTL and PTPRC KO.
(a) Sanger sequencing confirmed base editing of RPL8 eQTL in Daudi cells in all five replicates. Dashed box indicates edited nucleotides. (b) Boxplot for bulk RPL8 expression in non-target control (NTC) and edited samples (N = 5 biological replicates). Boxes show the interquartile range (IQR), whiskers show the 1.5*IQR. (c) Volcano plot showing differentially expressed genes in between NTC and edited samples. Unadjusted, two-sided P value from DESeq2 is shown. (d) CRISPREsso2 quantification of base editing efficiency in samples included in DEG analysis. (e) Boxplot for bulk PTPRC expression in non-target control (NTC) and KO samples (N = 5 individuals in NTC group, N = 4 individuals in KO group). Unadjusted, two-sided P value from DESeq2 is shown. Boxes show the interquartile range (IQR), whiskers show the 1.5*IQR. (f) Genome browser tracks showing knock-down effect of PTPRC gene compared to NTC. (g) Volcano plot showing differentially expressed genes in bulk RNA-seq comparing NTC and PTPRC KO. Unadjusted, two-sided P value from DESeq2 is shown. (h) Top 10 immunological signature pathways enriched in NTC and PTPRC KO samples, respectively.
Extended Data Fig. 11 Clustering of IL2RA variant edited cells identifies two clusters separated by proliferation status.
(a) Heatmap of top variable genes, scaled and normalized within each cluster. (b) Scaled and normalized gene expression of ACTB in RNA UMAP embedding. (c) Scaled and normalized gene expression of MKI67 in RNA UMAP embedding. (d) Distribution of Th1 and Treg polarized cells in RNA UMAP embedding. (e) Percentage of mitochondrial reads per cluster. (f) Total number of UMI per cluster. (g) Total number of genes per cluster (N = 1994 cells). (e-g) P-values are derived from two-sided t-test. Boxes show the interquartile range (IQR), whiskers show the 1.5*IQR. (h) Residuals of MKI67 gene expression per cluster with plate, individual, and library size regressed. (i) Residuals of IL2RA gene expression per cluster with plate, individual, and library size regressed. (j) Residuals of CD25 ADT expression per cluster with plate, individual, and library size regressed. P values are derived from two-sided 1994. (k) Volcano plot of effect sizes of each gene in differential expression analysis between cells in the two polarization conditions (Treg and Th1). Genes upregulated in Treg polarized cells have positive betas, while genes upregulated in Th1 cells have negative betas. Dashed line indicates the critical value by Benjamini-Hochberg correction. P-values are derived from likelihood-ratio test. (l) Enrichment plot of Treg genes from Cano et al. across the differential expression results shown in (k). Unadjusted P-values are derived from fgsea. (m) Same as (l) for Th1 genes from Cano et al. Treg genes are amongst the highly ranked genes with positive betas. Th1 genes are enriched amongst genes with negative betas.
Extended Data Fig. 12 Examples of significant genes in multiplexed editing in PAX5 gene.
(a-c) Boxplots for the effects of each of the eight edited variants on expression of VPREB3, JCHAIN, and CD79B conditioning on all other variants. N = 1,926 cells. (d-e), Boxplots for the effects of each of the eight edited variants on the level of surface proteins CD72 and HLA-DR conditioning on all other variants. N = 1,004 cells. P-values are derived from likelihood-ratio test. (f) B.29 gene score is positively correlated with B.29 genotype. N = 1,926 cells. (g) The number of significant genes of each main effect in the interaction model. (h) Boxplot showing interaction between A edit and B.29 on RPL10 expression. N = 1,926 cells. (i) Boxplot showing interaction between A edit and B.29 on ASTN2 expression. N = 1,926 cells. P-values are derived from likelihood-ratio test. In all boxplots, boxes show the interquartile range (IQR), whiskers show the 1.5*IQR. Outliers are not separately plotted, instead all points are shown. LRT: likelihood-ratio test.
Supplementary information
Rights and permissions
Open Access This article is licensed under a Creative Commons Attribution-NonCommercial-NoDerivatives 4.0 International License, which permits any non-commercial use, sharing, distribution and reproduction in any medium or format, as long as you give appropriate credit to the original author(s) and the source, provide a link to the Creative Commons licence, and indicate if you modified the licensed material. You do not have permission under this licence to share adapted material derived from this article or parts of it. The images or other third party material in this article are included in the article’s Creative Commons licence, unless indicated otherwise in a credit line to the material. If material is not included in the article’s Creative Commons licence and your intended use is not permitted by statutory regulation or exceeds the permitted use, you will need to obtain permission directly from the copyright holder. To view a copy of this licence, visit http://creativecommons.org/licenses/by-nc-nd/4.0/.
About this article

Cite this article
Baglaenko, Y., Mu, Z., Curtis, M. et al. Precisely defining disease variant effects in CRISPR-edited single cells. Nature (2025). https://doi.org/10.1038/s41586-025-09313-3
-
Received:
-
Accepted:
-
Published:
-
DOI: https://doi.org/10.1038/s41586-025-09313-3