
Main
Liquid biopsies targeting cfDNA analytes are emerging as a promising noninvasive diagnostic approach, with clinical potential in prenatal testing11,12, disease diagnosis10,13,14 and transplantation monitoring15,16,17. However, an inability to determine tissues of origin and limited efficiency with low cfDNA abundance as well as profound heterogeneities of genetic variations among patients preclude widespread applications18,19,20,21,22. Plasma cell-free nucleosomes have been assayed by cell-free immunoprecipitation (cfChIP)10,23,24, imaging25, enzyme-linked immunosorbent assay26 and mass spectrometry27 to yield molecular information on diseased cell types. Inference of tissue of origin in plasma cfChIP has been performed on the basis of the assumed positive correlation between trimethylation of K4 of histone H3 (H3K4me3) and gene transcription10. Yet, H3K4me3 is insufficient to interpret gene regulatory mechanisms underlying tissue pathogenesis and changes in cell states without accompanying transcriptional changes28,29,30,31,32,33,34.
Here we develop cf-EpiTracing, an automation platform for capturing a combination of cell-free histone modifications from trace quantities of human plasma with high sensitivity. cf-EpiTracing not only enables early-stage disease detection, but also stratifies patients with lymphoma into subtypes with different molecular underpinnings and disease progression stages as well as therapeutic response. As a proof of concept, cf-EpiTracing-defined epigenetic signatures outperform existing clinical indices in predicting prognosis in patients with colorectal cancer (CRC) or lymphoma.
cf-EpiTracing on an automated platform
We developed cf-EpiTracing, a method implemented on a Biomek i5 automated workstation to capture genome-wide multiple cell-free histone modifications in human plasma (Fig. 1a and Methods). In brief, antibodies against histone modifications were covalently conjugated to paramagnetic beads. To control for batch effect and sample variations, each 25–200 μl plasma sample was spiked with lightly fixed chromatin derived from Drosophila S2 cells. Distinct from cfChIP, in which adapters for PCR amplification and sequencing are attached by on-bead ligation, cf-EpiTracing incorporates barcoded adapters into immobilized DNA fragments via Tn5 transposase tagmentation (Supplementary Tables 1 and 2). The follow-up steps, such as DNA releasing and library preparation, are finished in the same well. Of note, the cf-EpiTracing design relies on a two-round barcoding strategy to achieve high throughput, facilitating the parallel processing of multiple samples in 96-well plates. Simplified procedures allow efficient profiling of cell-free epigenomes in hundreds of samples within 6 h after antibody incubation.

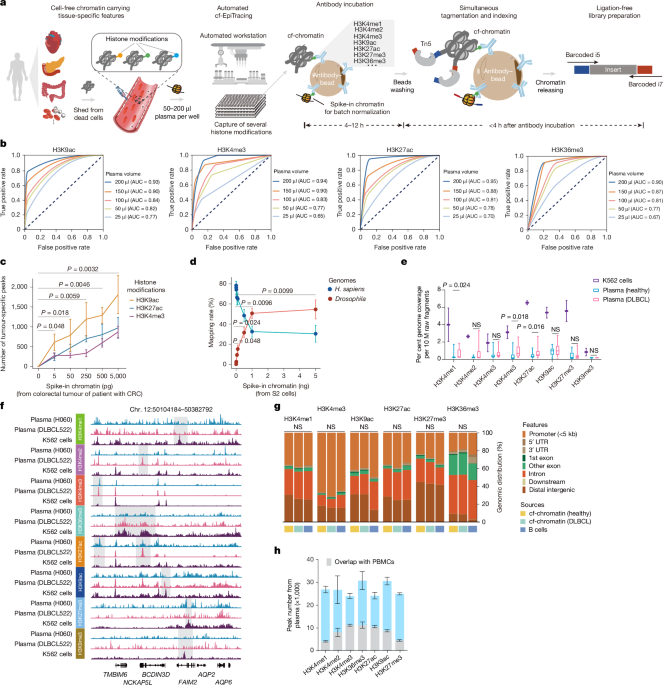
a, The cf-EpiTracing experimental workflow. b, Receiver operating curves for cf-EpiTracing data with varying volumes of human plasma. Merged cf-EpiTracing signals from 200 μl plasma from healthy donors (n = 125) were used as gold standard. c, Plasma from representative healthy individuals (n = 3) was spiked with varying amounts of fragmented chromatin from a colorectal tumour of a patient with CRC (stage III). The top 10,000 peaks were selected for peak calling in both plasma and tumour tissue. P values are shown for H3K9ac. d, Plasma from a representative healthy individual was spiked in with varying amounts of fragmented chromatin of Drosophila S2 cells. The graph shows mapping rate of raw reads to the Homo sapiens or Drosophila genomes. Data represent three biological replicates for H3K4me3, H3K27ac and H3K36me3. e, Normalized genome coverage of peak regions from ChIP–seq data of K562 cells (n = 2) and cf-EpiTracing data from healthy individuals (n = 15) or patients with DLBCL (n = 15). In box plots, the centre line is the median, box edges delineate first and third quartiles and whiskers extend to 1.5× interquartile range. f, Track view of cf-EpiTracing signals for eight histone modifications from a healthy individual (H060, blue), a patient with DLBCL (DLBCL522, pink), and K562 cells (purple). Genomic regions with dynamic signals across three samples are highlighted in grey boxes. g, Genomic feature distribution of cf-EpiTracing peaks of cf-chromatin from healthy individuals (n = 15), patients with DLBCL (n = 15) and ChIP–seq peaks of B cells (n = 3). Mean genomic distribution percentage for each feature was calculated among samples. UTR, untranslated region. h, Peak numbers of multiple histone modifications in cf-EpiTracing profiles from all healthy donors (n = 125). Grey boxes show overlaps with PBMC peaks. Data are expressed as mean ± s.d (c,d,h). P values by t-test (two-sided, c–e) and two-sided Kruskal−Wallis test (g). NS, not significant.
Streamlined cf-EpiTracing enables measurement of various epigenomic modalities with small amounts of sample. After normalization with the spike-in Drosophila chromatin reference35,36, batch effects and sample variations are well controlled and corrected (Extended Data Fig. 1a). cf-EpiTracing demonstrated high peak accuracy with samples ranging from 50 μl to 200 μl (area under the curve (AUC), 0.77–0.95), and lower accuracy with 25 μl samples (Fig. 1b and Extended Data Fig. 1b). To further examine the detection sensitivity of target signals, we performed a titration of fragmented chromatin from CRC tumour tissues or Drosophila S2 cells added into plasma from healthy donors. External signals with as little as 0.005 ng equivalent chromatin were reliably detected in healthy plasma (Fig. 1c,d).
We performed cf-EpiTracing with plasma samples from healthy individuals and from patients with diffuse large B cell lymphoma (DLBCL) for multiple histone modifications, marking active promoters (H3K4me2, H3K4me3, acetylation of K9 of histone H3 (H3K9ac) or H3K27ac), primed and active enhancers (H3K4me1, H3K4me2, H3K9ac or H3K27ac), gene body of active genes (H3K36me3) and repressive regions (H3K9me3 or H3K27me3) (Fig. 1e and Supplementary Table 3). Good reproducibility of cf-EpiTracing data was confirmed in plasma from self-reported healthy donors for each histone modification (Extended Data Fig. 1c). Notably, we observed a high correlation between plasma and blood cells within the same histone modification, with evident distinction between different histone modifications in most cases (Extended Data Fig. 1d).
Furthermore, we benchmarked cf-EpiTracing with cfChIP methods10,23. As expected, Tn5 tagmentation of cell-free chromatin (cf-chromatin) predominantly produced sub-nucleosome patterns (median 123 bp) compared with the directly purified cfDNA or ligation-based cfChIP fragments (median around 170 bp; Extended Data Fig. 2a). Compared with the public cfChIP data from approximately 2 ml of human plasma10, cf-EpiTracing with 200 μl of plasma exhibited overall comparable signals, but a better signal-to-noise ratio and increasing peak accuracy, using either cfChIP or cf-EpiTracing peaks as gold standard (Extended Data Fig. 2b–d). In a pairwise comparison, cf-EpiTracing outperformed cfChIP across different plasma volumes from the same samples (Extended Data Fig. 2e). Next, we determined the abundance of histone modifications in human plasma by examining the normalized genome coverage of peak regions in healthy individuals and patients with DLBCL (Fig. 1e,f). Among eight screened histone modifications, H3K9ac, H3K27ac and H3K36me3 were most prevalent in cf-chromatin. Repressive histone modifications (H3K27me3 and H3K9me3) were abundant in K562 cells but showed limited peaks and coverage in plasma. Patients with cancer exhibited discernible levels of global histone modifications in plasma cf-chromatin, particularly H3K4me1, H3K27ac and H3K36me3, compared with healthy controls (Fig. 1e). Owing to its lower abundance in plasma and relatively limited dynamics across tissues and cells37, H3K9me3 was excluded from further analyses. The cf-EpiTracing data from healthy donors and patients with DLBCL showed similar genomic distribution patterns to those in tissues and primary cells (Fig. 1g). Notably, we observed considerable plasma-specific signals in each histone modification, probably released from non-peripheral blood mononuclear cell (PBMC) remote tissues (Fig. 1h). Together, these results demonstrated that cf-EpiTracing provided an efficient, robust automated framework for genome-wide profiling of multiple histone modifications with high sensitivity using as little as 25 μl of human plasma.
ICSs for inferring tissue of origin
We next initiated integrated analyses to delineate tissue or cell type-specific signatures, referred to as integrated chromatin states (ICSs). These ICSs infer specific regulatory signatures in tissues or cells by jointly quantifying combinatorial presence and absence of histone modifications across the reference epigenome, encompassing 7 histone modifications derived from 65 tissues and primary cells (downloaded from BLUEPRINT38, Roadmap Epigenomics39 and ENCODE40 projects; Fig. 2a, Extended Data Fig. 3a and Supplementary Table 4). Our analysis focused on regulatory regions with the chromatin activity and cell type specificity, rather than relying on each of these histone modifications. We trained an 18-ICS ChromHMM41 model consisting of 13 active and 5 repressed ICSs (Extended Data Fig. 3b,c and Supplementary Table 5). Benchmarking the capacity of distinguishing all 65 tissues and primary cells, we showed that the ICSs, particularly those denoted by H3K27ac, H3K4me3 and H3K9ac, exhibited the highest variability and tissue specificity (Extended Data Fig. 3d). Subsequently, we defined a compendium of tissue-specific signatures comprising thousands of genomic regions for each tissue and cell type (Methods). The ICSs of cf-chromatin were subjected to deconvolution for tissue and cell type-specific signatures and scored for potentially regulated genes, facilitating tracing of tissues or cell types of origin and delineation of regulatory events (Fig. 2a).

a, Schematic of the computational pipeline for identification of tissue-of-origin signatures and disease screening. b, PCA visualization of 10 representative tissues and primary cells (n = 5 each) using signals in genomic regions of signatures for 65 tissues and primary cell types defined by 18 tissue-specific ICSs. Signals in these genomic regions were computed using combined histone modifications from ChIP–seq datasets. c, Heat map showing k-means clustering performance using indicated combinations of histone modifications in tissues and primary cells. d, PCA visualization of patients with DLBCL (n = 15) and healthy individuals (n = 15) using signals in genomic regions for B cell signatures defined by 18 tissue-specific ICSs. Signals in these genomic regions were computed using combined histone modifications from plasma cf-EpiTracing data. e, Heat map showing k-means clustering performance using indicated combinations of histone modifications in plasma. f, PCA visualization (left) and correlation heat map (right) of 10 representative tissues and primary cells (n = 5 each) based on signals in genomic regions for tissue-specific signatures of all 65 tissues and primary cells. Tissue-specific signatures in ICS1 (Znf/Rpts), ICS2 (Het), ICS3 (Quies1), ICS4 (ReprPCWk), ICS5 (ReprPC), ICS8 (Quies2), ICS10 (TxWk) and ICS11 (Tx) were removed from analyses. The signals in these genomic regions of tissue-specific signatures were computed using the top three histone modifications with the highest performance in clustering tissues and cells, as identified in c. g, PCA visualization (left) and correlation heat map (right) for patients with DLBCL (n = 15) and healthy individuals (n = 15) using signals in genomic regions for tissue-specific signatures of B cells. Tissue-specific signatures in ICS1, ICS2, ICS3, ICS4, ICS5, ICS8, ICS10 and ICS11 were removed from analyses. The signals in genomic regions for tissue-specific signatures were computed, using the top three histone modifications with the highest performance in clustering plasma samples, as identified in e.
We first tested the minimum requirement of histone modifications to accurately capture intra-tissue variabilities. We conducted principal component analysis (PCA) clustering on 10 representative tissues and cells, leveraging detected signals in genomic regions of tissue-specific 18-ICS defined signatures (Fig. 2b). Signals were calculated by integrating chromatin immunoprecipitation with sequencing (ChIP–seq) data involving different combinations of histone modifications to generate ICSs for each tissue or cell type. A combination of H3K4me3, H3K9ac and H3K27ac had the largest effect, as evidenced by the decrease upon exclusion of each with normalized mutual information (NMI) and adjusted Rand index (ARI) in k-means clustering (Fig. 2c). Hierarchical clustering analyses further supported the predominant contribution of these three histone modifications in classifying tissues or cell types (Extended Data Fig. 4a,b). Consistent with these results at the tissue and cell level, H3K4me3, H3K9ac and H3K27ac cf-EpiTracing together proved effective in detection of the signatures associated with diseased tissues and cell types in patients with cancer (Fig. 2d,e and Extended Data Fig. 4c,d). Notably, we observed no substantial loss of accuracy in unsupervised clustering of tissues and cell types or plasma samples when adopting these top three contributing histone modifications in the integration analyses (Extended Data Fig. 4e,f).
The ChromHMM framework effectively leverages state transition probabilities to accurately infer chromatin states, even when using a subset of histone modifications. We noted that inferring 18 ICSs solely through integrating these top three contributing histone modifications provided limited interpretation of ICSs associated with heterochromatin and transcriptional repression. These ICSs are less distinguishable by signals in H3K4me3, H3K9ac and H3K27ac. Therefore, we prioritized the selection of the ten most informative ICSs that are fully characterized using H3K4me3, H3K9ac and H3K27ac (ICS6, ICS7, ICS9 and ICS12–18) in downstream applications. Our data showed that exclusion of other chromatin states, which could not be directly distinguished by these three histone modifications, did not materially affect the performance of cf-EpiTracing in classifying tissues, cells and plasma samples (Fig. 2f,g).
Tracing patient tissue-specific lesions
We assessed the accuracy and specificity of cf-EpiTracing in capturing tissue-of-origin signatures across diverse patient cohorts. These cohorts included age-matched healthy individuals (n = 125) and patients with CRC (n = 107), coronary heart disease (CHD; n = 23) and various subtypes of B cell lymphoma (n = 309; Extended Data Fig. 5a), spanning various stages of in-treatment and pre-treatment from multiple clinical centres (Supplementary Table 6). Our unbiased screening quantified genomic regions for tissue-specific signatures and nominated primary diseased, affected and involved tissues across the body (Fig. 2a and Methods). To assess the sensitivity, we first ascertained the detection of elevated tissue signatures, which were well-correlated with diseases. As expected, we observed prominent signatures from digestive tissues, cardiac tissues and B lymphoid cells in the cf-chromatin of patients with CRC, CHD and B cell lymphoma, respectively (Fig. 3a and Extended Data Fig. 5b,c). Tissue signature ICSs associated with primary diseased tissues readily differentiated patients from healthy individuals and from one another in the generalized linear models (GLMs; Methods). The GLM classifier exhibited robust performance in distinguishing patients with CRC (AUC = 0.965; sensitivity=0.864; specificity=0.924), CHD (AUC = 0.971; sensitivity=0.800; specificity=0.963) and B cell lymphoma (AUC = 0.963; sensitivity=0.839; specificity=0.962) from other individuals in testing groups (Fig. 3b). A global survey of tissue signatures across disease types versus healthy individuals revealed evident signatures from the immune system in addition to the signatures from the primary diseased tissues, indicating possible inflammation and immune dysregulation in patients (Fig. 3c)

a, Heat map showing tissue-of-origin signals from diseased tissues (colorectum, heart and lymphocyte) across healthy individuals and patients with CRC, CHD or lymphoma. Rows are representative tissue signature ICSs associated with diseased tissues. The heat map was scaled by row. b, Receiver operating characteristic (ROC) curves showing binary classification performance of tissue signatures associated with primary diseased tissues in patients with CRC, CHD or lymphoma in the training (80% of samples) and test (20% of samples) groups. GLMs were used. Non-CRC individuals refer to all healthy individuals and patients with CHD or lymphoma collectively. Non-CHD individuals refer to all healthy individuals and patients with CRC or lymphoma collectively. Non-lymphoma individuals refer to all healthy individuals and patients with CRC or CHD collectively. c, Top five tissue-specific ICSs with highest log2-transformed fold change in patients compared with healthy individuals. d, Heat map showing mean tissue enrichment scores for ten representative tissues for individuals from different groups. The heat map was scaled by row. e, Exemplification of the comparison of identified affected tissues between cf-EpiTracing and corresponding clinical data. Heat map showing prevalence of organ involvement of ten representative organs in patients with lymphoma or CRC. Organ involvements were assessed by CT and PET–CT. f, Violin plots showing tissue enrichment scores for representative organs in patients with (n = 27) or without (n = 180) evidence of involvement of corresponding organs, as well as in healthy individuals (n = 125). In box plots, the centre line is the median, box edges delineate first and third quartiles and whiskers extend to 1.5× interquartile range. P values by two-sided t-test. g, Spider plots showing tissue enrichment scores for ten representative organs in healthy individuals, and patients with CRC, CHD or lymphoma. Five representative individuals are shown in each panel. Tissue enrichment scores for all individuals are shown as heat maps in Extended Data Fig. 5i.
We next showcased the application of cf-EpiTracing in non-cancer disease, exemplified by inflammatory bowel disease (IBD), which affects the same organ as CRC. The significant signals identified from colorectal tissues of patients with IBD were intermediate between those from patients with CRC and those from healthy individuals (Extended Data Fig. 5d). Although IBD and CRC affect the same organ, patients with IBD can be readily distinguished from patients with CRC (Extended Data Fig. 5e).
The onset of disease often entails the involvement of additional tissues beyond the primary pathogenic sites, underscoring the necessity for an unbiased evaluation of tissues as many as possible. To monitor epigenetic signatures from primary diseased, affected or involved tissues individually without reference to any available clinical information, we developed a screening model to achieve unbiased determination of pathogenic tissues by gating patient plasma tissue-of-origin signatures with healthy counterparts. In brief, we observed that signals in tissue-signature ICSs followed a normal distribution in the healthy population (Extended Data Fig. 5f,g). Subsequently, we fitted normal distributions for each tissue-signature ICS in healthy individuals for each type of tissues and primary cells, establishing a healthy control reference. Selected tissue-signature ICSs, representing the most markedly altered tissue-derived signals in patients, were identified and used to score tissue enrichment. A higher score indicates a greater degree of deviation from the control (Methods).
Consistently, patients with different diseases exhibited distinct patterns of tissue enrichment scores, which often corresponded with the tissues involved (Fig. 3d). For example, enrichment scores for heart, colorectum and lymphocytes were exclusively elevated in patients with CHD, CRC and lymphoma, respectively. Additionally, we observed distinct patterns of enrichment scores in tissues that were not directly associated with primary diseased tissues. In the case of patients with CRC, noticeable differences were observed in liver, potentially attributed to the increased risk of liver metastasis in patients with CRC42,43. Of note, only three patients with CRC had a clinical diagnosis of liver metastasis at the time of sampling. These findings highlight the sensitivity of the analytic pipeline for detecting signatures that are indicative of early-stage tissue involvement before clinical symptoms become apparent. Similarly, elevated signatures contributed by breast, pancreas and spleen were found in patients with B cell lymphoma, which may be partially explained by the high prevalence of extranodal involvement in patients with lymphoma (Supplementary Table 7). Notably, these changes were consistent with the prevalence of organ involvement revealed by available clinical information (Fig. 3e,f). Correlation between enrichment patterns and bona fide tissue involvement was not tested in patients with CHD, owing to a lack of clinical computed tomography (CT) and positron emission tomography–computed tomography (PET–CT). No significant difference was observed in enrichment scores for irrelevant tissues (Extended Data Fig. 5h). Our diagnostic model accurately identified tissue alterations corresponding to disease types in each screened individual (Extended Data Fig. 5i). For example, healthy individuals did not exhibit evident abnormalities in representative tissues. The most prominently increased signatures in patients with CRC, CHD and lymphoma originated from the colorectum, heart and lymphocytes, respectively (Fig. 3g). Notably, we observed a significant graded distribution of enrichment scores for tissues such as lymphocytes, spleen and liver between healthy individuals of different ages (below 50, 50–70 and over 70 years of age) (Extended Data Fig. 5j,k). This observation suggested an age-related increase in the susceptibility to morbidity associated with tissue lesions, particularly in the immune system.
Precancer detection and CRC prognosis
Tracing tissue-of-origin signals derived from diseased tissues facilitated the accurate classification of colon and rectal cancer subtypes, demonstrating high accuracy even in early-stage disease (Extended Data Fig. 6a–c). Nevertheless, this provided limited insights for therapeutic guidance—particularly in the context of advanced CRC, in which treatment modalities have shown substantial efficacy but predominantly only within limited patient subpopulations44.
We next used cf-EpiTracing for early-stage lesion detection in individuals without cancer and assessment of progression in patients with CRC in a discovery dataset (n = 93 healthy; n = 75 CRC) and then evaluated in an independent validation dataset (n = 32 healthy; n = 32 CRC; Fig. 4a). In addition to deciphering tissue-of-origin signatures in diseases, cf-EpiTracing facilitates the non-invasive assessment of alterations in gene regulatory states by examining cf-chromatin ICSs (Methods). To verify whether CRC-specific ICSs identified in plasma by cf-EpiTracing were indeed contributed by related tumour tissues, we profiled histone modifications in paired plasma and tumorous colorectal tissues from four patients (Fig. 4b). We identified cancer-specific ICSs in each patient compared with healthy individuals, using both cf-chromatin and tissue-chromatin. A significant overlap of cancer-specific ICSs in tumour tissues (average 33.8%) was captured in paired human plasma, but was rarely observed in non-cancer and shuffle controls (Extended Data Fig. 6d–f). For example, pronounced alterations in histone modifications around the CFLAR (which functions in anti-apoptosis45) and CDK19 (which functions in cell cycle46) loci were consistently captured in patient plasma and paired tumour tissues (Extended Data Fig. 6g). Notably, cancer-specific signatures detected from plasma and tumour tissues were well-correlated (Spearman’s ρ = 0.64; Extended Data Fig. 6h). Cancer-specific ICSs in both plasma and tumour tissues exhibited strong heterogeneities among patients, emphasizing the importance of systematic screening and stratification in cancer management (Extended Data Fig. 6i).

a, Flow diagram depicting applications of cf-EpiTracing in non-invasive precancerous lesion detection and prognostic stratification in patients with CRC. b, Venn diagrams exemplifying that a fraction of cancer-specific ICSs in colorectal tumour tissues overlapped with cancer-specific ICSs in matched plasma samples from the same individuals (n = 4). c, Schematic of the study design for training and validation of CRC-Healthy XGBoost classifier. d, Confusion matrices showing the classification performance of the model by comparing prediction and ground truth in training (left) and validation (right) groups. e, Bar plots showing the classification performance of the model in training and validation groups. f, Ridge plot showing performance evaluation of the classification model across training and validation groups, along with CRA samples. Patients with CRA who were predicted to exceed the classification threshold (0.5, grey line) were defined as correctly detected. g, Box plots showing scores of ICS markers used in the XGBoost classifier and clinical indices in healthy individuals (n = 125) and patients with CRA (n = 22) or CRC (n = 107). Blue lines indicate the upper reference limits for clinical indices. In box plots, the centre line is the median, box edges delineate first and third quartiles and whiskers extend to 1.5× interquartile range. h, Heat maps showing the relative scores of CRC-specific ICSs (747, identified by DESeq2 using CRC and healthy samples in the discovery dataset) and CRA-specific ICSs (74, identified by DESeq2 using CRC and healthy samples in the discovery dataset and 22 patients with CRA). Representative ICSs are listed on the right. i, Kaplan–Meier survival curves of progression probability for individuals with CRC-1 and CRC-2 in the discovery (top) and validation (bottom) datasets. P values by hypergeometric test (two-sided, b); two-sided t-test (g); and two-sided log-rank test (i).
To identify cf-EpiTracing markers for early diagnosis, we first interrogated differential ICSs between patients with colorectal precancerous lesions (colorectal adenoma (CRA)) and healthy individuals in the discovery dataset (Extended Data Fig. 6j). As expected, we observed significant activation of transcription factor genes implicated in the cell cycle, proliferation and apoptosis, represented by CDK14, along with repression of tumour suppressor genes such as DICER1 in patients with CRA. We next investigated different epigenetic modalities in coordinating transition from precancerous lesions to tumour. A total of 747 differential ICSs between patients with CRC and healthy individuals were identified in the discovery dataset and used in XGBoost machine learning to establish a CRC–healthy classifier and detect colorectal precancerous lesions (Fig. 4c). The XGBoost model yielded robust CRC–healthy classification performance in both training (accuracy, 0.976) and independent validation group samples (from different hospitals and not used for feature selection or model building; accuracy, 0.922; Fig. 4d,e and Extended Data Fig. 6k). We next tested whether the CRC–healthy classifier could facilitate unbiased assignment of patients with CRA, neither relying on established CRA markers nor including patients with CRA in the training process. This model was next adapted for the detection of patients with CRA by determining whether patients with CRA were more likely to be classified as healthy individuals or patients with CRC (Fig. 4f and Extended Data Fig. 6l). Our model achieved a true detection rate of 77.27% for patients with CRA, outperforming existing clinical indices such as CEA (carcinoembryonic antigen) and CA125 (cancer antigen 125), which performed poorly in distinguishing patients with CRC or CRA from healthy individuals (Fig. 4g). As expected, we observed a significant graded distribution of scores for top-ranking ICSs in the model (for example, MLIP.ICS9 and CCL28.ICS9; Fig. 4g).
Coincident with well-recognized high heterogeneity in patients with CRC, we stratified patients into two subgroups (CRC-1 and CRC-2) based on distinct patterns in 747 differential ICSs in the discovery and validation datasets (Fig. 4h). Notably, we did not effectively resolve patient subgroups based on ages or clinical stages (Extended Data Fig. 6m). Additionally, we identified ICSs associated with key molecules, such as RUNX2, RASA4B and TXNIP, which were exclusively enriched in patients with CRA compared with healthy individuals and patients with CRC in the discovery dataset. These findings were further verified in the validation dataset.
Moreover, we observed significantly different prognoses between patients with CRC-1 and CRC-2 in both discovery and validation datasets, with CRC-1 exhibiting a significantly higher risk of disease progression (Fig. 4i). Collectively, our results suggest that cf-EpiTracing holds great promise as a non-invasive tool for early diagnosis, patient stratification and prognosis prediction, and outperforms currently available clinical indices.
Lymphoma subtyping and prognosis
DLBCL, follicular lymphoma (FL) and mantle cell lymphoma (MCL) are subtypes of B cell lymphoma characterized by different diseased cell types of origin and prognosis (Fig. 5a). These entities are clinically defined through gene expression profiling derived from frozen tissues47. To identify tumour-derived signals indicative of diseased cell type of origin from plasma, we first verified that the cancer-specific ICSs detected by cf-EpiTracing were indeed from related tumour tissues in patients with B cell lymphoma (Extended Data Fig. 7a–h). Indeed, substantial differences were observed among B cell lymphoma subtypes in cf-EpiTracing signals across multiple histone modifications (Fig. 5b). To further explore potential distinction in gene regulation implicated in B cell lymphomas subtypes, we performed differential analysis of ICSs and identified 65, 6 and 8 specific ICSs for corresponding subtypes. We next used hierarchical clustering of patients with B cell lymphoma based on 79 subtype-specific ICSs or differentially expressed genes (DEGs) defined by bulk RNA sequencing (RNA-seq) in tumour tissues (Extended Data Fig. 8a,b). We observed comparable subtyping performance using subtype-specific ICSs compared with RNA-seq defined DEGs (Extended Data Fig. 8c).

a, Schematic of B cell development and associated lymphoma subtypes. b, Track views at representative subtype-specific loci. c, Heat map showing ICS signals of cell type-specific signatures of B cells across B cell lymphoma subtypes. d, Multi-class classification of B cell lymphoma subtypes using ICS signals in B cell-specific signatures. e, Heat map of ICS signals for CD34+ and GCB cell signatures in DLBCL subtypes. f, Classification performance distinguishing DLBCL subtypes on the basis of differential ICS signals of CD34+ and GCB signatures. g, Pseudotime analysis of transformation from FL to DLBCL. Each dot represents a sample from DLBCL (n = 170), FL (n = 65) or tFL (n = 15) from 6 patients at multiple timepoints. h, Heat map of ICS signals for CD34+ (DLBCL) and GCB (FL) signatures, along with correlated ICS marker scores in FL, tFL and DLBCL. Scores for FL and DLBCL are shown as mean values. tFL samples are ordered by CD34+ signature strength. Numbers prefixed by tFL denote patient ID and numbers prefixed by T denote timepoint. i, Transcription factor (TF) motif enrichment in genomic regions with active chromatin states in DLBCL and tFL compared to FL. P values were adjusted by Benjamini–Hochberg correction. j, XGBoost model predicting DLBCL scores in healthy individuals and patients with DLBCL. Dashed lines denote training cut-offs. r.m.s.e., root mean squared error. k, ROC curve and confusion matrix showing classification performance in the validation cohort. l, Multivariate Cox proportional hazards analysis of recurrence risk in DLBCL (27 events in 141 individuals). P values were adjusted by Bonferroni correction in the discovery dataset but not in the validation dataset. Error bars indicate 95% confidence intervals and the centre dot is defined as the hazard ratio. β2-MG, β2-microglobulin; LDH, lactate dehydrogenase; WBC, white blood cell. m, Kaplan–Meier survival curves for overall survival in patients with DLBCL stratified by low or high integrated ICSs or clinical indices. P values by one-sided hypergeometric test (i), two-sided Wald log-likelihood test (l) and two-sided log-rank test (m).
Next, we explored whether de novo detection of cell type-of-origin signatures was sufficient for subtyping patients with B cell lymphoma. We examined the sensitivity of cf-EpiTracing in capturing tissue signatures indicative of disease cell type of origin, by adding varying amounts of plasma from patients with DLBCL to healthy plasma (Extended Data Fig. 8d). A minimal spike-in of 1% DLBCL plasma provided sufficient signals from B cells, supporting the superior sensitivity of cf-EpiTracing (Extended Data Fig. 8e,f). Based on the distinction of cell types-of-origin signatures from CD34-positive cells, naive B cells and germinal centre B cells (GCBs), patients with B cell lymphoma exhibited three well-separated groups, in concordance with corresponding reported diseased cell types of origin (Fig. 5c). Incorporating the relative contributing signals in these three cell type-specific signatures, we observed strong classification performance for distinguishing B cell lymphoma subtypes. Multi-class classification across all patients with B cell lymphoma yielded a multi-class AUC of 0.823 (Fig. 5d). These results highlighted the potential of cf-EpiTracing in non-invasive subtyping of the diseases at cell type resolution.
We used cf-EpiTracing to trace back cell types of origin in two DLBCL subtypes, GCB and non-GCB subtypes. Despite sharing the majority of features, these subtypes differ in their pathogenic cell types of origin. DLBCL subtype-specific ICSs (n = 474 for GCB DLBCL and n = 192 for non-GCB DLBCL) were used in hierarchical clustering heat maps for the assessment of subtyping performance, manifesting overall comparable and even superior classification performance (accuracy, 93.22%) to that using RNA-seq defined DEGs (accuracy, 89.76%) (Extended Data Fig. 8g–i). As expected, we observed increasing signals in cell type-specific signatures of GCBs but decreasing signals in cell type-specific signatures of CD34-positive cells in the GCB subtype (Fig. 5e). This finding is consistent with the fact that GCB DLBCL carcinogenesis originates from GCBs and exhibits lower malignancy compared with the non-GCB subtype48. Hierarchical clustering of patients based on cell type-specific ICSs for GCBs and CD34-positive cells demonstrated the robust performance (accuracy, 90.68%) for distinguishing DLBCL histological subtypes, in which Hans classification was set as gold standard (Fig. 5f).
We next tested whether cf-EpiTracing data were able to uncover the progression of disease subtype transformation. A critical event in the progression of FL involves the histological transformation into an aggressive B cell lymphoma characterized by worse outcome and lower sensitivity to therapy, most commonly DLBCL49. To identify the epigenetic mechanism underlying such pathogenesis, we conducted cf-EpiTracing with 15 samples at various timepoints from 6 patients with transformed FL (tFL) who were clinically diagnosed with partial characteristics of DLBCL. All samples from patients with tFL exhibited an intermediate state along the trajectory of transformation from FL to DLBCL (Fig. 5g). Alongside the path for the gain of cell-of-origin signals for DLBCL (CD34-positive cells) and the loss of cell-of-origin signals for FL (GCBs), we detected 26 ICSs that were significantly linked to the transformation process. This analysis also revealed epigenetic dysregulation in genes associated with lymphocyte proliferation, such as IL17RD and TCF7L2 (Fig. 5h). We set out to identify potential transcription factors involved in such transformation by transcription factor motif enrichment analysis in genomic regions of active chromatin states in patients with tFL or DLBCL compared to patients with FL (Fig. 5i). We showed a progressive enrichment of proliferation-related transcription factors, including BCL6 and MYC, which are well-established markers for clinically assessing prognosis in patients with lymphoma50,51,52. Remarkably, we also noted an increasing enrichment of development-associated transcription factors, such as IRF4 and EBF3, even in early stages of transformation, implicating them as potential pioneer factors in triggering this disease transformation.
Patients with DLBCL display remarkable heterogeneity in clinical stages and prognosis48,53. For early disease detection, we aimed to analyse the difference of magnitude in DLBCL-specific ICSs among patients with DLBCL of different stages (Supplementary Table 7). We established an XGBoost machine learning model to predict DLBCL scores in healthy individuals and patients with DLBCL at different clinical stages based on 432 DLBCL-specific ICSs compared to healthy controls in samples of discovery dataset (Extended Data Fig. 9a,b). Our model revealed a discernible trend, with advanced-stage cases exhibiting higher DLBCL scores compared with early-stage cases as well as healthy individuals in both training and independent validation group samples (Fig. 5j). Using the machine learning model-defined DLBCL score cut-offs for patients with DLBCL of different stages in training group samples, our model achieved overall high classification accuracy in validation group samples for early-stage (stage I and II; accuracy, 0.78) and advanced-stage (stage III and IV; accuracy, 0.89) patients and healthy individuals (accuracy, 0.85), with a multi-class AUC of 0.942 (Fig. 5k and Extended Data Fig. 9c).
Therapies such as R-CHOP (rituximab plus cyclophosphamide, dhorubicin, oncovin and prednisolone) are the standard first-line treatment for DLBCL53. However, only a subset of patients with DLBCL achieve durable benefits from these therapies, highlighting a critical unmet need for reliable biomarkers to predict patient prognosis as early as possible. We attempted to non-invasively assess the treatment response to R-CHOP-like therapies in patients with DLBCL using cf-EpiTracing. A longitudinal follow-up was conducted among participants with DLBCL (n = 141) in conditions of either complete response (n = 44), partial response (n = 60) or stable disease (n = 37) at the time point of sample collection. Recurrence was observed in a subset of patients in the follow-up study after an average of 118.6 weeks (n = 27 events in 141 individuals). Multivariate Cox proportional hazard analysis, starting from 432 DLBCL-specific ICSs, identified 8 markers significantly associated with the risk of future recurrence in discovery dataset after Bonferroni correction (Fig. 5l). These ICSs, predictive of disease progression, were subsequently verified in an independent dataset, showing a significant association with patient prognosis and highlighting the potential broad clinical applicability and generalizability. Notably, no significant association with recurrence was observed by current clinical indices (Fig. 5l and Extended Data Fig. 9d). The performance of the cf-EpiTracing-defined recurrence-associated ICSs in predicting prognosis was next evaluated in the discovery and independent validation datasets using individual recurrence-associated ICSs and integrated ICS scores (Methods). Patients were stratified into high-risk and low-risk groups using cut-offs derived from the discovery dataset. This classification yielded a significant distinction in survival outcomes between two groups (Kaplan–Meier analysis; Fig. 5m and Extended Data Fig. 9e). No significant differences in overall survival were observed between patients with high or low levels of integrated clinical indices (for example, International Prognostic Index (IPI) level). Together, these results affirmed that cf-EpiTracing was capable of disease subtyping, high-resolution early diagnosis and therapeutic outcome prediction in B cell lymphoma.
Genetic and epigenetic changes in MCL
MCL is a malignant neoplasm, putatively driven by the t(11;14) translocation event of immunoglobulin genes and the CCND1 locus, which introduces active chromatin states into target regions such as cyclins, and induces genomic instability and dysregulated gene programs and cell proliferation54,55. To interrogate the relation between genome-wide genetic alternations, epigenetic alternations and pathogenesis, we attempted in-depth analyses of cf-EpiTracing data to simultaneously examine translocation events and cell-free histone modifications (Extended Data Fig. 10a). At the CCND1 locus, downstream of the translocation breakpoint, patients with MCL exhibited markedly increased enrichment of histone modifications at promoters (H3K4me3) and enhancers (H3K4me1, H3K9ac and H3K27ac) compared with healthy individuals (Extended Data Fig. 10b,c). Patients with MCL exhibited significantly increased t(11;14) translocation events at the target locus compared with healthy individuals or patients with FL, highlighting the specificity of cf-EpiTracing to capture pathogenic translocation (Extended Data Fig. 10d and Methods).
To uncover epigenetic alterations involved in MCL lymphomagenesis, we next interrogated epigenetic dysregulation along with the chromosomal translocation in MCL. We observed that a substantial proportion of MCL-specific signatures fell within the enhancers defined by ICSs, indicating that alterations in enhancer chromatin states were the dominant epigenetic responses to chromosomal variability (Extended Data Fig. 10e). Compared with healthy individuals, ICS13 scores of genes within 1 Mb upstream and 1 Mb downstream of the CCND1 locus were significantly increased in cf-chromatin of patients with MCL (Extended Data Fig. 10f). Notably, we observed a significant correlation between the ICS13 scores of these genes and the translocation score defined by the read counts detected with translocation events (t(11;14)) in patients with MCL. These findings further confirmed the interaction of these gene loci with chromosomal translocation events.
Of note, the difference in epigenetic signatures between patients with MCL and healthy individuals decreased with age, suggesting a potential age-dependent disease progression (Extended Data Fig. 10g). Epigenetic heterogeneity among healthy individuals across ages was also tested with ageing-related differential ICSs. Ageing-related ICSs were enriched with biological functions of signal transduction, cell adhesion, cell migration and homeostasis (Extended Data Fig. 10h). By contrast, dysregulated transcription factor genes, such as NEDD4L and CREBBP, which are involved in positive regulation of blood cell proliferation and cell cycle, were over-represented in patients with MCL, but not in healthy older individuals. In conclusion, cf-EpiTracing provided a unique opportunity to simultaneously investigate genomic translocation events and epigenetic alterations in patients with MCL.
Discussion
Here we develop cf-EpiTracing, a high-sensitivity automated platform for the noninvasive detection of pathological alterations in target tissues or cell types of origin. We have demonstrated potential applications in a variety of clinical scenarios, including early disease diagnosis, unbiased screening of affected tissues, disease subtyping, therapeutic response assessment and biomarker discovery.
Unlike transcription-centric approaches, cf-EpiTracing profiles multiple histone modifications as ICSs to predict tissues and cell types of origin. From eight representative marks, we distilled a minimal combination—H3K9ac, H3K27ac and H3K4me3—without loss of accuracy. The automated workflow achieves unprecedented sensitivity with as little as 50 μl plasma. A limitation, however, is that cf-EpiTracing reduces fragment size and loses fragmentomic features such as end motifs and jagged ends; potential sequence bias, as noted in ATAC-seq (assay for transposase-accessible chromatin with high-throughput sequencing), should also be corrected in transcription factor footprint analyses56.
Notably, cf-EpiTracing revealed that, compared to FL and MCL, DLBCL plasma exhibits stronger signals of CD34-positive cells. This may be attributed to the higher aggressiveness and malignancy of DLBCL, leading to bone marrow involvement, disruption of the bone marrow microenvironment and consequently increasing death of bone marrow cells. Patients with DLBCL also display increased levels of inflammatory factors (such as IL-6), which may mobilize CD34-positive cells into peripheral blood. This finding provides new insights for lymphoma subtype identification and treatment, although the underlying mechanisms warrant further study.
In future, cf-EpiTracing could be integrated with other cell-free modalities—including DNA methylation, mutations and topology9,14,57,58,59,60,61,62. Such multi-omic integration promises unprecedented precision in diagnosing complex diseases63,64. In sum, cf-EpiTracing provides an automated framework for measuring plasma cf-chromatin signatures to infer tissues and cell types of origin, and offers new opportunities to study cellular kinetics of disease progression and treatment response in large patient cohorts.
Methods
Patients
The research presented in this study complies with all the relevant ethical regulations at their respective centres. Informed consent was obtained from all individuals or their legal guardians before blood sampling. Blood samples of patients with CRC were collected from Shanghai Tongren Hospital Hongqiao International Institute of Medicine and Ruijin Hospital affiliated to the Shanghai Jiao Tong University Medical School. Blood samples of patients with DLBCL, MCL, FL, tFL, TCL or CHD were collected from Peking University Third Hospital. Blood samples of self-claimed healthy individuals were collected and screened from Peking University Third Hospital and Chinese PLA General Hospital. Blood samples of patients with IBD were collected from Peking University first hospital and Ruijin Hospital affiliated to the Shanghai Jiao Tong University Medical School (Supplementary Table 6). This study was approved by the Ethics Committee of Peking University Third Hospital (S2024679), Ruijin Hospital (S2020384), Renji Hospital (KY2020-180), Chinese PLA General Hospital (S2023-806-01) and Peking University first hospital (S2021-389-001).
Clinical variables
Histological subtypes of each cancer type (DLBCL, MCL and FL) profiled in this study were established according to clinical guidelines using microscopy and immunohistochemistry and served as ground truths for assessing classification performance by trained pathologists. Cell-of-origin subtypes of DLBCL were assessed based on the Hans classifier per World Health Organization (WHO) guidelines65. For B cell lymphoma and DLBCL subtypes profiled in previous studies by RNA-seq, we relied on subtype labels from their respective resources. tFL samples were obtained during the period of morphologic transformation from FL to DLBCL. The transformation was validated through immunohistochemical staining or fluorescence in situ hybridization testing. All lymphoma specimens were re-reviewed and classified according to the WHO classification66. Samples of tFL were excluded from other analyses, except for the transformation analyses in Fig. 5, owing to their unique characteristics as an intermediate stage with high heterogeneities67. Totally, 15 samples from 6 patients with tFL were used in the analysis. Notably, three patients (tFL-1, tFL-2 and tFL-5) underwent longitudinal sampling at various time points throughout the transformation period. CRC, CRA, CHD, IBD and B cell lymphoma samples were from patients in both pre-treatment and in-treatment phases. The primary treatment strategies for patients diagnosed with DLBCL, MCL and FL were R-CHOP-like therapy, R-CHOP/R-DHAP alternating therapy and R/G-CHOP therapy (Supplementary Table 7). Specifically, the in-treatment patients with DLBCL included in our study received a variety of treatment regimens, tailored according to the individual clinical context and response to prior therapies. The majority of patients were treated with standard first-line chemotherapy regimens, such as R-CHOP or R-CHOP-like treatment. Treatment response was evaluated after two cycles of treatment according to Lugano 2014 criteria.
The extranodal involvement sites in patients with B cell lymphoma were determined by PET–CT. Organ involvement sites and metabolic tumour volume in patients with cancer were also determined by CT and PET–CT. Colorectal precancerous lesion in patients with CRA was diagnosed by colonoscopy. True primary diseased tissues and cells in each group of patients were determined according to their primary clinical diagnoses (for example, lymphocytes were determined as the primary diseased tissues or cells in patients with lymphoma). True affected tissues and cells in patients with CRC were determined as organ involvement sites and metastatic organs. True affected tissues and cells in patients with lymphoma were determined as the extranodal involvement sites. Other clinical indices were mostly collected by clinical blood test. Progression-free survival and overall survival were calculated from time of treatment initiation. Overall survival events were death from any cause; progression-free survival events were progression or relapse, unplanned retreatment and death resulting from any cause.
Barcoded Tn5 preparation
The procedure of Tn5 expression, purification and assembly was followed as previously described68,69,70,71. In short, pTXB1-Tn5 was transformed into BL21 (DE3)-competent cells and colonies were selected in 500 ml lysogeny broth (LB) medium and cultured at 37 °C overnight. Tn5 expression was induced by adding 0.2 mM isopropyl-β-d-thiogalactoside when the optical density of the bacteria culture reached 0.5–0.8 and bacteria culture was incubated at 23 °C, 80 rpm for 5 h. Bacterial pellets were collected and lysed by HEGX (20 mM of HEPES at pH 7.2, 0.8 M of NaCl, 1 mM of EDTA, 0.2% Triton X-100 and 10% glycerol) buffer with proteinase inhibitors cOmplete (Roche 04693132001). Bacteria were lysed by brief sonication. Genomic DNA in the lysate was precipitated by addition of polyethyleneimine (Sigma P3143) and clear lysate was incubated with 5 ml chitin rosin (NEB S6651L) at 4 °C for 1 h with rotation. The lysate–chitin rosin mix was loaded into a 10 ml column and washed with HEGX buffer. Following this, HEGX buffer containing 100 mM DTT and Roche cOmplete proteinase inhibitor was added to the column and incubated at 4 °C for 36 h. The eluted Tn5 protein solution was dialysed against 2× dialysis buffer (100 mM HEPES at pH 7.2, 0.2 M NaCl, 0.2 mM EDTA, 2 mM DTT, 0.2% Triton X-100, 20% glycerol), and then concentrated by centrifugation.
Assembly of Tn5 transposome was described previously68,70,72. In brief, all oligonucleotides (Supplementary Table 2) were dissolved in TE buffer (5 mM Tris pH 8.0, 5 mM NaCl, 0.25 mM EDTA) to make 200 μM stock solution. To anneal adapters, each T5 or T7 oligos were mixed with equal volume of MErev oligo, placed at a thermal cycler for 5 min at 95 °C followed by programmed temperature decrease at 0.1 °C s−1 to 75 °C, and left in 75 °C water to naturally cool down to room temperature. The 37.5 μM barcoded Tn5 transposome complex was obtained by adding 37.5 μM annealed adapters, 37.5 μM transposase Tn5 and storage buffer (50 mM HEPES pH7.2, 100 mM NaCl, 0.1 mM EDTA, 1 mM DTT, 0.1% Triton X-100, 60% glycerol) and incubating at 25 °C for 60 min. The assembled Tn5 transposome was stable and could be stored −20 °C for at least half a year.
Plasma sample collection
Blood samples were collected in K2 EDTA tubes, transferred to ice and added proteinase inhibitors cOmplete (Roche 04693132001) and 10 mM sodium butyrate (Sigma) within 4 h. The blood was centrifuged (1,500g, 10 min, 4 °C) to remove blood cells. Supernatant was transferred to a new tube and centrifuged again (3,000g, 10 min, 4 °C). The supernatant plasma was used freshly or flash frozen and stored at −80 °C.
Spike-in chromatin preparation
It is important to note that chromatin was used in two distinct contexts for entirely different purposes in this study. First, each plasma sample in 96-well plates was spiked with a constant amount of S2 chromatin to serve as a technical control (spike-in control, the analytic pipelines can be found in Supplementary Note). Second, in a separate application, varying amounts of S2 cells (original commercial source: Thermofisher, R69007) or CRC tumour-derived chromatin were added to assess the sensitivity of cf-EpiTracing in detecting external chromatin apart from human healthy plasma. Cell line identity was assessed based on characteristic morphology and growth properties, and all cell lines tested negative for mycoplasma contamination.
Spike-in S2 chromatin for normalization were prepared as previously described by sonication36,73,74,75. In brief, 1 million fixed S2 cells (fixed in 1% FA on ice for 5 min) were resuspended in 500 µl hypotonic buffer (0.3% SDS, 20 mM HEPES, pH 7.9, 10 mM KCl, 10% glycerol, 0.2% NP-40) by pipetting and incubated on ice for 20 min. Pellets were collected by centrifugation at 3,000g for 5 min, then resuspended in 30 μl of nuclei lysis buffer (1% SDS, 10 mM EDTA, 50 mM Tris-HCl, pH 8.0), and lysed at 4 °C for 30 min. The sample was mixed with 70 μl of dilution buffer (0.01% SDS, 1% Triton X-100, 2 mM EDTA, 20 mM Tris-HCl pH 8.0, 200 mM NaCl) and transferred to 200 μl PCR tube. Chromatin was sheared into fragments of about 300 bp with a Qsonica Q800R2 sonicator. After centrifugation at 20,000g for 15 min, the supernatant was subpackaged and stored at −80 °C, which could be directly used in cf-EpiTracing. The DNA representation in the sonicated chromatin was quantified after phenol-chloroform extraction using Qubit. Specifically, the sonicated S2 chromatin, derived from approximately 3,000 S2 cells (equivalent to about 1 ng of DNA), was spiked into each well containing 200 µl human plasma. Native cfDNA is estimated to be present at approximately 1 to 5 ng in 200 µl of plasma. Consequently, the estimated ratio of spike-ins (sonicated fixed S2 chromatin) to native cfDNA in plasma would be approximately 0.2 to 1.
Spike-in CRC tumour chromatin and S2 nucleosomes for sensitivity analyses were prepared as previously described by MNase digestion. In brief, cells were resuspended in 200 μl nuclei extraction buffer (20 mM HEPES pH 7.5, 150 mM NaCl, 2 mM EDTA, 0.5 mM spermidine, 0.05% digitonin, 0.01% NP-40, 1× protease inhibitors, and 2% BSA) and incubated for 3 min on ice to extract nuclei76. Nuclei were then centrifuged at 600g for 3 min and resuspended in 20 μl nuclei lysis buffer. The sample was mixed with 20 μl of MNase reaction buffer (2× Micrococcal Nuclease Buffer, 2 mM DTT, 4 U μl−1 MNase). Reaction was activated at 37 °C for 5 min. 8 µl stopping buffer (50 mM EDTA, 0.5% Triton X-100, 0.5% DOC) were added and the reaction was incubated on ice for at least 15 min to stop the MNase digestion. Digested nucleosomes were subpackaged and stored at −80 °C.
cf-EpiTracing experimental procedure
Antibodies were conjugated to magnetic beads (Invitrogen 14301) according to the manufacturer’s instruction, including anti-H3K4me1 (Diagenode C15410194), anti-H3K4me2 (Diagenode C15410035), anti-H3K4me3 (Diagenode C15200152), anti-H3K27ac (Abcam ab4729), anti-H3K9ac (Active Motif 91103), anti-H3K36me3 (Active Motif 91265), anti-H3K27me3 (Cell Signaling 9733S) and anti-H3K9me3 (Abcam ab8898). Conjugated antibody–beads were stored in antibody storage buffer (0.05% sodium azide in PBS) at 4 °C.
Approximately 0.05 mg antibody–beads (with about 1 µg antibody), proteinase inhibitors cOmplete, 10 mM sodium butyrate and S2 chromatin were added into 200 µl plasma. Rotating the mixture overnight at 4 °C allowed capturing of cf-chromatin on antibody–beads. Beads were magnetized and washed three times with cold wash buffer (50 mM Tris-HCl, pH 7.4, 150 mM NaCl, 0.5% Triton X-100, 2 mM EDTA, 10 mM sodium butyrate) and once with 10 mM Tris-HCl, pH 7.4. Antibody–beads were then resuspended in 10 µl tagmentation buffer (10 mM MgCl2, 10 mM TAPS-NaOH, pH 8.5, 100 nM Tn5 with barcodes). Reaction was activated at 37 °C for 30 min. Two microlitres of lysis buffer (60 mM Tris-HCl, pH 8.0, 60 mM EDTA, 0.25% SDS, 0.6 mg ml−1 Proteinase K (Qiagen)) were added and the reaction was incubated at 55 °C for 15 min to stop tagmentation and digest proteins. Five microlitres of quench buffer (60 mM MgCl2, 0.36% Triton X-100, 4 mM PMSF) was added and incubated at 37 °C for 15 min.
To each well, 30 µl PCR mix (10 µl 5× KAPA High GC enhancer buffer, 1.5 µl 10 mM dNTP Mix, 1 µl 25 mM MgCl2, 0.5 µl 1U µl−1 KAPA HiFi DNA polymerase, 17 µl H2O) and 1.5 µl 10 mM i5 index primer and 1.5 µl 10 mM i7 index primer were added (Supplementary Table 2). PCR enrichment was performed in a thermal cycler: 1 cycle of 72 °C for 5 min; 1 cycle of 95 °C for 3 min; 21 cycles of 98 °C for 20 s, 65 °C for 30 s, 72 °C for 1 min; 1 cycle of 72 °C for 5 min, hold at 4 °C. Product was purified by 1.2× AMPure XP beads (Beckmann) twice and now ready for sequencing. The libraries were sequenced with paired-end 150-bp reads on the DNBSEQ-T7 platform.
To adapt to automated platforms, we optimized several steps of cf-EpiTracing experiments. In brief, we increased the volume of tagmentation buffer and lysis buffer to reduce DNA loss during automated operation. We also optimized running parameters such as prewetting tips, tip touching in dispensing, dispensing speed and dispensing height from the bottom of the tube. To avoid bubbles during liquid transfer, we disabled air blowout parameter in aspiration, and slowed down aspiration speed. The silicone soft cover, PCR plate, and matching ring-shaped magnetic stand were used in the automated pipeline. In addition, we used two heating oscillators alternately to control the temperature and reduce waiting time.
In situ ChIP with tumour tissues
In situ ChIP was performed as previously described70. Tissues were crushed into pieces with an automated homogenizer (IKA), washed twice with PBS to remove blood, and then resuspended in 100 µl antibody buffer (20 mM HEPES pH 7.5, 150 mM NaCl, 0.5 mM Spermidine, 1× cOmplete inhibitor (Roche), 10 mM sodium butyrate, 0.07% Triton X-100, 0.01% Digitonin, 2 mM EDTA). Antibodies (anti-H3K4me3, Diagenode, C15200152, 1:100 dilution; anti-H3K9ac, Active Motif, 91103, 1:100 dilution; anti-H3K27ac, Abcam, ab4729, 1:100 dilution) were added to each group of tissue and incubated at 4 °C overnight. Tissues were washed twice with washing buffer (20 mM HEPES pH 7.5, 150 mM NaCl, 0.5 mM spermidine, 10 mM sodium butyrate) with 0.01% digitonin. Samples were resuspended in 100 µl antibody buffer with secondary antibodies (Donkey anti-rabbit-Alexa 488 (1:500 dilution; Invitrogen, A32790) and Donkey anti-mouse-Alexa 555 (1:500 dilution, Invitrogen, A31570)), and incubated at 4 °C for 30 min, followed by washing twice with wash buffer with 0.01% Digitonin. Finally, samples were suspended with 100 µl washing buffer with 0.07% Triton X-100 and 0.01% Digitonin, 1× cOmplete inhibitor, and 3 µg ml−1 PAT-MEAB. The tissue pieces were incubated at 4 °C for 1 h and washed with 180 µl washing buffer with 0.01% Digitonin and 0.05% Triton X-100. Reaction was activated by suspending samples with 50 µl reaction buffer (10 mM MgCl2, 10 mM TAPS-NaOH, pH 8.5, 1× cOmplete, 10 mM sodium butyrate), followed by gently flicking and incubated at 25 °C for 1 h in a PCR cycler. To stop the reaction, 40 µl 40 mM EDTA was added, followed by further incubation at room temperature for 15 min. Samples were washed twice with 0.1% BSA/PBS. Samples were finally resuspended with 20 µl lysis buffer (10 mM Tris-HCl, pH 8.0, 0.05% SDS and 0.1 mg ml−1 Proteinase K), and incubated at 55 °C for 10 h, then 85 °C for 30 min to deactivate Proteinase K. Four microlitres of 1.8% Triton X-100 was added and incubated at 37 °C for 30 min to quench SDS.
Five microlitres of tissue lysates of each sample was divided into a new tube. To each well, 42 µl PCR mix (10 µl 5× KAPA High GC enhancer buffer, 1.5 µl 10 mM dNTP Mix, 1 µl 25 mM MgCl2, 0.5 µl 1U µl−1 KAPA HiFi DNA polymerase, 19 µl H2O) and 1.5 µl 10 mM Nextera index i5 primer and 1.5 µl 10 mM Nextera index i7 primer were added. PCR enrichment was performed in a thermal cycler: 1 cycle of 72 °C for 5 min; 1 cycle of 95 °C for 3 min; 16 cycles of 98 °C for 20 s, 65 °C for 30 s, 72 °C for 1 min; 1 cycle of 72 °C for 5 min, hold at 4 °C. Product was purified by 1× AMPure XP beads. Size selection was carried out by first 0.5× AMPure beads to remove >1 kb fragments, and second 0.5× AMPure beads to the supernatant to obtain 200–1,000 bp fragments. The libraries were sequenced with paired-end 150-bp reads on the DNBSEQ-T7 platform.
Mapping, visualization, peak calling, correlation and heat maps
We filtered out sequencing reads by indexing barcode sequences with any mismatch. After removing adapters and low-quality bases by cutadapt (v.1.11), paired-end cf-EpiTracing reads were mapped to the human reference genome hg19 and Drosophila reference genome dm3 using Bowtie2 (v.2.2.9)77. Uniquely mapped reads with map quality greater than 30 were used for the following analyses, using Samtools (v.1.9). PCR duplicates were removed by Picard (v.2.2.4) (http://broadinstitute.github.io/picard). Only uniquely mapped, non-duplicated reads were used for analysis. To visualize cf-EpiTracing signals, we used Deeptools BamCoverage (v.3.5.1)78 to normalize and calculate coverage in continuous 50-bp bins in bam files and generated track files (bigwig format). cf-EpiTracing signals were visualized in track view using Integrative Genomics Viewer (v.2.3.59)79. Heat maps and average curves were generated using Deeptools (v.3.5.1). Peaks were identified using MACS2 (v.2.1.1)80 with the parameter setting (–nolambda –nomodel –broad) with different cut-offs for different histone markers. Peaks with distance within 1,000 bp were merged for further analysis. Genomic correlations were calculated using normalized average signals in either genomic windows, transcription start site (TSS) regions or peak regions by multiBigwigSummary function in Deeptools.
Receiver operating characteristic curve for accuracy
We assessed the quality of cf-EpiTracing data generated from 25–200 µl of plasma by constructing ROC curves (as shown in Fig. 1b), and conducted benchmarking analyses between cfChIP and cf-EpiTracing (as shown in Extended Data Fig. 2b). Sensitivity analyses focused on the peak regions of H3K4me3, H3K9ac, H3K27ac and H3K36me3 signals, which were used as the primary regions for subsequent analyses. The benchmarking analyses concentrated on the peak regions of H3K4me1, H3K4me2, H3K4me3 and H3K36me3 signals, which were also characterized in previous cfChIP analyses10. In each histone modification comparison, comparable sample sizes were used. cf-EpiTracing was performed with 200 µl of plasma, and cfChIP was performed with approximately 2 ml of plasma, using either cf-EpiTracing or cfChIP profiles as gold standard.
We focused on signal peaks on promoter regions (defined as 10,000 bp upstream and 10,000 bp downstream of a TSS for H3K4me1, H3K4me2, H3K4me3, H3K9ac and H3K27ac, and gene body regions in the hg19 genome for H3K36me3). The gold standard true positives were defined as the set of high-confidence peaks on either promoter regions or gene body regions identified in merged data. The set of promoter regions that did not overlap with any peaks was defined as the gold standard negative set. Using the gold standard sets, the following quantities were defined to compute the ROC curve: true positives (TPs), peaks that were supported by the gold standard positive set; false positives (FPs), peaks that were not supported by the gold standard positive set; false negatives (FNs), gold standard positives that were not called peaks in an experiment; true negatives (TNs), peaks that were not called in an experiment and were in the gold standard negative set. True positive rate (TPR) was defined as TP/(TP + FN) and false positive rate (FPR) was defined as FP/ (FP + TN). ROC curves were generated by computing TPR and FPR values on prediction sets obtained by varying the peak-calling threshold, as described in previous studies81,82.
Integrated analysis of multiple histone modifications
To capture the significant combinatorial interaction between different histone modifications in their spatial context (ICSs) across collected epigenomes, we used ChromHMM (v.1.23)41,83, which was based on a multivariate hidden Markov model. A ChromHMM model applicable to all collected epigenomes of tissues and primary cells was learned by virtually concatenating consolidated data corresponding to the core set of seven chromatin marks (H3K4me1, H3K4me3, H3K9ac, H3K9me3, H3K27ac, H3K27me3 and H3K36me3) assayed in all reference epigenomes (Supplementary Table 4). For each consolidated ChIP–seq dataset, read counts were computed in non-overlapping 200-bp bins across the entire genome. Each bin was discretized into two levels, 1 indicating enrichment and 0 indicating no enrichment. We decided to use an 18-state model for all further analyses as they retained all the key interactions between these chromatin states. The trained model was then used to compute the posterior probability of each state for each genomic bin in epigenome of both plasma samples and reference (tissues and primary cells). For each epigenome, chromatin states were labelled in 200-bp resolution using the state with the maximum posterior probability on corresponding regions.
Definition of tissue-specific sites with ICSs
To define tissue-specific sites of ICSs, we examined the specificity of every genomic 200-bp bins. For each site, we judged whether it was tissue-specific of certain chromatin states by examining whether they were exclusively labelled in one tissue or primary cell. Specifically, tissue-specific regions were defined by the criteria that the posterior probability on corresponding regions were higher than 0.9 in only 1 tissue or primary cell and lower than 0.1 in other tissues and primary cells. For example, region A was labelled as ICS 1 (ICS13) in tissue C, which was unique in tissue C among all tissues and primary cells. In this case, region A was the tissue-specific region of tissue C in ICS13. For each tissue or cell type, there were various tissue-specific genomic regions defined by 18 ICSs. To this end, we obtained tissue-specific sites (tissue signatures) of all 65 tissues or cells in 18 ICSs.
Calculation of signals of tissue signatures for plasma samples
We first used bed format files containing genomic distribution regions of selected histone modifications (H3K4me3, H3K9ac and H3K27ac) for defining genome-wide ICSs. Genomic regions were discretized into two levels, 1 indicating enrichment and 0 indicating no enrichment, using the BinarizeBed function of chromHMM. Binary files were next input into 18 chromatin states as described above and genomic annotation was performed in 200-bp resolution, using MakeSegmentation function of ChromHMM and makewindows function of bedtools (v.2.30.0)84. In each ICS, we searched for events that cf-chromatin from plasma captured tissue-specific signals. For example, region A was annotated with ICS 13 in tissue C, which was unique in tissue C compared to other tissues and cell types. Region A was the tissue-specific region of tissue C in ICS13. The detection of ICS13 labelling in this genomic region in plasma samples was defined as the event of capturing tissue-specific signals in tissue-signatures. ICS13 of tissue C. We summarized the counts of such events across 18 ICSs, resulting in a vector containing 1,170 values (tissue–signatures.ICSs, 65 tissues or cell types multiplied by 18 ICSs). This matrix represents the captured events in tissue-specific regions across the 65 tissues and primary cells for 18 ICSs. The scores in this vector are referred to as signals for tissue signatures.
Unsupervised clustering analyses
We performed unsupervised clustering analyses to compare the contribution of each histone modification in accurately clustering tissue/primary cell samples (from bulk ChIP–seq data) and plasma samples (cf-EpiTracing data from patients with DLBCL and healthy controls). For tissue and cell clustering, signals from genomic regions representing tissue-specific ICSs across 65 tissues or cells were computed using combined histone modification data derived from ChIP–seq datasets. For plasma sample clustering, signals corresponding to ICSs specific to B cells (54 tissue-signature ICSs from CD19-positive cells, naive B cells and GCBs) were calculated using combined histone modification data from cf-EpiTracing of plasma samples. To assess the minimal requirements for clustering performance, each of the six histone modifications was respectively excluded from the integrated analysis to evaluate its individual importance.
For each histone modification combination, signals in tissue-specific ICSs, comprising samples from 10 distinct tissue types (with 5 replicates per type in tissue and cell clustering analyses) or 2 distinct plasma sample groups (n = 15 for healthy individuals and n = 15 for patients with DLBCL in plasma clustering analyses), were first transformed and normalized using Seurat (v.4.3.0). log-normalization with a scale factor of 100,000 was applied, followed by the identification of highly variable features using variance-stabilizing transformation. PCA was then performed to reduce the dimensionality of the data and facilitate visualization based on these variable features.
To evaluate clustering accuracy, k-means clustering was applied. In tissues and cell types clustering analyses, samples were partitioned into ten clusters corresponding to the known tissue types. For plasma clustering, k-means partitioned the samples into two clusters, reflecting the known sample groups. Clustering performance was quantified using NMI and ARI, both calculated against the true sample labels, as described in previous studies85,86,87.
A Pearson correlation matrix was generated based on signals from the variable features, and hierarchical clustering was conducted using Euclidean distance. The resulting correlation heat map enabled visual assessment of sample similarity and clustering accuracy. Hierarchical clustering results were further evaluated using NMI and ARI to assess their consistency with the known tissue/plasma classifications.
Identification of differential ICSs
To identify the differential ICSs among different groups of individuals (for example, CRC-specific ICSs compared with healthy individuals), bed format files of selected histone modifications (H3K4me3, H3K9ac and H3K27ac) were used in the definition of genomic ICSs. For group A (for example, patients with CRC) and group B individuals (for example, healthy individuals), genomic regions were first discretized into two levels, 1 indicating enrichment and 0 indicating no enrichment in 5,000-bp resolution. Binary files were next input into 18-state chromatin states as described above and genomic calculation of posterior probability of each ICS were conducted, using MakeSegmentation function of ChromHMM with the additional option “-printposterior”. We annotated genomic 5,000-bp regions with R package ChIPseeker (v.1.5.1)88 based on human genome (hg19). We next preserved genomic regions that were annotated to cover the regions from upstream 20,000 bp of TSS to downstream 20,000 bp of TES genome-wide. These regions may jointly participate in gene regulation of corresponding genes. We summarized scores of 18 ICSs of certain genes by summing score from the same categories. In this way, 18 ICS scores were obtained for each gene, jointly reflecting their regulatory states. Differential analyses of ICS scores between groups of individuals were performed with the R package DESeq2 (v.1.44.0). In brief, a threshold of |log2(fold change (FC))| = 1 and adjusted P value = 0.05 was applied in identification of differential ICSs, using the Benjamini–Yekutieli procedure to control for false discoveries.
Selection of ICSs in downstream diagnostic and prognostic analyses
The 18-ICS ChromHMM model was trained using all eight histone modifications from tissue and primary cell samples. This model leverages state transition probabilities to accurately infer chromatin states, even when using a subset of histone modifications41. We determined that the combination of H3K4me3, H3K9ac and H3K27ac, associated with regulatory elements such as promoters and enhancers, was of paramount importance in defining the 18 ICSs. Therefore, subsequent cf-EpiTracing analyses focused primarily on these histone modifications.
Based on the emission probabilities for chromatin state definition and the transition possibilities between chromatin states, ICS1, ICS2, ICS3, ICS4, ICS5, ICS8, ICS10 and ICS11, which were predominantly associated with heterochromatin and gene bodies, were difficult to distinguish from one another using a combination of signals from H3K4me3, H3K9ac and H3K27ac (Extended Data Fig. 3b,c). Consequently, we prioritized the selection of the 10 most relevant ICSs (ICS6, ICS7, ICS9, ICS12, ICS13, ICS14, ICS15, ICS16, ICS17 and ICS18) that could be clearly distinguished using these histone modifications for downstream analyses including diagnostic and prognostic biomarker discovery, unbiased disease screening, patient stratification and subtyping, as well as machine-learning-based classification models.
GLM analyses
To assess the distinguishability of tissue signature-associated ICS signals among patients with CRC, CHD or B cell lymphoma, GLMs were implemented. The entire dataset (n = 125 for healthy individuals, n = 107 for patients with CRC, n = 23 for patients with CHD and n = 309 for patients with B cell lymphoma) was randomly partitioned into two subsets for each classification task: 80% of the samples were allocated for model training, and the remaining 20% were reserved for independent model testing. Differential analyses of tissue-signature ICSs was conducted to identify disease-specific tissue-signatures for CRC, CHD and lymphoma, using 342 tissue-signature ICSs linked to the primary diseased tissues across the three disease categories. The selection process involved comparing each disease group against all other samples in the training dataset.
Separate GLMs were constructed for CRC, CHD and lymphoma using a binomial logistic regression framework, incorporating the respective disease-specific ICS signatures identified from the training dataset. Model parameters were estimated via maximum likelihood estimation, optimizing the log-likelihood function to minimize classification error.
Model performance was assessed using the independent testing dataset, which was strictly withheld from both feature selection and model training phases. Area under the receiver operating characteristic curve was computed to evaluate classification effectiveness.
Development of unbiased screening model
An unbiased screening model was predicated on the assumption that primary diseased tissues and affected or involved tissues increased tissue-specific signals due to elevated levels of excessive cell death and replenishment. This leads to an overrepresentation of tissue-derived signals in patients compared to healthy individuals. For each tissue or cell type, we assigned diseased condition when the signal exceeded a threshold defined by healthy individuals. This method is designed to detect not only cancer-related changes derived from tumour tissues but is also applicable to various other diseases with tissue lesions.
To determine these thresholds, we statistically assessed the distribution of signals from all tissue-signature ICSs (n = 1,170) in healthy individuals using the descdist and fitdist functions in the R package fitdistrplus (v.1.1-11). Our analysis showed that the signals in tissue-signatures ICSs follow a normal distribution in healthy population. A normal distribution was then fitted for each of the 1,170 tissue-signatures ICSs in healthy individuals, with the 90th percentile (upper quantile) used as the threshold to differentiate between outlier and control profiles. For each tissue-signatures ICS, the signal was discretized into two categories: ‘1’, indicating a disease signal (when the signal exceeded the 90th percentile threshold) and ‘0’, indicating a control signal (when the signal was below this threshold).
The tissue enrichment score for each tissue was calculated by summing the disease signals and divided by the total number of selected tissue-signature ICSs for that tissue. Each type of tissue or primary cell is characterized by ten tissue-signatures.ICSs (in ICS6, ICS7, ICS9, ICS12, ICS13, ICS14, ICS15, ICS16, ICS17 and ICS18). Given that some tissues often exhibited concurrent lesions in disease states, we aggregated tissue-signatures.ICSs for these tissues in the calculation of enrichment scores into broader categories. For example, the enrichment score for the colorectum was calculated on the aggregated tissue-signatures.ICSs of colonic mucosa, colon smooth muscle, rectal smooth muscle, rectal mucosa and large intestine. Similarly, heart enrichment scores were generated by combining scores from the right atrium, right ventricle and left ventricle; lymphocyte enrichment scores were calculated from CD19-positive cells, GCBs and naive B cells.
To enhance the detection of signals in diseased tissues, we used random forest-based feature selection to identify tissue-signatures.ICSs that most effectively distinguish patients and healthy controls. Random forest is well-suited for this task as it ranks features by importance without extensive parameter tuning and has been widely used in feature selection. We ran the random frorest algorithm 10 times, each with 100 trees, and used the mean decrease in Gini impurity to assess feature importance. Importance scores from each run were averaged to minimize variance and obtain stable feature rankings. Top 5 features (tissue-signatures.ICSs) with the highest average importance scores were selected to be used in calculating tissue enrichment for each tissue. By narrowing down tissue specific ICSs that contributed most to the differentiation between patient and control groups, we enhanced the ability of our model to distinguish between patients and healthy controls. This scoring enabled screening of 65 tissues and primary cells.
The identification of primary diseased tissues was based on the combined tissue enrichment scores from all categories, with the highest score corresponding to the tissue with the highest likelihood of being diseased. Affected or involved tissues were defined as those tissue categories of elevated enrichment scores.
For example: if we screen liver-specific tissue-signatures.ICSs in a tested sample and find that 3 out of 5 selected liver-specific tissue-signatures.ICSs exceed the 90th percentile threshold defined in healthy individuals. The liver enrichment score in this case is 3/5 = 0.6. Among the enrichment scores for all tissues, the liver shows the highest score, suggesting that the liver may be the primary diseased tissue for this sample.
Detection of tumour-derived signals in plasma
Tumour-derived ICSs of each patient with CRC was identified by performing comparative analyses using ChIP–seq data of tumour (this study) and normal tissues from healthy donors (public data). We defined cancer-specific sites as |log2(FC)| > 1 between ICS scores in tumours and normal tissues. Also, we removed sites in which sums of ICS score in patients with CRC and healthy individuals were lower than 0.5. Notably, the primary diseased tissues of patients with CRC were mainly nominated as colon and rectum. Cancer-specific ICSs in tumours were defined by comparing with both normal colon (colonic mucosa and colon smooth muscle) and normal rectum (rectal smooth muscle and rectal mucosa).
Cancer-specific ICSs in plasma of each patient with CRC were identified by performing comparative analyses using cf-EpiTracing data of plasma from patients and healthy individuals. We defined cancer-specific sites as |log2(FC)| > 1 between ICS scores in plasma from patients and healthy individuals. We removed sites, in which sums of ICS score in patients with CRC and healthy individuals were lower than 0.5.
Tumour-derived signals captured in patient plasma were defined as cancer-specific ICSs detected in both tumour and plasma of patients and healthy individuals. The significance of the overlap was evaluated by hypergeometric test with R function hyper. P value < 0.05 was determined as statistically significant. We used non-cancer controls and shuffled controls in the analyses to verify the high specificity of cf-EpiTracing in detecting tumour-derived signals.
XGBoost machine learning
XGBoost machine learning models were developed to: (1) classify patients with CRC and healthy individuals, and detect early colorectal precancerous lesions (CRA); and (2) diagnose and grade patients with DLBCL at different stages. For each application, the models were designed with clear separation of training and independent validation groups. The models were trained and tuned using only the data from the training group. To optimize model performance, Bayesian optimization was employed to fine-tune key hyperparameters, including max depth, learning rate (eta), gamma, subsample ratio, colsample bytree, min child weight, alpha, lambda and scale pos weight. The optimization process for classification models aimed to maximize the area under the receiver operating characteristic curve and was conducted using ten-fold cross-validation over multiple iterations. For the regression models, optimization aimed to minimize r.m.s.e. through similar cross-validation methods.
Following optimization, the final models were trained on the entire training set using the best hyperparameters as follows:
- a.
CRC-Healthy classification model: max_depth=5, eta= 0.2394864, gamma= 3.821408, colsample_bytree=0.8249388, min_child_weight=3, subsample= 0.5704591, alpha= 0.554617, lambda= 1.593141, scale_pos_weight= 2.569478.
- b.
DLBCL score regression model: max_depth=10, eta=0.3, gamma= 0.279328905137363, colsample_bytree=0.524896209484371, min_child_weight=1, subsample= 0.614474824865937, alpha=1.86492748212796, lambda=2.22044604925031e-16, scale_pos_weight=3.33254521566179.
The models and training codes have been made available at https://github.com/Helab-bioinformatics/cf-EpiTracing. Comprehensive evaluations for overfitting, bias, class imbalance, robustness and reliability were conducted for each model. Overfitting was assessed and controlled through comparison of training and validation accuracy across training iterations (learning curves) and using ten-fold cross-validation in parameter tuning. Bias and class imbalance were evaluated using confusion matrices, while robustness and reliability were measured by accuracy, precision, recall, F1 score and AUC (for classifier model) and mean absolute error, root mean square error (r.m.s.e., for regression model). Performance was assessed in an external validation cohort to further evaluate the reliability and generalizability of the models.
Of note, samples from the validation group were sourced from an independent medical centre and separate patient cohort. CRC samples (n = 75) from the training group were collected exclusively from the Shanghai Tongren Hospital, Hongqiao International Institute of Medicine, and the CRC samples in the validation cohort (n = 32) were obtained from Ruijin Hospital, affiliated with Shanghai Jiao Tong University School of Medicine. Healthy donor samples in the training group (n = 93) were collected from Peking University Third Hospital, with those in the validation group (n = 32) sourced from the Chinese PLA General Hospital. DLBCL samples in both the training (n = 133) and validation groups (n = 37) were obtained from Peking University Third Hospital, but from distinct patient cohorts.
To evaluate the generalization capability of the CRC-Healthy classifier, it was applied to adenoma samples (CRA), which were an unseen subset of precancerous data. Each CRA sample was classified as either CRC or healthy based on a 0.5 probability threshold. Samples with predicted probabilities ≥0.5 were considered correctly detected as CRA.
For the DLBCL score regression model, the expected DLBCL scores for healthy individuals and patients in stages I, II, III and IV were set to 0, 1, 2, 3 and 4, respectively. The Youden index was used to determine the optimal cut-offs for DLBCL scores in the classification of training group samples, and these cut-offs were subsequently applied to the validation group samples (Fig. 5k).
Stratification of prognosis of patients with CRC
Differential analyses identified 747 ICSs that were significantly upregulated in patients with CRC compared to healthy controls in the discovery dataset. Hierarchical clustering of the 747 ICSs was performed on the discovery dataset, which divided patients with CRC into two subgroups, CRC-1 and CRC-2, based on distinct ICS patterns. Unsupervised hierarchical clustering was applied to the validation dataset using the same ICS clusters derived from the discovery cohort. Patients were classified into CRC-1 and CRC-2 based on their ICS profiles, which reflected the clustering pattern observed in the discovery dataset. Kaplan–Meier survival analysis was conducted to compare recurrence-free survival between CRC-1 and CRC-2 subgroups in both the discovery and validation datasets. log-rank tests were used to assess the statistical significance of survival differences between the subgroups. Survminer package (v.0.4.6) and Survival packages (v.2.44-1.1) in R were used for survival analysis.
Disease subtyping analyses in patients with B cell lymphoma
Tissue signatures were quantified by summing the tissue-signatures.ICSs of CD34-positive cells, naive B cells and GCB cells in patients with DLBCL, MCL and FL, respectively. Multi-class receiver operating characteristic analysis was performed to evaluate the performance of classifying B cell lymphoma subtypes (Fig. 5c,d).
Differential analyses were performed across all patients with B cell lymphoma (n = 170 for DLBCL, n = 74 for MCL and n = 65 for FL) to identify ICSs that were exclusively enriched in each lymphoma subtype. A threshold of |log2(FC)| ≥ 1 and an adjusted P value ≤ 0.05 was applied. Hierarchical clustering was subsequently performed on patients to identify three distinct patient clusters, compared with their clinical diagnoses, and assess the clustering’s accuracy (Extended Data Fig. 8a,c). The same analyses were conducted using bulk RNA-seq data from tumour tissues (GSE32018 (GPL6480); Extended Data Fig. 8b,c).
Hierarchical clustering of GCB DLBCL and patients with non-GCB DLBCL was performed using the detected signals in tissue-signature ICSs associated with CD34-positive cells and naive B cells. This unsupervised clustering identified two distinct patient clusters, which were subsequently assigned to either the GCB DLBCL or non-GCB DLBCL subtype based on the signals from GCB cell-dominant ICS and CD34-positive cell-dominant ICS clusters. The subtyping performance was then benchmarked against the Hans classification, which is the clinically recognized gold standard for DLBCL subtyping (Fig. 5e,f).
Differential analyses were performed on all patients with DLBCL with clearly documented clinical records confirming classification as either the GCB (n = 45) or non-GCB subtype (n = 73), to identify ICSs that were exclusively enriched in each DLBCL subtype, using the threshold of |log2(FC)| ≥ 1 and an adjusted P value ≤ 0.05. These two distinct patient clusters by hierarchical clustering were compared to their clinical diagnoses to evaluate the clustering performance (Extended Data Fig. 8g,i). The same analyses were performed using bulk RNA-seq data from tumour tissues (GSE31312 (GPL570); Extended Data Fig. 8h,i).
Identification of recurrence-related ICSs for DLBCL
We initially performed differential analyses to identify ICSs that were significantly upregulated in patients with DLBCL compared to healthy controls within the discovery dataset. A total of 432 ICS candidates were identified using the threshold of |log2(FC)| ≥ 1 and an adjusted P value ≤ 0.05 under Benjamini–Yekutieli correction for further investigation. Each candidate ICS was individually evaluated for its association with DLBCL recurrence using a multivariate Cox proportional hazards model, adjusted for five established clinical indices: clinical stage, age at initial diagnosis, lactate dehydrogenase (LDH) levels, β2-microglobulin (β2-MG) levels, and white blood cell (WBC) counts. These indices are routinely used in clinical practice for disease monitoring and were included as covariates to account for potential confounding effects. Hazard ratios (HRs) with 95% confidence intervals were estimated, and statistical significance was assessed using Wald log-likelihood tests. In total, 8 ICSs were identified as significantly associated with disease recurrence, with an adjusted P values less than 0.05 after multiple testing correction (Bonferroni method). To validate the predictive utility of these ICSs in an independent validation dataset, not used in candidate selection, was used exclusively for external validation. We defined the integrated ICS score as the weighted average of 8 recurrence-related ICSs, with weights corresponding to the log HR values from the discovery dataset, reflecting their relative contribution to prognosis prediction. Prior to obtaining integrated ICS scores, the proportional hazards assumption was verified for each Cox model. The optimal threshold of integrated ICS score for stratifying patients into high- and low-risk groups was determined using maximally selected rank statistics (surv_cutpoint function from the R package maxstat, v.0.7.26) in the discovery dataset. This threshold was subsequently applied to both the discovery and validation datasets for risk stratification.
Kaplan–Meier survival curves were generated to assess whether the individual recurrence-associated ICS and integrated ICS score effectively stratified patients with DLBCL into distinct prognostic groups. Log-rank tests were conducted to compare survival outcomes between high- and low-risk patients. In parallel, similar analyses were performed to evaluate the prognostic value of clinical indices. Specifically, the IPI level cut-off that best separated patients with different survival probabilities was identified within the discovery dataset and subsequently validated in the external validation dataset. IPI was selected as a representative clinical index because it integrates key factors such as age, clinical stage, Eastern Cooperative Oncology Group (ECOG) performance status, and LDH levels, providing a comprehensive assessment of factors that are critical for assessing clinical treatment response.
Pseudo-time analyses
We conducted pseudotime analysis using Monocle3 (v.1.2.9) to delineate sample trajectories based on signals in genomic regions for all 1,170 tissue-signatures.ICSs. Highly variable features (500) identified with the FindVariableGenes function of Seurat was used to estimate similarities between DLBCL, FL and tFL samples. We first clustered and projected the samples on to a low-dimensional space (uniform manifold approximation and projection (UMAP)) in Seurat object. Pseudotimes were calculated according to similarities in the tissue-of-origin signals to reflect sample relationships during transformation. Monocle3 then resolved the FL-DLBCL transformation trajectories and calculated the pseudotime for each sample as shown in Fig. 5g.
Transcription factor motif analysis
In Fig. 5i, we used genomic 200-bp bins that were annotated as active integrative chromatin states (ICS6, ICS7 and ICS9–18) in each tFL sample but annotated as repressive chromatin states (ICS1–5 and ICS8) in 80% FL samples for transcription factor motif discovery for each tFL sample. We used genomic 200-bp bins that were annotated as active integrative chromatin states (ICS6, ICS7 and ICS9–18) in 80% DLBCL samples but annotated as repressive chromatin states (ICS1–5 and ICS8) in 80% FL samples for transcription factor motif discovery for DLBCL. Transcription factor motif analysis was conducted using the HOMER (v.4.11) transcription factor motif discovery algorithm, and P values were adjusted for multiple testing using the Benjamini–Hochberg procedure to control for false discoveries.
Detection of t(11;14) translocation events
The fragment size of cfDNA library was mostly below 150 bp, which was shorter than the sequencing read with the sequencing strategy adopted in this study (PE150). Thus, we assumed that reads capturing translocation event should be one side aligned to chromosome 11 with the other side aligned to chromosome 14, and such reads in whole could not be aligned to the genome. To screen out fragments that met our criteria, for each read that could not be aligned to human genome, we aligned the head 20 bp and the tail 20 bp to hg19 genome, respectively and preserved reads whose one side aligned to chromosome 11 and the other side aligned to chromosome 14. To eliminate false positives, for each pre-selected read, we further surveyed the other reads corresponding to the same fragment to test whether opposite results could be obtained as a cross-validation. For example, we preserved fragment A, in which the head 20 bp of read 1 aligned to chromosome 11 and the tail 20 bp of read 1 aligned to chromosome 14 while the head 20 bp of read 2 aligned to chromosome 14 and the tail 20 bp aligned to chromosome 11. We also excluded fragments whose alignment to chromosome 11 located outside the potential candidate loci in t(11;14) translocation (chr. 11: 69,229,598-69,455,854)55. Total translocation events were determined as sum of all events detected in all H3K4me3, H3K9ac and H3K27ac cf-EpiTracing data. Translocation scores were defined by the translocation events (read counts with detected translocation events) detected in plasma samples.
Identification of ageing-related ICSs
Ageing-related differential ICSs were subsets of differential ICSs between patients (in this study, patients with MCL) and all healthy individuals that showed the ageing-related pattern. Around these sites, the difference between healthy individuals and patients gradually attenuated in older healthy individuals. Ageing-related differential ICSs were statistically defined as those showing the significant correlation between ICSs score and age in healthy individuals (adj. P value < 0.05 and Pearson correlation > 0.5). P values were adjusted for multiple testing using the Benjamini–Hochberg to control for false discoveries.
GO term enrichment analysis
Differential ICSs were identified through DESeq2 by comparing between the experimental and control conditions. Genes related to the differential ICSs were included in Gene Ontology (GO) term enrichment analyses. GO term enrichment analysis was performed to assess the biological significance of these genes. We used the enrichGO function from the clusterProfiler89 package (v.4.10.0) to determine the overrepresentation of Gene Ontology (GO) terms across Biological Process, Molecular Function and Cellular Component90. The background gene set for this analysis included all genes related to ICSs tested in the DESeq2 analysis, ensuring a comprehensive and unbiased comparison of gene ontology terms. Enriched GO terms were identified using a hypergeometric test, and P values were adjusted for multiple testing using the Benjamini–Hochberg to control for false discoveries.
Statistical analysis
Details of statistical analysis were as indicated in the text and figure legends. Statistical tests were two-sided unless stated otherwise. Results were considered significant at a P value threshold of 0.05. Two-tailed P < 0.05 was considered statistically significant unless stated otherwise. Multiple testing correction was performed using the Bonferroni, Benjamini–Yekutieli, or Benjamini–Hochberg procedure, when appropriate. Groups were compared using log-rank tests in Kaplan–Meier plots. The Wald log-likelihood test was used in the Cox proportional hazards model to assess the statistical significance of covariates. Paired two-tailed Student’s t-test was performed between two groups when appropriate. The Kruskal–Wallis test was used to evaluate the difference between groups to test whether they followed the same distribution. The hypergeometric test was performed to test the overlap significance. The asymptotic one-sample Kolmogorov–Smirnov test was performed to test the null hypothesis that the observed data followed a theoretical distribution.
Custom R scripts and R packages were used to generate heat map, violin plot, ridge map, bar plot, line chart, and boxplot, and perform statistical analysis. Plots were generated with Python (v.3.9.7), R (v.3.6.1) and Rstudio (v.4.2.2), using ggplot2 (v.4.3.2), pheatmap (v.1.0.12), radarchart (v.0.7.5) and euler (v.6.1.1).
Reporting summary
Further information on research design is available in the Nature Portfolio Reporting Summary linked to this article.
Data availability
The raw sequence data reported in this Article have been deposited to the Genome Sequence Archive for Human in the National Genomics Data Center under accession no. PRJCA018760. These data are under controlled access to protect patient privacy and ensure that the use of data is legal and complies with ethical principles. Researchers may submit an application to access the raw data by following the detailed guidelines provided by the GSA-Human platform (https://ngdc.cncb.ac.cn/gsa-human/document/GSA-Human_Request_Guide_for_Users_us.pdf). The downloaded data should be used for non-profit purposes only. The association between GSA run IDs and sample IDs is provided in Supplementary Table 8. Other public datasets used in this study were downloaded from ENCODE, ROADMAP or BLUEPRINT databases with detailed information including URLs summarized in Supplementary Table 4. The human reference genome (hg19) and Drosophila reference genome (dm3) are available at https://hgdownload.soe.ucsc.edu/goldenPath. Source data are provided with this paper.
Code availability
Original code has been deposited at https://github.com/Helab-bioinformatics/cf-EpiTracing. Any additional information reported in this Article is available from the corresponding author upon request.
References
-
Jahr, S. et al. DNA fragments in the blood plasma of cancer patients: quantitations and evidence for their origin from apoptotic and necrotic cells. Cancer Res. 61, 1659–1665 (2001).
-
Heitzer, E., Auinger, L. & Speicher, M. R. Cell-free DNA and apoptosis: how dead cells inform about the living. Trends Mol. Med. 26, 519–528 (2020).
-
Guo, S. et al. Identification of methylation haplotype blocks aids in deconvolution of heterogeneous tissue samples and tumor tissue-of-origin mapping from plasma DNA. Nat. Genet. 49, 635–642 (2017).
-
Lo, Y. M. et al. Presence of donor-specific DNA in plasma of kidney and liver-transplant recipients. Lancet 351, 1329–1330 (1998).
-
Sun, K. et al. Plasma DNA tissue mapping by genome-wide methylation sequencing for noninvasive prenatal, cancer, and transplantation assessments. Proc. Natl Acad. Sci. USA 112, E5503–E5512 (2015).
-
Zemmour, H. et al. Non-invasive detection of human cardiomyocyte death using methylation patterns of circulating DNA. Nat. Commun. 9, 1443 (2018).
-
Snyder, M. W., Kircher, M., Hill, A. J., Daza, R. M. & Shendure, J. Cell-free DNA comprises an in vivo nucleosome footprint that informs its tissues-of-origin. Cell 164, 57–68 (2016).
-
Vorperian, S. K., Moufarrej, M. N. & Quake, S. R. Cell types of origin of the cell-free transcriptome. Nat. Biotechnol. 40, 855–861 (2022).
-
Moss, J. et al. Comprehensive human cell-type methylation atlas reveals origins of circulating cell-free DNA in health and disease. Nat. Commun. 9, 5068 (2018).
-
Sadeh, R. et al. ChIP–seq of plasma cell-free nucleosomes identifies gene expression programs of the cells of origin. Nat. Biotechnol. 39, 586–598 (2021).
-
Rasmussen, M. et al. RNA profiles reveal signatures of future health and disease in pregnancy. Nature 601, 422–427 (2022).
-
De Borre, M. et al. Cell-free DNA methylome analysis for early preeclampsia prediction. Nat. Med. 29, 2206–2215 (2023).
-
Bruhm, D. C. et al. Single-molecule genome-wide mutation profiles of cell-free DNA for non-invasive detection of cancer. Nat. Genet. 55, 1301–1310 (2023).
-
Esfahani, M. S. et al. Inferring gene expression from cell-free DNA fragmentation profiles. Nat. Biotechnol. 40, 585–597 (2022).
-
De Vlaminck, I. et al. Circulating cell-free DNA enables noninvasive diagnosis of heart transplant rejection. Sci. Transl. Med. 6, 241ra277 (2014).
-
Schütz, E. et al. Graft-derived cell-free DNA, a noninvasive early rejection and graft damage marker in liver transplantation: a prospective, observational, multicenter cohort study. PLoS Med. 14, e1002286 (2017).
-
Ibarra, A. et al. Non-invasive characterization of human bone marrow stimulation and reconstitution by cell-free messenger RNA sequencing. Nat. Commun. 11, 400 (2020).
-
Phallen, J. et al. Direct detection of early-stage cancers using circulating tumor DNA. Sci. Transl. Med. 9, eaan2415 (2017).
-
Xie, M. et al. Age-related mutations associated with clonal hematopoietic expansion and malignancies. Nat. Med. 20, 1472–1478 (2014).
-
Genovese, G. et al. Clonal hematopoiesis and blood-cancer risk inferred from blood DNA sequence. N. Engl. J. Med. 371, 2477–2487 (2014).
-
Bettegowda, C. et al. Detection of circulating tumor DNA in early- and late-stage human malignancies. Sci. Transl. Med. 6, 224ra224 (2014).
-
Cristiano, S. et al. Genome-wide cell-free DNA fragmentation in patients with cancer. Nature 570, 385–389 (2019).
-
Baca, S. C. et al. Liquid biopsy epigenomic profiling for cancer subtyping. Nat. Med. 29, 2737–2741 (2023).
-
Bai, J. et al. Histone modifications of circulating nucleosomes are associated with changes in cell-free DNA fragmentation patterns. Proc. Natl Acad. Sci. USA 121, e2404058121 (2024).
-
Fedyuk, V. et al. Multiplexed, single-molecule, epigenetic analysis of plasma-isolated nucleosomes for cancer diagnostics. Nat. Biotechnol. 41, 212–221 (2023).
-
Gezer, U. et al. Histone methylation marks on circulating nucleosomes as novel blood-based biomarker in colorectal cancer. Int. J. Mol. Sci. 16, 29654–29662 (2015).
-
Van den Ackerveken, P. et al. A novel proteomics approach to epigenetic profiling of circulating nucleosomes. Sci. Rep. 11, 7256 (2021).
-
Jenuwein, T. & Allis, C. D. Translating the histone code. Science 293, 1074–1080 (2001).
-
Wu, Q. & Ng, H. H. Mark the transition: chromatin modifications and cell fate decision. Cell Res 21, 1388–1390 (2011).
-
Portela, A. & Esteller, M. Epigenetic modifications and human disease. Nat. Biotechnol. 28, 1057–1068 (2010).
-
Brown, D. A. et al. The SET1 complex selects actively transcribed target genes via multivalent interaction with CpG island chromatin. Cell Rep 20, 2313–2327 (2017).
-
Sze, C. C. et al. Coordinated regulation of cellular identity-associated H3K4me3 breadth by the COMPASS family. Sci. Adv. 6, eaaz4764 (2020).
-
Austenaa, L. M. et al. Transcription of mammalian cis-regulatory elements is restrained by actively enforced early termination. Mol. Cell 60, 460–474 (2015).
-
Ortmann, B. M. et al. The HIF complex recruits the histone methyltransferase SET1B to activate specific hypoxia-inducible genes. Nat. Genet. 53, 1022–1035 (2021).
-
Zhang, S. M. et al. KDM5B promotes immune evasion by recruiting SETDB1 to silence retroelements. Nature 598, 682–687 (2021).
-
Orlando, D. A. et al. Quantitative ChIP–seq normalization reveals global modulation of the epigenome. Cell Rep. 9, 1163–1170 (2014).
-
Padeken, J., Methot, S. P. & Gasser, S. M. Establishment of H3K9-methylated heterochromatin and its functions in tissue differentiation and maintenance. Nat. Rev. Mol. Cell Biol. 23, 623–640 (2022).
-
Stunnenberg, H. G. & Hirst, M. The International Human Epigenome Consortium: a blueprint for scientific collaboration and discovery. Cell 167, 1145–1149 (2016).
-
Kundaje, A. et al. Integrative analysis of 111 reference human epigenomes. Nature 518, 317–330 (2015).
-
Consortium, E. P. An integrated encyclopedia of DNA elements in the human genome. Nature 489, 57–74 (2012).
-
Ernst, J. & Kellis, M. Chromatin-state discovery and genome annotation with ChromHMM. Nat. Protoc. 12, 2478–2492 (2017).
-
Zhou, H. et al. Colorectal liver metastasis: molecular mechanism and interventional therapy. Signal Transduct. Target. Ther. 7, 70 (2022).
-
Enquist, I. B. et al. Lymph node-independent liver metastasis in a model of metastatic colorectal cancer. Nat. Commun. 5, 3530 (2014).
-
Xie, Y. H., Chen, Y. X. & Fang, J. Y. Comprehensive review of targeted therapy for colorectal cancer. Signal Transduct. Target. Ther. 5, 22 (2020).
-
Wang, P. X. et al. Targeting CASP8 and FADD-like apoptosis regulator ameliorates nonalcoholic steatohepatitis in mice and nonhuman primates. Nat. Med. 23, 439–449 (2017).
-
Pelish, H. E. et al. Mediator kinase inhibition further activates super-enhancer-associated genes in AML. Nature 526, 273–276 (2015).
-
Scott, D. W. et al. Determining cell-of-origin subtypes of diffuse large B-cell lymphoma using gene expression in formalin-fixed paraffin-embedded tissue. Blood 123, 1214–1217 (2014).
-
Alizadeh, A. A. et al. Distinct types of diffuse large B-cell lymphoma identified by gene expression profiling. Nature 403, 503–511 (2000).
-
Montoto, S. et al. Risk and clinical implications of transformation of follicular lymphoma to diffuse large B-cell lymphoma. J. Clin. Oncol. 25, 2426–2433 (2007).
-
Lossos, I. S. & Levy, R. Higher-grade transformation of follicle center lymphoma is associated with somatic mutation of the 5’ noncoding regulatory region of the BCL-6 gene. Blood 96, 635–639 (2000).
-
Yano, T., Jaffe, E. S., Longo, D. L. & Raffeld, M. MYC rearrangements in histologically progressed follicular lymphomas. Blood 80, 758–767 (1992).
-
Kurz, K. S. et al. Follicular lymphoma in the 5th edition of the WHO-Classification of Haematolymphoid Neoplasms-updated classification and new biological data. Cancers 15, 785 (2023).
-
Sehn, L. H. et al. The revised International Prognostic Index (R-IPI) is a better predictor of outcome than the standard IPI for patients with diffuse large B-cell lymphoma treated with R-CHOP. Blood 109, 1857–1861 (2007).
-
Zhang, J. et al. The genomic landscape of mantle cell lymphoma is related to the epigenetically determined chromatin state of normal B cells. Blood 123, 2988–2996 (2014).
-
Nadeu, F. et al. Genomic and epigenomic insights into the origin, pathogenesis, and clinical behavior of mantle cell lymphoma subtypes. Blood 136, 1419–1432 (2020).
-
Hu, Y. et al. Multiscale footprints reveal the organization of cis-regulatory elements. Nature 638, 779–786 (2025).
-
Loyfer, N. et al. A DNA methylation atlas of normal human cell types. Nature 613, 355–364 (2023).
-
Newman, A. M. et al. An ultrasensitive method for quantitating circulating tumor DNA with broad patient coverage. Nat. Med. 20, 548–554 (2014).
-
Nabet, B. Y. et al. Noninvasive early identification of therapeutic benefit from immune checkpoint inhibition. Cell 183, 363–376.e313 (2020).
-
Alig, S. K. et al. Distinct Hodgkin lymphoma subtypes defined by noninvasive genomic profiling. Nature 625, 778–787 (2024).
-
Shen, S. Y. et al. Sensitive tumour detection and classification using plasma cell-free DNA methylomes. Nature 563, 579–583 (2018).
-
Zuccato, J. A. et al. Prediction of brain metastasis development with DNA methylation signatures. Nat. Med. 31, 116–125 (2024).
-
Wang, P. et al. Simultaneous analysis of mutations and methylations in circulating cell-free DNA for hepatocellular carcinoma detection. Sci. Transl. Med. 14, eabp8704 (2022).
-
Bae, M. et al. Integrative modeling of tumor genomes and epigenomes for enhanced cancer diagnosis by cell-free DNA. Nat. Commun. 14, 2017 (2023).
-
Menon, M. P., Pittaluga, S. & Jaffe, E. S. The histological and biological spectrum of diffuse large B-cell lymphoma in the World Health Organization classification. Cancer J. 18, 411–420 (2012).
-
Alaggio, R. et al. The 5th edition of the World Health Organization Classification of Haematolymphoid Tumours: Lymphoid Neoplasms. Leukemia 36, 1720–1748 (2022).
-
Lossos, I. S. et al. Transformation of follicular lymphoma to diffuse large-cell lymphoma: alternative patterns with increased or decreased expression of c-myc and its regulated genes. Proc. Natl Acad. Sci. USA 99, 8886–8891 (2002).
-
Picelli, S. et al. Tn5 transposase and tagmentation procedures for massively scaled sequencing projects. Genome Res. 24, 2033–2040 (2014).
-
Ai, S. et al. Profiling chromatin states using single-cell itChIP–seq. Nat. Cell Biol. 21, 1164–1172 (2019).
-
Wang, Q. et al. CoBATCH for high-throughput single-cell epigenomic profiling. Mol Cell 76, 206–216.e207 (2019).
-
Ai, S. et al. EED orchestration of heart maturation through interaction with HDACs is H3K27me3-independent. eLife 6, e24570 (2017).
-
Chen, X. et al. ATAC-see reveals the accessible genome by transposase-mediated imaging and sequencing. Nat. Methods 13, 1013–1020 (2016).
-
Wu, D., Wang, L. & Huang, H. Protocol to apply spike-in ChIP–seq to capture massive histone acetylation in human cells. STAR Protoc. 2, 100681 (2021).
-
Lambuta, R. A. et al. Whole-genome doubling drives oncogenic loss of chromatin segregation. Nature 615, 925–933 (2023).
-
Yang, J. H. et al. Loss of epigenetic information as a cause of mammalian aging. Cell 186, 305–326.e327 (2023).
-
Bartosovic, M. & Castelo-Branco, G. Multimodal chromatin profiling using nanobody-based single-cell CUT&Tag. Nat. Biotechnol. 41, 794–805 (2023).
-
Langmead, B. & Salzberg, S. L. Fast gapped-read alignment with Bowtie 2. Nat. Methods 9, 357–359 (2012).
-
Ramírez, F. et al. deepTools2: a next generation web server for deep-sequencing data analysis. Nucleic Acids Res. 44, W160–W165 (2016).
-
Thorvaldsdóttir, H., Robinson, J. T. & Mesirov, J. P. Integrative Genomics Viewer (IGV): high-performance genomics data visualization and exploration. Brief. Bioinformatics 14, 178–192 (2013).
-
Zhang, Y. et al. Model-based analysis of ChIP–seq (MACS). Genome Biol. 9, R137 (2008).
-
Cao, Z., Chen, C., He, B., Tan, K. & Lu, C. A microfluidic device for epigenomic profiling using 100 cells. Nat. Methods 12, 959–962 (2015).
-
Zheng, X. et al. Low-cell-number epigenome profiling aids the study of lens aging and hematopoiesis. Cell Rep. 13, 1505–1518 (2015).
-
Ernst, J. & Kellis, M. ChromHMM: automating chromatin-state discovery and characterization. Nat. Methods 9, 215–216 (2012).
-
Quinlan, A. R. & Hall, I. M. BEDTools: a flexible suite of utilities for comparing genomic features. Bioinformatics 26, 841–842 (2010).
-
Hao, M. et al. Large-scale foundation model on single-cell transcriptomics. Nat. Methods 21, 1481–1491 (2024).
-
Guimarães, G. R. et al. Single-cell resolution characterization of myeloid-derived cell states with implication in cancer outcome. Nat. Commun. 15, 5694 (2024).
-
Yuan, Z. et al. Benchmarking spatial clustering methods with spatially resolved transcriptomics data. Nat. Methods 21, 712–722 (2024).
-
Yu, G., Wang, L.-G. & He, Q.-Y. ChIPseeker: an R/Bioconductor package for ChIP peak annotation, comparison and visualization. Bioinformatics 31, 2382–2383 (2015).
-
Yu, G., Wang, L. G., Han, Y. & He, Q. Y. clusterProfiler: an R package for comparing biological themes among gene clusters. Omics 16, 284–287 (2012).
-
Ashburner, M. et al. Gene Ontology: tool for the unification of biology. Nat. Genet. 25, 25–29 (2000).
Acknowledgements
We thank all members of the He laboratory for critical comments, J. Lu for providing the S2 cell line, and Z. Zhou and W. Zhou for providing reagents for the early method development. Part of the analyses was performed on the High Performance Computing Platform of the Center for Life Sciences, Peking University and Biomedical Computing Platform of National Biomedical Imaging Center, Peking University. A.H. was supported by grants from the National Natural Science Foundation of China (32192401 and 32025015), the National Basic Research Program of China (2021YFA1100100), and the Peking-Tsinghua Center for Life Sciences. J.Z. was supported in part by National Basic Research Program of China (2024YFA1803500), National Natural Science Foundation of China (82430007) and Fundamental and Interdisciplinary Disciplines Breakthrough Plan of the Ministry of Education of China (JYB2025XDXM611).
Ethics declarations
Competing interests
A.H., X.C. and X.M. have filed two patent applications based on the results reported in this paper. A.H. is a scientific cofounder of Chengdu Xunyuanpu Biotech Inc. The other authors declare no competing interests.
Peer review
Peer review information
Nature thanks Ash Alizadeh, Eleni Tomazou and the other, anonymous, reviewer(s) for their contribution to the peer review of this work.
Additional information
Publisher’s note Springer Nature remains neutral with regard to jurisdictional claims in published maps and institutional affiliations.
Extended data figures and tables
Extended Data Fig. 1 Sensitivity and reproducibility of cf-EpiTracing in profiling multiple histone modifications on plasma cell-free chromatin.
(a) Normalized H3K4me3 read intensity of cf-EpiTracing of ten representative healthy donors plotted at the 2.5-kb flanking regions around the TSSs, before (top) or after (bottom) spike-in normalization. The same samples before and after normalization are indicated with matching colors. (b) Heatmaps showing H3K4me3, H3K27ac, H3K9ac and H3K36me3 signals at peak regions for cf-EpiTracing data with a varying volume of human plasma. The rows were sorted by the descending signals in peaks. (c) Scatter plots demonstrating the reproducibility of the cf-EpiTracing data. Shown are both technical replicates (two samples from the same donors; upper) and biological replicates (two samples from different donors; lower) for seven histone modifications. Each dot corresponds to a 10-kb genomic bin. Spearman’s rank correlation coefficients were calculated. (d) Spearman correlation of multiple histone modifications in plasma, PBMCs and monocytes, in merged peak regions of multiple histone modifications and 10-kb TSS regions. Plasma signals were merged from all healthy donors (n = 125). PBMC signals were merged from ChIP-seq data of two healthy donors. Bulk H3K4me1, H3K4me3, H3K27ac, H3K27me3 and H3K36me3 ChIP-seq data of monocytes were downloaded from ENCODE GSM1003535, GSM945225, GSM1003559, GSM1102785 and GSM1102788, respectively.
Extended Data Fig. 2 Benchmarking cf-EpiTracing data of multiple histone modifications on plasma cell-free chromatin.
(a) Size distribution of cfDNA fragments (extracted from 5 mL plasma by Mag-Bind cfDNA kit, M3298-00; left), cfChIP fragments (200 μL plasma; middle), and cf-EpiTracing fragments (200 μL plasma; right) with plasma from the identical healthy donor. x axis: fragment length in base pairs (bp); y axis: relative fluorescence units (RFU) detected by capillary electrophoresis (left) and fragment counts detected by sequencing (middle and right). (b) Receiver operating characteristics curves for cf-EpiTracing and cfChIP data of four histone modifications, which were all profiled in Sadeh et al. Merged cf-EpiTraicng signals from healthy donors (upper) or merged cfChIP-seq signals (lower) were used as gold standard. (c) Violin plots of the log10(peak number) of H3K4me1, H3K4me2, H3K4me3 and H3K36me3 between data obtained from cf-EpiTracing (profiles of 10 representative samples each histone modification) and cfChIP (all accessible data from Sadeh et al.10; H3K4me1, n = 4; H3K4me2, n = 12; H3K4me3, n = 268; H3K36me3, n = 9). (d) Violin plots of the calculated proportion of reads in corresponding regions for H3K4me1 (n = 10 for cf-EpiTracing, n = 4 for cfChIP-seq), H3K4me2 (n = 10 for cf-EpiTracing, n = 12 for cfChIP-seq), H3K4me3 (n = 10 for cf-EpiTracing, n = 268 for cfChIP-seq) and H3K36me3 (n = 10 for cf-EpiTracing, n = 9 for cfChIP-seq). Target regions were defined as described in cfChIP. (e) Track view showing comparison of cf-EpiTracing profiles and cfChIP-seq profiles starting with a series of plasma volumes. Average deduplicated reads, fragment ratio in peaks (FRiP) and peak number were labelled on the right (n = 4). Box plots in c,d indicate median (middle line), first and third quartiles (box edges) and 1.5× IQR (whiskers).
Extended Data Fig. 3 Definition of the ICS (Integrated chromatin state) ChromHMM model using reference epigenomes of 65 tissues/primary cells.
(a) A breakdown list of 65 reference epigenomes from ENCODE, ROADMAP and BLUEPRINT. See also Supplementary Table 4. (b) A ChromHMM model with all cell-free plasma and tissue histone modifications (epigenome) was built out by consolidating epigenomic data corresponding to seven histone modifications from 65 tissues/primary cells. The model was trained on 65 epigenomes with high-quality data, with sufficient coverage of different lineages and tissues/cell types. Schematics of 18 ICSs illustrating chromatin state definition, abbreviation, histone modification probabilities and genomic annotation enrichment. Genomic annotation enrichment in plasma cf-chromatin and PBMCs was exemplified above. (c) Transition probabilities showing the frequency of co-occurrence for each pair of ICSs in neighboring 200-bp genomic regions. (d) Variability for the 18 ICSs. ICS variability was quantified according to the fraction of genomic coverage (y axis) of each ICS (as colored above), which were consistently labelled with that ICS in most N (ranging from 1 to 65) reference epigenomes, using the 18 ICSs learned on the basis of seven histone modifications, as defined in (b).
Extended Data Fig. 4 Comparison of histone modification combinations in identifying tissue-specific signatures that distinguish patients from healthy individuals.
(a) Correlation heatmap of 10 representative tissues and primary cells (n = 5 each) by ICS signals in genomic regions for tissue-specific signatures of all 65 tissues/primary cells. Hierarchical clustering was performed. Signals in genomic regions for tissue-specific signatures were calculated using combined histone modifications from ChIP-seq datasets. (b) Heatmap showing hierarchical clustering performance using histone modification combinations in tissues and primary cells. (c) Correlation heatmap of DLBCL patients (n = 15) and healthy individuals (n = 15) using ICS signals in genomic regions for tissue-specific signatures of B cells (from CD19+ cells, naive B cells and germinal center B cells). Hierarchical clustering was performed. Signals in genomic regions for tissue-specific signatures were calculated using combined histone modifications from ChIP-seq datasets. (d) Heatmap showing hierarchical clustering performance using histone modification combinations in plasma samples. (e) PCA visualization (left) and correlation heatmap (right) of 10 representative tissues/primary cells (n = 5 each) based on signals in genomic regions for tissue-specific 18-ICS defined signatures of all 65 tissues/primary cells. The signals in these genomic regions of tissue-specific signatures were computed utilizing H3K4me3, H3K9ac and H3K27ac. (f) PCA visualization (left) and correlation heatmap (right) of DLBCL patients (n = 15) and healthy individuals (n = 15) using signals in genomic regions for tissue-specific 18-ICS defined signatures of B cells (from CD19+ cells, naive B cells and germinal center B cells). The signals in these genomic regions of tissue-specific signatures were computed utilizing H3K4me3, H3K9ac and H3K27ac.
Extended Data Fig. 5 Development of an unbiased screening model for determining tissue-of-origin signals.
(a) A list summarizing samples involved in the unbiased screening. (b) Hierarchical clustering heatmap illustrating the ICS scores in genomic regions for tissue-signatures.ICSs present in Fig. 3a, across 125 healthy individuals and 107 CRC, 23 CHD, 309 lymphoma patients. Top 1,000 variable genomic regions were displayed. (c) Violin plots of tissue-signature.ICS scores from diseased tissues, in 125 healthy individuals, 107 CRC, 23 CHD or 309 lymphoma patients. (d) Violin plots of tissue-signature.ICS scores from diseased tissues in 125 healthy individuals, 56 IBD and 107 CRC patients. (e) Hierarchical clustering heatmap showing separation of IBD and CRC patients using differential tissue-signatues.ICSs. (f) Normal distribution test of tissue-signatures.ICSs in healthy individuals. Colon smooth muscle.ICS13 was exemplified. P value was used to assess the difference between the theoretic data following a normal distribution (the red line) and our actual data (grey bars) (top left). (g) Unbiased distribution test determining whether scores of tissue-signatures.ICSs among healthy donors followed a particular distribution. (h) Bar plots for brain and adipose nuclei enrichment scores in 23 CHD, 107 CRC, 309 lymphoma patients and 125 healthy individuals. Data are expressed as mean ± s.d. (i) Heatmap showing tissue enrichment scores of 10 representative organs in 125 healthy individuals, 107 CRC, 23 CHD and 309 B-cell lymphoma patients. Heatmap was column-scaled. (j) Violin plots for the enrichment scores of three representative tissues in healthy individuals of different ages (<50 y, n = 59; 50–70 y, n = 53; >70 y, n = 13). (k) Spider plots for tissue enrichment scores for ten representative organs in 3 representative healthy individuals of different ages. P-value by t-test (two-sided, c, d), asymptotic one-sample Kolmogorov–Smirnov test (two-sided, f) and Kruskal–Wallis test (two-sided, h, j). Box plots in c,d,j indicate median (middle line), first and third quartiles (box edges) and 1.5× IQR (whiskers). NS, not significant.
Extended Data Fig. 6 cf-EpiTracing enables subtyping and stratification of patients of colorectal lesions.
(a) Heatmap showing hierarchical clustering of colon and rectal cancer patients, using signals in genomic regions for colon-specific and rectal-specific signatures. (b) Box plots showing the ratio of tissue-specific colon and rectum signatures in patients. (c) Bar plots showing colon-rectal cancer classification accuracy for patients in different stages. (d) Venn diagrams showing the fraction of tumor-detected cancer-specific ICSs from M1117 overlapping with sample-specific ICSs of four representative healthy donors. (e) Barplot showing the overlap between cancer-specific ICSs in tumor, and plasma from CRC patients or healthy individuals. (f) Boxplot showing the overlap between cancer-specific ICSs in tumor, and plasma from randomly assigned CRC or healthy groups (n = 100 each). (g) Track view showing signals from plasma of a representative healthy individual (H028) and CRC patient (M1120), along with those from normal colon and tumor tissues from M1120. (h) Scatter plot showing the number of cancer-specific ICSs detected in tumors and in plasma from the same patients. (i) Venn diagrams showing overlap of cancer-specific ICSs detected in tumors (upper) and plasma (lower) in four CRC patients. (j) Volcano plot showing up-regulated (106) and down-regulated (79) ICSs, in plasma of CRA patients (n = 22) versus healthy individuals (n = 93). P values were adjusted by Benjamini–Yekutieli. (k) AUC values over the iterations for training and independent validation group samples during model training. (l) ROC curves for multi-class classifications of CRC patients and healthy individuals in the validation dataset and CRA patients. (m) Bar plots showing the age and stage in CRC-1 (n = 48) and CRC-2 (n = 59). Data are expressed as mean ± s.d. P values by t-test (two-sided, b, e, f), hypergeometric test (two-sided, d), and Kruskal−Wallis test (two-sided, m). Box plots in b,e,f indicate median (middle line), first and third quartiles (box edges) and 1.5× IQR (whiskers).
Extended Data Fig. 7 cf-EpiTracing identifies tumor-derived ICSs in DLBCL patients with varying tumor burden.
(a) Venn diagrams showing the fraction of tumor-detected cancer-specific ICSs from lymphoma tumor from individuals overlapping with those from matching plasma compared with healthy plasma. Plasma and tumor tissues were collected from the identical lymphoma patients for each comparison. (b) Scatter plot showing the number of cancer-specific ICSs detected in the tumor and those in plasma in the same patients. (c) Venn diagrams showing overlap of cancer-specific ICSs detected in four tumors from individual DLBCL patients compared with normal tissues (left) and overlap of those in plasma from the identical patients compared with healthy individuals (right). (d) Scatter plot showing the number of cancer-specific ICSs detected in plasma and the mean VAF (%) for four DLBCL patients. (e) Scatter plot showing the overlap ratio between cancer-specific ICSs detected in tumor and plasma vs the mean VAF (%) for four DLBCL patients. (f) Venn diagrams showing the fraction of tumor-detected cancer-specific ICSs from B-cell lymphoma tumor from DLBCL845 overlapping with sample-specific ICSs of four representative healthy donors, compared with healthy control. (g) Barplot showing the overlap between tumor tissue ICSs and those of plasma cf-chromatin from DLBCL patients (n = 4, as in a) or healthy individuals (n = 125). (h) Barplot showing the overlap between tumor tissue ICSs and those of plasma cf-chromatin from randomly assigned DLBCL patients or healthy groups (n = 100 each). P-values by hypergeometric test (two-sided, a, f) and by t-test (two-sided, g, h). Box plots in g,h indicate median (middle line), first and third quartiles (box edges) and 1.5× IQR (whiskers). NS, not significant.
Extended Data Fig. 8 Characterization of the cf-EpiTracing sensitivity in B-cell lymphoma subtyping.
(a) Hierarchical clustering heatmap showing subtype-specific ICSs identified in three subtypes of B-cell lymphoma. (b) Hierarchical clustering heatmap showing the expression level of DEGs between tumors of three subtypes of B-cell lymphoma (MCL, FL, DLBCL) identified by bulk RNA-seq (GSE32018(GPL6480)). (c) Confusion matrices showing the classification performance for B-cell lymphoma subtypes, based on hierarchical clustering analysis using subtype-specific ICSs (n = 79, upper) and subtype-specific DEGs (n = 218, lower). (d) Schematic representation of the plasma spike-in experiment. Plasma from healthy individuals was spiked with a varying proportion of plasma from pre-treatment advanced-stage DLBCL patients (n = 3, metabolic tumor volume=324.6 ± 84.9 cm³), while maintaining a final plasma volume of 200 µL. cf-EpiTracing was performed on these samples to trace ICS signals from B cells. (e) Line chart showing the signals in genomic regions for tissue-specific signatures of B cells in cf-chromatin, relative to the proportion of plasma from DLBCL patients spiked into healthy control plasma. Three biological replicates were plotted. Data are expressed as mean ± s.d. (f) Track view showing H3K4me3, H3K9ac and H3K27ac profiles in plasma cf-chromatin across different percentages of patient plasma spiked into healthy control plasma. (g) Hierarchical clustering heatmap showing subtype-specific ICSs identified in two subtypes of DLBCL. (h) Hierarchical clustering heatmap showing the expression level of DEGs between tumors of two subtypes of DLBCL (GCB-DLBCL and nonGCB-DLBCL) identified by bulk RNA-seq (GSE31312 (GPL570)). (i) Confusion matrices showing the classification performance for DLBCL subtypes, based on hierarchical clustering analysis using subtype-specific ICSs (n = 666, upper) and subtype-specific DEGs (n = 68, lower). P-values by t-test (two-sided, e).
Extended Data Fig. 9 cf-EpiTracing allows for grading DLBCL patients and recurrence prediction.
(a) Schematic overview of the study design for training and validation of DLBCL XGBoost grading model. (b) RMSE values over the iterations for training (blue) and validation group (red) samples during model training. (c) Bar plots showing the model’s predictive and classification performance in the training (left) and validation group (right). Root mean squared error (RMSE), mean absolute error (MAE), Pearson correlation, accuracy, precision, recall and F1 score were calculated as in Methods. The classification threshold for each group was determined based on cutoffs best dividing individuals from adjacent groups in training group samples based on the Youden index. (d) Violin plots showing the scores of recurrence-detection related ICSs and levels of clinical indices between DLBCL patients with (n = 27, red) and without (n = 114, green) recurrence risk, in both the discovery and validation datasets. Box plots indicate median (middle line), first and third quartiles (box edges) and 1.5× IQR (whiskers). (e) Kaplan-Meier survival curves for overall survival (OS) in DLBCL patients stratified by low or high scores of representative recurrence-related ICSs, in both the discovery and validation datasets. P-values by t-test (two-sided, d), and log-rank test (two-sided, adjusted for multiple comparisons via Bonferroni, e).
Extended Data Fig. 10 cf-EpiTracing captures chromosomal translocation and epigenetic alterations in MCL.
(a) Diagram showing cf-EpiTracing simultaneously capturing translocation events and cell-free epigenetic alterations in MCL patients. (b) Heatmap showing altered histone modifications in MCL patients compared to healthy individuals around the genomic locus of CCND1. 50 representative MCL patients and 50 healthy individuals were displayed. (c) Track views showing histone modifications upstream the locus of CCND1 in one representative healthy individual (H038) and MCL patient (MCL67). Grey box denotes the cf-EpiTracing-identified translocation breakpoint. Red boxes mark altered histone modifications. (d) Violin plots showing the read counts with detected translocation events (t(11;14)) in MCL (n = 74), FL (n = 65) or healthy (n = 125) groups. Box plots indicate median (middle line), first and third quartiles (box edges) and 1.5× IQR (whiskers). (e) The distribution of the ICSs of MCL-specific signatures between MCL patients and healthy individuals. Top 5 ICSs with the highest contribution were displayed. (f) Dot plots showing the enrichment of ICS13 scores of genes within 1 Mb upstream and 1 Mb downstream of the CCND1 locus in MCL patients compared with healthy individuals (red). The correlation to translocation scores was defined by cf-EpiTracing (blue). P values were not adjusted for multiple testing, as the analyses were hypothesis-driven and limited to a predefined set of loci. (g) Dot plots showing log2(FC) of ICSs exclusively altered in MCL and aging-related differential ICSs, in MCL and healthy individuals of different ages compared with healthy individuals under the age of 30. H, healthy donors. (h) Bar plots showing the top eight GO terms enriched in differential ICSs between healthy individuals and MCL patients, classified to no (upper panel) or high (lower panel) correlation with ages. P-values by t-test (two-sided, d,f), Wald test (two-sided, adjusted by Benjamini–Yekutieli, g) and hypergeometric test (two-sided, adjusted by Benjamini–Hochberg, h).
Supplementary information
Source data
Rights and permissions
Open Access This article is licensed under a Creative Commons Attribution-NonCommercial-NoDerivatives 4.0 International License, which permits any non-commercial use, sharing, distribution and reproduction in any medium or format, as long as you give appropriate credit to the original author(s) and the source, provide a link to the Creative Commons licence, and indicate if you modified the licensed material. You do not have permission under this licence to share adapted material derived from this article or parts of it. The images or other third party material in this article are included in the article’s Creative Commons licence, unless indicated otherwise in a credit line to the material. If material is not included in the article’s Creative Commons licence and your intended use is not permitted by statutory regulation or exceeds the permitted use, you will need to obtain permission directly from the copyright holder. To view a copy of this licence, visit http://creativecommons.org/licenses/by-nc-nd/4.0/.
About this article

Cite this article
Chen, X., Meng, X., Zhang, W. et al. Cell-free chromatin state tracing reveals disease origin and therapy responses. Nature (2026). https://doi.org/10.1038/s41586-026-10224-0
-
Received:
-
Accepted:
-
Published:
-
Version of record:
-
DOI: https://doi.org/10.1038/s41586-026-10224-0