Main
Biological research spans scales from molecules to systems to organisms, seeking to understand and design functional components across all domains of life. Creating a machine to design functions across the diversity of life would require it to learn a deep, generalist representation of biological complexity. Although this complexity surpasses straightforward human intuition, advances in artificial intelligence offer a universal framework that leverages data and compute at scale to uncover higher-order patterns6,7. We reasoned that training a model with these capabilities would require data spanning the full spectrum of biological diversity to discover emergent properties similar to those found in other fields8.
We previously demonstrated that machine learning models trained on prokaryotic genomic sequences can model the function of DNA, RNA and proteins, as well as their interactions that create complex molecular machines1,2. Here we present Evo 2, a biological foundation model trained on a representative snapshot of genomes spanning all domains of life. We extend the sequence modelling paradigm to the scale and complexity of eukaryotic genomes through advances in data curation, model architecture, large-scale pre-training, advanced interpretability methods and inference-time prediction and generation approaches.
Emphasizing generalist capabilities over task-specific optimization, Evo 2 represents an important milestone in biological sequence modelling, laying a broad foundation for prediction and design tasks that are relevant to all modalities of the central dogma, that span molecular to genome scale and that generalize across all domains of life.
Evo 2 architecture, training, and data
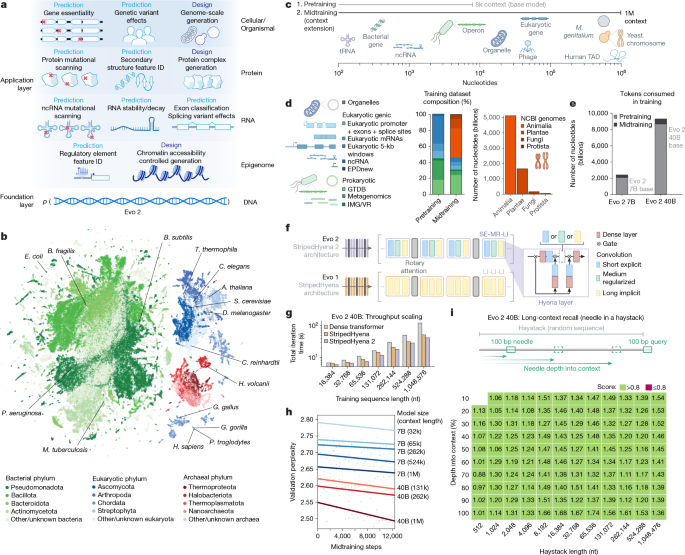
Evo 2 was trained on prokaryotic and eukaryotic genetic sequences, with potential downstream utility for predictive and generative tasks across multiple scales of complexity (Fig. 1a). We trained two versions of Evo 2: a smaller version with 7 billion parameters trained on 2.4 trillion tokens (Evo 2 7B), and a larger version with 40 billion parameters trained on 9.3 trillion tokens (Evo 2 40B). This new training dataset, which we call OpenGenome2, was compiled from curated, non-redundant nucleotide sequence data with a total of more than 8.8 trillion nucleotides from bacteria, archaea, eukarya and bacteriophage (Fig. 1b and Extended Data Fig. 1a).

a, Evo 2 models DNA sequence and enables applications across the central dogma, scaling from molecules to genomes and spanning all domains of life. b, Evo 2 was trained on data encompassing trillions of nucleotide sequences from all domains of life. Each point in the UMAP (uniform manifold approximation and projection) graph represents a single genome in the training dataset that is embedded on the basis of the genome’s k-mer frequencies. Arabidopsis thaliana, Bacillus subtilis, Bacteroides fragilis, Caenorhabditis elegans, Chlamydomonas reinhardtii, D. melanogaster, E. coli, Gallus gallus, Gorilla gorilla, Haloferax volcanii, Homo sapiens, Mycobacterium tuberculosis, Pan troglodytes, Pseudomonas aeruginosa, S. cerevisiae and Tetrahymena thermophila are highlighted. c, A two-phase training strategy was used to optimize model performance while expanding the context length up to 1 million base pairs to capture wide-ranging biological patterns. M. genitalium, Mycoplasma genitalium; TAD, topologically associating domain. d, Novel data augmentation and weighting approaches prioritize functional genetic elements during pretraining and long-sequence composition during midtraining. GTDB, Genome Taxonomy Database; IMG/VR, Integrated Microbial Genomes/Virus database. e, The number of tokens used to train Evo 2 40B and 7B, split into the shorter sequence pretraining and the long context midtraining. f, Schematic of the new multi-hybrid StripedHyena 2 architecture, showing the efficient block layout of short explicit (SE), medium regularized (MR) and long implicit (LI) hyena operators. g, Comparison of iteration time at 1,024 GPU, 40B scale between StripedHyena 2, StripedHyena 1 and Transformers, showing improved throughput. h, Validation perplexity of Evo 2 midtraining comparing the model size and context length, showing benefits with scale and increasing context length. i, A modified needle-in-a-haystack task was used to evaluate long context recall ability up to 1 million sequence length, and shows that Evo 2 performs effective recall at 1 million token context.
Both Evo 2 7B and 40B are trained in two phases to capture biological length scales from molecular to organismal (Fig. 1c–e). Our first stage of pretraining uses a context length of 8,192 tokens, with data weighting focused on genic windows to learn functional genetic elements, followed by a multi-stage midtraining phase over which we extend the context length of Evo 2 to 1 million tokens to learn the relationships between elements across long genomic distances (Fig. 1c–e and Methods). This matches best practice in natural language, in which initial pretraining at shorter context lengths improves both efficiency and overall model quality9,10,11. As in Evo 1, we excluded genomic sequences from viruses that infect eukaryotic hosts from the training data for biosafety purposes. We verified that these data exclusions led to high perplexity on genomic sequences from eukaryotic viruses (Extended Data Fig. 2a), indicating poor language modelling performance in this domain.
Evo 2 uses StripedHyena 2, a convolutional multi-hybrid architecture5 that relies on a combination of three different variants of input-dependent convolution operators12 and attention (Fig. 1f and Extended Data Fig. 1b), improving training efficiency at scale on both short and long sequences, as well as allowing each layer to model interactions at variable distances. StripedHyena 2 provides substantially higher throughput (at 40 billion parameters, up to 3× speedup at 1 million context length) than highly optimized Transformer6 baselines and previous generation hybrid models based on recurrences or long convolutions, such as StripedHyena 1 (ref. 13) (Fig. 1g). StripedHyena 2 also improves loss scaling on DNA against both Transformers and StripedHyena 1 (Extended Data Fig. 1c), thereby achieving both lower prediction error with the same amount of training data and enabling more efficient use of computational resources.
We train up to 1 million base pairs in context length through a multi-stage extension phase, which showed improvements in loss with both model scale and longer context (Fig. 1h). With a synthetic long-context evaluation called ‘needle-in-a-haystack’, we show that Evo 2 can identify and predict the value of a specific 100 base pair sequence (the needle) hidden within 1 million base pairs of random DNA (the haystack), serving as a synthetic quality check that the model can retrieve information from its full context window, as desired for long-context models (Fig. 1i and Extended Data Fig. 1d,e).
Evo 2 learns evolutionary constraint
By learning the likelihood of sequences across vast evolutionary datasets, biological sequence models capture conserved sequence patterns that often reflect functional importance. These constraints allow the models to perform zero-shot prediction without any task-specific fine-tuning or supervision1,14,15,16. Here, likelihood refers to the probability that the model assigns to a given sequence, where mutations that reduce this probability are predicted to be deleterious. Given that Evo 2 learns a likelihood landscape across all three modalities of the central dogma (DNA, RNA and protein) and all three domains of life, we sought to assess whether Evo 2 could perform mutational effect prediction across these modalities and organisms (Fig. 2a).

a, Evo 2-predicted zero-shot likelihoods can be used to predict the effects of DNA, RNA or protein mutations on molecular function or organismal fitness. WT, wild type. b, Effects on Evo 2 prediction of sequence likelihood caused by mutations along gene start sites for various model species across the domains of life. See Extended Data Fig. 3a,b for additional analyses. T. kodakarensis, Thermococcus kodakarensis. c,d, For different prokaryotic (c) and eukaryotic (d) sequences, the likelihood of different types of mutations in different genomic elements were scored using Evo 2 7B. Scatter represents the median change in likelihood from wild type to mutant sequence per species, coloured by domain (c) or kingdom (d). Horizontal line indicates the median of the scatter distribution. lncRNA, long noncoding RNA; snRNA, small nuclear RNA. e, Mutational likelihoods were used to assess the ability of Evo 2 to differentiate between genomic sequences of model organisms on the basis of their usage of different stop codons. Shown are the standardized median of delta likelihood values across 5 species, where medians were calculated across approximately 4,100 randomly selected mutation loci. M. pneumoniae, Mycoplasma pneumoniae; P. tetraurelia, Paramecium tetraurelia. f, DMS assays were used to assess the Spearman correlation of zero-shot likelihoods from models with experimental assays. Notably, Evo 1 and GenSLM were exclusively trained on prokaryotic datasets. g, Schematic of our single-nucleotide resolution exon classifier based on embeddings from Evo 2. h, Single-nucleotide exon classifiers were trained on embeddings from Evo 2, Nucleotide Transformer (NT) and Evo 1, and were evaluated on the basis of their AUROC across eight held-out species. Performance was compared to SegmentNT-30 kb multispecies (asterisks indicate species in SegmentNT training data), ab initio AUGUSTUS, and to baseline nucleotide content and conservation metrics. D. rerio, Danio rerio; H. vulgare, Hordeum vulgare; S. moell., Selaginella moellendorffii; S. oleracea, Spinacia oleracea; T. cacao, Theobroma cacao; V. vinifera, Vitis vinifera. i, Genome browser track showing predictions from the Evo 2 embedding-based exon classifier scanned across the human STOML2 locus, where the vertical axis is the predicted classifier score and the horizontal axis is genome position. j, Evo 2 predicts genes as essential or nonessential, as determined by experimental gene essentiality assays across bacterial, archaeal and phage species (shown as overlaid scatter) using mutational likelihood of premature stop codon insertions (as a genetic perturbation).
To assess whether Evo 2 captures core biological principles, we first evaluated how single nucleotide variants (SNVs) affect Evo 2 likelihoods in the genomic sequences around the start codons of protein-coding genes. We introduced these mutations at each position in the wild-type sequence and calculated the resulting changes in Evo 2 predicted likelihoods across thousands of such loci (Fig. 2b and Extended Data Fig. 3a). We observed strong changes in the likelihood for mutations within the start codons in both prokaryotes and eukaryotes. This was followed by a three-base periodicity pattern reflecting the triplet codons, with changes at the wobble positions showing lower impact on likelihood. For both prokaryotic and eukaryotic genomes, we observed a pattern upstream of the coding DNA sequence (CDS) that was consistent with the locations of known consensus sequences associated with translation initiation, namely, the Shine–Dalgarno sequence17 for prokaryotes and the Kozak sequence18 for eukaryotes. We also observed similar patterns for SNVs around stop codons (Extended Data Fig. 3b).
Next we measured the effect of mutations across a variety of both noncoding and coding sequences (Fig. 2c,d). Across 20 prokaryotic species and 16 eukaryotic species, we observed changes in model likelihoods consistent with known biological constraints. Non-synonymous mutations, premature stop codons and frameshift mutations caused much larger changes in likelihood than synonymous mutations. In noncoding regions, deletions in transfer RNAs (tRNAs) and ribosomal RNAs (rRNAs) had much larger effects than deletions in intergenic and other noncoding loci, reflecting the known essential roles of these RNAs. The 40B model exhibited higher sensitivity to deletions in microRNA (miRNA) and small nucleolar RNA (snoRNA) sequences compared with the 7B model. Evo 2 also predicted that less efficiently translated codons had lower likelihoods than more efficient codons (Extended Data Fig. 3c–e).
Recognizing that our training data contained genomes with distinct genetic codes, we tested how different premature stop codons impacted species that differ in their stop codon usage (Fig. 2e). We found that the model learned the difference between the standard code (stop codons TAA, TAG and TGA), the mycoplasma code (Code 4, stop codons TAA and TAG) and the ciliate code (Code 6, stop codon TGA). When ciliate genomes were artificially recoded to the standard genetic code, Evo 2 predicted mutations from the standard stop codons as deleterious, demonstrating that the model relies on sequence context to determine the appropriate genetic code (Extended Data Fig. 3f).
Although Evo 2 likelihoods reflect the expected importance of different genetic alterations, a key question is whether these likelihoods also correlate with functional effects, which can be empirically measured via deep mutational scanning (DMS) of proteins and noncoding RNAs (ncRNAs). Although state-of-the-art methods for this task tend to leverage both sequence alignments and structural conditioning, general-purpose single-sequence protein language models also learn likelihood distributions that correlate with fitness15. Evo 2 sequence likelihoods correlate with diverse definitions of fitness across nine prokaryotic protein datasets; six eukaryotic protein datasets; and seven datasets of rRNAs, tRNAs and ribozymes (Fig. 2f). Evo 2 is competitive with widely used ProGen language models for protein DMS and with RNA language models for ncRNA DMS, although it underperforms state-of-the-art models on protein DMS. Consistent with observed trends for protein language models, the performance of Evo 2 on these fitness prediction benchmarks begins to saturate and can decrease at the largest model scales19,20,21. We also tested the ability of Evo 2 to predict mutation effects in protein sequences from viruses that infect human hosts. We found no correlation between Evo 2 likelihood and viral protein fitness (Extended Data Fig. 2b), consistent with our data exclusions having the intended effect of weakening both language modelling and downstream performance (Extended Data Fig. 2a). Evo 2 likelihoods also have modest zero-shot association with human mRNA decay rates (Extended Data Fig. 3g and Supplementary Information B.2).
Since Evo 2 learns from eukaryotic genomes, which can be challenging to annotate, we assessed whether its embeddings capture exon–intron architecture. We trained lightweight models on Evo 2 7B base embeddings to develop single-nucleotide resolution classifiers of exon labels (Fig. 2g and Methods). On eight diverse species held out from classifier training, our best classifier achieved areas under the receiver operating characteristic curve (AUROCs) ranging from 0.91 to 0.99 (Fig. 2h,i), outperforming models trained on embeddings from other genomic language models, Nucleotide Transformer22 and Evo 1 (ref. 1), and classification by conservation metrics (local GC content and PhyloP). As a practical baseline, we show that our classifier outperforms ab initio AUGUSTUS23 across all species tested. Evo 2 also outperforms SegmentNT24 on all species outside the SegmentNT training set and on one of the three species in its training set. These results suggest that combining Evo 2 sequence embeddings with supervised approaches can aid the functional annotation of genetic components across diverse species, including non-model organisms.
Beyond molecular or gene-level prediction tasks, we previously showed that high likelihood under Evo 1 is associated with whole organism replication fitness in prokaryotes and phage as quantified by gene essentiality experiments1. Using zero-shot likelihoods to score the effects of premature stop codon insertions into bacterial, archaeal and phage genomes, we found that Evo 2 models performed similarly to Evo 1 and better than other zero-shot methods in predicting gene essentiality across diverse species (Fig. 2j and Extended Data Fig. 3h). On zero-shot prediction of human gene essentiality (Methods), Evo 2 40B (AUROC = 0.66, area under the precision-recall curve (AUPRC) = 0.15) outperformed other genomic language models (AUROC range 0.50–0.59, AUPRC range 0.09–0.12) and performs within the range of four PhyloP conservation scores (AUROC range 0.65–0.71, AUPRC range 0.13–0.21) (Extended Data Fig. 3i), although the overall predictive performance remains modest.
Together, these results demonstrate that Evo 2 captures information across biological modalities and domains of life. Notably, the 7B and 40B models expand predictive capabilities without compromising the prokaryotic insights captured by Evo 1. The utility of both zero-shot likelihoods and simple classifiers trained on Evo 2 embeddings for a variety of predictive tasks across prokaryotic and eukaryotic genomes indicates that Evo 2 provides a strong foundation model for downstream applications in computational biology.
Human variant effect prediction
Variant effect prediction represents a critical challenge in genomics, with direct implications for clinical diagnosis and therapeutic development. Genomic language models have previously struggled in eukaryotic variant effect prediction, lagging considerably behind species-specific models that use multiple sequence alignments16,22,25. Evo 2 can perform accurate zero-shot variant effect prediction for both coding and noncoding DNA by considering the changes in the model’s likelihoods after introducing mutations involving single or multiple nucleotides (Fig. 3a).

a, Overview of zero-shot variant effect prediction using Evo 2. Evo 2 was used to assign likelihood scores to human genetic variants, distinguishing pathogenic and benign variants in both coding and noncoding regions. b,c, Zero-shot evaluation of variant pathogenicity within the coding (b; n = 14,319 SNVs, n = 1,236 non-SNVs) and noncoding (c; n = 34,761 SNVs, n = 3,894 non-SNVs) regions. Shown are the AUROCs and AUPRCs for classifying pathogenic and benign variants from ClinVar, across models. For non-SNV evaluations, a modified version of PhyloP was used (Methods). d, Zero-shot evaluation on splice-altering variants in SpliceVarDB, split by exonic (n = 1,181) and intronic (n = 3,769) scoring. e, Evo 2 and other models were used to evaluate BRCA1 variant effect predictions against BRCA1 saturation mutagenesis data, comparing classification of loss-of-function versus functional and intermediate variants in both coding (n = 2,077 SNVs) and noncoding (n = 1,125 SNVs) regions. f, Evo 2 zero-shot likelihood scores plotted for loss-of-function (LOF) versus functional/intermediate variants (n = 3,893), demonstrating the ability of Evo 2 to separate these classes. P value calculated by two-sided Wilcoxon rank sum test. g, Evo 2 embeddings were extracted and concatenated to train a supervised classifier for BRCA1 variant effect prediction. h, Predictions of the supervised classifier on functional/intermediate variants compared with true loss-of-function variants on the test set (n = 789), with decision scores on the horizontal axis. P value calculated by two-sided Wilcoxon rank sum test. i, Comparison of a supervised classifier trained on Evo 2 embeddings on the BRCA1 test set against zero-shot baselines, highlighting the value of using Evo 2 embeddings to build lightweight supervised models.
We used annotations of human clinical and experimentally determined variants to evaluate the ability of Evo 2 to predict biologically important sequence variation. We also contextualize the performance of Evo 2 against a wide range of models, including statistical measures of conservation (for example, PhyloP); unsupervised language models of proteins, RNA and DNA (for example, ESM-1b); supervised splicing prediction models (for example, Pangolin and SpliceAI); and human variant effect prediction models (for example, AlphaMissense, GPN-MSA and CADD).
Using the ClinVar database, we compared the ability of Evo 2 against other methods for predicting the pathogenic effects of human genetic variants across diverse variant classes (Supplementary Data 1). For coding region SNVs, the 40B and 7B models performed competitively, ahead of zero-shot methods, including ESM-2, but behind ESM-1b, GPN-MSA and some PhyloP variants (Fig. 3b). For non-SNV coding variants (for example, insertions and deletions), both Evo 2 models outperformed all other methods; notably, these non-SNV variants are not possible to score by leading models such as AlphaMissense and GPN-MSA (Fig. 3b). For noncoding SNVs, Evo 2 40B ranked first among unsupervised models and only trailed behind supervised models (Fig. 3c). For noncoding non-SNVs, Evo 2 40B outperformed all models tested (Fig. 3c). Across variants stratified by levels of conservation or distance from splice sites, Evo 2 maintains competitive performance among unsupervised models for noncoding variants and the best performance for coding and noncoding non-SNVs out of all methods tested (Extended Data Fig. 4a–c and Supplementary Information B.3).
To further evaluate performance on splice variants, we used SpliceVarDB, a repository containing experimentally validated splicing effects. For both exonic and intronic variants, Evo 2 40B and 7B ranked first among unsupervised models (Fig. 3d). On intronic variants, zero-shot prediction with Evo 2 was competitive with supervised models, slightly trailing SpliceAI and CADD but ahead of Pangolin; on exonic variants, Evo 2 trailed specialized supervised models but outperformed all zero-shot models (Fig. 3d).
We next focused on a dataset measuring functional consequences of variants across both exons and introns of the BRCA1 gene26. Zero-shot prediction with Evo 2 exhibited strong performance on coding SNVs and outperformed all other models on BRCA1 noncoding SNVs (Fig. 3e). Evo 2 7B and 40B achieved better performance than other models when coding and noncoding SNVs were evaluated together, suggesting well-calibrated predictions across included variant types (Extended Data Fig. 5a). When separately considering BRCA1 noncoding variants near or far from splice sites, Evo 2 40B outperformed all tested models, including supervised splicing predictors (Extended Data Fig. 5b). A recently released BRCA2 variant dataset with experimental measurements27 enabled us to extend this analysis to a related gene. Evo 2 surpassed specialized models such as GPN-MSA when predicting coding and noncoding variants together, achieving second-best performance behind CADD, a supervised model (Extended Data Fig. 5c). These results indicate that Evo 2 is an effective zero-shot predictor across diverse types of functional human variants.
Although zero-shot scoring is particularly valuable when task-specific training data are unavailable, model-derived embeddings can also serve as inputs to supervised classifiers that learn task-specific decision boundaries, thereby enhancing both sensitivity and specificity. To illustrate this capability, we assessed whether a simple ridge regression model trained with Evo 2 embeddings exclusively on BRCA1 variants could surpass zero-shot prediction with Evo 2 (Fig. 3g). Given that different layers within large language models capture distinct features, we systematically extracted sequence embeddings from each block of the Evo 2 40B model to identify which layer yielded the most informative features for variant classification (Extended Data Fig. 5d and Methods). Our supervised model achieved a clear separation between loss-of-function variants and all other variants (Fig. 3h and Extended Data Fig. 5e), outperforming zero-shot prediction by Evo 2 40B on the test set (AUROC = 0.95, AUPRC = 0.88) (Fig. 3i). These results underscore how Evo 2 embeddings can be harnessed to train models aimed at more specialized tasks, including those with high clinical relevance.
Unlike the highly constrained sequences typically found in clinical variant datasets which are biased towards coding, splicing or untranslated region (UTR) variants, other regulatory sequences—particularly those distal to genes—exhibit substantially lower conservation. In this context, we used DART-eval to assess how effectively Evo 2 embeddings and likelihoods capture regulatory function28. On zero-shot tasks in DART-eval, Evo 2 40B (chromatin accessibility quantitative trait loci (caQTL) AUROC = 0.58, DNase I sensitivity quantitative trait loci (dsQTL) AUROC = 0.66) outperforms other unsupervised DNA language models, such as Nucleotide Transformer (caQTL AUROC = 0.52, dsQTL AUROC = 0.61), but trails sequence-to-function models trained on accessibility data, such as ChromBPNet (caQTL AUROC = 0.77, dsQTL AUROC = 0.89) (Extended Data Fig. 5f). These results indicate that while multi-species language models trained on sequence alone capture some regulatory information, sequence to function models with task-specific training achieve higher performance in this setting.
On human clinical variant prediction, Evo 2 represents a major improvement over previous multi-species DNA language models across different variant types, with leading performance on non-SNVs (insertions, deletions, duplications), and maintains this performance even in the absence of strong site-independent sequence conservation, although it falls behind supervised models for distal regulatory variants. Furthermore, leveraging the representations in a supervised setting illustrates how Evo 2 embeddings can serve as a foundation for downstream prediction tasks. Notably, Evo 2 is not trained on any human genetic variation or functional genomics data. In sum, these findings support the versatility of Evo 2 as a genome-scale language model for both unsupervised and supervised variant effect prediction.
Feature interpretation in Evo 2
Evo 2 learns complex representations of genomic sequences without explicit biological labels or annotations. Contrary to the common critique of large language models as black box systems, recent advances in the field known as mechanistic interpretability have demonstrated that sparse autoencoders (SAEs) can reveal latent dimensions that correspond to semantically meaningful features in natural language29,30,31. Without any prior biological annotations or labels, we trained SAEs on Evo 2 representations (or neuron firing patterns), to decompose the model into sparse, high-dimensional representations in which each latent dimension often exhibits human-interpretable patterns (Fig. 4a).

a, SAEs were trained on Evo 2 to extract SAE features associated with interpretable biological function that can be used for annotation, discovery and steering of sequence generations. b, Phage-associated feature activates preferentially on RefSeq-annotated prophages (left and top right) in the E. coli K12 MG1655 genome and fires on phage-derived spacer sequences within CRISPR arrays (bottom right). c, Activations of features associated with ORFs, intergenic loci, tRNAs and rRNAs, in a 100-kb region in E. coli K12 MG1655. d, Activations of features associated with α-helices, β-sheets and tRNAs at an E. coli K12 MG1655 locus containing tufB and a tRNA array ending with thrT (left) and the rpoB–rpoC locus (right). AlphaFold 3 (AF3) structure predictions with feature activations overlaid, of EF–Tu in complex with the tRNA (left) and of RpoB and RpoC in complex (right). e, A feature in the human genome with preferential activation immediately after frameshift mutations over other less deleterious mutation types. f, Features with activation on DNA motifs in the human genome that correspond to transcription factor-binding motifs. g, Features associated with exons, introns and their boundaries in the human genome generalize to a segment of the woolly mammoth genome.
We trained a Batch-TopK SAE32 on Evo 2 representations from layer 26 (Methods). The SAE was trained on representations from 1 billion tokens evenly split across several complete eukaryotic and prokaryotic genomes (Extended Data Fig. 6a–f).
We matched learned SAE latent dimensions, also referred to as features, and known biological concepts by finding features that were enriched in sequence segments containing a particular annotation, a process that we refer to as contrastive feature search (Extended Data Fig. 7a). This revealed diverse features that align with known biological concepts. For example, Evo 2 developed internal representations associated with mobile genetic elements. Feature f/19746 is closely associated with prophage regions across prokaryotes (Extended Data Fig. 7b) and activates on annotated prophages in the Escherichia coli genome, including the cryptic prophage CPZ-55 (Fig. 4b). This feature also activates on spacer sequences within a CRISPR array, which are integrated during CRISPR adaptation from foreign genetic material such as phage DNA (Fig. 4b), as well as after the last CRISPR direct repeat and on synthetic, scrambled spacer sequences, suggesting that Evo 2 associates CRISPR spacers with phage sequences as opposed to directly memorizing phage genomes (Fig. 4b and Extended Data Fig. 7c). This feature also activates on other regions that are not annotated as phage by geNomad33 yet contain genes associated with prophages, such as integrases and invertases (Extended Data Fig. 7d).
Next, we sought to identify concepts associated with canonical biological genomic elements. We identified diverse features corresponding to open reading frames (ORFs), intergenic regions, tRNAs and rRNAs in the E. coli genome (Fig. 4c and Extended Data Fig. 7e,f). We further probed for structural signatures at the protein level and identified features linked to protein secondary structures, such as α-helices and β-sheets (Fig. 4d and Extended Data Fig. 7g,h). These associations highlight the multimodal nature of genome language modelling, capturing higher-order structural information beyond DNA alone.
We extended our analysis to the human genome in search of eukaryotic features. By introducing mutations into thousands of human coding sequences and applying contrastive feature search on a eukaryotic-only SAE, we identified a mutation-sensitive feature (f/24278) that preferentially activates on frameshifts and pre-mature stop mutations (Fig. 4e and Extended Data Fig. 8a,b). We also observed other activations on DNA motifs in the promoter regions of human genes (Fig. 4f, left) that closely resemble the known binding sites of human transcription factors (Fig. 4f, right). Across a random sample of human promoter sequences, Evo 2 unsupervised SAE features have significant hits (q < 0.01, Sandelin–Wasserman similarity) to 70% promoter-enriched motifs (Extended Data Fig. 8f) from the HOCOMOCO v.12 CORE database34 using the TOMTOM motif comparison tool35. For comparison, HOMER36, a specialized motif discovery algorithm, only recalls 35% of the same motifs (Extended Data Fig. 8f). We provide a full report on transcription factor motif-associated features in Supplementary Data 2. These results suggest that Evo 2 contains distinct internal representations of noncoding regulatory elements.
Finally, we identified features that were closely associated with the exon and intron architecture of the human genome, including features that activate preferentially on coding regions (f/15680), introns (f/28339), the first bases of an exon following an intron (f/1050), and the last base of an exon followed by an intron (f/25666) (Extended Data Fig. 8c–e). The coding region feature also activates on bacterial ORFs, suggesting a learned universal representation of coding sequences (Extended Data Fig. 7e,f). Notably, these features demonstrate the ability of the model to learn higher-order sequence dependencies. For instance, exon boundary features (f/1050 and f/25666) integrate signals across splice sites that span multiple nucleotides, and the prophage feature (f/19746) identifies mobile genetic elements requiring kilobase-scale context.
Although we identified these features on the human genome using an SAE trained only on model organisms (including primates, Mus musculus, Xenopus tropicalis and Drosophila melanogaster), we further observed that these features transferred to a genic region within a portion of the woolly mammoth genome37 (Fig. 4g). These results demonstrate that an Evo 2 SAE learns features that transfer across species and suggest utility for genome annotation, although systematic benchmarking against established annotation tools remains necessary.
Overall, we demonstrate that Evo 2 latent representations capture a broad spectrum of biologically relevant signals, from prokaryotic mobile genetic elements and eukaryotic regulatory motifs to protein secondary structure and mutational severity. Since conceptual features for natural language can capture abstract concepts, other Evo 2 SAE features could represent more complex biological patterns (Extended Data Fig. 6f). We have released the SAE models and a visualization tool to facilitate exploration of Evo 2 features for the scientific community.
Genome-scale generation
Beyond its utility on prediction tasks, Evo 2 is also a generative model. We therefore sought to generate DNA sequences from diverse organisms with Evo 2 and assess the quality of designed sequences (Fig. 5a). We previously demonstrated that Evo 1 can respond to DNA prompts to design novel biological sequences2. To evaluate the ability of Evo 2 to respond to genomic prompts, we first assessed performance across six diverse species, spanning archaea, prokaryotes and four eukaryotic lineages (fungi, protists, plants and animals). For each species, we selected highly conserved representative genes and prompted Evo 2 with 1,000 base pairs of upstream sequence plus the first 500–1,000 base pairs of the target gene. We found that Evo 2 achieves gene completion with high amino acid sequence recovery, which improved with scale (Fig. 5b). Evo 2 40B and 7B also demonstrated improved performance over Evo 1 and maintained high sequence recovery throughout long context training (Fig. 5b and Extended Data Fig. 9a).

a, Evo 2 can generate chromosome- and genome-scale DNA sequences using unconstrained autoregressive generation. The model was prompted with portions of the H. sapiens mitochondrial genome, M. genitalium genome and S. cerevisiae chromosome III to generate DNA sequences with similar lengths to those of the native sequences. b, Evo 2 was prompted with both the genomic context and a portion of a highly conserved protein, followed by measuring the sequence recovery of the Evo 2-generated gene completion against the natural gene. c, Predicted rRNA, CDS and tRNA counts in Evo 2-generated mitochondrial sequences using MitoZ compared with the natural H. sapiens mitochondrial genome values. d, Query cover versus sequence identity of generated mitochondrial sequences against nucleotide BLAST hits in the core_nt database with expect threshold of 0.05, coloured by the E-value. e, Visualizations of Evo 2-generated sequences when prompted with a 3-kb sequence from the H. sapiens mitochondrial genome, demonstrating variation that still retains natural synteny patterns of coding sequences. f, AlphaFold 3-predicted structure of multimeric complexes from an Evo 2-generated sequence resembling human mitochondrial DNA. Sequence identity (seq. ID) compares Evo 2-generated proteins with natural proteins found via a BLASTp query. g, Example Evo 2-generated approximately 600-kb DNA sequence. Evo 2 was prompted with the beginning of the M. genitalium genome. Genes are annotated with Prodigal and coloured on the basis of statistically significant sequence similarity to natural proteins (hmmscan E-value < 0.001). h, The fraction of Prodigal-annotated genes with hmmscan hits between Evo 2 40B and M. genitalium generated by Evo 1. i, Distribution of Prodigal-annotated genes from Evo 2-generated M. genitalium compared with the natural genome. j, Distribution of secondary structure from Evo 2-generated proteins compared to natural M. genitalium proteins. k, AlphaFold 3 structure predictions of example proteins found on Evo 2-generated prokaryotic genomic sequences, with high observed structural similarities to natural proteins while diversifying the sequence com-position. l, The native genome sequence from S. cerevisiae chromosome III and an Evo 2-generated DNA sequence of similar length, which was generated by prompting the model with a 10-kb sequence from S. cerevisiae chromosome III, are visualized alongside predicted homologous yeast gene, exon, promoter and tRNA annotations.
Consistent with poor performance for viruses that infect humans on the language modelling task and on function prediction downstreams, Evo 2 also has poor performance on generating proteins from human viruses (Extended Data Fig. 2c). Even when directly trying to elicit a viral protein, Evo 2 had essentially random performance in sequence recovery, preventing Evo 2 from unconstrained or accidental generation of human viral proteins.
To test the ability of Evo 2 to generate DNA at the scale of entire genomes, we assessed its ability to generate all known components of a natural organelle genome. We prompted Evo 2 7B and 40B with portions of human mitochondrial DNA, generating over 250 unique 16-kb sequences (Methods). When annotated with MitoZ38, we found that the generated sequences have the correct number of CDSs, tRNA genes and rRNA genes expected in human mitochondria (Fig. 5c), with varying degrees of sequence similarity to natural genes (Fig. 5d and Supplementary Table 7) while maintaining proper synteny (Fig. 5e). Evo 2-generated mitochondrial sequences contained proteins with predicted multimeric complexes matching those of human mitochondrial proteins (Fig. 5f and Extended Data Fig. 9b,c). The codon usage of generated sequences also closely matched that of the human mitochondrial genome (Extended Data Fig. 9d) and Evo 2 generations on average successfully generated one of each type of expected tRNA, without duplicating the two included in the prompt (Extended Data Fig. 9e).
We next leveraged the million-base-pair context window of Evo 2 to generate DNA sequences at the scale of small prokaryotic genomes. For this task, we focused on M. genitalium, a model minimal genome of length approximately 580 kb (refs. 39,40). Using a 10.5-kb segment from the M. genitalium reference sequence as the prompt, we generated ten 580-kb sequences that we annotated with Prodigal41. Nearly 70% of generated genes contained significant Pfam hits, a substantial improvement over Evo 1 131k (18%) (Fig. 5g,h). The length and secondary structure distributions of generated proteins resemble natural M. genitalium distributions (Fig. 5i,j). Generated proteins also have structural alignment to natural proteins, though the structure prediction confidences of generated proteins are relatively lower than those of natural genes (Fig. 5k and Extended Data Fig. 9f–h).
To assess the eukaryotic sequence generation capability of Evo 2, we prompted it with 10.5 kb from Saccharomyces cerevisiae chromosome III (approximately 316 kb in length) to generate 20× 330-kb DNA sequences. These sequences include tRNAs, promoters and genes with intronic structure (Fig. 5l, Extended Data Fig. 9i and Methods) The density of tRNA and gene features was below those found in the native yeast genome (Fig. 5l), though the generated genes had similar length distributions to natural proteins (Extended Data Fig. 9j). Generated genes also demonstrate varying structural similarity to natural proteins while demonstrating sequence diversity (Extended Data Fig. 9k–m). A common measure of phylogenetic relatedness, the tetranucleotide usage deviation (TUD) of generated S. cerevisiae sequences correlates with that of native S. cerevisiae, and this agreement is higher for Evo 2 40B than for Evo 2 7B (Extended Data Fig. 9n).
These results demonstrate that Evo 2 can generate DNA sequences that resemble organellar, prokaryotic and eukaryotic genomes on the basis of several in silico metrics. Of note, these evaluation metrics do not guarantee functional or replication-competent genomes, and our genome-scale generations lack important elements, such as some essential genes. Experimentally testing genome-scale designs will also require large-scale, iterative effort42. However, Evo 2 provides a stronger and more versatile foundation model for genome-scale generation than Evo 1 and can also generate eukaryotic sequences.
Designing mammalian chromatin patterns
Inference-time guidance of generative models via a separate scoring or reward function has enabled powerful domain-specific conditioning in tasks such as code generation, algorithm design and mathematical reasoning43,44. We therefore sought to demonstrate how Evo 2 can be guided to generate long genomic sequences that would not be sampled naturally by standard autoregressive generation.
We focused on designing genomic segments to have artificial chromatin accessibility patterns45. Previous methods have used gradient-based, diffusion-based or black box optimization guided by oracle scoring functions to successfully design regulatory elements in the hundreds of nucleotides46,47,48,49,50,51. Building off of these methods, especially those that leverage black box optimization, we demonstrate that coupling a generative language model with inference-time guidance enables de novo design of multi-kilobase sequences with controllable chromatin accessibility.
Although Evo 2 does not explicitly learn chromatin accessibility, we can still leverage inference-time guidance to enable epigenomic conditioning. Models such as Enformer3 and Borzoi4 can predict chromatin accessibility from DNA sequences across cell types from human and mouse. However, Enformer and Borzoi are not generative models and are exclusively trained on natural genomes.
We guided Evo 2 to generate DNA sequences for which we can specify the location and length of chromatin-accessible regions, which are often visualized as ‘peaks’ along a one-dimensional genome sequence (Fig. 6a). We used an ensemble of Enformer and Borzoi to define a scoring function that accepts or rejects generated sequences on the basis of how well their predicted chromatin accessibility matches a desired pattern. Instead of sampling and scoring full, multi-kilobase designs, we conducted a beam search that re-evaluates Enformer and Borzoi after each new 128 bp of sampled sequence and only continues autoregressive generation off of the most promising samples (Fig. 6b). We used DNase hypersensitivity predictions in 129 ES-E14 cells from both Enformer and Borzoi, using the natural mouse genome context to inform the predictions (Methods).

a, Multi-kilobase sequences were designed to control the locations and lengths of chromatin-accessible regions, which are visualized as peaks indicating the degree of accessibility along a one-dimensional genomic sequence. b, 128-bp DNA chunks from a prompt were autoregressively generated with Evo 2. A beam search algorithm then selects the optimal chunks by scoring how well their Enformer- and Borzoi-predicted chromatin accessibility profiles match a target pattern. The best chunks were appended to the prompt to guide subsequent generation. c, Design runs are plotted by how successfully they matched the target pattern versus the compute used. AUROC quantifies how well predicted accessibility profiles can distinguish our desired open- versus closed-chromatin positions. The horizontal axis plots the number of tokens sampled per base pair in the design (standard autoregressive decoding is 1 token per bp). Individual design runs are plotted as grey dots and the averages across design runs for each beam search width are plotted as crosses. d, Two different peak patterns were designed with varying total compute budgets, with more compute leading to clearer designed peaks. e, Designs were experimentally tested by synthesizing and assembling the DNA, performing site-specific integration into mouse or human cells, and measuring chromatin accessibility with ATAC-seq. f–h, Control over the position and width of chromatin accessibility peaks enables Morse code messages (‘EVO2’ (f), ‘LO’ (g) and ‘ARC’ (h)) in the epigenome. Generated DNA sequences replace the native sequence at chrX: 52,051,929–52,123,468 in the mouse genome. Enformer and Borzoi predictions are based on the DNase hypersensitivity tracks in 129 ES-E14 cells. Designs were sampled using 30–84 tokens per base pair (Methods). Designs were experimentally validated in Bl6xcast mESCs. i,j, Integrating the same generated sequence into both HEK293T and K562 cells enables the design of identical patterns across both cell types (i) or of cell-type-specific accessibility profiles (j). k, AUROC quantifies how well experimental accessibility profiles can distinguish our desired open- versus closed-chromatin positions. Five designs were tested in HEK293T and 31 designs in K562 for which we varied the chromatin accessibility along the sequence. Dots indicate individual designs. l, The paradigm of using an accurate scoring function to guide a capable generative model extends beyond chromatin accessibility design, enabling many complex biological design applications.
Paralleling results in natural language44, we observed a log-linear relationship in which increasing the beam search width—thereby increasing inference-time compute—resulted in better-quality designs (Fig. 6c). Sampling 30 or more 128-bp chunks and selecting the top two chunks at each step of the beam search was sufficient to achieve final designs with AUROCs above 0.9 (Fig. 6d and Supplementary Data 3).
In some of our designs, we varied the length and location of accessible regions to write Morse Code messages, where narrow peaks indicate dots, wide peaks indicate dashes, and inaccessible regions indicate spaces. Our designed messages include “LO” (the first message transmitted over the Internet and the first word in Edmund Spenser’s The Faerie Queene), “ARC” (the name of the research institute in which this design was conducted), and “EVO2”. We experimentally tested these predictions by synthesizing and assembling the designed DNA, performing site-specific integration into the genomes of mouse embryonic stem cells (mESCs), and measuring chromatin accessibility with assay for transposase-accessible chromatin using sequencing (ATAC-seq) (Fig. 6e). The three Morse code patterns had good agreement between the predicted and experimentally measured chromatin profiles, with the experimental patterns having AUROCs of 0.92–0.95 (Fig. 6f–h). We also observed experimental success (AUROC > 0.89) for simpler peak patterns (Extended Data Fig. 10a).
Using a capable generative model to propose sequences outperforms simpler proposals and produces designs with favourable properties that emerge without direct optimization. For example, prompting Evo 2 with the native genomic context resulted in natural dinucleotide frequencies (Extended Data Fig. 10b) and all Enformer and Borzoi models largely reach a consensus prediction (Fig. 6f–h). By contrast, when we repeated the same design pipeline except with a uniform or bigram proposal replacing Evo 2, we observed poorer token-matched inference-time scaling and poor consensus among ensemble predictions (Extended Data Fig. 10b–e). Given that agreement among ensembled predictors was, retrospectively, critical for experimental design quality (Extended Data Fig. 10a), we hypothesize that these simpler proposals are prone to generating adversarial samples as observed in other domains, such as protein design52,53.
Further analysis of our Morse Code designs revealed that designed peak regions contain significantly higher predicted transcription factor motif density than non-peak regions (two-sided Welch’s t-test, P = 3.6 × 10⁻⁷) (Extended Data Figs. 10f–i and 11a). Unlike unigram or bigram designs, Evo 2 designs were significantly enriched for transcription factors expressed in mESCs (one-sided hypergeometric P = 2.0 × 10⁻⁴), with GC and CpG density correlating with chromatin peaks at levels similar to natural sequences (Extended Data Figs. 10f–i and 11a and SupplementaryInformation B.6). Notably, Evo 2 was not explicitly conditioned to generate motif-rich sequences. These findings suggest that Evo 2 can serve as a powerful generative proposal with sequence outputs containing greater regulatory potential than simpler methods.
We then demonstrated the generality of this approach by designing and experimentally testing the chromatin accessibility profiles of 1-4 kb sequences in two human cell lines, HEK293T and K562 (Methods). We tested designs with predicted chromatin accessibility patterns that differ between HEK293T and K562 cells, as well as designs with the same pattern in both cell lines (Fig. 6i,j and Extended Data Fig. 11b–h). We observed strong experimental success rates when we varied the level of chromatin accessibility within a designed sequence, with 33 out of 36 designs (92%) having an AUROC greater than 0.8 (Fig. 6k). When designing regions with differential accessibility between 2 cell types, a much more challenging task, we observed that 4 out of 24 of these designs (17%) had greater than twofold differential accessibility, and 1 out of 24 designs (4%) had greater than threefold differential accessibility (Fig. 6i and Extended Data Fig. 11b). In the four designs with more than twofold differential accessibility, the predicted transcription factor motifs in the design peaks were significantly enriched for K562-expressed transcription factors (one-sided hypergeometric P = 0.0017) (Extended Data Fig. 11i) but not for HEK293T-expressed transcription factors (one-sided hypergeometric P = 0.25) (Extended Data Fig. 11j).
This design task shows how Evo 2 can be coupled with task-specific supervised models to achieve controllable design of mammalian chromatin architecture. While beam search requires increasing inference-time compute (Fig. 6c) to improve generations, it is also highly flexible, requires no additional training compute and can leverage non-differentiable scoring functions. We note that other application-specific models could also be used to guide Evo 2’s generations (Fig. 6l), enabling biological design in any downstream application for which there exists a capable predictive model.
Discussion
Here we report a genomic language model, Evo 2, that achieves generalist prediction and design capabilities across all domains of life. Developing Evo 2 required substantial investment in machine learning research and engineering5, as well as data curation and evaluations. We provide several resources under an open-source license, including the following: (1) parameters for the Evo 2 models; (2) distributed training code; (3) code for multi-GPU inference; and (4) the full OpenGenome2 training dataset (Data availability and Code availability). The Evo 2 40B 1 million (1M)-context model demonstrates best overall performance, though the 7B 1M-context model is competitive and useful for settings requiring lightweight inference. Although we also release an experimental one-billion-parameter short-context model (Supplementary Table 1), this version should be avoided owing to overall weaker performance. We also release a tool for generating and scoring sequences with Evo 2 40B in a simple web interface (at https://arcinstitute.org/tools/evo/evo-designer) and a tool for exploring SAE features alongside genomic annotations (at https://arcinstitute.org/tools/evo/evo-mech-interp). Evo 2 is one of the largest-scale fully open models thus far (including training and inference code, data and parameters), even across other modalities, such as language and vision.
As with all new biotechnologies, there are safety, security and ethical considerations. Aligned with the Responsible AI × Biodesign commitments (https://responsiblebiodesign.ai/), we preemptively assessed and mitigated potential concerns prior to open source publication. Fully open-source models enable researchers to interrogate, reproduce, and build upon advances in artificial intelligence. They may also be used in unanticipated ways that could lead to accident or misuse risks54. We collaborated with multidisciplinary experts to reduce risks via data exclusion measures, safety and security evaluations, and population bias evaluations (Methods). By excluding genomic sequences of viruses that infect eukaryotes from our training data, we aimed to ensure our openly shared model did not disseminate the capability to manipulate and design pathogenic human viruses. Task-specific post-training may circumvent this risk mitigation measure and should be approached with caution. Our data exclusions had the intended outcomes of weakening language modelling performance (Extended Data Fig. 2a) and downstream mutational effect prediction (Extended Data Fig. 2b) on human viruses. Probing and testing these measures by red teaming meant to directly elicit pathogenic human viral proteins showed generations were effectively random in this domain (Extended Data Fig. 2c). We also showed that the population-free design of Evo 2 mitigated ancestry biases in model predictions55 (Extended Data Fig. 2d). Few examples of empirical risk assessment of biological foundation models exist; this work represents one of the most comprehensive evaluative efforts thus far that considers both precaution and access. Further research is also needed to expand the suite of available evaluations and risk mitigation approaches.
Evo 2 offers a powerful foundation for future work. Combining Evo 2 with additional information such as population-scale genomic variation56,57 or data from sequence-to-function experiments3,58 could enable an even greater breadth of downstream tasks. Whereas our mechanistic interpretability analysis focused primarily on well-annotated features, future work could leverage these approaches for genome mining and the discovery of more complex combinations of biological elements. Although Evo 2 generates more realistic DNA sequences than Evo 1, the current generative evaluations described in this study do not guarantee that the sequences will function in cells. Improving generation with inference-time guidance can notably require computationally intensive sampling. Supervised fine-tuning and reinforcement learning with feedback from biological experiments is likely to improve the efficiency and quality of sequences generated by Evo 2 for complex applications.
The Evo series of models lays the groundwork for biological modelling and design that unifies the diverse length scales of biology with a common representation. These capabilities, combined with large-scale DNA manipulation59, may enable programmable design of more complex biological functions. We expect that future work integrating genomic sequence data with additional modalities could produce a model that productively simulates complex phenotypes in health and disease.
Reporting summary
Further information on research design is available in the Nature Portfolio Reporting Summary linked to this article.
Data availability
The OpenGenome2 dataset used to train Evo 2 is available at: https://huggingface.co/datasets/arcinstitute/opengenome2. Raw reads for ATAC-seq analysis of mESC chromatin accessibility designs have been uploaded to the Sequence Read Archive (SRA) under BioProject accession number PRJNA1314301. Raw reads for ATAC-seq analysis of human chromatin accessibility designs have been uploaded to the SRA under BioProject accession number PRJNA1314272.
Code availability
Code and tools for model exploration are available at the following links: top-level code repository: https://github.com/arcinstitute/evo2; pretraining, midtraining and fine-tuning code: https://github.com/zymrael/savanna; inference code: https://github.com/zymrael/vortex; Evo Designer, an interactive user interface for generation and scoring with Evo 2: https://arcinstitute.org/tools/evo/evo-designer; Evo Mech Interp Visualizer, an interactive user interface for exploring SAE features: https://arcinstitute.org/tools/evo/evo-mech-interp; NVIDIA Evo 2 NIM (generation): https://build.nvidia.com/nvidia/evo2-protein-design; NVIDIA Evo 2 NIM (forward): https://build.nvidia.com/arc/evo2-40b; NVIDIA BioNeMo version of Evo 2 code: https://github.com/NVIDIA/bionemo-framework. The following model parameters are available on Hugging Face: Evo 2 40B: https://huggingface.co/arcinstitute/evo2_40b; Evo 2 7B: https://huggingface.co/arcinstitute/evo2_7b; Evo 2 40B base: https://huggingface.co/arcinstitute/evo2_40b_base; Evo 2 7B base: https://huggingface.co/arcinstitute/evo2_7b_base; Evo 2 1B base: https://huggingface.co/arcinstitute/evo2_1b_base; Evo 2 layer-26 mixed prokaryotic/eukaryotic SAE: https://huggingface.co/Goodfire/Evo-2-Layer-26-Mixed; Exon classifier trained on Evo 2 7B base embeddings: https://huggingface.co/schmojo/evo2-exon-classifier.
References
-
Nguyen, E. et al. Sequence modeling and design from molecular to genome scale with Evo. Science 386, eado9336 (2024).
-
Merchant, A. T., King, S. H., Nguyen, E. & Hie, B. L. Semantic design of functional de novo genes from a genomic language model. Nature 649, 749–758 (2026).
-
Avsec, Ž et al. Effective gene expression prediction from sequence by integrating long-range interactions. Nat. Methods 18, 1196–1203 (2021).
-
Linder, J., Srivastava, D., Yuan, H., Agarwal, V. & Kelley, D. R. Predicting RNA-seq coverage from DNA sequence as a unifying model of gene regulation. Nat. Genet. 57, 949–961 (2025).
-
Ku, J. et al. Systems and algorithms for convolutional multi-hybrid language models at scale. Preprint at https://doi.org/10.48550/arXiv.2503.01868 (2025).
-
Vaswani, A. et al. Attention is all you need. In Adv. Neural Information Processing Systems Vol. 30 (eds Guyon, I. et al.) (NIPS, 2017).
-
Kaplan, J. et al. Scaling laws for neural language models. Preprint at https://doi.org/10.48550/arXiv.2001.08361 (2020).
-
Radford, A. et al. Language models are unsupervised multitask learners. OpenAI Blog 1, 9 (2019).
-
Gao, T., Wettig, A., Yen, H. & Chen, D. How to train long-context language models (effectively). In Proc. 63rd Annual Meeting of the Association for Computational Linguistics 1, 7376–7399 (ACL, 2025).
-
Dubey, A. et al. The Llama 3 herd of models. Preprint at https://doi.org/10.48550/arXiv.2407.21783 (2024).
-
Liu, S. J. et al. In vivo perturb-seq of cancer and microenvironment cells dissects oncologic drivers and radiotherapy responses in glioblastoma. Genome Biol. 25, 256 (2024).
-
Poli, M. et al. Hyena hierarchy: towards larger convolutional language models. In Proc. 40th International Conference on Machine Learning (eds Karuse, A. et al.) 28043–28078 (2023).
-
Poli, M. et al. Mechanistic design and scaling of hybrid architectures. In Proc. 41st International Conference on Machine Learning 235, 40908–40950 (2024); https://proceedings.mlr.press/v235/poli24a.html.
-
Meier, J. et al. Language models enable zero-shot prediction of the effects of mutations on protein function. Preprint at bioRxiv https://doi.org/10.1101/2021.07.09.450648 (2021).
-
Notin, P. et al. ProteinGym: large-scale benchmarks for protein design and fitness prediction. Adv. Neural Inf. Process. Syst. 36, 64331–64379 (2023).
-
Benegas, G., Albors, C., Aw, A. J., Ye, C. & Song, Y. S. A DNA language model based on multispecies alignment predicts the effects of genome-wide variants. Nat. Biotechnol. 43, 1960–1965 (2025).
-
Shine, J. & Dalgarno, L. The 3′-terminal sequence of Escherichia coli 16S ribosomal RNA: complementarity to nonsense triplets and ribosome binding sites. Proc. Natl Acad. Sci. USA 71, 1342–1346 (1974).
-
Kozak, M. The scanning model for translation: an update. J. Cell Biol. 108, 229–241 (1989).
-
Nijkamp, E., Ruffolo, J. A., Weinstein, E. N., Naik, N. & Madani, A. ProGen2: exploring the boundaries of protein language models. Cell Syst. 14, 968–978 (2022).
-
Li, F.-Z., Amini, A. P., Yue, Y., Yang, K. K. & Lu, A. X. Feature reuse and scaling: understanding transfer learning with protein language models. In Proc. 41st International Conference on Machine Learning 235, 27351–27375 (2024).
-
Weinstein, E. N., Amin, A. N., Frazer, J. & Marks, D. Non-identifiability and the blessings of misspecification in models of molecular fitness. In Adv. Neural Information Processing Systems https://proceedings.neurips.cc/paper_files/paper/2022/file/247e592848391fe01f153f179c595090-Paper-Conference.pdf (2022).
-
Dalla-torre, H. et al. Nucleotide Transformer: building and evaluating robust foundation models for human genomics. Nat. Methods 22, 287–297 (2024).
-
Stanke, M., Steinkamp, R., Waack, S. & Morgenstern, B. AUGUSTUS: a web server for gene finding in eukaryotes. Nucleic Acids Res. 32, W309–W312 (2004).
-
de Almeida, B. P. et al. SegmentNT: annotating the genome at single-nucleotide resolution with DNA foundation models. Nat. Methods 22, 2301–2315 (2025).
-
Ji, Y., Zhou, Z., Liu, H. & Davuluri, R. V. DNABERT: pre-trained Bidirectional Encoder Representations from Transformers model for DNA-language in genome. Bioinformatics 37, 2112–2120 (2021).
-
Findlay, G. M. et al. Accurate classification of BRCA1 variants with saturation genome editing. Nature 562, 217–222 (2018).
-
Huang, H. et al. Functional evaluation and clinical classification of BRCA2 variants. Nature 638, 528–537 (2025).
-
Patel, A. et al. DART-Eval: a comprehensive DNA language model evaluation benchmark on regulatory DNA. Neural Inf. Process. Syst. 37, 62024–62061 (2024).
-
Cunningham, H., Ewart, A., Smith, L. R., Huben, R. & Sharkey, L. Sparse autoencoders find highly interpretable features in language models. Preprint at https://doi.org/10.48550/arXiv.2309.08600 (2023).
-
Bricken, T. et al. Towards monosemanticity: decomposing language models with dictionary learning. Transformer Circuits Thread https://transformer-circuits.pub/2023/monosemantic-features (2023).
-
Templeton, A. et al. Scaling monosemanticity: extracting interpretable features from Claude 3 Sonnet. Transformer Circuits Thread https://transformer-circuits.pub/2024/scaling-monosemanticity/ (2024).
-
Bussmann, B., Leask, P. & Nanda, N. BatchTopK Sparse Autoencoders. Preprint at https://doi.org/10.48550/arXiv.2412.06410 (2024).
-
Camargo, A. et al. Identification of mobile genetic elements with geNomad. Nat. Biotechnol. 42, 1303–1312 (2023).
-
Vorontsov, I. E. et al. HOCOMOCO in 2024: a rebuild of the curated collection of binding models for human and mouse transcription factors. Nucleic Acids Res. 52, D154–D163 (2024).
-
Gupta, S., Stamatoyannopoulos, J. A., Bailey, T. L. & Noble, W. S. Quantifying similarity between motifs. Genome Biol. 8, R24 (2007).
-
Heinz, S. et al. Simple combinations of lineage-determining transcription factors prime cis-regulatory elements required for macrophage and B cell identities. Mol. Cells 38, 576–589 (2010).
-
Sandoval-Velasco, M. et al. Three-dimensional genome architecture persists in a 52,000-year-old woolly mammoth skin sample. Cell 187, 3541–3562.e51 (2023).
-
Meng, G., Li, Y., Yang, C. & Liu, S. MitoZ: a toolkit for animal mitochondrial genome assembly, annotation and visualization. Nucleic Acids Res. 47, e63 (2019).
-
Gibson, D. G. et al. Complete chemical synthesis, assembly, and cloning of a Mycoplasma genitalium genome. Science 319, 1215–1220 (2008).
-
Karr, J. R. et al. A whole-cell computational model predicts phenotype from genotype. Cell 150, 389–401 (2012).
-
Hyatt, D. et al. Prodigal: prokaryotic gene recognition and translation initiation site identification. BMC Bioinformatics 11, 119 (2010).
-
Fredens, J. et al. Total synthesis of Escherichia coli with a recoded genome. Nature 569, 514–518 (2019).
-
Li, Y. et al. Competition-level code generation with AlphaCode. Science 378, 1092–1097 (2022).
-
Brown, B. et al. Large language monkeys: scaling inference compute with repeated sampling. Preprint at https://doi.org/10.48550/arXiv.2407.21787 (2024).
-
Allis, C. D. & Jenuwein, T. The molecular hallmarks of epigenetic control. Nat. Rev. Genet. 17, 487–500 (2016).
-
Schreiber, J., Lu, Y. Y. & Noble, W. S. Ledidi: Designing genomic edits that induce functional activity. Preprint at bioRxiv https://doi.org/10.1101/2020.05.21.109686 (2020).
-
Linder, J. & Seelig, G. Fast activation maximization for molecular sequence design. BMC Bioinformatics 22, 510 (2020).
-
Zrimec, J. et al. Controlling gene expression with deep generative design of regulatory DNA. Nat. Commun. 13, 5099 (2022).
-
de Almeida, B. P. et al. Targeted design of synthetic enhancers for selected tissues in the Drosophila embryo. Nature 626, 207–211 (2023).
-
DaSilva, L. F. et al. DNA-diffusion: leveraging generative models for controlling chromatin accessibility and gene expression via synthetic regulatory elements. Nat. Genet. 58, 180–194 (2026).
-
Sarkar, A. et al. Designing DNA with tunable regulatory activity using score-entropy discrete diffusion. Preprint at bioRxiv https://doi.org/10.1101/2024.05.23.595630 (2024).
-
Dauparas, J. et al. Robust deep learning-based protein sequence design using ProteinMPNN. Science 378, 49–56 (2022).
-
Verkuil, R. et al. Language models generalize beyond natural proteins. Preprint at bioRxiv https://doi.org/10.1101/2022.12.21.521521 (2022).
-
Bloomfield, D. et al. AI and biosecurity: The need for governance. Science 385, 831–833 (2024).
-
Pathak, A. K. et al. Pervasive ancestry bias in variant effect predictors. Preprint at bioRxiv https://doi.org/10.1101/2024.05.20.594987 (2025).
-
Schubach, M., Maass, T., Nazaretyan, L., Röner, S. & Kircher, M. CADD v1.7: using protein language models, regulatory CNNs and other nucleotide-level scores to improve genome-wide variant predictions. Nucleic Acids Res. 52, D1143–D1154 (2024).
-
Cheng, J. et al. Accurate proteome-wide missense variant effect prediction with AlphaMissense. Science 381, eadg7492 (2023).
-
Pampari, A. et al. ChromBPNet: bias factorized, base-resolution deep learning models of chromatin accessibility reveal cis-regulatory sequence syntax, transcription factor footprints and regulatory variants. Preprint at bioRxiv https://doi.org/10.1101/2024.12.25.630221 (2025).
-
Durrant, M. G. et al. Bridge RNAs direct programmable recombination of target and donor DNA. Nature 630, 984–993 (2024).
Acknowledgements
We thank J. Caputo, G. Filsinger, M. Fischbach, J. Kazaks, A. Kundaje, M. Macek Jr, S. Newins, S. Ovchinnikov, R. Park, B. Plosky, A. Woodrow and M. Zhang for helpful discussions and assistance with manuscript preparation; D. Traphagen, A. Gordon, H. Lewis, H. Estela, T. Rvachov, D. Ahn, S. Nah, C. Adams, X. Ren, S. Bak and D. Chang for behind-the-scenes help; and C. Dallago, K. Tretina, J. Israeli, N. Tadimeti, A. Stern, D. Voss, E. Calleja, C. Ye, R. Izzo, M. Bala, S. Alborghetti, V. Sirohi, V. Mehta, P. Bhattacharya, J. Sewall, A. Milesi, D. Toczydlowska, J. Mitchell, T. Moon, V. Balas, A. Aithal, P. Karbasi, C. Xuan, G. Guo, J. Wilber, M. Uhls, M. Harwood, N. Patel, O. Mosafi, R. Haukioja, S. Poulos and S. Bryson for additional support. We thank Ansa Biotechnologies for providing synthesized and assembled DNA for our mESC Morse code experiments. G. Brixi, A.T.M. and S.H.K. acknowledge funding support from the National Science Foundation Graduate Research Fellowship Program. D.B.L. acknowledges funding support from the Fannie and John Hertz Foundation. A.T.M. acknowledges funding support from the Knight-Hennessy Graduate Scholarship Fund. S.P. is supported in part by NHGRI/NIH grant RM1-HG009491 subaward, NIH grant DP5OD036167, by grant 2024-349901 from the Chan Zuckerberg Initiative, and funds from the Brotman–Baty Institute for Precision Medicine. H.G. is an Arc Core Investigator and acknowledges funding support from Arc Institute. P.D.H. acknowledges funding support from Arc Institute, Yosemite, Rainwater Foundation, Curci Foundation, Rose Hill Innovators Program, V. and N. Khosla, S. Altman, and anonymous gifts to the Hsu laboratory. B.L.H. acknowledges funding support from Arc Institute, the Gates Foundation, Stanford Institute for Human-Centered Artificial Intelligence (HAI) Hoffman-Yee Research Grants, Stanford Center for Digital Health, V. Gupta and R. Tonsing.
Ethics declarations
Competing interests
M.G.D. acknowledges outside interest in Stylus Medicine, and is currently an employee of Anthropic PBC. M.P. acknowledges outside interest as a co-founder of Radical Numerics. J.P. acknowledges outside interest as an artificial intelligence policy consultant for the Chan Zuckerberg Initiative. C.R. acknowledges outside interest in Factory and Google Ventures. D.P.B. acknowledges outside interest as a Google Advisor. H.G. acknowledges outside interest as a co-founder of Exai Bio, Vevo Therapeutics and Therna Therapeutics, serves on the board of directors at Exai Bio, and is a scientific advisory board member for Verge Genomics and Deep Forest Biosciences. P.D.H. acknowledges outside interest in Stylus Medicine, Terrain Biosciences, and Monet AI as a co-founder, serves on the board of directors at Stylus Medicine and the scientific advisory board at Amgen, and is a venture partner at Thrive Capital. B.L.H. acknowledges outside interest in Arpelos Biosciences and Genyro, Inc. as a scientific co-founder. The other authors declare no competing interests.
Peer review
Peer review information
Nature thanks Teresa Przytycka and the other, anonymous, reviewer(s) for their contribution to the peer review of this work.
Additional information
Publisher’s note Springer Nature remains neutral with regard to jurisdictional claims in published maps and institutional affiliations.
Extended data figures and tables
Extended Data Fig. 1 Overview of model architecture, training procedure, datasets, and evaluations for Evo 2.
(a) Data composition of OpenGenome2; total eukaryotic genomes per kingdom (left), total base pairs per training data subset (middle), and detailed breakdown of other/augmented training data subset (right). (b) Core input-dependent convolution operators in StripedHyena 2, with a diagram showing their composition in the architecture. (c) Scaling ablations on OpenGenome2, showing the loss convergence of multi-hybrids compared to previous generation hybrids and Transformers. Models of 7 billion parameters are compared after pretraining with the same 400 billion tokens. (d) Needle-in-a-haystack performance of Evo 2 7B, spanning input contexts of 512 to 1 million tokens. (e) A null distribution of needle-in-a-haystack scores by randomly shuffling the needle sequence across a sweep of haystack lengths and needle positions, computing the resulting retrieval score based on a categorical Jacobian analysis (Methods). The distribution of N = 1040 scores is plotted here. At our cutoff of a score of 0.8, we can reject the null hypothesis of no retrieval with a nominal P < 0.001.
Extended Data Fig. 2 Biosecurity and ethics evaluations for model generation and scoring.
To decrease dual use risks, safety filtering was performed on the training data to remove viral sequences that can infect eukaryotic hosts. Evo 2 is less performant on eukaryotic viruses, as intended. (a) Perplexity scores for viral sequences from the USDA Select Agents and Toxins List consistently demonstrate elevated perplexity values compared to non-pathogenic viruses and prokaryotic viruses. Blue violin plots show the distribution of scores, with individual data points overlaid representing 512-bp chunks sampled uniformly at random across viral genomes. (b) Correlation of language model likelihood with experimental deep mutational scanning (DMS) fitness measurements for human viral proteins. Gray bars represent mean correlation coefficients, with individual data points corresponding to DMS datasets from ProteinGym. Results indicate poor predictive capability on viral protein mutational effects for Evo 2 and Evo 1 models. (c) Comparative analysis of protein sequence generation success rates across different model conditions. Bar heights represent percentage amino-acid sequence recovery in the response sequences when prompted with a portion of a viral protein, with error bars showing standard deviation across multiple responses to the same prompt. Models were tested with various prompting proteins (shown on the horizontal axis) with different Evo 2 models (indicated by color). Random sequence generations are included as a control condition. (d) Analysis of ancestry bias for Evo 2 as a variant effect predictor compared to baselines, with protein mutations converted to DNA codons. Baseline performance data is taken from Pathak et al. Most variant effect predictors have ancestry bias, and score non-European ancestry variants as more pathogenic. Evo 2 has similar ancestry bias as other population-free methods, examined by taking both the ratio (heatmap) and mean difference (bar plot) of min-max scaled scores of each population subgroup to the European subgroup.
Extended Data Fig. 3 Evo 2 understands mutational effects on protein, RNA, and organismal fitness across all domains of life.
(a) Evo 2 predicts mutations to be unlikely in the start codons of protein-coding genes, the first two bases of each codon of the coding region, and the ribosome-binding sites of the 5′ UTR, across 20 prokaryotic and 16 eukaryotic model species. (b) Evo 2 predicts mutations to be unlikely in the stop codons of protein-coding genes and the first two bases of each codon of the coding region before the stop codon. (c) Evo 2 40B predicts lower likelihoods for deletions in miRNA and snoRNA loci compared to Evo 2 7B. Red points in (c) are the same as is shown in Fig. 2d. The same sequences were analyzed with both models. (d) The translational codon ramp pattern detected across all coding sequences across four species, focusing on the first and last 100 codons for each coding sequence. The local mean tRNA-adaptation index (tAI) was calculated using pre-computed tAI values for each species, and then z-score normalized. Data is based on rolling 5-codon averages. (e) The average change in log-likelihood across hundreds of genes and codon positions in each species’ genome. Blue lines indicate synonymous codon mutations with a higher tAI than the reference sequence, while red lines indicate synonymous codon mutations with a lower tAI than the reference sequence. Each codon position was averaged, and then a rolling 5-codon average was applied. (f) Evo 2 predicts stop codons dependent on the sequence context and stop codons present in the genome sequence, responding to artificially altered stop codon code by predicting the mutations as high effect. Showing median z-score standardized median Δlikelihood values for two ciliate genomes across 6 sequence context lengths. (g) Length-adjusted Evo 2 likelihoods of human mRNA sequences showed a negative correlation with their experimentally measured decay rates. Borzoi was included as a supervised sequence-to-expression model by selecting and averaging RNA expression prediction tracks. (h) Zero-shot prokaryotic gene essentiality prediction including the base pretrained models and the final checkpoints extended to 1-million token context for both the 7B and 40B parameter Evo 2 models; compare to Fig. 2j. (i) DepMap human gene essentiality classification performance measured by AUROC and AUPRC metrics comparing conservation baselines and language models.
Extended Data Fig. 4 Evo 2 enables accurate human clinical variant effect prediction.
(a) ClinVar variants stratified by PhyloP score and variant type (coding or noncoding, SNV or non-SNV). (b) ClinVar variants stratified by proximity to splice sites, where “near” is defined as within 5 bp or 3 bp to donor or acceptor sites, respectively, and “far” is defined as otherwise. Results are also separated by variant type (coding or noncoding, SNV or non-SNV). Because there were only 22 coding non-SNVs that are near splice sites and all of these variants have the same label (“pathogenic”), we excluded this condition in our evaluations due to the limited sample size and the inapplicability of binary classification metrics like AUROC and AUPRC. (c) Zero-shot noncoding ClinVar evaluations after filtering out all variants with either a SpliceAI score ≥ 0.1 or a Pangolin score ≥ 0.1 (i.e., keeping variants with low SpliceAI and low Pangolin scores).
Extended Data Fig. 5 BRCA1/2 variant effect prediction and DART-eval for regulatory genomics.
(a) Zero-shot prediction of BRCA1 variant pathogenicity for coding and noncoding SNVs evaluated in aggregate, showing AUROC and AUPRC scores across models. (b) Zero-shot prediction of BRCA1 variant pathogenicity for noncoding SNVs separated according to “intronic” and “splice site” variants based on whether the variant site is located more than 8 bp away from the intron-exon boundary26. (c) Zero-shot prediction of BRCA2 variant pathogenicity for coding (left), noncoding (center), and aggregated (right) SNVs, showing AUROC and AUPRC scores across models. (d) Comparison of AUROCs for the supervised classification of BRCA1 SNVs using embeddings from Evo 2 40B block 20, for pooling functions that use different window sizes around the variant site to average embeddings. AUROCs are averaged from 5-fold cross-validation on the training set, and are from the best-performing ridge regression regularization parameter for each pooling function. (e) Comparison of AUROCs for the supervised classification of BRCA1 SNVs trained with embeddings from different blocks of Evo 2 40B and Evo 1. AUROCs are averaged from 5-fold cross-validation on the training set, and are from the best combination of pooling function and ridge regression hyperparameter α for each layer. (f) DART-Eval results for zero-shot regulatory DNA tasks. Task 1 evaluates models on their ability to distinguish candidate cis-regulatory elements (cCREs) from shuffled sequences, Task 2 tests their ability to identify transcription factor (TF) motifs by distinguishing true TF binding sites from control sequences, and Task 5 predicts variant effects for chromatin-accessibility QTLs (caQTLs, African) and dynamic sequence QTLs (dsQTLs, Yoruban). Sequence likelihoods were computed under each model and used to measure classification accuracy with mean AUROC. Across these tasks, Evo 2 7B and Evo 2 40B outperformed other baselines. For Task 5, while we did not see strong signal across all models when using the zero-shot log-likelihoods, Evo 2 embeddings were predictive of noncoding variant effects.
Extended Data Fig. 6 SAE overview with training data, metrics, and feature embedding.
(a) Composition of the prokaryotic sequences randomly subsampled for SAE training. (b) Composition of the eukaryotic sequences randomly subsampled for SAE training. (c) Feature density histograms for SAEs demonstrate that Layer 26 converged with fewer low-frequency features while the distribution peaks around a firing frequency of 1e-3 representing sparse yet generalizing features. (d) Activation density for all layer 26 SAE features over the E. coli K12 MG1655 genome (left) or for a length-matched segment of human chromosome 17 (right). (e) Mean non-zero activation for all layer 26 SAE features over the E. coli K12 MG1655 genome (left) or for a length-matched segment of human chromosome 17 (right). (f) UMAP embedding of layer 26 SAE feature weights colored by activation density difference between eukaryote and prokaryotic sequence for each feature, with features presented in Fig. 4 labeled.
Extended Data Fig. 7 SAE features reveal semantic, structural, and organizational details of prokaryotic genomes.
(a) Diagram depicting the contrastive feature search strategy used to identify and quantify selected features. (b) Mean activations of the phage feature across phage regions annotated by geNomad and matched-length bacterial non-phage sequences across 100 randomly selected GTDB genomes. AUROC was computed over mean activations for each region. (c) (i) Scrambling spacer sequences does not ablate the phage feature activation pattern on spacer sequences. (ii) Using a constant scrambled CRISPR direct repeat sequence ablates phage feature activation for the first two spacers. (iii) Using different scrambled sequences instead of CRISPR direct repeats ablates the phage feature activation pattern. (iv) Natural sequence activation pattern, as in Fig. 4b. (d) Additional examples of sequences not annotated as phage sequences by geNomad which the phage feature activates on. (e) Activations of additional features associated with open reading frames (ORFs), plus strand or minus strand ORFs ((+) ORF and (–) ORF), and intergenic loci in a 100 kb region in E. coli K12 MG1655. (f) Mean activations for prokaryotic organizational features on different annotation types across the E. coli K12 MG1655 genome. AUROC was computed over mean activations for each region. Consecutive intergenic positions were merged into single regions. The ORF associated features were evaluated for their abilities to predict the presence of either plus strand or minus strand ORFs. (g) Mean activations for protein secondary structure features on different secondary structure types across ORFs in the E. coli K12 MG1655 genome. AUROC was computed over mean activations of positions annotated as each secondary structure type per protein. (h) Ablation experiments on SAE features with high F1 scores for biological elements demonstrate increases in average CE and ratio of ablated to original CE. These results suggest that learned features can be causally relevant downstream.
Extended Data Fig. 8 SAE features reveal semantic, structural, and organizational details of eukaryotic genomes.
(a) Activations of a frameshift-associated feature in a 100 bp region following different mutation types. (b) F1, precision, and recall scores across mutation types for features shown in (a). (c) Activations for SAE features associated with exons, introns, and their boundaries in the human genome, shown for a 6000 bp region in chromosome 1. (d) F1, precision, and recall scores for each SAE feature shown in (c) to its corresponding genomic element. These scores were calculated at the level of individual bases across 1,000 genes randomly selected from the human genome. (e) Mean activations for each SAE feature shown in (c) on different annotation types across the human genome, and the corresponding AUROC values of the features to their corresponding annotation type. AUROCs were calculated at the level of individual bases across 1,000 genes randomly selected from the human genome. (f) Recall-FDR curve of Evo 2 SAE features compared with HOMER on human H1-2CORE motifs and promoter-enriched motifs.
Extended Data Fig. 9 Additional results for unconstrained generation at genome and chromosome scale.
(a) Amino acid sequence recovery for different genes across Evo 2 models when prompted with genomic context of the respective gene. Evo 2 models were tested across multiple stages of context extension, including the base model pretrained at 8k token context, intermediate models at 262k and 524k token context, and the final model with context extension to 1 M token context. (b) Structural alignment of AlphaFold 3-predicted complexes of native human mitochondrial proteins and of AlphaFold 3-predicted complexes of Evo 2-generated human mitochondrial proteins. (c) Predicted aligned error (PAE) of the Evo 2-generated mitochondrial complexes from AlphaFold 3. (d) Distribution of mitochondrial codon frequencies between Evo 2-generated mitochondrial sequences and H. sapiens mitochondria. (e) Frequency of each tRNA anticodon across Evo 2-generated mitochondria as annotated by MitoZ. (f) ESMFold predicted local distance difference test (pLDDT) distributions of natural and Evo 2-generated M. genitalium genes called by Prodigal. (g) Distribution of TM scores from Evo 2-generated M. genitalium genes against UniRef50 AlphaFold DB. (h) Predicted AlphaFold 3 structures, TM scores, and sequence identity comparing genes from Evo 2-generated M. genitalium with natural proteins. (i) Distribution of genes, introns, tRNAs, and promoters on an Evo 2-generated S. cerevisiae sequence compared with the natural S. cerevisiae chromosome III (gray line). (j) Distribution of gene lengths and pLDDTs of Evo 2-generated and natural S. cerevisiae genes, annotated by GeneMark-ES. (k) Distribution of TM scores of genes from Evo 2-generated S. cerevisiae sequence against UniRef 50. (l) Distribution of different secondary structures in Evo 2-generated against S. cerevisiae chromosome III wildtype genes. (m) Protein structure of genes from Evo 2-generated S. cerevisiae sequence compared with the natural structure and sequence. (n) Tetranucleotide usage deviation (TUD) comparison between natural S. cerevisiae, S. pombe, and Evo 2-generated sequences for whole sequence, CDS, and promoters (upstream of gene start).
Extended Data Fig. 10 Additional data for generative chromatin accessibility.
(a) Simpler patterns were designed in which each peak had uniform width. Good experimental validation of the predicted peaks was observed, especially when the peak width is longer and when all Enformer and Borzoi models agree in their predictions. Accuracy drops to an AUROC of 0.89 with short peaks of 384 bp in the “short wave” (right), especially when the Enformer and Borzoi predictions disagree. Compare to Fig. 6f-h. (b) Top: Dinucleotide frequencies in randomly proposed sequences after beam search filtering with Enformer and Borzoi still show significant deviation from the baseline mm39 frequency. Middle: Dinucleotide frequencies, generated by a bigram proposal distribution based on the mm39 reference genome, match the baseline mm39 frequency by construction. Bottom: Sequences generated by Evo 2 when prompted with a portion of the mouse genome have natural dinucleotide frequencies, despite this never being directly enforced during inference-time sampling. (c) Inference-time scaling results based on the AUROC of Enformer/Borzoi-predicted designs comparing a uniformly random proposal, a bigram proposal, and an Evo 2 7B proposal. The uniform proposal consistently lags Evo 2. The bigram proposal appears to have better initial scaling at lower beam search widths, but this plateaus as the beam search width increases. The Evo 2 proposal is the first to reach an AUROC > 0.95 threshold, above which designs tend to have qualitatively clear design success. Individual design runs are plotted as circles and the averages across design runs for each beam search width and each generative model are plotted as bold Xs. (d) Quantified agreement between the single Enformer and four aligned Borzoi prediction tracks using the Intraclass Correlation Coefficient (ICC) from a two-way mixed-effects model (ICC(2, k); Methods). A value of 1 indicates perfect agreement across all five tracks. Despite never directly optimizing for ensemble agreement, sequences generated by Evo 2 have consistently high ICC values of ~0.95 even at the lowest beam search widths. Both uniform and bigram proposals have much lower ensemble agreement, though the ICC tends to improve as the increasing beam search width filters out poor designs. Individual design runs are plotted as circles and the averages across design runs for each beam search width and each generative model are plotted as bold Xs. (e) The best scoring designs combining both AUROC and ICC for the “ARC” Morse code pattern across different generative proposals. Despite high AUROC and ICC values, the uniform and bigram proposals are qualitatively worse in terms of desired pattern agreement and Enformer/Borzoi ensemble agreement than the sequence generated by an Evo 2 proposal. We hypothesize that ensemble disagreement corresponds to greater uncertainty in the Enformer/Borzoi accessibility predictions and is consistent with adversarial inputs. (f) Genomic statistics are plotted for three experimentally validated Morse code designs (from left to right, “ARC”, “EVO2”, and “LO”). Then, these statistics are plotted combining all three designs into a single plot (“Evo 2”) followed by plotting statistics for the same three Morse code designs but generated by a uniform or a bigram proposal. Statistics are separated by regions with a designed peak and without a designed peak. The rightmost column plots the statistics for regions of the Mus musculus genome in experimentally determined DNASE-seq peak regions and in regions without peaks. Additional details on these statistics are provided in Methods. Individual plots are shaded gray if there is a significant difference (P < 0.05) between “peak” and “no peak” conditions under a two-sided Welch’s t-test. FFT, Fast Fourier Transform. (g) Genomic tracks visualizing the sequence statistics plotted in (f) for the “LO” design. AUROC indicates how predictive the statistic is for the binary peak region labels. Spearman r indicates the correlation between the statistic and the experimentally determined ATAC-seq coverage value. FFT, Fast Fourier Transform. (h) Genomic tracks visualizing TF motif-related statistics along the “LO” design, where the motifs have been restricted to TFs expressed in mESCs. (i) Distribution of genes plotted by log(1 + TPM) expression values on the x-axis, used to determine a gene expression cutoff for mESCs (log(1 + TPM) > 1). This expression cutoff was used to determine whether TF motifs found in the “LO” design were significantly enriched for TFs expressed in mESCs.
Extended Data Fig. 11 Additional data for generative chromatin accessibility and cell-type specificity.
(a) Genomic tracks visualizing the sequence statistics plotted in (Extended Data Fig. 10f) for the “ARC” and “EVO2” designs. AUROC indicates how predictive the statistic is for the binary peak region labels. Spearman r indicates the correlation between the statistic and the experimentally determined ATAC-seq coverage value. (b) A histogram distribution of 24 designed sequences [see panels (f) and (g)] where high chromatin accessibility in K562 and low accessibility in HEK293T was specified, plotted according to the K562/HEK293T fold change in mean coverage across all positions in the peak. A fold change of 1 indicates the same mean coverage in both cell types. Four sequences with >2-fold change and one sequence with >3-fold change in mean coverage were observed (where K562 has higher mean coverage), representing a 4-17% success rate. (c) Summary results of designs in human cells that attempt to either maximize accessibility (“K562 on” and “HEK293T on”) or minimize accessibility (“K562 off” and “HEK293T off”) across the full designed sequence (see panels (d) and (e), respectively). “Mean coverage” indicates the mean of coverage values across all 1-kb sequence positions. All designs that maximize accessibility have mean coverage values > 2.7 and all designs that minimize accessibility have mean coverage values < 1.3. (d–h) Plots showing ATAC-seq coverage of 1-4 kb designs in which the same sequence was integrated into both HEK293T and K562. The design patterns were grouped into five main categories. (d) The first consists of designs that aim to maximize accessibility in both cell lines across an entire 1-kb region. (e) The second consists of designs that aim to minimize accessibility in both cell lines across an entire 1-kb region. (f) The third consists of designs that aim to design a single peak in the first half of the K562 region while minimizing accessibility across the whole region in HEK293T. (g) The fourth category is similar to the third, but where we aim to design a single peak in the second half of the K562 region. (h) The fifth consists of miscellaneous 4-kb designs that specify either two or four peaks in either K562 alone or in both cell lines. For all human cell line experiments, ATAC-seq coverage values are the average across two transfection/nucleofection replicate populations of cells. (i,j) Distribution of genes plotted by log(1 + TPM) expression values on the x-axis, used to determine a gene expression cutoff for K562 (log(1 + TPM) > 1.5) (i) and for HEK293T (log(1 + TPM) > 2.15) (j). This expression cutoff was used to determine whether TF motifs found in the B7, B10, B11, and B12 designs were significantly enriched for TFs expressed in K562 (i) or in HEK293T cells (j).
Supplementary information
Supplementary Information
This file contains Methods, supplementary text and appendix.
Reporting Summary
Supplementary Data 1
Human variant effect prediction results. Scores and metadata for human variant effect prediction analysis, related to Fig. 3 and Extended Data Fig. 4.
Supplementary Data 2
Mechanistic interpretability transcription factor motif report. A comprehensive list of promoter-enriched motifs from the HOCOMOCO v.12 CORE database and associated SAE feature hits, related to Fig. 4f and Extended Data Fig. 8f.
Supplementary Data 3
DNA sequences for experimental chromatin accessibility designs. Experimentally tested DNA sequences in the Morse code mESC and HEK293T/K562 chromatin accessibility design tasks, related to Fig. 6 and Extended Data Fig. 10.
Rights and permissions
Open Access This article is licensed under a Creative Commons Attribution-NonCommercial-NoDerivatives 4.0 International License, which permits any non-commercial use, sharing, distribution and reproduction in any medium or format, as long as you give appropriate credit to the original author(s) and the source, provide a link to the Creative Commons licence, and indicate if you modified the licensed material. You do not have permission under this licence to share adapted material derived from this article or parts of it. The images or other third party material in this article are included in the article’s Creative Commons licence, unless indicated otherwise in a credit line to the material. If material is not included in the article’s Creative Commons licence and your intended use is not permitted by statutory regulation or exceeds the permitted use, you will need to obtain permission directly from the copyright holder. To view a copy of this licence, visit http://creativecommons.org/licenses/by-nc-nd/4.0/.
About this article

Cite this article
Brixi, G., Durrant, M.G., Ku, J. et al. Genome modelling and design across all domains of life with Evo 2. Nature (2026). https://doi.org/10.1038/s41586-026-10176-5
-
Received:
-
Accepted:
-
Published:
-
Version of record:
-
DOI: https://doi.org/10.1038/s41586-026-10176-5