Introduction
Lower respiratory tract infections are a leading cause of mortality from infectious diseases worldwide1. The inability to precisely identify pathogens in respiratory infections often hinders the effective administration of targeted drug therapies. This limitation can aggravate the patient’s condition, leading to worsening symptoms or, in severe cases, death. Diagnosing and managing certain persistent infections of the lower respiratory tract poses significant challenges2. In such cases, accurate identification of the pathogen and subsequent targeted treatment are of critical importance.
However, in China, nearly half of all pulmonary infection cases remain etiologically undiagnosed3. This is because the clinical conventional tests such as traditional microbial culture, immunological methods, and polymerase chain reaction (PCR) detection can be time-consuming, have a low detection rate, or need to target pathogen. They require extensive resources and may not identify fastidious pathogens, rare and atypical pathogens, or pathogens that are no longer viable due to antimicrobial therapy4.
Next-generation sequencing (NGS) is a high-throughput method capable of directly detecting nucleic acids in clinical samples and generating millions to billions of reads per instrument run. Metagenomic next-generation sequencing (mNGS), one of the most widely recognized applications of NGS, has been progressively employed in clinical scenarios for identifying unknown infections, rare, and atypical pathogens5,6,7. Additionally, a new variant of NGS, targeted next-generation sequencing (tNGS), has recently emerged. mNGS workflows aim to sequence as much DNA and/or RNA as possible from a sample, whereas tNGS workflows focus on enriching specific genetic targets for sequencing8. Currently, tNGS enriches target pathogens primarily through primer amplification and probe capture techniques. All three NGS assays have been reported in studies on clinical applications, with most demonstrating significant value in aiding clinical diagnosis9,10,11,12,13. However, no study has directly compared the efficacy of pathogen identification between mNGS, amplification-based tNGS, and capture-based tNGS. The distinct advantages and characteristics of each NGS method remain unclear, posing challenges for clinicians in selecting the most appropriate detection approach.
Using the comprehensive clinical diagnosis as the standard, this study investigates the performance of mNGS, amplification-based tNGS, and capture-based tNGS, comparing their respective advantages and disadvantages. It aims to guide clinicians in making more informed decisions for detection, thereby enhancing clinical diagnosis, disease management, and public health.
Materials and methods
Study design and population
All patients with suspected lower respiratory tract infection admitted to the department of respiratory and critical care medicine at the Second Xiangya Hospital of Central South University from January 2023 to October 2023 were retrospectively investigated. The study design received approval from the Ethics Committee of the Second Xiangya Hospital of Central South University in accordance with the Declaration of Helsinki (LYF2022229). The study was conducted with the consent of every human participant.
Patients were eligible for enrolment if they (1) were at least 18 years of age, (2) suspected with lower respiratory tract infection, (3) had sufficient bronchoalveolar lavage fluid (BALF) samples for conventional microbiological tests (CMTs) and three NGS. Three NGS included mNGS, amplification-based tNGS, and capture-based tNGS. CMTs included microbial culture, immunological test, and PCR. During the mNGS testing process, a subset of samples underwent DNA extraction only, without RNA extraction. This decision was made by clinicians based on a comprehensive evaluation of several factors, including sample volume, clinical presentation, CMT results, and cost considerations. A comprehensive clinical diagnosis for each patient was judged by more than two clinicians based on the clinical symptom and CMT results. Patients with suspected lower respiratory tract infection fulfilled the following criteria: (1) at least one compatible symptom, such as new-onset fever, cough, or dyspnea, (2) new-onset radiological findings on chest images. Patients without a clear comprehensive clinical diagnosis were excluded from this study.
In this retrospective study, BALF samples were stored in sterile screw-capped cryovials. A volume of 5–10 mL was collected from each patient and divided equally into three for mNGS, amplification-based tNGS, and capture-based tNGS. These samples were kept at ≤ − 20 ℃ during transportation, carefully handled and preserved to maintain the quality of the genetic material. The stability of the nucleic acids in the samples was assessed during subsequent sequencing.
Metagenomic next-generation sequencing
DNA was extracted from 1 mL BALF samples using a QIAamp® UCP Pathogen DNA Kit (Qiagen, Valencia, CA, USA) according to the manufacturer’s instructions. Human DNA was removed using Benzonase (Qiagen, Valencia, CA, USA) and Tween20 (Sigma, St. Louis, Missouri, USA)14. The QIAamp® Viral RNA Kit (Qiagen, Valencia, CA, USA) was applied to extract total RNA, and ribosomal RNA was removed using a Ribo-Zero rRNA Removal Kit (Illumina, San Diego, CA, USA). RNA was reverse transcribed, and amplified by Ovation RNA-Seq system (NuGEN, CA, USA). Following fragmentation, the library was constructed based on combined DNA and reverse transcribed using Ovation Ultralow System V2 (NuGEN, CA, USA) and the concentration of the library was measured using Qubit. Sequencing was executed on Illumina Nextseq 550Dx with 75-bp single-end reads. For negative controls, peripheral blood mononuclear cell (PBMC) samples with 105 cells/mL from healthy donors in parallel were prepared with each batch, using the same protocol, and sterile deionized water was extracted alongside the samples to serve as non-template controls (NTC). NTCs were subjected to the complete assay workflow, mirroring the procedures applied to clinical samples, commencing with nucleic acid extraction.
Raw sequencing data was processed using software Fastp to remove reads containing adapters or ambiguous “N” nucleotides and low-quality reads. Low-complexity reads were removed by Kcomplexity with default parameters. Human sequence data were identified and excluded by mapping to a human reference genome (hg38) using Burrows-Wheeler Aligner software. Microbial reads were then aligned to self-building database with SNAP v1.0 beta.18. Approximately 20 million reads were generated for each sample. For pathogen with background reads in negative control, a positive detection was reported for a given species or genus if the reads per million (RPM) ratio was ≥ 10, where the RPM ratio was defined as the RPMsample/ RPMNTC. For pathogen without background reads in negative control, the RPM threshold for a positive detection was set ≥ 0.05.
Amplification-based targeted next-generation sequencing
BALF sample was liquefied by combining it with dithiothreitol. Subsequently, the homogenate was utilized for total nucleic acid extraction and purification via the MagPure Pathogen DNA/RNA Kit (R6672-01B, Magen, Guangzhou, China), following the manufacturer’s protocol. The RNA reverse transcription and library construction was used with the Respiratory Pathogen Detection Kit (KS608-100HXD96, KingCreate, Guangzhou, China). A NTC was set up to monitor the whole sequencing process (from the nucleic acid extraction step). This process encompassed two rounds of PCR amplification. The sample nucleic acid and cDNA were employed as templates, and a set of 198 microorganism-specific primers were selected for ultra-multiplex PCR amplification to enrich the target pathogen sequences, spanning bacteria, viruses, fungi, mycoplasma, and chlamydia. After the amplification, PCR products underwent purification with beads, followed by amplification using primers containing sequencing adapters and distinct barcodes. The quality and quantity of the constructed library were evaluated using the Qsep100 Bio-Fragment Analyzer (Bioptic, Taiwan, China) and Qubit 4.0 fluorometer (Thermo Scientific, Massachusetts, United States), respectively. The library was subsequently subjected to sequencing on an Illumina MiniSeq platform with each library yielded approximately 0.1 million reads, with a sequencing read length of single-end 100 bp.
Sequencing data were analyzed using KingMed (KingMed, Changsha, China) developed analysis pipeline. The raw data underwent initial identification via the adapter. Reads with single-end lengths exceeding 50 bp were retained, followed by low-quality filtering to retain reads with Q30 > 75%, ensuring high-quality data. The single-ended aligned reads were then compared using the self-building clinical pathogen database to determine the read count of specific amplification targets in each sample. The reference sequences used for read mapping was a database curated from different sources, including Genbank database, Refseq database, and Nucleotide database from NCBI.2.5.
Capture-based targeted next-generation sequencing
BALF samples were mixed with lysis buffer (Thermo Scientific, Massachusetts, United States), protease K (Yeasen, Shanghai, China), and binding buffer (Thermo Scientific, Massachusetts, United States). This mixture was subjected to mechanical disruption via a vortex mixer and beads for a duration of 30 s. Meanwhile, a positive control and a negative control were set up to monitor the whole experiment process (from the nucleic acid extraction step) of the capture-based tNGS. The positive control consisted of a mixture of Staphylococcus aureus (103 CFU/mL) and PBMCs at a concentration of 105 cells/mL, derived from healthy donors. The negative control comprised PBMCs (105 cells/mL) obtained from healthy donors. Following this, a simultaneous extraction of DNA and RNA was performed utilizing the VAMNE Magnetic Pathogen DNA/RNA Extraction Kit (Vazyme, Nanjing, China). Nucleic acid quantification was conducted employing a Qubit 3.0 fluorometer, utilizing the double-stranded DNA (dsDNA) and RNA high sensitivity assay kits. For the synthesis of cDNA and the preparation of the sequencing library, the HieffNGS®C37P4 OnePot cDNA & gDNA Library Prep Kit (Yeasen, Shanghai, China) was utilized, adhering to the manufacturer’s instructions. Target sequence enrichment was achieved by incubating the samples with a set of 1872 microorganism-specific probes (GenePlus, Beijing, China) for an approximate duration of 4 h, followed by an 18-cycle PCR amplification of the captured products. The probes target 1124 bacteria, 218 fungus, 157 DNA viruses, 317 RNA viruses, and 56 parasites. The amplified products were then processed to form DNA nanoballs (DNBs). Sequencing was executed on the DNBSEQ-G99 platform with 100-bp single-end reads, targeting a sequencing depth of 5 million reads.
For the analysis of sequencing data, initial preprocessing of raw data involved the removal of low-quality sequences, residual adapters, and reads of insufficient length. Sequences corresponding to microbial rRNA and human genomic material were also excluded. The refined data set was then aligned and annotated against a self-building database of pathogenic microorganisms, leveraging BLAST software for sequence comparison15,16. Non-duplication reads aligning with the target capture regions were classified as target reads and normalized to RPM to facilitate quantitative comparisons.
Statistical analysis
Paired nonparametric variables were compared using the Wilcoxon test. Unpaired nonparametric variables were compared using the Mann-Whitney test. The significance of the difference was tested by the McNemar test. All tests were two-tailed and significance was set at 5%. For multiple comparisons, the P value was adjusted to Padj value by Bonferroni’s correction. In this study, the threshold of Padj value was 0.017. The minimum sample size (N = 165) was calculated using PASS software (v21.0; NCSS Corporation, USA) with a power of 0.9, an alpha value of 0.05, a prevalence of 0.2, an alternative sensitivity of 0.75, and an alternative specificity of 0.8. Statistical analyses were performed using SPSS software (v26.0; IBM Corporation, USA). All figures and analyses were performed with R version 4.3.1, Python version 3.12.4, and GraphPad Prism version 9.5.0 for Windows (GraphPad Software LLC., San Diego, CA, USA).
Results
Study population
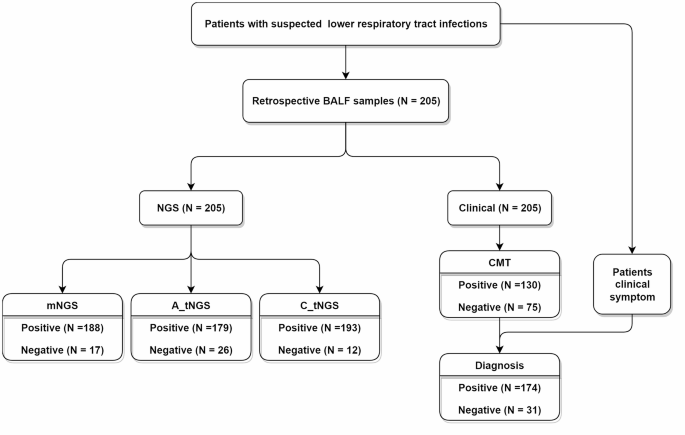
In this study, a total of 205 BALF samples were collected from patients suspected with lower respiratory tract infections (Supplementary Table 1). Each sample underwent testing using mNGS, amplification-based tNGS, capture-based tNGS, and CMTs. Based on the comprehensive clinical diagnosis, 174 patients were identified as lower respiratory tract infection, and the other 31 were diagnosed as non-infection. Among 205 samples, capture-based tNGS, mNGS, and amplification-based tNGS reported microorganisms in 193, 188, and 179 samples, respectively (Fig. 1).

Study population and samples collection.
Cost and turnaround time comparisons of three NGS
The cost and turnaround time (TAT) of three NGS used in this study were compared (Fig. 2). The cost of mNGS (840 USD) were far higher than those of the two tNGS (130–250 USD). The cost of amplification-based tNGS (130 USD) was the lowest in this study. As can be seen from the workflow, this huge difference was mainly due to the data size of sequencing. Which was 20 million single end (SE) 75 bp reads in mNGS, 0.1 million SE 100 bp reads in amplification-based tNGS, and 5 million SE 100 bp reads in capture-based tNGS.

Comparative analysis of cost and turnaround time of three NGS.
The TAT of mNGS (20 h) was also longest compared to that of amplification-based tNGS (12.5 h) and capture-based tNGS (16.5 h). The amplification-based tNGS was the fastest approach in this study. For nucleic acid extraction, mNGS took more time due to the independent extraction of DNA and RNA, while that were extracted together in the two tNGS. For library preparation, mNGS was faster than the two tNGS because it did not need to enrich specific nucleic acid. Compared to multiplex PCR amplification, probe hybridization was slower, which was why the capture-based tNGS took the most time in this section. For sequencing and data analyzing, the two tNGS both took 5.5 h, while mNGS took more than twice that time (12 h). Because mNGS required a platform with higher throughput due to its large data size requirement, which also means it needs more time in sequencing and data analyzing.
Comparison of microorganisms reported by three NGS
To clarify the species spectrum size of the three NGS in real clinical cases, the reported species were counted (Fig. 3A). There were obvious differences among the species spectra of the three NGS. The species spectrum size of mNGS was the largest, covering 80 species. Whereas the value was 71 and 65 for the capture-based tNGS and amplification-based tNGS respectively. Specifically, mNGS solely identified 21 species, including 9 gram-negative bacteria, 6 gram-positive bacteria, 2 fungi, 2 DNA virus, and 2 RNA virus. Despite this, the two tNGS still solely identified some species, involving 5 gram-negative bacteria, 3 gram-positive bacteria, 3 DNA virus, and 2 RNA virus for the capture-based tNGS, and 4 RNA virus, 3 fungi, and 2 gram-positive bacteria for the amplification-based tNGS.

Comparative analysis of microorganisms across three NGS. (A) Spectrum of reported species. Each part indicates the number of species reported by the respective NGS. (B) Consistency in microorganism reporting and type distribution. In the left bar plot, bar heights represent the total count of microorganisms reported by each NGS. The bottom plot organizes results by groups based on the consistency of microorganism detection across the three NGS. In the central bar plot, bar heights represent the cumulative count of microorganisms identified by all three NGS within each group. The top bar plot illustrates the proportion of each microorganism type within the total microorganisms reported by the three NGS for each group. (C) Common microorganisms consistently reported by all three NGS. Bar heights represent the total number of samples in which these microorganisms were detected. (D–F) Microorganisms missed by mNGS, amplification-based tNGS, and capture-based tNGS, respectively. Bar heights represent the number of samples for which each NGS failed to detect specific microorganisms. (G) RPM comparison of mNGS and capture-based tNGS. Data points represent individual microorganisms which were consistently reported by the two NGS. Bars represent interquartile ranges, and the median value indicated by the central line within each bar.
In the 205 samples, the capture-based tNGS detected the most microorganisms, identifying 678 in total, followed by mNGS with 535 and the amplification-based tNGS with 481 (Fig. 3B; Supplementary Fig. 1). The three NGS consistently detected 280 microorganisms, mainly consisting of DNA virus, fungi, and gram-negative bacteria. Besides, 149 microorganisms were consistently identified by mNGS and the capture-based tNGS, with a high proportion of gram-positive bacteria. In comparison, the two tNGS consistently identified 89 microorganisms, with the exception of RNA viruses (N = 47), the majority were DNA viruses and bacteria. The capture-based tNGS (78.38%, 58/74) and the amplification-based tNGS (76.32%, 58/76) showed a high degree of concordance in the identification of RNA viruses. 43 microorganisms were consistently identified by mNGS and the amplification-based tNGS, which had a high fungi proportion. For the microorganisms reported solely, there was the most in the capture-based tNGS (N = 160), followed by the amplification-based tNGS (N = 69) and mNGS (N = 63). More DNA virus and less fungi were in the capture-based tNGS, more gram-positive bacteria and RNA virus were in the amplification-based tNGS, and more gram-negative bacteria was in mNGS (Fig. 3B).
In order to gain a deeper understanding of the characteristics of the three NGS in reporting, the distribution of microorganisms reported was analyzed. The most common microorganisms included human betaherpes virus 5 (HHV-5), human gammaherpes virus 4 (HHV-4), severe acute respiratory syndrome coronavirus 2 (SARS-CoV-2), human alphaherpes virus 1 (HHV-1), Candida albicans, Acinetobacter baumannii, Streptococcus pneumoniae, and Pneumocystis jirovecii (Supplementary Fig. 2). Among these, HHV-5, C. albicans, HHV-4, P. jirovecii, A. baumannii, HHV-1 were frequently reported consistently by the three NGS (Fig. 3C). Moreover, mNGS mainly missed HHV-5 (N = 29), S. pneumoniae (N = 27), HHV-1 (N = 25), and HHV-4 (N = 23), which were reported by the other two NGS, especially the capture-based tNGS (Fig. 3D). But for SARS-CoV-2, that was because 165 (80.49%) samples were not extracted RNA for mNGS considering the sample volume in this study. However, even within the remaining 40 samples where RNA extraction was performed, mNGS exhibited a lower sensitivity for SARS-CoV-2 detection, missing 47.37% (9/19) of positive cases compared to the combined results from the two tNGS (Supplementary Fig. 3). The amplification-based tNGS mainly missed HHV-5 (N = 35), Enterococcus faecium (N = 32), HHV-4 (N = 30), Corynebacterium striatum (N = 29), S. pneumoniae (N = 23), and HHV-1 (N = 22) (Fig. 3E). Notably, among these microorganisms, E. faecium and C. striatum were not included in the panel of the amplification-based tNGS used in this study. While the capture-based tNGS missed fewer microorganisms, mainly C. albicans (N = 14), Human betaherpes virus 7 (N = 13), and Fusobacterium nucleatum (N = 12) (Fig. 3F).
To figure out the reason of different reported microorganisms between mNGS and tNGS, the RPM of consistent microorganisms reported by mNGS and the capture-based tNGS were compared (Fig. 3G). The amplification-based tNGS was not included in the comparison because it was based on the principle of PCR amplification, and it is not possible to obtain the RPM it originally enriched. In the microorganism species commonly missed by mNGS, the capture-based tNGS reported significant more reads, indicating the sensitivity of the capture-based tNGS was significantly higher than mNGS. This is probably why the capture-based tNGS reported more microorganisms than mNGS.
Diagnostic value for lower respiratory tract infection
Benchmarked against the comprehensive clinical diagnosis, the diagnostic value of three NGS were evaluated in the Table 1. The capture-based tNGS demonstrated the highest overall accuracy and sensitivity among three NGS, achieving 93.17% and 99.43%, respectively. In comparison, mNGS showed an accuracy of 90.73% and sensitivity of 91.95%, while amplification-based tNGS showed an accuracy of 90.24% and sensitivity of 92.53%. However, the specificity of capture-based tNGS was the lowest, which was just 58.06%. While that of mNGS and amplification-based tNGS were 83.87% and 77.42%. Overall, the capture-based tNGS performed significantly higher diagnostic value (Padj < 0.017), including accuracy, sensitivity, specificity, positive predictive value (PPV), and negative predictive value (NPV). There was no difference between mNGS and the amplification-based tNGS.
To gain a deeper understanding of the differences among the three NGS, an assessment was conducted at the pathogen type level (Table 2). Specifically, mNGS showed high accuracy and sensitivity across most of pathogen types, with values ranging from 92.20 to 96.10% and 90.11–98.85%, respectively. However, for RNA virus, these metrics were significantly lower, with accuracy at 76.10% and sensitivity dropping to just 24.62%. Even focusing solely on samples subjected to mNGS RNA extraction, the assay’s sensitivity remained at 68.18% (15/22) (Supplementary Table 2). Despite this, the specificity of mNGS remained consistently strong across all pathogen types, ranging from 91.15 to 100.00% (Table 2). Besides, the specificity of amplification-based tNGS was also robust, which was ranging from 91.53 to 98.25%. The amplification-based tNGS demonstrated high accuracy in DNA virus (90.73%), RNA virus (94.15%), and fungi (93.17%), but reduced accuracy in gram-positive bacteria (69.76%). Sensitivity was particularly strong for RNA virus (93.85%) and fungi (91.95%), yet notably poor for gram-positive bacteria (40.23%) and gram-negative bacteria (71.74%). For capture-based tNGS, aside from a specificity of 74.78% for RNA virus, the accuracy, sensitivity, and specificity across all pathogen types were consistently high, ranging from 83.90 to 98.91%. In comparison, for both gram-positive and gram-negative bacteria, the amplification-based tNGS exhibited a lower diagnostic value (Padj < 0.017). In DNA virus, the capture-based tNGS showed inferior identification performance than the amplification-based tNGS (Padj < 0.017). For the identification of RNA virus, mNGS performed worse than the two tNGS (Padj < 0.017). While the diagnostic value of the three NGS showed no significant difference in fungi (Padj > 0.017).
The diagnostic value of the three NGS at the pathogen level was evaluated. The identification accuracy of mNGS for SARS-CoV-2, Aspergillus fumigatus, and Haemophilus influenzae was lower than that of both tNGS, with the largest discrepancy observed for SARS-CoV-2 (Fig. 4A). Notably, even in samples not subjected to RNA extraction for mNGS analysis, the diagnostic accuracy of mNGS for SARS-CoV-2 detection remained suboptimal (85.00% vs. 92.50% vs. 92.50%) (Supplementary Fig. 4). Conversely, the amplification-based tNGS demonstrated reduced accuracy for certain pathogens, including E. faecium, Haemophilus parainfluenzae, C. striatum, and Streptococcus mitis (Fig. 4B). Notably, H. parainfluenzae and S. mitis were also absent from its detection panel. In contrast, the capture-based tNGS showed significantly lower accuracy for HHV-5, S. pneumoniae, and HHV-4, which was primarily due to reduced specificity (Fig. 4C). However, for pathogens like Mycobacterium tuberculosis, P. jirovecii, Klebsiella pneumoniae, and A. baumannii, there were no significant differences in identification accuracy across the three NGS (Fig. 4D).

Analysis of detection accuracy among three NGS. (A–C) Pathogen species with lower accuracy by mNGS, amplification-based tNGS, and capture-based tNGS, respectively. In the left bar plot, bar heights represent the total number of samples in which the positive detection results for each microorganism, as detected by NGS, were confirmed by the comprehensive clinical diagnosis. In the right bar plot, bar heights represent the accuracy rate. TP, true positive. (D) Pathogens species with similar accuracy among three NGS. TP, true positive.
Genotypes, AMR genes, and VFs
In addition, the capability to identify pathogen genotypes was assessed in this study. For SARS-CoV-2, mNGS was limited to species-level identification, prompting a comparison just between the two tNGS. Among all the SARS-CoV-2 genotypes consistently identified by both tNGS methods, it was always the capture-based tNGS that provided a more refined genotype distinction (Fig. 5A).

Performance analysis of two tNGS for additional content identification. (A) SARS-CoV-2 genotypes. The inner circle represents all SARS-CoV-2 positive sample results reported by the amplification-based tNGS. The outer circle represents corresponding results for the same samples, as reported by the capture-based tNGS. (B) AMR genes. The heatmap displays sample distribution, with color intensity indicating the number of samples. The left bar plot represents the total number of samples in which AMR genes were detected, categorized by microorganism. The top bar plot represents the total frequency of each AMR gene detected across samples. (C) VFs. Bar heights represent the total number of samples in which each VF was detected.
Remarkably, examination of the outputs from the two tNGS unveiled the presence of numerous antimicrobial resistance (AMR) genes and virulence factors (VFs). The two tNGS consistently identified several genes, including blaKPC, mecA, iucA, peg344, among others (Fig. 5B and C). However, the capture-based tNGS approach demonstrated superior detection capabilities, identifying a broader spectrum of AMR genes and VFs.
Discussion
In the current landscape, an array of sophisticated tests leveraging NGS technology has been progressively integrated into clinical settings. Numerous studies have highlighted their diagnostic utility, yet selecting the most suitable NGS assay for practical clinical application remains a formidable challenge for healthcare practitioners17. This study conducted a comprehensive comparison among mNGS, amplification-based tNGS, and capture-based tNGS, thoroughly exploring their detection characteristics in clinical samples. Based on these findings, we provided recommendations for their clinical application.
To begin with, we compared the cost and TAT of the three NGS. As pointed out by Miao et al.7, mNGS incurs a higher cost, representing a significant barrier to its widespread adoption in clinical settings. Besides, the TAT of mNGS was also the longest among the three NGS. Which means maybe tNGS is more suitable for the early rapid pathogen screening in clinical than mNGS. In the two tNGS, the cost and TAT of the amplification-based tNGS were a little shorter than that of the capture-based tNGS.
In principle, mNGS offers the most extensive panel of microorganism species. To assess whether this advantage translates into real clinical applications, we analyzed the reported species counts across the three NGS. The results confirmed that mNGS indeed provides the most comprehensive species coverage, followed by the capture-based tNGS. Which means perhaps mNGS could be used to detect infectious pathogens when CMTs fail to do so.
Previous studies noted the diagnostic capabilities of mNGS and tNGS as largely equivalent. An investigation evaluated the performance of a commercially manufactured tNGS workflow and a complementary mNGS workflow, using a composite clinical standard consisting of provider-ordered microbiology testing, clinical data, and orthogonal testing as the comparator8. Findings from this study suggests that the performance of mNGS and tNGS is remarkably similar. However, in our study, we evaluated two tNGS based on different technological principles. Results showed that the amplification-based tNGS and mNGS indeed performed similarly, but the capture-based tNGS performed significantly better than the other two. To figure out what caused this gap, then we delved deeper into the distinctions between the three NGS in the pathogen type and pathogen levels. Firstly, mNGS performed not well in many species, especially in SARS-CoV-2, Aspergillus fumigatus, and Haemophilus influenzae. While a proportion of specimens excluded from RNA mNGS, the sensitivity of mNGS for RNA virus remains substantially lower than that of two tNGS in the subset of samples analyzed via RNA mNGS. Additionally, it has been noted that for detecting low load virus, mNGS without target enrichment does have limitations18. Secondly, the amplification-based tNGS had a worse performance in both gram-positive and gram-negative bacteria, mainly related to E. faecium, H. parainfluenzae, C. striatum, and S. mitis, which out of its panel. The constraints inherent in amplification strategy significantly limit the number of primers that can be effectively used, with an initial cap of approximately 20,000 primers to prevent the occurrence of primer dimerization. However, when additional factors such as pathogen specificity, the melting temperatures of the primers, and their secondary structures are taken into account, the practical number of usable primers is substantially reduced. Consequently, this leads to a bias in pathogen identification by the amplification-based tNGS, hindering the detection of those beyond the targeted panel. Thirdly, the capture-based tNGS showed a lower accuracy than the amplification-based tNGS in DNA virus. This is because it reported some microorganisms not recognized by the comprehensive clinical diagnosis, like HHV-1, HHV-4, and HHV-5. In fact, this may be related to the high sensitivity of the capture-based tNGS, but we did not find a more sensitive technology as a standard to prove it in this study. Similar findings have been observed across other microbial types, contributing to a reduced specificity for the capture-based tNGS, particularly when compared to mNGS.
In this study, we found that tNGS offers the advantage of identifying pathogen genotypes, AMR genes, and VFs, a capability absents in mNGS. This is maybe related to the nucleic acid enrichment capability. The prior research indicated that tNGS can significantly enhance the concentration of microbial nucleic acids by orders of magnitude more than mNGS19. Notably, during the COVID-19 pandemic, tNGS played a pivotal role in infection surveillance and genomic characterization20,21. Our findings further reveal that, among the two tNGS, the capture-based tNGS outperforms the amplification-based tNGS in gene typing accuracy, despite both being capable of discerning SARS-CoV-2 genotypes. Moreover, the two tNGS also demonstrated AMR genes and VFs identification capabilities in this study. This discovery highlights the critical clinical importance of tNGS in precisely detecting key genetic indicators of AMR and pathogenicity.
Unfortunately, our study just evaluated the panel available to us of each NGS, which may lead to some bias in the results. This is attributable to the broad coverage of each NGS platform, which is sufficient to detect nearly all pathogens associated with lower respiratory tract infections. However, variations in the distribution of target primers and probes between the two tNGS methodologies resulted in certain limitations in the comparison. Furthermore, the lack of standardized nucleic acid extraction protocols across the three NGS platforms employed in this study may have introduced variability and potentially influenced assay performance. We will standardize wet laboratory procedures to the greatest extent feasible to minimize experimental variability and explore more tNGS with different panels to gain a more comprehensive understanding of the differences between different targeted strategies in the future. In addition, the capture-based tNGS identified some microorganisms not currently recognized by the comprehensive clinical diagnosis. The potential for false-positive results remains unverified. Validation via a customized qPCR assay would be a suitable approach. However, its implementation in this study was precluded by insufficient residual sample volume.
In conclusion, each of the three NGS has distinct features and benefits. Despite its higher cost and longer TAT, mNGS remains a valuable tool, particularly when CMTs fail to detect infectious pathogens, due to its broad and comprehensive coverage of microorganisms. The amplification-based tNGS has the lowest cost and the shortest TAT. Although its performance is not the best, it still could be used for the clinical early rapid screening of common pathogens. The capture-based tNGS demonstrates the highest performance, with moderate cost and TAT. It can also accurately identify genotypes, AMR genes, and VFs. Which makes it well-suited for routine clinical testing.
Data availability
All sequencing data were deposited in the Genome Warehouse in the National Genomics Data Center (National Genomics Data Center Members and Partners, 2022) under project PRJCA025979, which are publicly accessible at https://bigd.big.ac.cn/gsa./m.
References
-
Troeger, C. E. et al. Estimates of the global, regional, and national morbidity, mortality, and aetiologies of lower respiratory infections in 195 countries, 1990–2016: A systematic analysis for the Global Burden of Disease Study 2016. The Lancet. Infect. Dis. 18, 1191–1210 (2018).
-
Zheng, Y. et al. The diagnostic value of metagenomic Next-Generation sequencing in lower respiratory tract infection. Front. Cell. Infect. Microbiol. 11, 694756 (2021).
-
Zhu, Y. G. et al. Contemporary situation of Community-acquired pneumonia in china: A systematic review. J. Transl. Int. Med. 6 (1), 26–31 (2018).
-
Luyt, C. E. et al. Pulmonary infections complicating ARDS. Intens. Care Med. 46, 2168–2183 (2020).
-
Simner, P. J., Miller, S. & Carroll, K. C. Understanding the promises and hurdles of metagenomic Next-Generation sequencing as a diagnostic tool for infectious diseases. Clin. Infect. Dis. 66 (5), 778–788 (2018).
-
Filkins, L. M. et al. Navigating clinical utilization of Direct-from-Specimen metagenomic pathogen detection: Clinical applications, limitations, and testing recommendations. Clin. Chem. 66 (11), 1381–1395 (2020).
-
Miao, Q. et al. Microbiological diagnostic performance of metagenomic Next-generation sequencing when applied to clinical practice. Clin. Infect. Dis. 67 (suppl_2), S231–s240 (2018).
-
Gaston, D. C. et al. Evaluation of metagenomic and targeted Next-Generation sequencing workflows for detection of respiratory pathogens from Bronchoalveolar lavage fluid specimens. J. Clin. Microbiol. 60 (7), e0052622 (2022).
-
Chen, X. et al. Blood and Bronchoalveolar lavage fluid metagenomic Next-Generation sequencing in pneumonia. Can. J. Infect. Dis. Med. Microbiol. 2020, p6839103 (2020).
-
Chen, Y. et al. Application of metagenomic Next-Generation sequencing in the diagnosis of pulmonary infectious pathogens from Bronchoalveolar lavage samples. Front. Cell. Infect. Microbiol. 11, 541092 (2021).
-
Duan, H. et al. The diagnostic value of metagenomic next⁃generation sequencing in infectious diseases. BMC Infect. Dis. 21 (1), 62 (2021).
-
Li, S. et al. Targeted next generation sequencing is comparable with metagenomic next generation sequencing in adults with pneumonia for pathogenic microorganism detection. J. Infect. 85 (5), e127–e129 (2022).
-
Lin, R. et al. Performance of targeted next-generation sequencing in the detection of respiratory pathogens and antimicrobial resistance genes for children. J. Med. Microbiol., 72(11). (2023).
-
Amar, Y. et al. Pre-digest of unprotected DNA by benzonase improves the representation of living skin bacteria and efficiently depletes host DNA. Microbiome, 9(123). (2021).
-
Zhang, P. et al. Clinical application of targeted next-generation sequencing in severe pneumonia: A retrospective review. Crit. Care. 28 (1), 225 (2024).
-
Li, X. et al. Epidemiological investigation of lower respiratory tract infections during influenza A (H1N1) pdm09 virus pandemic based on targeted next-generation sequencing. Front. Cell. Infect. Microbiol. 13, 1303456 (2023).
-
Chen, Q. et al. Clinical diagnostic value of targeted next–generation sequencing for infectious diseases (Review). Mol. Med. Rep., 30(3). (2024).
-
Deng, X. et al. Metagenomic sequencing with spiked primer enrichment for viral diagnostics and genomic surveillance. Nat. Microbiol. 5, 443–454 (2020).
-
Singh, R. R. Target enrichment approaches for Next-Generation sequencing applications in oncology. Diagnostics (Basel), 12(7). (2022).
-
Cheng, L. L., Li, S. Y. & Zhong, N. S. New characteristics of COVID-19 caused by the Omicron variant in guangzhou. Zhonghua Jie He He Hu Xi Za Zhi. 46 (5), 441–443 (2023).
-
Ramos, N. et al. A multiplex-NGS approach to identifying respiratory RNA viruses during the COVID-19 pandemic. Arch. Virol. 168 (3), 87 (2023).
Acknowledgements
We owe thanks to the patients in our study and their family members. We acknowledge the staffs of all departments for their assistance to this study.
Funding
This study was supported by National Natural Science Foundation of China (No. 82102499; ZL), Hunan Natural Science Foundation (No. 2025JJ60514; LY), Scientific Research Project for Hunan Health Commission (No.202211003513; ZL), and the Scientific Research Launch Project for new employees of the Second Xiangya Hospital of Central South University.
Ethics declarations
Competing interests
The authors declare no competing interests.
Ethics statement
The study design received approval from the Ethics Committee of the Second Xiangya Hospital of Central South University in accordance with the Declaration of Helsinki (LYF2022229).
Informed consent
was obtained from all the participants.
Additional information
Publisher’s note
Springer Nature remains neutral with regard to jurisdictional claims in published maps and institutional affiliations.
Electronic supplementary material
Rights and permissions
Open Access This article is licensed under a Creative Commons Attribution-NonCommercial-NoDerivatives 4.0 International License, which permits any non-commercial use, sharing, distribution and reproduction in any medium or format, as long as you give appropriate credit to the original author(s) and the source, provide a link to the Creative Commons licence, and indicate if you modified the licensed material. You do not have permission under this licence to share adapted material derived from this article or parts of it. The images or other third party material in this article are included in the article’s Creative Commons licence, unless indicated otherwise in a credit line to the material. If material is not included in the article’s Creative Commons licence and your intended use is not permitted by statutory regulation or exceeds the permitted use, you will need to obtain permission directly from the copyright holder. To view a copy of this licence, visit http://creativecommons.org/licenses/by-nc-nd/4.0/.
About this article

Cite this article
Yi, L., Tan, L., Long, Q. et al. Comparative diagnostic performance of metagenomic and two targeted sequencing methods in lower respiratory infection. Sci Rep 15, 27365 (2025). https://doi.org/10.1038/s41598-025-11834-w
-
Received:
-
Accepted:
-
Published:
-
DOI: https://doi.org/10.1038/s41598-025-11834-w