
Data availability
Source data used to generate manuscript figures are provided with this paper or available from a public data repository. RNA-seq generated in this study were deposited to the Genome Sequence Archive database under the accession codes CRA037763 and CRA037764. Source data are provided with this paper.
References
-
Fenis, A., Demaria, O., Gauthier, L., Vivier, E. & Narni-Mancinelli, E. New immune cell engagers for cancer immunotherapy. Nat. Rev. Immunol. 24, 471–486 (2024).
-
Pinto, S., Pahl, J., Schottelius, A., Carter, P. J. & Koch, J. Reimagining antibody-dependent cellular cytotoxicity in cancer: the potential of natural killer cell engagers. Trends Immunol. 43, 932–946 (2022).
-
Rolin, C., Zimmer, J. & Seguin-Devaux, C. Bridging the gap with multispecific immune cell engagers in cancer and infectious diseases. Cell. Mol. Immunol. 21, 643–661 (2024).
-
Tapia-Galisteo, A., Álvarez-Vallina, L. & Sanz, L. Bi- and trispecific immune cell engagers for immunotherapy of hematological malignancies. J. Hematol. Oncol. 16, 83 (2023).
-
Wu, J., Fu, J., Zhang, M. & Liu, D. Blinatumomab: a bispecific T cell engager (BiTE) antibody against CD19/CD3 for refractory acute lymphoid leukemia. J. Hematol. Oncol. 8, 104 (2015).
-
Ng, G., Spreter, T., Davies, R. & Wickman, G. ZW38, a novel azymetric bispecific CD19-directed CD3 T cell engager antibody drug conjugate with controlled T cell activation and improved B cell cytotoxicity. Blood 128, 1841 (2016).
-
Topp, M. S. et al. Phase II trial of the anti-CD19 bispecific T cell-engager blinatumomab shows hematologic and molecular remissions in patients with relapsed or refractory B-precursor acute lymphoblastic leukemia. J. Clin. Oncol. 32, 4134–4140 (2014).
-
Kantarjian, H. et al. Blinatumomab versus chemotherapy for advanced acute lymphoblastic leukemia. N. Engl. J. Med. 376, 836–847 (2017).
-
Labrijn, A. F., Janmaat, M. L., Reichert, J. M. & Parren, P. W. H. I. Bispecific antibodies: a mechanistic review of the pipeline. Nat. Rev. Drug Discovery 18, 585–608 (2019).
-
Singh, A., Dees, S. & Grewal, I. S. Overcoming the challenges associated with CD3+ T-cell redirection in cancer. Br. J. Cancer 124, 1037–1048 (2021).
-
Köhnke, T., Krupka, C., Tischer, J., Knösel, T. & Subklewe, M. Increase of PD-L1 expressing B-precursor ALL cells in a patient resistant to the CD19/CD3-bispecific T cell engager antibody blinatumomab. J. Hematol. Oncol. 8, 111 (2015).
-
Thakur, A., Huang, M. & Lum, L. G. Bispecific antibody based therapeutics: strengths and challenges. Blood Rev. 32, 339–347 (2018).
-
Dreher, M. R. et al. Tumor vascular permeability, accumulation, and penetration of macromolecular drug carriers. J. Natl Cancer Inst. 98, 335–344 (2006).
-
Lu, H. et al. PIT565, a first-in-class anti-CD19, anti-CD3, anti-CD2 trispecific antibody for the treatment of B cell malignancies. Blood 140, 3148–3148 (2022).
-
Correnti, C. E. et al. Simultaneous multiple interaction T-cell engaging (SMITE) bispecific antibodies overcome bispecific T-cell engager (BiTE) resistance via CD28 co-stimulation. Leukemia 32, 1239–1243 (2018).
-
Gauthier, L. et al. Control of acute myeloid leukemia by a trifunctional NKp46–CD16a–NK cell engager targeting CD123. Nat. Biotechnol. 41, 1296–1306 (2023).
-
Riley, J. L. & June, C. H. The CD28 family: a T-cell rheostat for therapeutic control of T-cell activation. Blood 105, 13–21 (2005).
-
Bierer, B. E., Peterson, A., Gorga, J. C., Herrmann, S. H. & Burakoff, S. J. Synergistic T cell activation via the physiological ligands for CD2 and the T cell receptor. J. Exp. Med. 168, 1145–1156 (1988).
-
Latchman, Y. et al. PD-L2 is a second ligand for PD-1 and inhibits T cell activation. Nat. Immunol. 2, 261–268 (2001).
-
Long, E. O., Kim, H. S., Liu, D., Peterson, M. E. & Rajagopalan, S. Controlling natural killer cell responses: integration of signals for activation and inhibition. Annu. Rev. Immunol. 31, 227–258 (2013).
-
Jain, S. et al. Targeted inhibition of CD47–SIRPα requires Fc–FcγR interactions to maximize activity in T-cell lymphomas. Blood 134, 1430–1440 (2019).
-
Suter, E. C. et al. Antibody:CD47 ratio regulates macrophage phagocytosis through competitive receptor phosphorylation. Cell Rep. 36, 109587 (2021).
-
Oslund, R. C., Holland, P. M., Lesley, S. A. & Fadeyi, O. O. Therapeutic potential of cis-targeting bispecific antibodies. Cell Chem. Biol. 31, 1473–1489 (2024).
-
Peng, K., Fu, Y.-X. & Liang, Y. Engineering cytokines for tumor-targeting and selective T cell activation. Trends Mol. Med. 31, 373–387 (2025).
-
Dong, J. et al. A stable IgG-like bispecific antibody targeting the epidermal growth factor receptor and the type I insulin-like growth factor receptor demonstrates superior anti-tumor activity. mAbs 3, 273–288 (2011).
-
Madsen, A. V. et al. Immobilization-free binding and affinity characterization of higher order bispecific antibody complexes using size-based microfluidics. Anal. Chem. 94, 13652–13658 (2022).
-
Croasdale, R. et al. Development of tetravalent IgG1 dual targeting IGF-1R–EGFR antibodies with potent tumor inhibition. Arch. Biochem. Biophys. 526, 206–218 (2012).
-
Kühl, L. et al. eIg-based bispecific T-cell engagers targeting EGFR: format matters. mAbs 15, 2183540 (2023).
-
Pang, X. et al. Cadonilimab, a tetravalent PD-1/CTLA-4 bispecific antibody with trans-binding and enhanced target binding avidity. mAbs 15, 2180794 (2023).
-
Ring, N. G. et al. Anti-SIRPα antibody immunotherapy enhances neutrophil and macrophage antitumor activity. Proc. Natl Acad. Sci. USA 114, E10578–E10585 (2017).
-
Vitale, I., Manic, G., Coussens, L. M., Kroemer, G. & Galluzzi, L. Macrophages and metabolism in the tumor microenvironment. Cell Metab. 30, 36–50 (2019).
-
Chao, M. P. et al. Calreticulin is the dominant pro-phagocytic signal on multiple human cancers and is counterbalanced by CD47. Sci. Transl. Med. 2, 63ra94 (2010).
-
Osorio, J. C., Smith, P., Knorr, D. A. & Ravetch, J. V. The antitumor activities of anti-CD47 antibodies require Fc–FcγR interactions. Cancer Cell 41, 2051–2065 (2023).
-
Guilbaud, E., Kroemer, G. & Galluzzi, L. Calreticulin exposure orchestrates innate immunosurveillance. Cancer Cell 41, 1014–1016 (2023).
-
Logtenberg, M. E. W., Scheeren, F. A. & Schumacher, T. N. The CD47–SIRPα immune checkpoint. Immunity 52, 742–752 (2020).
-
Gardai, S. J. et al. Cell-surface calreticulin initiates clearance of viable or apoptotic cells through trans-activation of LRP on the phagocyte. Cell 123, 321–334 (2005).
-
Krysko, D. V., Ravichandran, K. S. & Vandenabeele, P. Macrophages regulate the clearance of living cells by calreticulin. Nat. Commun. 9, 4644 (2018).
-
Feng, M. et al. Macrophages eat cancer cells using their own calreticulin as a guide: roles of TLR and Btk. Proc. Natl Acad. Sci. USA 112, 2145–2150 (2015).
-
Feng, M. et al. Programmed cell removal by calreticulin in tissue homeostasis and cancer. Nat. Commun. 9, 3194 (2018).
-
Ogden, C. A. et al. C1q and mannose binding lectin engagement of cell surface calreticulin and CD91 initiates macropinocytosis and uptake of apoptotic cells. J. Exp. Med. 194, 781–796 (2001).
-
Klein, C., Brinkmann, U., Reichert, J. M. & Kontermann, R. E. The present and future of bispecific antibodies for cancer therapy. Nat. Rev. Drug Discov. 23, 301–319 (2024).
-
Madsen, A. V., Pedersen, L. E., Kristensen, P. & Goletz, S. Design and engineering of bispecific antibodies: insights and practical considerations. Front. Bioeng. Biotechnol. 12, 2024 (2024).
-
Christofides, A. et al. The complex role of tumor-infiltrating macrophages. Nat. Immunol. 23, 1148–1156 (2022).
-
Wang, Q. et al. STING agonism reprograms tumor-associated macrophages and overcomes resistance to PARP inhibition in BRCA1-deficient models of breast cancer. Nat. Commun. 13, 3022 (2022).
-
Croft, M. Co-stimulatory members of the TNFR family: keys to effective T-cell immunity? Nat. Rev. Immunol. 3, 609–620 (2003).
-
Drouin, M. et al. CLEC-1 is a death sensor that limits antigen cross-presentation by dendritic cells and represents a target for cancer immunotherapy. Sci. Adv. 8, eabo7621 (2022).
-
Park, J. S. et al. Targeting PD-L2–RGMb overcomes microbiome-related immunotherapy resistance. Nature 617, 377–385 (2023).
-
Hou, X., Zaks, T., Langer, R. & Dong, Y. Lipid nanoparticles for mRNA delivery. Nat. Rev. Mater. 6, 1078–1094 (2021).
-
Rohner, E., Yang, R., Foo, K. S., Goedel, A. & Chien, K. R. Unlocking the promise of mRNA therapeutics. Nat. Biotechnol. 40, 1586–1600 (2022).
-
Stadler, C. R. et al. Preclinical efficacy and pharmacokinetics of an RNA-encoded T cell-engaging bispecific antibody targeting human claudin 6. Sci. Transl. Med. 16, eadl2720 (2024).
-
Zhang, Y. et al. Close the cancer–immunity cycle by integrating lipid nanoparticle–mRNA formulations and dendritic cell therapy. Nat. Nanotechnol. 18, 1364–1374 (2023).
-
Fenton, O. S. et al. Customizable lipid nanoparticle materials for the delivery of siRNAs and mRNAs. Angew. Chem. Int. Ed. Engl. 57, 13582–13586 (2018).
-
Han, X. et al. An ionizable lipid toolbox for RNA delivery. Nat. Commun. 12, 7233 (2021).
-
Riley, R. S. et al. Ionizable lipid nanoparticles for in utero mRNA delivery. Sci. Adv. 7, eaba1028 (2021).
-
Fan, N. et al. Manganese-coordinated mRNA vaccines with enhanced mRNA expression and immunogenicity induce robust immune responses against SARS-CoV-2 variants. Sci. Adv. 8, eabq3500 (2022).
-
Miao, L. et al. Synergistic lipid compositions for albumin receptor mediated delivery of mRNA to the liver. Nat. Commun. 11, 2424 (2020).
-
Hatit, M. Z. C. et al. Nanoparticle stereochemistry-dependent endocytic processing improves in vivo mRNA delivery. Nat. Chem. 15, 508–515 (2023).
-
Da Silva Sanchez, A. J. et al. Substituting racemic ionizable lipids with stereopure ionizable lipids can increase mRNA delivery. J. Control. Release 353, 270–277 (2023).
-
Hatit, M. Z. C. et al. Species-dependent in vivo mRNA delivery and cellular responses to nanoparticles. Nat. Nanotechnol. 17, 310–318 (2022).
-
Martín, P., Blanco-Domínguez, R. & Sánchez-Díaz, R. Novel human immunomodulatory T cell receptors and their double-edged potential in autoimmunity, cardiovascular disease and cancer. Cell. Mol. Immunol. 18, 919–935 (2021).
-
Baaten, B. J. G. et al. CD44 regulates survival and memory development in Th1 cells. Immunity 32, 104–115 (2010).
-
Yamada-Hunter, S. A. et al. Engineered CD47 protects T cells for enhanced antitumour immunity. Nature 630, 457–465 (2024).
-
Bell, E. A fine balance. Nat. Rev. Immunol. 2, 540–540 (2002).
-
Pardoll, D. M. The blockade of immune checkpoints in cancer immunotherapy. Nat. Rev. Cancer 12, 252–264 (2012).
-
Chen, D. S. & Mellman, I. Elements of cancer immunity and the cancer–immune set point. Nature 541, 321–330 (2017).
-
Cerwenka, A. & Lanier, L. L. Natural killer cell memory in infection, inflammation and cancer. Nat. Rev. Immunol. 16, 112–123 (2016).
-
Hsu, J. et al. Contribution of NK cells to immunotherapy mediated by PD-1/PD-L1 blockade. J. Clin. Invest. 128, 4654–4668 (2018).
-
Morvan, M. G. & Lanier, L. L. NK cells and cancer: you can teach innate cells new tricks. Nat. Rev. Cancer 16, 7–19 (2016).
-
Joller, N., Anderson, A. C. & Kuchroo, V. K. LAG-3, TIM-3, and TIGIT: distinct functions in immune regulation. Immunity 57, 206–222 (2024).
-
Chen, L. & Flies, D. B. Molecular mechanisms of T cell co-stimulation and co-inhibition. Nat. Rev. Immunol. 13, 227–242 (2013).
-
Spolski, R., Li, P. & Leonard, W. J. Biology and regulation of IL-2: from molecular mechanisms to human therapy. Nat. Rev. Immunol. 18, 648–659 (2018).
Acknowledgements
We acknowledge the technical support from the Advanced Medical Research Institute/Translational Medicine Core Facility of the Advanced Medical Research Institute, Shandong University. We are also grateful for the technical support from the Pharmaceutical Biology Sharing Platform, School of Pharmaceutical Sciences, Shandong University. This work was supported by the National Natural Science Foundation of China grants 82425056 (X.J.), 82350125 (X.J.), 22101154 (K.Z.) and 82173763 (X.J.), the National Key Research and Development Program of China grant 2024YFA0918400 (X.J.), the Fundamental Research Funds of Shandong Province grant ZR2022ZD18 (X.J.), the Shandong Province Excellent Youth Science Fund Project (overseas) grant 2022HWYQ-008 (K.Z.), the Youth Fund from Natural Science Foundation of Shandong Province grant ZR2021QB038 (K.Z.), the Taishan Scholar Program of Shandong Province grants tsqnz20221166 (W.J.) and tsqnz20221165 (Y.Z.), the Natural Science Foundation of Shandong Province grant ZR2023QH001 (W.J.) and the National Natural Science Foundation of China grant 82303810 (Y.Z.). Several illustrations for this manuscript were created with BioRender.com.
Ethics declarations
Competing interests
The authors declare no competing interests.
Peer review
Peer review information
Nature Biotechnology thanks Ming Li, Jiaxin Li, Peng Wu and the other, anonymous, reviewer(s) for their contribution to the peer review of this work.
Additional information
Publisher’s note Springer Nature remains neutral with regard to jurisdictional claims in published maps and institutional affiliations.
Extended data
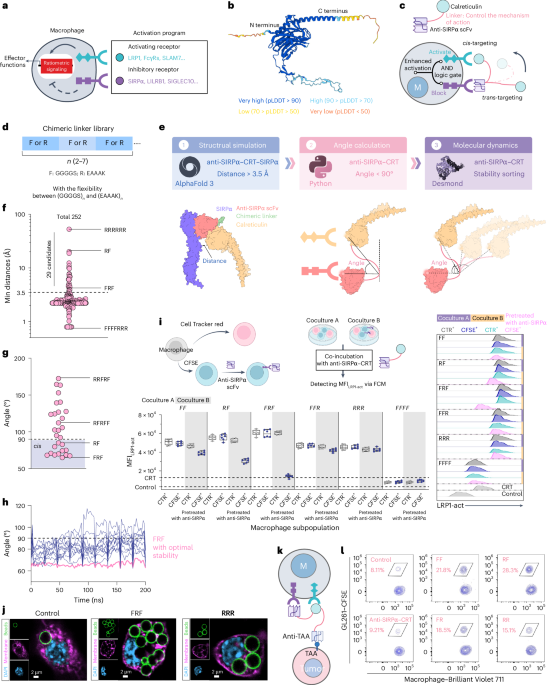
Extended Data Fig. 1 Computational-guided screening of cis-targeting αSIRPα-CRT constructs.
a, Schematic of macrophage-mediated clearance, guided by CRT. Created in BioRender. A, H. (2026) https://BioRender.com/k650onf. b, Scatter plot showing macrophage phagocytosis versus the ratio of the mean fluorescence intensity of CRT and CD47 (MFICRT/MFICD47). The trend line represents the linear fit between the phagocytosis and the MFICRT/MFICD47 ratio. Correlation analysis was performed using Pearson’s correlation coefficient. The correlation coefficient (r) and corresponding two-sided P value are shown in the plot (r = 0.8521, P = 0.0001). c, Schematic of the side effects of trans-targeting. Cell cross-linking (left); Lack of synergy (right). Created in BioRender. A, H. (2026) https://BioRender.com/k650onf. d, Representative images of αSIRPα-CRT-SIRPα complexes from the first-tier screening, with FFFF and FFFFRRR shown as representative constructs excluded during this tier. e, Representative images of αSIRPα-CRT constructs from the second-tier screening, with RRR shown as a representative construct excluded during this tier.
Extended Data Fig. 2 Validation of the superior activity of the cis-targeting αSIRPα-CRT construct.
a, Flow cytometric analysis of the binding efficiency of αSIRPα-CRT constructs to macrophages preincubated with anti-SIRPα scFv, as determined using a Cy5 label. b, Representative flow cytometry and quantitative analysis of the binding efficiency of αSIRPα-FITC to macrophages preincubated with anti-SIRPα scFv. P values, one-way ANOVA. Error bars, mean ± s.d. n = 6 cell samples per group, biological replicates. c, d, Representative flow cytometry (c) and quantitative analysis (d) of the MFILRP1-act in SIRPα-knockout macrophages, which were co-cultured with LRP1-knockout macrophages, under treatment with αSIRPα-CRT (0.05 μg ml−1) for 0.5 h. P values, one-way ANOVA. Error bars, mean ± s.d. n = 6 cell samples per group, biological replicates. Box plots show the median (center line), the 25th and 75th percentiles (box bounds), and whiskers indicate the minimum and maximum values. Individual data points are shown. e, Quantitative analysis of mean fluorescence intensity of activated LRP1 (MFILRP1-act) in macrophages treated with different αSIRPα-CRT constructs (0.05 μg mL−1) for 0.5 h. P values, one-way ANOVA. n = 6 cell samples per group, biological replicates. f, Quantitative analysis of mean fluorescence intensity of activated SIRPα (MFISIRPα-act) in macrophages treated with different αSIRPα-CRT constructs (0.05 μg mL−1) for 0.5 h. P values, one-way ANOVA. n = 6 cell samples per group, biological replicates. g, Quantitative analysis of the ratio of MFILRP1-act to MFISIRPα-act. P values, one-way ANOVA. Error bars, mean ± s.d. n = 6 cell samples per group, biological replicates. h, i, Representative flow cytometry (h) and quantitative analysis (i) of BMDM phagocytosis of CD47-conjugated fluorescent beads with αSIRPα-CRT treatment. P values, one-way ANOVA. Error bars, mean ± s.d. n = 3 cell samples per group, biological replicates. j, The ratio of mean fluorescence intensity of activated LRP1 to activated SIRPα (MFILRP1-act/MFISIRPα-act) in macrophages treated with αSIRPα-CRT (FRF) or CRT-αSIRPα (FRF) for 0.5 h. P values, one-way ANOVA. Error bars, mean ± s.d. n = 5 cell samples per group, biological replicates. k, Confocal images of macrophages cultured in serum-free medium on ultra-low attachment plates after 12 h of treatment with αSIRPα-CRT (FRF) or CRT-αSIRPα (FRF). n = 3 cell samples per group, biological replicates. l, m, Representative flow cytometry (l) and quantitative analysis (m) of BMDM phagocytosis of CD47-conjugated fluorescent beads with CRTtrun-αSIRPα treatment. P values, one-way ANOVA. Error bars, mean ± s.d. n = 4 cell samples per group, biological replicates. αSIRPα-CRT (Anti-SIRPα–CRT), αSIRPα-FITC (Anti-SIRPα–FITC), CRT-αSIRPα (CRT–anti-SIRPα). ns, not significant (P > 0.05); *P < 0.05; **P < 0.01; ***P < 0.001; ****P < 0.0001. Exact P values are indicated in the graph.
Extended Data Fig. 3 Evaluation of the in vitro effects of TrME on macrophage phagocytosis and antigen presentation.
a, Quantitative analysis of the ratio of the mean fluorescence intensity of activated LRP1 to activated SIRPα (MFILRP1-act/MFISIRPα-act) in macrophages treated with different TrMEB7H3 constructs (0.05 μg mL−1) for 0.5 h. P values, one-way ANOVA. Error bars, mean ± s.d. n = 6 cell samples per group, biological replicates. b, c, TrMEB7H3 and RRR-linked TrMEB7H3-mediated phagocytosis of GL261 cells (b) and mouse red blood cells (RBC) (c) by macrophages, in the presence or absence of CD47-conjugated beads. P values, one-way ANOVA. Error bars, mean ± s.d. n = 4 cell samples per group, biological replicates. Box plots show the median (center line), the 25th and 75th percentiles (box bounds), and whiskers indicate the minimum and maximum values. Individual data points are shown. d, Confocal images of macrophages cultured in serum-free medium on ultra-low attachment plates after 12 hours of various treatment. n = 3 cell samples per group, biological replicates. e, Flow cytometry analysis and quantification of CD70-expressing GL261 cell phagocytosis by BMDMs (after 4 h of incubation) in the presence of TrMECD70 (0.1 μg ml−1). P values, one-way ANOVA. Error bars, mean ± s.d. n = 5 cell samples per group, biological replicates. f, Confocal images of antigen presentation levels of H2kb-SIINFEKL complexes in BMDMs which were cocultured with GL261-cOVA cells or GL261B7H3–cOVA cell, under treatment with TrMEB7H3. Green, BMDMs; Red, H2kb-SIINFEKL complex. n = 4 cell samples per group, biological replicates. g, Elispot assay for the detection of IFN-γ+ cells in OT-Ⅰ T cells co-cultured with GL261-cOVA-TrMEB7H3-BMDMs or GL261B7H3–cOVA-TrMEB7H3-BMDMs systems. h, Quantitative bar graphs of IFN-γ+ cell spots in (g). P values, one-way ANOVA. Error bars, mean ± s.d. n = 3 cell samples per group, biological replicates. ns, not significant (P > 0.05); *P < 0.05; **P < 0.01; ***P < 0.001; ****P < 0.0001. Exact P values are indicated in the graph.
Extended Data Fig. 4 The phenotypic polarization of macrophages after TrME treatment.
a, Heatmap of M1 and M2-related biomarkers of sorted BMDMs from GL261-TrMEB7H3-BMDMs coculture system. n = 3 cell samples per group, biological replicates. b, Heatmap of M1 and M2-related biomarkers of sorted BMDMs from TrMEB7H3-BMDMs or TrMEB7H3-BMDMs-GL261 coculture systems. n = 3 cell samples per group, biological replicates. c-g, Quantitative bar graphs of MHC Ⅱ (H2-Ab1) (c), CLEC-1 (d), PD-L2 (e), 4-1BBL (f), and OX40L (g) gene expression of sorted BMDMs from GL261-TrMEB7H3-BMDMs coculture system via RNA-seq analysis. P values, two-sided unpaired t-test. Error bars, mean ± s.d. n = 3 cell samples per group, biological replicates. h, GO pathway analysis of up- and down-regulated pathways in sorted BMDMs from GL261-TrMEB7H3-BMDMs coculture system. GO pathway enrichment analysis of differentially expressed genes was performed using the clusterProfiler package. Enrichment significance was assessed using a hypergeometric test, and P values were adjusted for multiple comparisons using the Benjamini–Hochberg false discovery rate (FDR) method. GO terms with Padj < 0.05 were considered significantly enriched. ns, not significant (P > 0.05); *P < 0.05; **P < 0.01; ***P < 0.001; ****P < 0.0001. Exact P values are indicated in the graph.
Extended Data Fig. 5 Efficacy evaluation of single-dose TrME formulations in an orthotopic GBM mouse model.
a, Experimental schedule for in vivo studies with single dose of 2.5 mg kg−1 TrMEB7H3-protein. Created in BioRender. A, H. (2026) https://BioRender.com/k650onf. b, Representative IVIS imaging of GBM-bearing mice following the designated treatments on days 7, 12, 17, and 22. Representative pictures from n = 6 mice per group, biological replicates. c, Quantification of the bioluminescence signal intensity of GBM-bearing mice following the designated treatments on days 7, 12, 17, and 22. P values, two-way ANOVA. Error bars, mean ± s.d. n = 6 mice per group, biological replicates. d, Survival of GL261 tumor-bearing mice treated with TrMEB7H3-protein or PBS control. Survival was estimated by the Kaplan-Meier method and compared by log-rank test. n = 6 mice per group, biological replicates. e, Experimental schedule for in vivo studies with single dose of TrMEB7H3-MC3. Created in BioRender. A, H. (2026) https://BioRender.com/k650onf. f, Representative IVIS imaging of GBM-bearing mice following the designated treatments on days 7, 12, 17, and 22. Representative pictures from n = 6 mice per group, biological replicates. g, Quantification of the bioluminescence signal intensity of GBM-bearing mice following the designated treatments on days 7, 12, 17, and 22. P values, two-way ANOVA. Error bars, mean ± s.d. n = 6 mice per group, biological replicates. h, Survival of GL261 tumor-bearing mice treated with TrMEB7H3-MC3, TrMEB7H3-protein or MC3 control. Survival was estimated by the Kaplan-Meier method and compared by log-rank test. n = 6 mice per group, biological replicates. ns, not significant (P > 0.05); *P < 0.05; **P < 0.01; ***P < 0.001; ****P < 0.0001. Exact P values are indicated in the graph.
Extended Data Fig. 6 Screening of Factors Determining LNP Delivery Efficiency.
a, GL261 cells were treated with firefly luciferase mRNA (mLuc)-loaded LNPs based on BC-9 and BT-9. The luminescence intensity of luciferase after 24 h incubation with mLuc-LNPs was shown in the heat map. Compositions A, B, C, and D were detailed in Supplementary Fig. 9b. Each set of 16 numbers corresponded to the lipid molar ratios listed in Supplementary Fig. 9c. b, Statistical analysis of the delivery efficiency of BT-9 LNPs and BC-9 LNPs. Data sourced from Extended Data Fig. 6a. Compositions A, B, C, and D were detailed in Supplementary Fig. 9b. P values, two-sided paired t-test. n = 16 cell samples, biological replicates with identical LNP compositions but different lipid molar ratios. c, Statistical analysis of the delivery efficiency of DOPE LNPs and DPPC LNPs after grouping based on ionizable lipids and PEG lipids. Data sourced from Extended Data Fig. 6a. P values, two-sided paired t-test. n = 16 cell samples, biological replicates with identical LNP compositions but different lipid molar ratios. d, Statistical analysis of the delivery efficiency of C14PEG2k LNPs and DMG-PEG2k LNPs after grouping based on ionizable lipids and helper lipids. Data sourced from Extended Data Fig. 6a. P values, two-sided paired t-test. n = 16 cell samples, biological replicates with identical LNP compositions but different lipid molar ratios. e, Statistical analysis of the delivery efficiency of BC-9 LNPs, BC-12 LNPs, BC-14 LNPs, and BC-16 LNPs. Data sourced from Fig. 3e. Compositions A, E, F, and D were detailed in Fig. 3d. n = 16 cell samples, biological replicates with identical LNP compositions but different lipid molar ratios. f, Statistical analysis of the delivery efficiency of C14PEG2k LNPs and C18PEG2k LNPs after grouping based on ionizable lipids and helper lipids. Data sourced from Fig. 3e. P values, two-sided paired t-test. n = 16 cell samples, biological replicates with identical LNP compositions but different lipid molar ratios. g, Statistical analysis of the delivery efficiency of DOPE LNPs and DOTAP LNPs after grouping based on ionizable lipids and PEG lipids. Data sourced from Fig. 3e. P values, two-sided paired t-test. n = 16 cell samples, biological replicates with identical LNP compositions but different lipid molar ratios. ns, not significant (P > 0.05); *P < 0.05; **P < 0.01; ***P < 0.001; ****P < 0.0001. Exact P values are indicated in the graph.
Extended Data Fig. 7 Evaluation of hematological toxicity of single-dose and multiple-dose TrME formulations.
a-d, Complete blood counts were performed three days after mice received the single-dose treatments (2.5 mg kg−1 TrMEB7H3-protein, αSIRPα-CRT (Anti-SIRPα–CRT) or anti-CD47 antibody; 0.5 mg kg−1 TrMEB7H3-BCT-A5). n = 10 mice per group, biological replicates. a, Red blood cells (RBCs). P values, one-way ANOVA. Error bars, mean ± s.d. b, Hemoglobin (HGB). P values, one-way ANOVA. Error bars, mean ± s.d. c, Platelet (PLTs). P values, one-way ANOVA. Error bars, mean ± s.d. d, White blood cells (WBCs), Neutrophils (NEUs), Lymphocytes (LYMs), Monocytes (MONOs). P values, two-way ANOVA. Error bars, mean ± s.d. e-h, Mice received either a single-dose treatment or a repeated dosing regimen consisting of injections every five days for a total of three times. (2.5 mg kg−1 TrMEB7H3-protein or anti-CD47 antibody). Complete blood counts were performed three days after the single injection or three days after the final dose in the repeated dosing schedule. n = 10 mice per group, biological replicates. e, Red blood cells (RBCs). P values, one-way ANOVA. Error bars, mean ± s.d. f, Hemoglobin (HGB). P values, one-way ANOVA. Error bars, mean ± s.d. g, Platelet (PLTs). P values, one-way ANOVA. Error bars, mean ± s.d. h, White blood cells (WBCs), Neutrophils (NEUs), Lymphocytes (LYMs), Monocytes (MONOs). P values, two-way ANOVA. Error bars, mean ± s.d. ns, not significant (P > 0.05); *P < 0.05; **P < 0.01; ***P < 0.001; ****P < 0.0001. Exact P values are indicated in the graph.
Extended Data Fig. 8 Immunological analysis of the tumor microenvironment in orthotopic GBM mouse models after TrME treatment.
a, Magnetic resonance imaging (MRI) of the brains of GBM-bearing mice after the designated treatments on day 22. The magenta dotted circle points to the tumor site. Representative pictures from n = 6 mice per group, biological replicates. b, H&E staining of brain tissue sections from GBM-bearing mice after the designated treatments on day 22. Representative pictures from n = 6 mice per group, biological replicates. c, Survival of GL261 tumor-bearing mice treated with continued dosing TrMEB7H3-BCT-A5, TrMEB7H3-protein, or saline control. Survival was estimated by the Kaplan-Meier method and compared by log-rank test. n = 10 mice per group, biological replicates. d, TrMEB7H3 concentration in tumors was measured on indicated time points after single injection of TrMEB7H3-BCT-A5 into GL261 GBM mice. P values, one-way ANOVA. Error bars, mean ± s.d. n = 6 mice per group, biological replicates. e, TUNEL staining of brain sections from GBM-bearing mice on day 22 following the designated treatments. Representative pictures from n = 6 mice per group, biological replicates. f, Quantification of CD69+, Granzyme B+, and IFN-γ+ cells in tumor-infiltrating CD8+ T cells. P values, two-way ANOVA. Error bars, mean ± s.d. n = 6 mice per group, biological replicates. g, Flow cytometry data showing the numbers of tumor-infiltrating macrophages, CD8+ T cells, and Tregs, respectively. All the populations are denoted as cell numbers per gram of tumor. P values, two-way ANOVA. Error bars, mean ± s.d. n = 6 mice per group, biological replicates. h, Flow cytometry data showing the numbers of tumor-infiltrating CD86+ CD11b+ F4/80+ cells and CD206+ CD11b+ F4/80+ cells, respectively. All the populations are denoted as cell numbers per gram of tumor. P values, two-way ANOVA. Error bars, mean ± s.d. n = 6 mice per group, biological replicates. i, Flow cytometry data showing the numbers of tumor-infiltrating CD44+ CD8+ T cells, CD69+ CD8+ T cells, Granzyme B+ CD8+ T cells, and IFN-γ+ CD8+ T cells, respectively. All the populations are denoted as cell numbers per gram of tumor. P values, two-way ANOVA. Error bars, mean ± s.d. n = 6 mice per group, biological replicates. j, Flow cytometry data showing the numbers of tumor-infiltrating monocyte (M-)MDSCs (CD11b+ Ly6G− Ly6Chi) and polymorphonuclear (PMN-)MDSCs (CD11b+ Ly6G+ Ly6Clo), respectively. All the populations are denoted as cell numbers per gram of tumor. P values, two-way ANOVA. Error bars, mean ± s.d. n = 6 mice per group, biological replicates. αSIRPα–αB7H3 (Anti-SIRPα–anti-B7H3), CRT–αB7H3 (CRT–anti-B7H3), αSIRPα–CRT (Anti-SIRPα–CRT), αSIRPα/B7H3 (Anti-SIRPα/B7H3). ns, not significant (P > 0.05); *P < 0.05; **P < 0.01; ***P < 0.001; ****P < 0.0001. Exact P values are indicated in the graph.
Extended Data Fig. 9 Evaluation of the therapeutic efficacy of TrME formulations in an orthotopic MB49 bladder cancer mouse model.
a, Photographic images of tumors obtained from mice treated with different therapies. The scale bar represents 1 cm. n = 5 mice per group, biological replicates. b, Statistical graph of the tumor weights. P values, one-way ANOVA. Error bars, mean ± s.d. n = 5 mice per group, biological replicates. c, Photographic images of tumors obtained from mice treated with different therapies. The scale bar represents 1 cm. n = 5 mice per group, biological replicates. d, Statistical graph of the tumor weights. P values, one-way ANOVA. Error bars, mean ± s.d. n = 5 mice per group, biological replicates. e, Photographic images of tumors obtained from mice treated with different therapies. The scale bar represents 1 cm. n = 5 mice per group, biological replicates. f, Statistical graph of the tumor weights. P values, one-way ANOVA. Error bars, mean ± s.d. n = 5 mice per group, biological replicates. CRT–αB7H3 (CRT–anti-B7H3), αSIRPα/B7H3 (Anti-SIRPα/B7H3), αCD47 (Anti-CD47), αSIRPα (Anti-SIRPα) ns, not significant (P > 0.05); *P < 0.05; **P < 0.01; ***P < 0.001; ****P < 0.0001. Exact P values are indicated in the graph.
Extended Data Fig. 10 Analysis of epitope spreading induced by TrME in an orthotopic breast cancer mouse model.
a, Photographic images of bilateral breast tumors obtained from mice after TrMEB7H3-BCT-A5 treatment. n = 6 mice per group, biological replicates. b, Statistical graph of the tumor weights. P values, two-way ANOVA. Error bars, mean ± s.d. n = 6 mice per group, biological replicates. ns, not significant (P > 0.05); *P < 0.05; **P < 0.01; ***P < 0.001; ****P < 0.0001. Exact P values are indicated in the graph.
Supplementary information
Source data
Rights and permissions
Springer Nature or its licensor (e.g. a society or other partner) holds exclusive rights to this article under a publishing agreement with the author(s) or other rightsholder(s); author self-archiving of the accepted manuscript version of this article is solely governed by the terms of such publishing agreement and applicable law.
About this article

Cite this article
Zhao, X., Jing, W., Wang, G. et al. A logic-gated trispecific engager enhances macrophage killing of cancer cells in solid tumors. Nat Biotechnol (2026). https://doi.org/10.1038/s41587-026-03057-9
-
Received:
-
Accepted:
-
Published:
-
Version of record:
-
DOI: https://doi.org/10.1038/s41587-026-03057-9