
Introduction
Von Willebrand Disease (VWD) is a common inherited bleeding disorder, affecting approximately 1% of the global population1. The disease is defined by a decrease in activity or concentration of Von Willebrand factor (VWF), a protein necessary for proper clotting, in human blood2. Treatment generally focuses on administering replacement VWF to patients in need3. Diagnosis of VWD requires a complex, lengthy, and expensive series of tests4, since the disease can have multiple causes. Type 1 VWD results from a decrease in concentration of VWF, resulting in less protein to facilitate blood clotting5. Type 2 VWD results from mutations in VWF changing the interactions it has with different targets in the blood clotting pathway, but not its inherent concentration5. Type 2 may be further subdivided into 2A, 2B, 2M, and 2N based on characteristic mutation patterns in VWF. Type 3 VWD is characterized by a complete or near-complete lack of VWF in the patient’s blood5. Given this diversity, multiple tests are required to determine the concentration of VWF and its interactions with other proteins in blood, including GP1b receptor, Factor VIII (FVIII), and collagen2,3,4,5. For example, a typical testing regimen for VWD includes an antigen-antibody test to determine concentration (VWF:Ag), a ristocetin cofactor activity test (VWF:RCo) that measures binding to GP1b receptor, a Factor VIII activity test (FVIII:C), and the ratio of the ristocetin test to the concentration of VWF (VWF:RCo to VWF:Ag)6. Collagen binding assays have also become common in VWD testing (VWF:CB), as the inability to bind specific collagen domains further discriminates among VWD disease subtypes7. The different deficiencies in VWF assay results inform about different types of VWD, such as a decrease in VWF concentration, inability to form large multimers, inability to bind to platelets, collagen, or FVIII2,3,5. The requirement to perform each test separately5,6,8,9,10,11,12 causes notably lengthy diagnostic times: it typically takes several weeks for all tests to be performed and analyzed4,6,13,14. Delays in diagnosing VWD are known to correlate with increased bleeding incidents and an overall worse patient outcome15. A rapid, simple, and inexpensive test for VWD able to produce equivalent information to current individual tests would therefore improve diagnosis time and improve patient outcomes. Such a test could extend beyond hematology clinics as a rapid screening option, potentially to rule VWD in or out in private practice and outpatient clinics.
Advances in VWD testing have focused primarily on automation of existing methods. Several automated test options are available for VWD16, but as they still measure a single parameter, they do not solve the problem of diagnosis time. For example, an automated ristocetin cofactor assay was developed as an alternative to the previous standard assay17, and has since been further validated18 and implemented clinically19. Latex particle-enhanced immunoturbidimetric VWF assays have also become standard in testing20. Some studies have noted, however, that there is still inconsistency among automated platforms21, highlighting the need for a unified testing format.
While laboratory studies of several new analytical approaches focused on VWD have been recently described, to the best of our knowledge, they only report on VWF concentration or VWF concentration plus its interaction with a single binding partner. Examples of new technologies include an electrochemical test able to monitor VWF release from human umbilical vein endothelial cells (HUVECs), which could potentially monitor changes in VWF concentration22. A flow cytometry bead assay demonstrated simultaneous quantification of VWF concentration and collagen binding23. A similar flow cytometry approach quantified VWF binding to GP1b and concentration24. Enzyme-linked immunosorbent assay(ELISA)-based methods have shown the most promise for rapidly distinguishing among different VWD subtypes; two such studies demonstrated quantification of all desired parameters25,26. However, the process for ELISA assays is slow (about 3 h25), and requires several reagents and manual steps in the workflow. It has also been noted that some challenges exist for ELISA assays in VWD; one study noted that they overdiagnose type 2B VWD due to changes in the VWF multimer during the assay27.
Optical sensor approaches to VWD, and blood coagulation as a whole, have been limited. Louka et al. detail an optical method to observe the blood clotting process in a sample28. Li et al. used optical coherence tomography (OCT) to compare parameters of coagulated and uncoagulated blood samples29. A nanodisc array on silicon photonic sensors showed the ability to measure the binding of seven coagulation factors to phosphatidylserine and phosphatidylethanolamine30. Nanodiscs have similarly shown an ability to measure factor VIII binding to a platelet surface31.
We have reported a “disposable photonics” platform in which a grain-of-rice-sized silicon nitride ring resonator photonic integrated circuit (PIC) is paired with an inexpensive, passive microfluidic card. Initially applied to the detection of antibodies to viral antigens, early versions of the approach used a micropillar card made via hot embossing32 or injection molding33. Most recently, we found that an even simpler glass-and-tape-based approach to the microfluidics was feasible, allowing development of a photonic assay able to simultaneously quantify enzyme concentration and activity34. This Glass Laminated Adhesive Microfluidics (GLAM) disposable card34 layers of doubled-sided adhesive with a defined fluidic channel layer onto a glass microscope slide.
Given that assay multiplexing with ring resonators is well established by us and other groups35,36,37,38,39,40, we hypothesized that the “disposable photonics” format would work well for developing a VWD assay able to measure VWF itself and its interactions with several of the most common VWF targets. As part of the development of this assay, we designed, fabricated, and tested a new 18-plex PIC chip, significantly expanding the multiplex capability of the 1 × 4 mm sensor chip platform while also implementing new design features to simplify piezoelectric deposition of probe molecules.
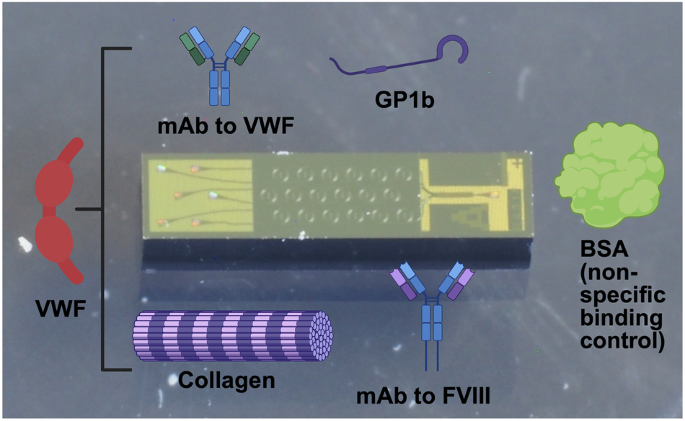
To validate the approach, we prepared and tested an 18-plex sensor chip in which individual sensor rings were functionalized with (1) a monoclonal antibody (mAb) specific to human VWF; (2) a mAb specific to human FVIII; (3) human collagen I; (4) rat tail collagen I; (5) human GP1b; (6) Bovine Serum Albumin (BSA) as a reference nonspecific control41 (Fig. 1). Both human and rat tail collagen were incorporated on the chip to compare different homologs of collagen I as VWF binding partners. After first validating the overall performance of the sensor with plasma samples containing known concentrations of VWF, several samples with known quantitative or qualitative deficiencies were tested prior to evaluating a panel of single-donor human sera.

The 18-plex photonic ring resonator sensor integrated with a glass-laminated adhesive microfluidics (GLAM) card enables simultaneous measurement of parameters associated with VWD and VWD sub-types. Portions of this figure were prepared using BioRender.com.
Results
Initial experiments to establish performance
We first carried out serial dilution of a single normal plasma sample to confirm that the assay is analytically well behaved for each target, and to establish the linear dilution range. As shown in Fig. 2, all responses fit well to a 4-parameter logistic model, as is expected for a surface-binding assay. A 1:100 dilution fell within each linear range and was therefore chosen as the dilution ratio for all subsequent single-donor samples. Control-subtracted time-dependent redshift responses for all analytes at the 1:100 dilution are provided in Supplementary Figs. S3–S7.

Each panel shows the response after correction for the nonspecific binding control. a Monoclonal antibody to VWF; b mAb to Factor VIII; c GP1b receptor; d rat tail collagen I; e human collagen I. Each point represents the average of 3 assays (3 separate PICs). The response from each assay consists of the averaged signal from 3 control rings subtracted from the average signal produced by 3 capture rings. Error bars are ±1 standard deviation, with error propagated to reflect both ring-to-ring and run-to-run variance.
Next, we evaluated the ability of the assay to discriminate among healthy and VWD plasma samples, and among different types of VWD. Results for single plasma samples from previously diagnosed normal, high, low, and type 2A plasma are shown in Fig. 3. Because type III VWD is rare, no sample was available; here, a synthetic sample was prepared and tested with results also shown in Fig. 3. All shifts are significant at 95% confidence unless designated otherwise. Statistical tests for these data (two-sample t-test) are available in the supplementary Tables T1–T5. These results provided an initial indication that the assay could both discriminate healthy from VWD plasma and discriminate among VWD subtypes. Relative to a normal sample, a low VWF concentration sample shows reduced binding to all targets, while the high concentration sample shows increased binding, as expected. The type 2A sample shows a monoclonal antibody response (capture of VWF) similar to a normal sample, but with a decreased activity to GP1b and FVIII. One potential concern of the FVIII binding measurement might be that this would be confounded by the monoclonal antibody to FVIII binding plasma FVIII without a bound VWF molecule. However, given that the concentration of FVIII is approximately an order of magnitude lower than the concentration of VWF in plasma42,43, we hypothesized that the signal from FVIII would be minimal. This hypothesis was confirmed by the lack of signal to the FVIII monoclonal antibody in the synthetic type III sample, which has FVIII present and no VWF. We observed no cross-reactivity with the anti-FVIII antibody by testing a recombinant human VWF that bound anti-VWF (Fig. S8). However, given that this recombinant did not bind other VWF targets, we cannot rule out the possibility that another epitope may bind the anti-FVIII antibody.

Differences between samples are statistically significant at 95% confidence unless noted as “not significant.” Each point is the average of three replicates, with error bars being ±1 σ determined as in Fig. 2.
Results with single-donor samples
Finally, to evaluate the overall performance of the assay and assess the impact of sample-to-sample variation on its performance, 37 single-donor plasma samples previously tested by reference standard methods were analyzed (16 low, 11 normal, and 10 high VWF concentration). Each sample was assayed with a single chip. Results of these assays are shown in Fig. 4. Significance was tested at 95% confidence. Statistical test results are detailed in the Supplemental Tables T6–T10.

Assay response data for 37 single-donor plasma samples previously assessed by reference standard methods and classified as “High”, “Normal”, and “Low” VWF. Bars in the graph correspond to 25th (lower), 50th (middle), and 75th(upper) percentile. Asterisks indicate statistical significance, where • corresponds to 95% confidence, and **** corresponds to 99.99% confidence. (a) Response to immobilized VWF mAb; (b) Response to immobilized FVIII mAb; (c) Response to immobilized Gp1b; (d) Response to immobilized rat tail collagen I; (e) Response to immobilized human collagen I.
As these samples focused on testing variation in VWF concentration and not activity, we would expect responses to all targets to be correlated, and that is indeed what was observed. The sensor readily distinguished concentration (based on anti-VWF response) between the three sample groups. The response on the FVIII monoclonal antibody also distinguishes between the three sample groups. While the sensor was able to distinguish normal and high WVF concentrations from low VWF concentrations based on binding to GP1b, rat tail collagen I, and human collagen I, it was not able to distinguish high VWF from normal VWF using binding to these proteins. We hypothesize that measurements at high VWF concentrations exceed the dynamic range, a hypothesis that is supported by the serial dilution measurements shown in Fig. 2. Since distinguishing low from normal concentrations is most clinically relevant, we do not view this as a significant concern.
Comparing the anti-VWF ring net shift to the reference standard VWF antigen assay values shows a sigmoidal relationship (Fig. 5a) as expected from the serial dilution experiments, with good correlation statistics (Pearson ρ 0.84; Spearman ρ 0.85; R2 0.86). Some measurements at low concentration fall outside the linear range of the photonic readout at the chosen dilution. A similar correlation is observed for individual samples between the anti-FVIII ring response on the photonic sensor and the reference standard FVIII assay (Fig. 5b; Pearson ρ 0.79; Spearman ρ 0.82; R2 0.66). As no reference standard, GP1b or collagen binding assays were run on these samples, no direct comparison of individual values for these targets was possible.

a Sensor-immobilized anti-VWF mAb compared to reference-standard VWF antigen test; b sensor-immobilized anti-FVIII mAb compared to reference standard FVIII test.
Discussion
We have reported the development of a new 18-plex photonic sensor, packaged into a disposable microfluidic format, with the ability to simultaneously quantify VWF and its interactions with FVIII, GP1b, and collagen, critically important metrics for diagnosing Von Willebrand Disease and its variants. The sensor is analytically well behaved, and reduces multiple reference-standard assays that can take days to weeks to complete to a single assay that requires only minutes. As we have previously demonstrated, manufacturing of this assay format is highly scalable44.
While this assay provides a novel and rapid testing approach that could dramatically improve patient outcomes, some VWD type 2 subtypes may not be distinguishable using this assay format. Specifically, distinguishing between type 2A and type 2M subtypes may be difficult because although the two subtypes have different causes46, and that would likely manifest similarly on our sensor platform. It is also worth noting that the current sensor cannot distinguish the VWF multimer state; we will address this in future studies.
We have recently demonstrated quantification of both enzyme concentration and activity34 using a similar ring resonator PIC. As the activity of enzymes is also important in the clotting cascade, we anticipate incorporation of substrates critical to clotting in an expanded array could further improve diagnostic models. For example, this assay should be amenable to quantifying ADAMTS13, an enzyme that cleaves VWF and is also involved in the blood clotting pathway47. In combination with the approach to VWF we have detailed here, we anticipate that multiplex photonic ring resonators will have broad utility in increasing the speed with which clotting diseases are diagnosed, allowing patients to progress to treatment more quickly and accurately.
Methods
Materials
Recombinant human VWF, rabbit monoclonal anti-human VWF antibodies, and recombinant human GP1b were obtained from Sinobiological, Inc. (Wayne, PA). Bovine serum albumin (BSA) was purchased from Rockland Immunochemicals (Limerick, Pennsylvania). Gibco human collagen type I and rat tail collagen type 1 were acquired from ThermoFisher (Waltham, MA). Invitrogen mouse anti-human Factor VIII monoclonal antibodies were acquired from ThermoFisher (Waltham, MA). The diluent for antibody/antigen printing was modified (i.e., potassium-free) phosphate-buffered saline (mPBS) at a concentration of 0.20 M and a pH of 7.2. Assay wash buffer (AWB), which was used to dilute serum samples, consisted of mPBS with 3 mM EDTA and 0.01% Tween-20. All plasma samples were diluted to 1:100 unless otherwise noted. (3-Glycidyloxypropyl)trimethoxysilane (GPTMS) was obtained from Gelest, Inc., Morrisville, PA. StabilCoat Immunoassay Stabilizer was obtained from Surmodics IVD Inc., Eden Prairie, MN. Stock PBS was purchased from Sigma-Aldrich and was used as obtained from the manufacturer. Residual normal plasma samples and plasma from confirmed or suspected VWD patients were obtained from the main core clinical laboratory at the University of Rochester Medical Center under RSRB STUDY00001582. All patients were subject to informed consent.
Reference standard assays
The VWF antigen and VWF activity tests are automated latex-enhanced immunoturbidimetric assays performed in citrated plasma samples on the automated coagulation analyzer ACL TOP 750 (Werfen, Bedford, MA, USA). Plasma is mixed with the latex reagent and the reaction buffer according to the manufacturer’s protocol. The antigen and activity levels are determined by measuring the increase in turbidity produced by the agglutination of the latex reagent. The latex reagent in the activity assay is directed against the platelet binding site of vWF, thus reacting with the vWF of the patient’s plasma. The degree of agglutination is proportional to the activity and concentration in the sample and is determined by measuring the decrease of transmitted light caused by the aggregates. Results are reported in % normality. A modified activated partial thromboplastin time (aPTT) was performed to determine FVIII activity. Patient plasma is diluted and added to plasma deficient in FVIII. The activity level is proportional to the correction of the clotting time of the deficient plasma, which is determined by a calibration curve.
Microring resonators
Silicon nitride ring resonators were engineered with an upper aqueous cladding for biosensing applications. Each resonator comprises a silicon nitride waveguide 1.5 μm wide and 220 nm tall, optimized to support a single transverse electric (TE) polarization mode. Optical modeling was performed using the finite difference (FD) method in OptoDesigner, formerly part of the Synopsys Photonic Design Suite.
The layer stack and microring modeling methodology are described in detail by Cognetti et al.32. To accommodate eighteen ring resonators within the 1700 μm × 800 μm active area of the PIC (Fig. 6), the ring diameter was reduced from 198 μm to 131 μm. This miniaturization introduced challenges, including increased bending losses. To mitigate these effects and maintain sufficiently high Q-factors, the coupling gap was reduced to 350 nm to preserve critical coupling, and low-pressure chemical vapor deposition (LPCVD) was used for both silicon nitride and bottom oxide layers in place of plasma-enhanced CVD (PECVD), ensuring lower propagation losses.

a GDS file, b photomicrograph (stitched image), and c photograph of the sensor PIC used in this study. The PIC is 1 × 4 mm, featuring 1 input grating, a six-way multimode interference (MMI) splitter, eighteen microring resonators (3 per bus waveguide), and six output gratings.
Each PIC incorporates three slightly detuned rings per bus waveguide to generate distinct resonance wavelengths. However, this multiplexed design introduced potential issues with spectral overlap, inter-ring crosstalk, and ambiguous resonance identification. These were addressed by precisely adjusting ring diameters to achieve sufficient spectral separation and by clustering resonance wavelengths within the free spectral range, aiding in the unambiguous assignment of each ring’s response. Specifically, rings were designed to have nominal resonances of 1550, 1550.8, and 1551.6 nm.
To enable efficient surface functionalization using a piezoelectric microarrayer, the spatial layout of the rings was also optimized. Linear bus waveguides resulted in nonuniform spacing between ring centers, complicating alignment with the microarrayer’s functionalization pitch. To overcome this, sinusoidal bus waveguides were implemented, enabling a linearized arrangement of ring centers across the PIC and improving the reproducibility and throughput of spatially selective functionalization. Also added in this layout were distinct labels, so that the location of the PIC could be tracked (Fig. 6a, b).
Photonic sensors were fabricated using the 300 mm AIM Photonics fabrication line48 (Albany, NY). Wafers were then diced by the Aim Photonics Testing and Packaging facility (Rochester, NY). The average quality (Q) factor for ring resonators fabricated in this manner was found to be 43,600 ± 6370 (measured in water; average of 5 18-plex PICs).
Photonic chip functionalization
Prior to functionalization, sensor PICs were removed from the wafer and stirred for 20 min in “piranha” solution (3:1 mixture of sulfuric acid and 25% hydrogen peroxide; Caution! Piranha solution is highly caustic and reacts violently with organics). Afterwards, the PICs were washed in nanopure water for 20 min, then dried under a stream of nitrogen gas. Next, PICs were placed in a chemical vapor deposition (CVD) system (Yield Engineering Systems, Fremont, CA) where approximately a monolayer of GPTMS was deposited on the surface with a thickness between 6-10 Å, as measured on satellite silicon/SiO2 substrates by spectroscopic ellipsometry (J. A. Woolam VASE). The proteins used in the assay are covalently attached to a functionalized surface by spotting directly on the rings using a sciFLEXARRAYER SX piezoelectric microarrayer (Scienion AG, Berlin, Germany), as described in our previous work33,34. The control rings were spotted with bovine serum albumin (BSA), and the test rings were spotted with collagen 1 (human and rat tail), VWF monoclonal antibodies, FVIII monoclonal antibodies, and recombinant GP1b proteins, all at a concentration of 500 µg mL−1. All rings received approximately 1 nL of the respective solution. The print layout is shown in Fig. 7. PICs were maintained at 75% humidity overnight, then soaked in 1% BSA in AWB for 30 min to blot out unbound non-specific binding locations, rinsed with AWB for 5 min, and then soaked in StabilCoat for 30 min. The PICs were then dried for 30 min in a 40 °C oven before being stored in a desiccator until use; all PICs were then used within two weeks. The average quality (Q) factor for ring resonators post-functionalization was measured to be 45,751 ± 7281 measured in buffer, or 40,900 ± 6010 measured in plasma (average of five PICs in each case). Representative spectra from a functionalized PIC are included as Supplementary Fig. S1.

Schematic of the printed VWF assay overlaid on a photomicrograph of the 18-plex photonic sensor.
Assay consumable assembly
Functionalized PICs were integrated into GLAM cards using a previously described protocol34. These cards allow for passive (pump-free) microfluidic flow to occur via sample wicking into a paper reservoir via capillary action. In brief, 75 × 25 mm glass microscope slides were activated using a UV/ozone system for 5 min. A twenty-six μm-thick double-sided adhesive (Adhesives Research, York, Pennsylvania) patterned via laser cutter with a circular sample inlet and microfluidic channel was attached to the slide, followed by the sensor PIC, with the sensor side facing the top surface of the adhesive. Two 5 × 5 mM silicon chips (also UV/ozone treated) were attached to the adhesive on either side of the PIC to ensure efficient fluid flow over the PIC surface. A strip of Whatman Q1 filter paper (Whatman, Inc., Little Chalfont, UK) was adhered to the adhesive after the PIC to act as a reservoir for fluid after passing under the PIC. A close-up view of the GLAM PIC assembly is provided in Supplementary Fig. S2.
Photonic apparatus
All sensing data was acquired using a system consisting of a Keysight 81606A0 tunable laser set to sweep from 1545 to 1555 nm with 1 pm resolution. Light from the laser is polarized to TE mode via Thorlabs FPC561 polarization controllers with SMF-28 FC/PC connectors and a single-mode optical fiber. From there, the optical fiber is connected to a custom diamond-turned optical hub (Syntec Optics, Rochester, NY) that directs light vertically into focused grating couplers on the PIC, and then directs output light into a custom fiber bundle (IDIL Optics) consisting of 7 Thorlabs FP200ERT multimode fibers. This allows for each output grating coupler to map to a single fiber, and data from all output grating couplers to be obtained simultaneously. Alignment of the input and output gratings of the PIC to the input and output fibers is facilitated by visualizing light I/O with an IR microscope. The microscope incorporates a Mitutoyo Plan Apo NIR 46-402 5x IR objective and a WiDy InGaAs 650 IR camera. Once rough alignment of the PIC is achieved via visualization, fine alignment is conducted to maximize output power (measured using a Keysight N7745A optical power meter) using the Keysight software (Keysight Photonic Application Suite N7700A). All spectra were processed using custom automated software described previously.
Assay procedure
For sample preparation, 1:100 dilutions were made by mixing 10 μL of plasma with 990 μL of AWB. The dilution curve solutions were prepared by mixing 100 μL of plasma with 900 μL of AWB, (or equivalent ratio), and then diluting down to 1:25, 1:50, 1:100, 1:500, and 1:1000. The dilution curve blank was 1% BSA in AWB. Each glass slide was treated for 5 min with UV-ozone to create a hydrophilic surface and used by the end of the day. To initiate the assay, 25 μL of AWB was added to the GLAM card to wash off the Stabilcoat on the surface of the rings. Once the rings had stabilized in the fluid, 75 μL of the diluted plasma solution in AWB was added to the card, and spectra were continuously collected for the next 3 min. Endpoint measurements were taken at 3 min. The spectra were then analyzed by a custom Python script, just as it was previously refs. 33,34. A Shapiro–Wilk test was used to determine the normality of a sample distribution49. If the test result passed (p > 0.05), then normality was assumed, and a standard parametric t-test was used. If the test failed (p < 0.05), then a Kolmogorov–Smirnov test was applied to non-parametric data to determine statistical significance50.
Data availability
All original photonic sensor data is available from the corresponding author upon request.
References
-
CDC. Data and Statistics on von Willebrand Disease. Von Willebrand Disease (VWD) https://www.cdc.gov/von-willebrand/data/index.html (2024).
-
Weyand, A. C. & Flood, V. H. Von Willebrand disease: current status of diagnosis and management. Hematol. Oncol. Clin. North Am. 35, 1085–1101 (2021).
-
Bharati, K. P. & Prashanth, U. R. Von Willebrand disease: an overview. Indian J. Pharm. Sci. 73, 7–16 (2011).
-
Castaman, G. & Linari, S. Diagnosis and treatment of von Willebrand disease and rare bleeding disorders. J. Clin. Med. 6, 45 (2017).
-
Ng, C., Motto, D. G. & Di Paola, J. Diagnostic approach to von Willebrand disease. Blood 125, 2029–2037 (2015).
-
Roberts, J. C. & Flood, V. H. Laboratory diagnosis of von Willebrand disease. Int. J. Lab. Hematol. 37, 11–17 (2015).
-
VWF:CBA. https://practical-haemostasis.com/Factor%20Assays/vwf/VWF%20Functional%20Assays/vwf_cba.html.
-
James, P. D. et al. ASH ISTH NHF WFH 2021 guidelines on the diagnosis of von Willebrand disease. Blood Adv. 5, 280–300 (2021).
-
Flood, V. H. et al. Common VWF exon 28 polymorphisms in African Americans affecting the VWF activity assay by ristocetin cofactor. Blood 116, 280–286 (2010).
-
Haberichter, S. L. et al. Identification of type 1 von Willebrand disease patients with reduced von Willebrand factor survival by assay of the VWF propeptide in the European study: molecular and clinical markers for the diagnosis and management of type 1 VWD (MCMDM-1VWD). Blood 111, 4979–4985 (2008).
-
Graf, L. et al. Evaluation of an automated method for measuring von Willebrand factor activity in clinical samples without ristocetin. Int. J. Lab. Hematol. 36, 341–351 (2014).
-
Jaffray, J. et al. Laboratory misdiagnosis of von Willebrand disease in post-menarchal females: a multi-center study. Am. J. Hematol. 95, 1022–1029 (2020).
-
Diagnosing von Willebrand Disorder. The Haemophilia Society https://haemophilia.org.uk/bleeding-disorders/von-willebrand-disease/diagnosing-von-willebrand-disease/.
-
CDC. Diagnosing von Willebrand Disease. Von Willebrand Disease (VWD) https://www.cdc.gov/von-willebrand/diagnosis/index.html (2024).
-
Sidonio, R. F., Haley, K. M. & Fallaize, D. Impact of diagnosis of von Willebrand disease on patient outcomes: analysis of medical insurance claims data. Haemophilia 23, 743–749 (2017).
-
Lai, S.-W. et al. A comparative evaluation of an automated functional assay for Von Willebr and factor activity in type 1 Von Willebrand disease. Int. J. Gen. Med. 14, 5167–5174 (2021).
-
Strandberg, K., Lethagen, S., Andersson, K., Carlson, M. & Hillarp, A. Evaluation of a rapid automated assay for analysis of von Willebrand ristocetin cofactor activity. Clin. Appl. Thromb. Off. J. Int. Acad. Clin. Appl. Thromb. 12, 61–67 (2006).
-
Duboscq, C. et al. Validation of an automated assay to determine activity of ristocetin cofactor of von Willebrand factor. ResearchGate https://www.researchgate.net/publication/313387653_Validation_of_an_automated_assay_to_determine_activity_of_ristocetin_cofactor_of_von_Willebrand_factor (2016).
-
Favaloro, E. J. et al. Verification of the ACL Top 50 family (350, 550, and 750) for harmonization of routine coagulation assays in a large network of 60 laboratories. Am. J. Clin. Pathol. 156, 661–678 (2021).
-
Chen, D. et al. Validation of an automated latex particle-enhanced immunoturbidimetric von Willebrand factor activity assay. J. Thromb. Haemost. JTH 9, 1993–2002 (2011).
-
Hillarp, A. et al. Comparison of several von Willebrand factor (VWF) activity assays for monitoring patients undergoing treatment with VWF/FVIII concentrates: improved performance with a new modified automated method. Haemophilia 21, 837–845 (2015).
-
Shu, T. et al. Sensitive electrochemical detection of von Willebrand factor using an immunosensor comprising 7,7,8,8-tetracyanoquinodimethane and nickel-based metal–organic framework. Microchem. J. 195, 109351 (2023).
-
Mina, A., Favaloro, E. J. & Koutts, J. A novel flow cytometry single tube bead assay for quantitation of von Willebrand factor antigen and collagen-binding. Thromb. Haemost. 108, 999–1005 (2012).
-
Yan, B. et al. Development of a novel flow cytometric immunobead array to quantify VWF: Ag and VWF: GPIbR and its application in acute myocardial infarction. Eur. J. Haematol. 99, 207–215 (2017).
-
Roberts, J. C. et al. A novel rapid screening assay for the diagnosis of the phenotypic variants of Von Willebrand Disease (VWD). Blood 122, 3567 (2013).
-
Rauch, A. et al. A novel ELISA-based diagnosis of acquired von Willebrand disease with increased VWF proteolysis. Thromb. Haemost. 116, 950–959 (2017).
-
Szederjesi, A. et al. Comparison of von Willebrand factor platelet-binding activity assays: ELISA overreads type 2B with loss of HMW multimers. J. Thromb. Haemost. 18, 2513–2523 (2020).
-
Louka, M. & Kaliviotis, E. Development of an optical method for the evaluation of whole blood coagulation. Biosensors 11, 113 (2021).
-
Li, Y. et al. Three-dimensional morphological characterization of blood droplets during the dynamic coagulation process. J. Biophotonics 17, e202400116 (2024).
-
Medfisch, S. M., Muehl, E. M., Morrissey, J. H. & Bailey, R. C. Phosphatidylethanolamine-phosphatidylserine binding synergy of seven coagulation factors revealed using Nanodisc arrays on silicon photonic sensors. Sci. Rep. 10, 17407 (2020).
-
Avery, N. G. et al. Biophysical characterization of blood coagulation factor VIII binding to lipid nanodiscs that mimic activated platelet surfaces. J. Thromb. Haemost. 23, 513–524 (2025).
-
Cognetti, J. S. et al. Disposable photonics for cost-effective clinical bioassays: application to COVID-19 antibody testing. Lab. Chip 21, 2913–2921 (2021).
-
Bryan, M. R. et al. A multiplex “Disposable Photonics” biosensor platform and its application to antibody profiling in upper respiratory disease. ACS Sens. 9, 1799–1808 (2024).
-
Butt, J. N., Steiner, D. J., Bryan, M. R., Mann, K. E. & Miller, B. L. A dual-readout photonic sensor for simultaneous measurement of enzyme activity and concentration. ACS Sens. https://doi.org/10.1021/acssensors.5c01760 (2025).
-
Cardenosa-Rubio, M. C., Robison, H. M. & Bailey, R. C. Recent advances in environmental and clinical analysis using microring resonator-based sensors. Curr. Opin. Environ. Sci. Health 10, 38–46 (2019).
-
Luchansky, M. S. & Bailey, R. C. Silicon photonic microring resonators for quantitative cytokine detection and T-cell secretion analysis. Anal. Chem. 82, 1975–1981 (2010).
-
Guider, R. et al. Sensitivity and limit of detection of biosensors based on ring resonators. Sens. Bio-Sens. Res. 6, 99–102 (2015).
-
Qavi, A. J. et al. Rapid detection of an Ebola biomarker with optical microring resonators. Cell Rep. Methods 2, 100234 (2022).
-
Kindt, J. T. & Bailey, R. C. Biomolecular analysis with microring resonators: applications in multiplexed diagnostics and interaction screening. Curr. Opin. Chem. Biol. 17, 818–826 (2013).
-
Luan, E., Shoman, H., Ratner, D. M., Cheung, K. C. & Chrostowski, L. Erratum: Luan, E.X.; Shoman, H.; Ratner, D.M.; Cheung, K.C.; Chrostowski, L. Silicon photonic biosensors using label-free detection. Sensors 18, 3519 (2019).
-
Bucukovski, J. & Miller, B. L. Everything’s under control: maximizing biosensor performance through negative control probe selection. Anal. Chem. 97, 3525–3535 (2025).
-
Kyrle, P. A. et al. High plasma levels of factor VIII and the risk of recurrent venous thromboembolism. N. Engl. J. Med. 343, 457–462 (2000).
-
Fernández, K. S. & de Alarcón, P. A. Von Willebrand disease: range of the disease, and management. Curr. Pediatr. Rep. 2, 60–70 (2014).
-
Butt, J. N. et al. Optical and geometric parameter extraction across 300-mm photonic integrated circuit wafers. APL Photonics 9, 016104 (2024).
-
Types of von Willebrand Disease > Von Willebrand Disease > Bleeding Disorders > HoG Handbook > Hemophilia of Georgia. https://www.hog.org/handbook/article/1/7/types-of-von-willebrand-disease (2007).
-
DiGiandomenico, S. et al. Laboratory variability in the diagnosis of type 2 VWD variants. J. Thromb. Haemost. JTH 19, 131–138 (2021).
-
Akyol, O., Akyol, S. & Chen, C.-H. Update on ADAMTS13 and VWF in cardiovascular and hematological disorders. Clin. Chim. Acta 463, 109–118 (2016).
-
Fahrenkopf, N. M. et al. The AIM photonics MPW: a highly accessible cutting edge technology for rapid prototyping of photonic integrated circuits. IEEE J. Sel. Top. Quantum Electron. 25, 8201406 (2019).
-
Shapiro–Wilk test for multivariate skew-normality. Comput. Stat. https://link.springer.com/article/10.1007/s00180-021-01188-y (2022).
-
Berger, V. W. & Zhou, Y. Kolmogorov–Smirnov test: overview. In Wiley StatsRef: Statistics Reference Online (John Wiley & Sons, Ltd, 2014); https://doi.org/10.1002/9781118445112.stat06558.
Acknowledgements
This research was supported by the US National Institute of Standards and Technology (NIST) Rapid Assistance for Coronavirus Economic Response (RACER) program, grant number 70NANB22H015, as funded under the American Rescue Plan.
Ethics declarations
Competing interests
The authors declare no competing interests.
Additional information
Publisher’s note Springer Nature remains neutral with regard to jurisdictional claims in published maps and institutional affiliations.
Supplementary information
Rights and permissions
Open Access This article is licensed under a Creative Commons Attribution-NonCommercial-NoDerivatives 4.0 International License, which permits any non-commercial use, sharing, distribution and reproduction in any medium or format, as long as you give appropriate credit to the original author(s) and the source, provide a link to the Creative Commons licence, and indicate if you modified the licensed material. You do not have permission under this licence to share adapted material derived from this article or parts of it. The images or other third party material in this article are included in the article’s Creative Commons licence, unless indicated otherwise in a credit line to the material. If material is not included in the article’s Creative Commons licence and your intended use is not permitted by statutory regulation or exceeds the permitted use, you will need to obtain permission directly from the copyright holder. To view a copy of this licence, visit http://creativecommons.org/licenses/by-nc-nd/4.0/.
About this article

Cite this article
Butt, J.N., Scott, R.L., Bryan, M.R. et al. A multi-readout photonic sensor for rapid diagnosis of Von Willebrand disease. npj Biosensing 3, 7 (2026). https://doi.org/10.1038/s44328-025-00073-8
-
Received:
-
Accepted:
-
Published:
-
Version of record:
-
DOI: https://doi.org/10.1038/s44328-025-00073-8