Introduction
Retinitis pigmentosa (RP) is a monogenic disease that causes progressive vision loss and blindness [1, 2]. RP often has an early onset and has devastating consequences for children and young adults suffering from the disease, as it limits their independence and greatly impacts their quality of life [3]. The genetic cause and presentation of RP are highly heterogeneous among patients, but the disease is often characterized by degeneration of the photoreceptors and/or the retinal pigment epithelium (RPE) [4]. Together, photoreceptors and RPE cells enable the processing of photons (light) into an electrical signal. The electrical signal eventually becomes a visual signal in the brain, facilitating light and color perception. This process occurs through a cycle of reactions and conversions known as the visual cycle [5,6,7,8,9]. Mutations in genes involved in the visual cycle are the most common cause of RP [10]. There are over 4000 mutations in more than 100 different genes that are known to cause RP [10, 11]. Fig. 1 depicts a simplified schematic overview of the retina and the visual cycle, including metabolites and key proteins.

Absorption of light by rhodopsin causes the isomerization of 11-cis-retinal to all-trans-retinal. All-trans-retinal is then reduced to all-trans-retinol by retinol hydrogenases (encoded by RDH8, RDH12, and RDH14). All-trans-retinol is moved into the retinal pigment epithelium, either by proteins or through uptake into the blood, where it is esterified by lecithin: retinol acyltransferase (encoded by LRAT). Retinyl esters are converted into 11-cis-retinol by RPE-specific 65 kDa protein (encoded by RPE65). The 11-cis-retinol can then be esterified into 11-cis-retinal by retinol dehydrogenases (encoded by RDH5 and RDH11), which is moved back into the photoreceptors. Here, the cycle can start again. Important genes involved in the cycle are shown in white boxes. (Based on figures by Koster, 202120 and Kiser, 20129).
Some conversions in the visual cycle are completely dependent on the functioning of a single protein, such as the conversion of retinyl esters to 11-cis-retinol, facilitated by the retinal pigment epithelium-associated 65 kDa protein (RPE65), and the conversion of all-trans-retinol to retinyl esters, facilitated by the lecithin: retinol acyltransferase (LRAT) protein [12, 13] (Fig. 1). Pathogenic mutations of the RPE65 and LRAT genes have been described to cause RP in 5% and <1% of cases, respectively [14,15,16,17,18]. LRAT-associated RP typically begins with early-onset nyctalopia, which gradually progresses to blindness [15,16,17]. Patients suffering from this condition currently have no treatment options. However, in recent years, mouse and rat models have been developed to study LRAT-associated RP [19, 20]. One of these models is the Lrat–/– rat described by Koster and colleagues, which was created by introducing a frameshift mutation (c.12delA) in the Lrat gene of Brown Norway rats [20]. The c.12delA mutation is homologous to a mutation found in a Dutch RP patient cohort, who have a c.12delC (NM_00744.4) mutation in the LRAT gene [21]. Both one-basepair deletions cause a frameshift and an early stop codon, resulting in a heavily truncated, non-functional protein. Although residual rat Lrat (rLrat) RNA and protein can be detected in rats carrying this mutation, the model has been confirmed to represent a functional knockout [20]. The similarities between the patient group and the animal model make the Lrat–/– rats highly representative of this specific patient group, and they can be used to test potential therapies in vivo.
One such potential treatment for LRAT-associated RP is gene supplementation therapy using adeno-associated virus (AAV). AAVs are known for their efficient transduction of genetic material into cells [22]. However, it remains a challenge to target specific cells within the body, which is crucial to lower the risk of adverse events [23, 24]. Choosing a suitable AAV serotype can increase tissue specificity [25, 26]. The AAV2 serotype is most often used in ocular applications due to its efficient transduction of the inner retina and limited invasion into other tissues following subretinal injection [27]. Another option is the synthetic AAV2.7m8, which was created by subjecting AAV2 to directed evolution to enhance its specificity to the retina [28]. AAV2.7m8 is reported to have increased transduction efficiency in all layers of the retina [28]. The natural compartmentalization and immunoprivilege of the eye further reduce the risk of an immune response [24, 29].
Additionally, LRAT-associated RP has a unique disease progression, where functional vision loss occurs before extensive degeneration of retinal cells. This provides a prolonged treatment window during which the retinal cells are still viable [21]. Finally, the feasibility of ocular gene supplementation for RP is already illustrated by the approval of voretigene neparvovec-rzyl, a gene supplementation therapy for RPE65-associated RP [30,31,32]. Since RPE65 and LRAT are both RPE genes with crucial roles in the visual cycle (Fig.1), and their malfunctioning causes comparable symptoms, LRAT-associated RP might be a suitable candidate for a similar therapeutic approach. However, while voretigene neparvovec-rzyl improves vision, long-term effects such as retinal atrophy highlight the need for further advancements in the ocular gene therapy field [33, 34].
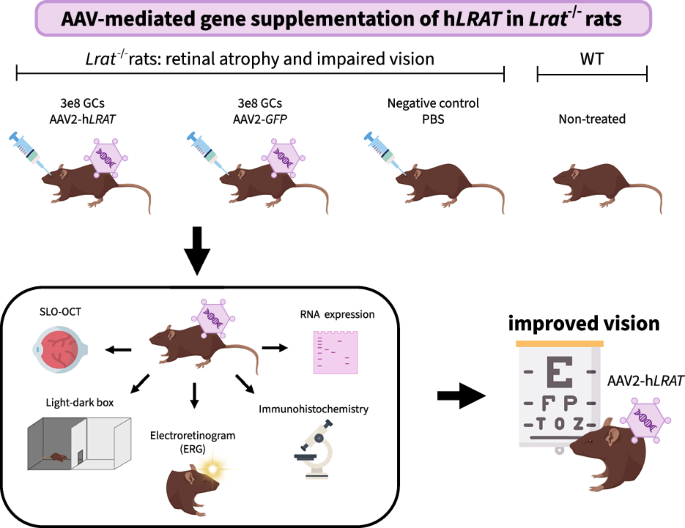
In this study, we designed and tested an AAV-mediated gene supplementation therapy for LRAT-associated RP in vivo using the Lrat–/– rat model, modelling our approach as closely as possible on the clinically approved voretigene neparvovec-rzyl [20]. To this end, we first assessed the retinal transduction of AAV2 and AAV2.7m8 after subretinal injection at three different doses in wild-type (WT) Brown Norway rats. We then designed a proof-of-concept study in which Lrat–/– rats were treated with a low dose of AAV2-hLRAT (human LRAT) vectors. The aim of the project was threefold: (1) show successful transduction and expression of the AAV-delivered genes, (2) show that hLRAT expression causes maintenance of healthy morphology and functionality of the eye, and (3) show that this translates to a (partial) return of vision.
Materials and methods
Animal studies: general methods and blinding
The supplementary methods include a table providing an overview of all animals used in this study (including dropouts), describing how the tissue was utilized, and which data measurements were excluded from analysis (Supplementary Table 1).
We conducted all animal experiments in accordance with the ARVO Statement for the Use of Animals in Ophthalmic and Vision Research, and they were approved by the Netherlands’ national committee and the animal welfare body of the Amsterdam UMC (license number AVD11400202011085, protocol number SP2400053). The number of animals used was determined using a power calculation before the start of the experiment, based on expected outcomes of electroretinography (ERG) data [35]. Animals received a number at the start of the experiment. The treatment that the animals received was determined using a random number generator. Both males and females were used, housed independently of treatment or genotype in groups of 2–4. Investigators were blinded to the different treatment groups. However, WT controls were identifiable since they were the only group not receiving an injection.
During the experiment, the in vivo electrical response to light was measured using ERG. Afterwards, the retina was imaged using optical coherence tomography (OCT) and scanning laser ophthalmoscopy (SLO) with a blue fluorescence laser (488 nm excitation), as described previously [20]. After the final ERG and SLO-OCT measurement, the rats were terminated using an anesthetic overdose administered to the heart, and then death was confirmed by opening the abdominal cavity. The eyes were removed and snap-frozen to –80 °C, or submerged in either 4% PFA or 10% formalin, depending on the processing method. All subsequent analyses were either performed automatically by computer programs or executed by blinded researchers, who used solely animal numbers as identifiers.
Subretinal injections
Rats were placed under general anesthesia, and both anesthetic and dilating eyedrops were administered (methods described in ref. [20]). A sclerotomy was performed with a 1 mm ophthalmic knife, then a 5 μL Hamilton syringe with a 33 G blunt needle was used to deliver 2 μL of AAV or PBS subretinally. The needle was left in place for a few seconds after injection to prevent outflow. The location of the injection site was noted down by the retinal surgeon directly after surgery. Any complications that arose during the surgery, such as bleeding, were also recorded. Then, successful injection in the subretinal space was confirmed using SLO-OCT imaging. These images were used as the reference for subsequent SLO-OCT images using the Heidelberg reference function, ensuring that future SLO-OCT images all had the same orientation. Operated eyes received antibiotic ointment for recovery.
Animal studies: AAV serotype and dose
WT Brown Norway rats were subretinally injected bilaterally with either AAV2 or AAV2.7m8 containing the enhanced GFP (eGFP, referred to as GFP for simplicity) coding sequence (U55762, NCBI) under a CAG (cytomegalovirus early enhancer/chicken β-actin) promoter at three different doses: low = 3e8 GCs, medium = 1e9 GCs, and high = 3e9 GCs, in 2 μL suspension, ordered as custom UltraPure virus from VectorBuilder (Chicago, IL). Each group contained n = 8 eyes. We also injected with PBS (sham; n = 4 eyes). Rats were monitored at week 0 (baseline), 2, 3 and 5 post-treatment using ERG and SLO-OCT. The rats that received the high dose of AAV exhibited severe atrophy early in the experiment and were removed from further testing and analysis (Supplementary Fig. 1).
Animal studies: AAV treatment
Brown Norway rats with a homozygous c.12delA mutation in the Lrat gene, mimicking an RP-causing mutation in humans (c.12delC), were previously generated and phenotyped [20]. At 5 weeks of age, these Lrat–/– rats were subretinally injected in both eyes; one group with AAV2-hLRAT (3e8 GCs, n = 16 eyes), and one group with AAV2-GFP (3e8 GCs, n = 16 eyes). AAV constructs included the gene’s coding sequence (NM_004744.5 for hLRAT, U55762 for GFP) under a CAG promoter. The AAVs were ordered from VectorBuilder (UltraPure custom virus) and administered in a 2 μL suspension. As controls, we used WT untreated rats (n = 8 eyes) and Lrat–/– rats injected with 2 μL PBS (sham) (n = 6 eyes). Rats were monitored for 8 weeks after treatment. ERG and SLO-OCT measurements were made at weeks 0, 1, 2, 3, 4, 6, and 8 post-injection. A behavioral assay with a light-dark box was performed before injection and 8 weeks post-injection.
RNA isolation and cDNA synthesis
RNA was isolated from frozen (–80 °C) rat eyes using Trizol reagent (ThermoFisher, Waltham, MA). Samples were then purified twice to remove any residual DNA, using a RNeasy Mini Kit (QIAGEN, Hilden, Germany) according to the manufacturer’s instructions. SuperScript III Reverse Transcriptase (ThermoFisher) was used for cDNA synthesis, using 200 ng of purified RNA. PCRs were run using a HOT FIREPol DNA Polymerase Kit (Solis Biodyne, Tartu, Estonia). The primers used are listed in Supplementary Table 2. All PCRs were in multiplex with β-actin. PCR products were run on a 2% agarose gel with 1x TAE buffer at 100 V for 45 min, or on a 3.5% agarose gel at 60 V for 4 h when fragments were close in size. Imaging was done using a ChemiDoc imaging system using auto-optimal exposure (Bio-Rad, Hercules, CA).
Pathology
Rat eyes fixed in 10% formalin were processed by an Amsterdam UMC in-house pathologist following standard methods [36]. The resulting slides were scanned using an iSyntax machine (Philips, Amsterdam, The Netherlands). We selected the 10 middle sections of each eye (to exclude sections that only contained fat and/or muscle) and removed scans that were out of focus (Supplementary Table 1). The remaining scans were processed with Qupath version 0.5.1-arm64 [37]. We used the automatic cell detection within this program to annotate the nuclei in the section. We then calculated cell density in the inner and outer nuclear layers by manually selecting three 100 μm-wide regions at +0.5, +2, and –3 mm from the optic nerve and taking the average of the number of nuclei in these regions. One rat was removed from analysis because it died approximately one month before the study ended, resulting in its retinal degeneration being less advanced than the other Lrat–/– animals (Supplementary table 1). We determined significant differences between groups with a generalized linear model with the eye as the random variable, followed by pairwise comparisons using Tukey adjustment for multiple testing correction.
Retinal thickness
Retinal thickness was determined using the OCT scans taken at various time points during the experiment. We used the automatic segmentation module of the Heidelberg Spectralis (Heidelberg Engineering, Heidelberg, Germany) combined with OCTolyzer [38] to determine the retinal thickness, measured from the Bruch’s membrane to the inner limiting membrane. Four regions of interest were defined: the injection site, which was always an outer retinal region; the site immediately inferior to the injection site (“closest to injection site”); the site opposite to this (“Intermediate distance”); and the site opposite the injection site (“furthest from injection site”). These regions of interest were determined for each eye based on the surgery notes (a visual representation of the regions is available in Supplementary Fig. 2). We removed measurements from weeks 1, 2, and 3 post-injection because the common post-surgery hemorrhaging in the vitreous and/or subretinal space interfered with the automatic segmentation, making it inaccurate. The remaining data were normalized to the WT retinal thickness at the corresponding area of the eye and time of measurement. Significant differences were determined using a one-way ANOVA. To ensure the quality of the data obtained using this automatic segmentation method, we compared our results with those from manual segmentation (Supplementary Fig. 3).
Immunohistochemistry
Rat eyes (4% PFA, 48 h) were processed using a sucrose gradient of 15% sucrose, 30% sucrose, and a 2:1 mix of 30% sucrose and optical cutting temperature compound (Tissue-Tek, Sakura Finetek, Torrance, CA), each incubated for 24 h at 4 °C. The eyes were embedded in optical cutting temperature compound and snap-frozen using liquid nitrogen. A CryoStar NX50 cryostat (ThermoFisher) was used to create 5-µm-thick sections. The sections were incubated in anti-opsin (AB5405, Sigma-Aldrich) at a 1:200 dilution in blocking buffer (1% BSA, 0.2% Triton X-100 in PBS), or anti-hLRAT (custom-made; Biomatik, Ontario, Canada) at a 1:50 dilution in blocking buffer, for 90 min. After washing with PBS, the sections were incubated in DAPI (ThermoFisher) and secondary antibody (Goat-anti-Rabbit Alexa Fluor 594, ThermoFisher) at a 1:200 dilution in 0.2% Triton in PBS for 2 h. The slides were washed with PBS and mounted using ProLong Gold Antifade Mountant (ThermoFisher). The entire staining process was performed at room temperature in the dark to maintain GFP fluorescence. GFP was not separately stained. Images were made using a Leica (Wetzlar, Germany) Stellaris 5 confocal microscope with a 62x magnification lens. For the pilot study, images were made with a 40x magnification lens. Raw images were processed using Fiji [39].
ERG data analysis
Electroretinograms were obtained following the methods described by Koster and colleagues [20]. Data were analyzed using a custom-made R script created specifically for this study, which identified the a- and b-wave implicit times and amplitudes. In short, the data was zero-centered by subtracting the average voltage before the stimulus (<20 ms) from the entire signal. A 4th-order low-pass filter (30 Hz, for the b-wave) and high-pass filter (235 Hz, for the a-wave) were applied to the data in both forward and reverse direction using the Signal package in R [40, 41]. These filters were applied to remove noise and oscillatory potentials, making the a- and b-waves easier to identify. The time points of the a- and b-waves were determined from the filtered data. Then, the voltage at these time points was calculated from the non-filtered data using interpolation. Failed (unreadable) measurements or artifacts were removed, based on a visual inspection of the electroretinograms. Three measurements were removed: one from a WT rat and two from a sham-treated rat (Supplementary Table 1). Flatlines were not removed. Significance was determined using multiple t-tests with a Bonferroni correction.
Vision-based behavior
Behavioral experiments were conducted between 17:00 and 19:00 p.m., when the rats were in their natural active phase. The radio was turned on to minimize effects from outside noise. Rats were placed in the light compartment of a light-dark box (each compartment 50 cm x 50 cm and 40 cm high), which was placed in the same location for every measurement to minimize effects from light and shadows. The rats were placed in the light side of the box, as far away from the door to the dark compartment as possible. They were filmed for a total of 20 min from the moment they entered the box. The videos were analyzed manually, and the time spent in each compartment of the box was calculated. Three separate areas were defined: a light area, a dark area, and a transition zone. The transition zone connects the light and dark areas of the box. The rats were considered to be located in the transition zone if they were investigating the sides of the door between the compartments or when they were partially located in both compartments simultaneously. If only the snout or tail were in the other compartment, this was not considered to be time spent in the transition zone. The number of times the rats returned to the light compartment was also counted. Measurements from rats that spent more than 10 min uninterrupted in the same compartment in a single 20-min recording were discarded. To determine changes in behavior, differences were first calculated per rat (start versus end of experiment), then averaged per group. Wilcoxon signed-rank tests were used to determine whether there were significant changes, both in time spent per compartment, or the number of returns to the light compartment, for the LRAT-treated group. P-values were adjusted with a Bonferroni correction. The WT and sham-treated group did not contain enough animals to reliably assess p-value using a Wilcoxon signed-rank test, so we present 95% confidence intervals instead.
Statistical analysis and figures
All statistical analyses were performed using R Version 2023.06.0 + 421 and the Tidyverse package [40, 42]. We considered the results significant with a p < 0.05 (after adjustment). We also used R to create all data-describing graphs and figures [40]. Fig. 1 and the graphical abstract were created using Adobe Express and Microsoft PowerPoint. All figures were edited using Adobe Express.
Results
Low-dose AAV2 results in widespread retinal transduction after subretinal injection
After treating the WT Brown Norway rats with AAV2-GFP and AAV2.7m8-GFP at the low and medium dose, we used SLO imaging with a blue fluorescence laser (488 nm excitation) on the rat eyes at 3- and 5-weeks post-treatment to determine localization and persistence of the GFP protein throughout the study period (Fig. 2A). We also imaged GFP expression in the layers of the retina using confocal microscopy on thin (5 μM) sections of the eye (Fig. 2B). Both groups that received AAV2 and AAV2.7m8 maintained or increased GFP expression throughout the 5-week follow-up period. Although AAV2.7m8 resulted in stronger gene expression than AAV2 in the neural retina, this expression was mostly limited to the bleb area. AAV2, on the other hand, was less effective at transducing the neural retina, but caused widespread gene expression across the fundus (Fig. 2A, C). We frequently observed lower GFP expression in the injection site itself than in surrounding areas, potentially due to negative effects of the surgery or due to excessive expression of the transgene in this region. Both serotypes caused transduction of the outer nuclear layer (ONL) and outer segments (OS), but AAV2 also caused transduction of the RPE and outer plexiform layer (OPL). Strong inner plexiform layer (IPL) labeling was observed in several sections of both AAV2- and AAV2.7m8-treated eyes, potentially due to slight intravitreal leaking of the virus after injection; this is a known possibility during subretinal injections [43]. Fundus imaging revealed higher gene expression in eyes that received the medium dose of either AAV serotype. However, confocal images of retinal sections did not support a clear difference in retinal cell transduction between the low and medium doses (Fig. 2B). Based on these findings, we chose to continue with AAV2 at the low dose. Since our goal was mainly to transduce the RPE and not the neural retina, we preferred AAV2’s wider spread across the fundus and stronger RPE expression compared to AAV2.7m8. The low dose was selected due to the anticipated lower risk of adverse effects, as the medium dose did not offer a clear benefit based on the confocal images.

Wildtype Brown Norway rats were injected subretinally with AAV2-GFP or AAV2.7m8-GFP at a dose of either 3e8 GCs (low) or 1e9 GCs (medium) (n = 8 eyes per group). Sham received an injection with PBS as a control (n = 4 eyes). They were followed for 5 weeks post-injection using electroretinography and scanning laser ophthalmoscopy-optical coherence tomography (SLO-OCT). A SLO imaging with a blue fluorescence laser (488 nm excitation) revealed more widespread GFP expression with AAV2 compared to AAV2.7m8 at both doses tested. AAV2 transgene expression could be observed across the entire fundus, whereas the groups injected with AAV2.7m8 showed expression only in and around the bleb. GFP expression was stable or increased throughout the 5-week period in all groups. The medium dose resulted in stronger gene expression when using either AAV serotype. The location of the OCT images is shown with the yellow line. B Immunohistochemistry images revealed a similar GFP expression pattern in eyes that received either the low or medium dose of either AAV (n = 8 per group). GFP expression was found in the outer nuclear layer (ONL), the photoreceptor outer segments (OS), the retinal pigment epithelium (RPE), and the inner plexiform layer (IPL). AAV2-treated eyes showed similar GFP expression on sections throughout the eye. AAV2.7m8-treated eyes had strong expression in a few sections, presumably those near the bleb, and low to no detectable GFP expression in other sections. C Imaging larger regions of eyes treated with low-dose AAV2 (left) or AAV2.7m8 (right) supports a difference in lateral spread between the two AAV serotypes. Eyes treated with AAV2 exhibit large lateral spread, with GFP expression in the RPE, ONL, OS, and IPL across the entire imaged region. Eyes treated with AAV2.7m8 showed stronger expression in the ONL and OS, but only in a small region, with little lateral spread.
LRAT and GFP are successfully delivered and expressed in the retina
To test the LRAT gene supplementation therapy, we injected Lrat–/– rats subretinally with the low dose of AAV2 containing either the hLRAT or GFP gene, or PBS (sham), at 5 weeks of age. This moment was chosen based on our previous phenotyping study of Lrat–/– rats, where we observed sufficient viable cells at this age [20]. We also used untreated WT Brown Norway rats of the same age for normalization purposes. Successful subretinal injections were confirmed on SLO-OCT. Post-surgery bleeding in the intravitreal or subretinal space was observed in around 40% of cases and resolved spontaneously by week 3 post-injection. RT-PCR confirmed delivery of the transgene in the eye (Fig. 3A). As a control, we also confirmed the presence of β-actin and rat Lrat (rLrat) for all groups. Although the Lrat–/– rat is a functional knockout, rLrat RNA and protein are still present in lower amounts [20]. The origin of this residual presence is currently unknown. We further visualized gene expression of GFP in vivo with the use of a blue fluorescence laser (488 nm excitation) during SLO imaging to identify where in the retina the AAV cargo was expressed (Fig. 3B). At 1 week post-injection, GFP expression was mostly localized around the injection site. Expression remained visible until termination (8 weeks post-injection), and became widely visible across the entire retina.

A RT-PCR (n = 3 for AAV2-GFP & AAV2-hLRAT, n = 2 for wildtype and sham) showed that there was successful delivery and transcription of the genes delivered with the AAV (hLRAT and GFP). The presence of β-actin and rLrat was also confirmed as controls. B In vivo gene expression of GFP was visualized using scanning laser ophthalmoscopy with a blue fluorescence laser (488 nm excitation). The expression started around the injection site (bleb is shown with a yellow dashed line) at the start of the experiment (1 week post-treatment). Expression became widespread across the retina by the end of the experiment (8 weeks post-treatment).
hLRAT-treated retinas retain healthier morphology
It has previously been described that the retinal thickness of untreated Lrat–/– rats decreases rapidly with age, mostly affecting the ONL [20]. We monitored the thickness and layering of the retina using OCT at weeks 0, 4, 6 and 8 post-injection. After termination, the rats’ eyes were sectioned and stained with hematoxylin and eosin (H&E) to examine the retinal morphology. Small areas with damage and/or disorganization of the retina were found on the pathology sections of the subretinally injected eyes (Supplementary Fig. 4). The H&E stainings furthermore revealed a significant decrease in cell density of the ONL in the untreated Lrat–/– rats. The decrease in ONL cell density was less severe in hLRAT-treated rats (Fig. 4A). The images also revealed atrophy in the OS, inner nuclear layer (INL), and OPL in untreated Lrat–/– rats. The latter was observed equally in Lrat–/– rats treated with AAV2-hLRAT. Sections of GFP-treated eyes frequently exhibited gaps in the outer nuclear layer, rather than showing an altogether thinner neural retina. However, this might be caused by sectioning artifacts due to tissue fragility in degenerating tissues. Quantification of the nuclei density in the ONL and INL revealed a significant difference between WT rats and GFP-treated rats (p = 0.04). There was no significant difference between WT and hLRAT-treated Lrat–/– rats, highlighting the improved nuclei count of the hLRAT-treated group (Fig. 4B). However, there was also no significant difference between hLRAT-treated rats and GFP-treated Lrat–/– rats. The hLRAT-treated eyes in this analysis showed a large variation in the nuclei counts between different eyes, with one eye showing markedly preserved nuclei and others showing a moderate increase compared to GFP-treated eyes. GFP-treated eyes exhibited consistent nuclei counts in the eyes that were analyzed. Overall, the data trends suggest an improvement in the nuclei counts after hLRAT-treatment; however, the low sample size limits the strength of these conclusions.

A Images of hematoxylin & eosin (H&E) stainings of paraffin-embedded eyes showed a severe loss of photoreceptor nuclei (outer nuclear layer = ONL) in Lrat–/– rats treated with AAV2-GFP (n = 2) compared to wildtype (WT) (n = 2) rats. Photoreceptor nuclei were more conserved in AAV2-hLRAT (n = 4) treated rats compared to Lrat–/– rats treated with AAV2-GFP. The outer segments of the photoreceptors (OS), as well as the inner nuclear layer (INL), which contains the bipolar cells, were also more degraded in GFP-treated rats compared to LRAT-treated rats. The outer plexiform layer, on the other hand, was similarly degraded in both Lrat–/– groups. These images were chosen to be a clear depiction of the differences in cell density; however, there was strong variation in the treatment group. Images were taken on the 5th section of each eye 1 mm to the right of the optic nerve. Scale bars show 50 μm. B The density of the nuclei in the ONL and INL in a 100 μm region was quantified using a custom workflow on QuPath slide analysis software. Each dot in the graph shows the density of the nuclei in a section (grouped and colored per eye; * = p < 0.05). The boxplot was made using the mean nuclei density per eye. WT rats had significantly denser nuclei compared to AAV2-GFP treated rats (p = 0.04), but not compared to AAV2-hLRAT treated rats (NS). The group treated with AAV2-hLRAT had a large variation between eyes, with one eye showing a higher nuclei density than the others. C Retinal thickness was measured throughout the study using optical coherence tomography. AAV2-hLRAT-treated rats (n = 8) maintained WT retinal thickness in the area closest to the injection site (p = 0.007), whereas untreated eyes became around 10% thinner. There was no difference in retinal thickness between treated and untreated eyes in all other areas, as both groups became around 10% thinner after 8 weeks.
The OCT scans revealed no differences in the retinal thickness in most areas of the eye, as both treated and untreated Lrat–/– rats showed around 10% thinning of the retina in these areas (Fig. 4C). However, we did observe a difference between treated and untreated eyes in the area directly inferior to the injection site. Healthy retinal thickness was maintained in the group treated with AAV2-hLRAT, whereas the sham-treated group was approximately 10% thinner, declining at a similar rate that was observed in the other regions. The difference between the two groups in the area inferior to the injection site was significant (F = 7.868, p = 0.007, Fig. 4C). A visual overview of this thickened region is available in Supplementary Fig. 5. However, post-hoc comparisons did not reveal any statistically significant differences between individual group pairs (all p > 0.05). No other areas of interest had any significant differences. This finding aligns with our observations on the H&E slides, where, although the nuclei were preserved in some eyes in the treatment group, we did not observe a clear increase in overall retinal thickness.
To confirm expression of the hLRAT gene in the target cell type (RPE), we performed a staining with a custom antibody specific for hLRAT protein (Fig. 5A). All eyes treated with AAV2-hLRAT exhibited clear hLRAT expression within the RPE layer. We also observed a signal in the INL, though this was infrequent (data not shown). In WT rats, non-specific staining was consistently observed in the inner plexiform layer (IPL) and ganglion cell layer (GCL), likely due to cross-reactivity with endogenous rLrat protein. A similar IPL/GCL expression pattern appeared in AAV2-hLRAT-treated eyes, whereas sham- and GFP-treated controls showed no detectable hLRAT staining in any retinal layer.

The nuclei were counterstained with DAPI (blue). In both panels, the bottom picture is a merge of all stainings. A immunostainings of human LRAT (hLRAT) revealed strong hLRAT expression in the retinal pigment epithelium (RPE) of AAV2-hLRAT treated eyes (n = 6), confirming expression of the transgene in the target cell type. No hLRAT expression was found in sham- or GFP-treated Lrat–/– rats (n = 2 and n = 6, respectively). B The opsin stainings revealed improved cone photoreceptor numbers and morphology in AAV2-hLRAT (n = 6) rats compared to sham-treated rats (n = 2), which had shorter and sparser outer segments. The morphology and number of outer segments in the AAV2-hLRAT-treated eyes varied between eyes and sections, but on average were more similar to wild-type (n = 2) eyes. Sham-treated and GFP-treated eyes, on the other hand, all had no outer segments or only a few, which were partially degenerated (shorter), highlighting the progressing retinal degeneration of the Lrat–/– rats. The cone outer segments in the GFP-treated eyes are indicated with yellow arrows. The GFP expression in the AAV2-GFP-treated eyes indicated that the AAV expression was mostly localized in the outer and inner nuclear layer, outer segments, and retinal pigment epithelium. GFP expression was also identified in the inner plexiform layer (not shown here).
We also performed stainings for red/green opsin to visually inspect the number and morphology of the cone photoreceptors (Fig. 5B). Rats have a low number of cones compared to rods (<3% cones), so individual cones can be visualized in immunostained sections, allowing us to assess their morphology accurately [44, 45]. In healthy eyes, opsin is located in the outer segments of the cone photoreceptors. Our staining of WT untreated eyes was in line with this expectation; cone photoreceptors were present and showed normal morphology (Fig. 5B). Untreated Lrat–/– rats, on the other hand, showed no or only a few cone photoreceptors, and when they were present, they had mostly lost their normal morphology and had degenerated down to stumps. Multiple sections of sham- and GFP-treated rats also exhibited specks of opsin in the OPL, a known marker of retinal degeneration (Supplementary Fig. 6) [46]. The shortened cone outer segments and the opsin in the OPL both highlight the progressing degeneration in sham- and GFP-treated Lrat–/– eyes. LRAT-treated eyes, on the other hand, contained more cone photoreceptors, which also exhibited healthier morphology, and did not show opsin in the OPL. However, similarly to the nuclei quantification, there were also eyes within this group that did not show significantly improved photoreceptor morphology, and more closely resembled untreated Lrat–/– eyes. We also imaged GFP to identify where our gene constructs were being expressed within the retina. AAV2-GFP-treated eyes revealed that the gene expression of the AAV within the retina was predominantly localized in the photoreceptors (ONL and outer segments) and RPE (Fig. 5). We observed GFP expression in the OPL and IPL in a small number of sections as well. The expression of GFP was identifiable on sections across the entire retina, although the intensity varied. We were unable to identify a clear pattern in these differences in intensity. The GFP expression intensity was notably higher in the RPE and ONL, and lower in the IPL, than previously observed in our pilot experiments, potentially due to the longer follow-up of the rats in this assessment (8 weeks compared to 5 weeks), or due to variability in the injections.
Lrat–/– rats recover ERG b-wave after AAV2-hLRAT treatment
Besides the morphology of the eye, we monitored the physiological response to light using ERG, once before treatment, and weekly or bi-weekly after treatment, until 8 weeks post-treatment. The response was measured after scotopic light impulses of increasing intensities (0.003, 0.3, 3.0, and 30.0 cd·s/m²). In a healthy situation, the ERG trace would first show a negative deflection (a-wave), followed by a large positive deflection (b-wave) (Fig. 6A). Without interventions, untreated Lrat–/– rats showed a complete absence of a-waves and oscillatory potentials (smaller waves in between the a- and b-wave), and only showed a subtle b-wave response at the strongest light intensity (30 cd·s/m2) [20]. After treatment with AAV2-hLRAT, Lrat–/– rats exhibited a recovery of the b-wave, even at lower light intensities (Fig. 6A). At higher light intensities, subtle oscillatory potentials also appeared in a few eyes. The a-waves, however, remained mostly absent at all light intensities. The ERG response of untreated or sham-treated Lrat–/– rats remained unchanged throughout the 8 weeks.

A ERG traces from a wildtype (WT) Brown Norway rat (blue) versus an Lrat–/– rat (orange), either untreated (left, data from Koster, 202120), sham-treated (middle), or treated with AAV2-hLRAT (right), at 6 weeks post-treatment. The healthy response to light consists of a depolarization (a-wave), followed by a polarization (b-wave), and finally a return to baseline. Untreated and Sham-treated Lrat–/– rats show almost no retinal response to light, except at the highest light intensity (30 cd•s/m2). Lrat–/– rats treated with AAV2-hLRAT regain a b-wave response even at lower light intensities (as low as 0.003 cd•s/m2). The AAV2-hLRAT electroretinograms presented here were chosen for illustrative purposes to demonstrate the potential of the therapy and are not representative of the average response within the treatment group. B Quantification of the b-wave amplitude in Lrat–/– rats treated with AAV2-hLRAT (orange, n = 16*) or sham (blue, n = 6*), after a light flash of 0.003, 0.3, 3, and 30 cd*s/m2 showed a significant increase of the b-wave at multiple light intensities and at multiple time points; starting at 2 weeks post-treatment, and lasting until 8 weeks post-treatment (end of the experiment) (multiple t-tests with Bonferroni correction; * = p < 0.05, ** = p < 0.01). Data were normalized to the average WT (n = 8) b-wave amplitude. Error bars show the SE. C Relative implicit time of the b-wave. The implicit time is the time it takes for the b-wave to occur after receiving the light stimulus. Sham-treated rats did not show a clear pattern in the implicit time, as there was a high standard error within the group. In contrast, AAV2-hLRAT-treated rats exhibited an implicit time of approximately 1 (the same as WT) at most light intensities and time points, with a low standard error. This effect was again not observed at the highest light stimulus (30 cd·s/m²). *Some individual measurements were not able to be analyzed; the removed measurements are specified in Supplementary Table 1.
Quantification of the b-wave amplitude of Lrat–/– rats treated with AAV2-hLRAT compared to sham revealed significant improvements in the response to light of various intensities in the AAV2-hLRAT group (Fig. 6B). There was no significant improvement at the highest light intensity, presumably because the Lrat–/– rats were already responsive to this light intensity to begin with. The average b-wave amplitude of hLRAT-treated rats reached 10–15% of that of WT rats, compared to 0–5% in sham-treated rats at 0.003, 0.3, and 3 cd·s/m2. There was a large variation in the amount of b-wave improvement within the hLRAT-treated group, with some eyes reaching WT levels, and others remaining close to a flatline. None of the groups showed a significant improvement in a-wave amplitude (Supplementary Fig. 7). The b-wave implicit time was also monitored. The implicit time is the time it takes for the b-wave to occur after the light stimulus is provided. The hLRAT-treated rats maintained a relative implicit time close to 1 (WT situation) with low standard deviation at all tested light intensities. In contrast, the relative implicit time of untreated rats was often higher and had a higher standard deviation (Fig. 6C). Similar to the amplitude, the implicit time did not show clear improvements at the highest light intensity.
Changes in behavior indicate a return of functional sight in hLRAT-treated rats
A straightforward experiment using a light-dark box was conducted to determine behavioral changes in Lrat–/– rats before and after treatment with AAV2-hLRAT or sham. The rats were placed in a box with a dark compartment and a light compartment (each comprising exactly half the box’s surface) and monitored for 20 min. Healthy WT rats are naturally inclined to hide in the dark due to their nature as prey animals, so they typically spend most of their time in the dark compartment of the box [47]. However, when the rats are blind, they cannot distinguish between the light and dark parts of the box, resulting in a random division of time between the compartments. Blind rats also spend more time in the transition zone (the door in between the light and dark compartments) than WT rats [20].
Quantification of the time spent in each compartment before and after treatment revealed that Lrat–/– rats treated with hLRAT (n = 7) spent on average 16.7 ± 6.1% more time in the dark area and 19.9 ± 5.2% less time in the light area after treatment; both significant differences (dark: p = 0.033, light: p = 0.012, Fig. 7). We also observed a significant decrease in the number of times the rats returned to the light compartment at the start and end of the experiment (p = 0.047). All but one rat in the hLRAT-treated group returned to the light compartment fewer times after treatment than at baseline measurement. Sham-treated rats, however, started spending even less time in the dark area (–18.3 ± 10.9%), and more time in the transition zone (+20.4 ± 6.1%) (Fig. 7). These results suggest a worsening condition in the untreated group, whereas the treated group showed improvements in functional vision. WT control rats showed no clear differences in the amount of time spent in each compartment or the number of returns to light. Because p-values could not reliably be assessed for the WT and Sham-treated group, the 95% confidence intervals of the data are presented in Table 1. The changes per animal of each parameter can be found in Supplementary Fig. 8. We also assessed the latency time of the animals to enter the dark compartment after initial placement in the box, but this revealed no statistically significant changes (Supplementary Fig. 9).

Changes were first calculated per rat, then averaged per group, for each outcome. A Bars show the average change in time spent in each compartment of the light-dark box in percentage points. The dots show the change per animal. The baseline measurement was taken before treatment, and the end measurement was taken at 8 weeks post-treatment. Error bars show the SE. WT rats (n = 4) did not exhibit any significant changes in behavior over time. Lrat–/– rats treated with AAV2-hLRAT (n = 7) started spending significantly more time in the dark area of the box, and less time in the light area, indicative of a return of vision (Wilcoxon signed-rank test; * = p < 0.05). Untreated Lrat–/– rats (n = 3), on the other hand, started spending less time in the dark area, which could suggest worsening of the phenotype [21]. B The number of times the rats returned to light at the start and end of the experiment significantly decreased for AAV2-hLRAT-treated rats (Wilcoxon signed-rank test; * = p < 0.05). All but one individual rat in this group returned to the light area less frequently at the end of the experiment.
Discussion
This study aimed to provide proof-of-concept for an AAV-mediated gene supplementation therapy to treat LRAT-associated RP. We demonstrated the feasibility of this approach through a series of in vivo and ex vivo tests using the patient-based Lrat–/– Brown Norway rat model [20]. Previous studies had already shown that Lrat gene supplementation in Lrat–/– mice is feasible and effective; however, proof-of-concept had not yet been achieved with the human LRAT gene or in a patient-based animal model [19]. The retained healthy morphology of the eye, increased electrical response to light, and changes in behavior of the rats all suggest an improvement in functional vision following LRAT gene supplementation. Despite these positive results, treatment efficacy varied among eyes. This observation, together with recent reports of retinal atrophy caused by the similar gene supplementation therapy voretigene neparvovec-rzyl (a gene supplementation therapy for RPE65-associated RP), underscores the need to optimize the dosing, timing, injection strategy, and the components of the AAV-mediated gene supplementation [33, 34].
We began the study with a small pilot comparing AAV2 and AAV2.7m8 at different doses to determine the optimal serotype and dose for high retinal expression with minimal adverse effects. Although there are many reports on the biodistribution and dosing of both vector serotypes, the biodistribution of subretinal AAV2.7m8 had not yet been described for the Brown Norway rat strain. Since vector tropism can vary per animal strain, we wanted to compare AAV2.7m8 to AAV2 in our specific animal model [48]. AAV2.7m8, developed through directed evolution to have higher tropism for the neural retina after intravitreal injection, successfully transduced the neural retina after subretinal injection [28]. However, expression remained limited to the bleb and surrounding area, contrary to a previous report of widespread expression after subretinal AAV2.7m8 delivery [49]. In contrast, subretinal delivery of AAV2 resulted in widespread expression across the fundus, despite previous reports of AAV2’s limited spread outside of the bleb [50, 51]. Based on these findings, we proceeded with subretinal injection of low-dose AAV2 to provide proof-of-concept, not only due to its fundus-wide expression in our pilot, but also because the clinically approved voretigene neparvovec-rzyl uses the same serotype, which could expedite the clinical approval process [31].
A preservation in morphology could be seen after LRAT gene supplementation in Lrat–/– rats. We observed more photoreceptor nuclei and improved cone outer segments (both in number and morphology) compared to untreated Lrat–/– rats, although the strength of these conclusions is limited due to the low number of animals included in these analyses. Moreover, the effect of the therapy on overall retinal thickness was minimal, as revealed by the in vivo OCT scans. A longer study duration could have revealed bigger differences in the retinal thickness between treated and untreated eyes. Notably, retinal thickness in hLRAT-treated rats remained at WT levels only in the area closest to the injection site, suggesting a location-dependent effect. This occurred despite our findings that the transgene is expressed across the entire retina, implying that the expression levels outside the bleb may be insufficient in the target tissue. Other studies have reported similar morphological improvements exclusively in and around the bleb after subretinal gene delivery, but also found the gene expression to be limited to this site [52, 53].
Although healthy morphology is a prerequisite for functioning vision, we were ultimately more interested in functional improvements. LRAT-associated RP is unique in its presentation: functional vision worsens before cells start degenerating. This is because a lack of functional LRAT protein leads to a direct disruption of the visual cycle, causing vision loss. Hence, we believe that although our therapy can only prevent the progression of cell degeneration, we can still partially rescue functional vision by re-enabling the visual cycle in cells that are still viable. Indeed, one of the most striking results of the LRAT gene supplementation was the significant increase in b-wave amplitude and the normalization of implicit time. These findings suggest an improved ability to process visual signals, particularly in low-light conditions. Nonetheless, the a-wave remained absent in all animals, a finding also observed in other studies on ocular AAV-based therapy [54]. The improvement of the b-wave response without a clear improvement of the a-wave suggests that the rods, though impaired, retain sufficient function for the bipolar cells to respond. The lack of a healthy a-wave response may be caused by an underdevelopment of the (mature) rod photoreceptor outer segments responsible for the a-wave in scotopic conditions [54,55,56]. We currently inject at 5 weeks of age, as no significant retinal atrophy was present in the Lrat–/– rats at this age; however, other studies have injected the animals at earlier time points, which could be a viable strategy for future studies with Lrat–/– rats [54, 57]. The changes in vision-based behavior of the LRAT-treated rats also suggested improved functional vision, although the light/dark-box test can only assess the ability to differentiate between light and dark and cannot assess visual acuity or color perception. Moreover, the light/dark-box test is prone to confounding environmental factors such as differences in odor and habituation effects. In future studies, a more quantitative approach, such as the optomotor response assay, would provide us with stronger and more reproducible data.
A limitation of this study was the sample size, which reduced statistical power. Additionally, eye tissue is fragile, and sectioning often results in folds, tears, and/or separation of layers during processing, affecting the available samples in both the nuclei counts and the immunohistochemistry stainings (Supplementary Table 1). Furthermore, OCT segmentation was complicated by issues with lower-quality scans or scans with abnormal events such as bleeding, as well as the lack of software optimized for rodent OCT scans. An optimized segmentation program for rodents would provide us with greater sensitivity in future analyses. Additionally, including biochemical analyses of retinoid metabolism in our future studies would provide direct confirmation of visual cycle restoration, which currently could only be inferred from secondary outcomes. Nonetheless, the observed trends indicated functional improvement and structural preservation in treated eyes compared to untreated eyes, albeit with variability.
A possible reason for this variability is the occurrence of inflammation, which may be caused by the AAV [58, 59]. The suitability of AAVs as gene delivery vectors remains a topic of debate among researchers, as AAVs can induce an immune response [60, 61]. Previous trials in both animals and humans have shown that excessive inflammation caused by AAV-mediated gene therapy can reduce the treatment’s effectiveness and potentially harm the patient [62]. Lowering the AAV dose and making the therapy more cell-specific can circumvent these issues. The RPE is especially sensitive to high doses of AAV [63].
Additionally, the treatment was administered via the invasive technique of subretinal injection. Subretinal injections are the current standard for gene therapies that target the photoreceptors and/or RPE, but are challenging in small rat eyes and can lead to complications [64]. In the present study, we observed intravitreal or subretinal hemorrhaging after injection in ~40% of animals (Supplementary Table 1), which could contribute to the variation in the treatment group. Although it is common to remove eyes with hemorrhaging from further analysis [65,66,67], we retained these samples to preserve the sample size. Subretinal injection has a lower complication rate in human eyes, and surgical risk may further decline with the development of robot-assisted subretinal injections [68, 69]. While the less invasive intravitreal injection is easier to perform, it does not result in efficient transduction of the inner retina and has been associated with higher inflammation due to lower immunoprivilege [70,71,72].
We designed the therapy presented in this study following the same gene supplementation strategy as voretigene neparvovec-rzyl because of the similarities between the RPE65 and LRAT genes and their associated retinal dystrophies. Since the beginning of this study, multiple cases of retinal atrophy in patients who received voretigene neparvovec-rzyl have been reported, though significant improvements in vision were maintained [33, 34]. We did not initially anticipate these outcomes and did not include specific inflammation or atrophy assessments in the study. In our current dataset, we did not observe significant inflammation or adverse effects on OCT, except for transient hemorrhaging, which resolved by week 3 post-injection. Small areas of retinal degeneration or disorganization were identified on pathology sections (Supplementary Fig. 4). The cause of these changes could not be determined, as we only included Lrat–/– rats treated with AAV2-hLRAT and AAV2-GFP in this analysis, without sham-treated or untreated controls. The degeneration may stem from the Lrat–/– phenotype itself or from mechanical stress caused by the subretinal injection [66]. No widespread areas of atrophy were found. However, our follow-up period was only 2 months, while clinical atrophy is typically observed after 4-5 months [34, 73]. On longer follow-up, we may observe similar areas of severe atrophy. We therefore plan to extend the follow-up in future studies to assess potential late-onset adverse effects. The therapy may also be improved by making it more cell-specific, for example, by using an RPE-specific promoter instead of a ubiquitous promoter, or by using a more RPE-specific AAV serotype.
In conclusion, while LRAT gene supplementation had variable effects on retinal morphology, it consistently improved visual function. Considering the absence of treatments for LRAT-associated RP patients, and the inevitable outcome being marked vision loss, the results of the current study encourage the advancement of LRAT gene supplementation therapy toward clinical application. Nevertheless, modifying various aspects of the therapy will likely be necessary to ensure long-term safety and efficacy for the AAV-associated LRAT gene supplementation therapy.
Data availability
Raw data are available upon reasonable request to the corresponding author.
Code availability
The code used for statistical analyses is available upon request. The code used for ERG data processing is not currently publicly accessible due to ongoing development, but we are open to providing access for collaborative research.
References
-
Karuntu JS, Almushattat H, Nguyen XTA, Plomp AS, Wanders RJA, Hoyng CB, et al. Syndromic retinitis pigmentosa. Prog Retin Eye Res. 2024;107:101324.
-
Verbakel SK, van Huet RAC, Boon CJF, den Hollander AI, Collin RWJ, Klaver CCW, et al. Non-syndromic retinitis pigmentosa. Prog Retin Eye Res. 2018;66:157–86.
-
Murro V, Banfi S, Testa F, Iarossi G, Falsini B, Sodi A, et al. A multidisciplinary approach to inherited retinal dystrophies from diagnosis to initial care: a narrative review with inputs from clinical practice. Orphanet J Rare Dis. 2023;18:223.
-
Kaur G, Singh NK. Inflammation and retinal degenerative diseases. Neural Regen Res. 2023;18:513–8.
-
Ala-Laurila P, Kolesnikov AV, Crouch RK, Tsina E, Shukolyukov SA, Govardovskii VI, et al. Visual cycle: dependence of retinol production and removal on photoproduct decay and cell morphology. J Gen Physiol. 2006;128:153–69.
-
Choi EH, Daruwalla A, Suh S, Leinonen H, Palczewski K. Retinoids in the visual cycle: role of the retinal G protein-coupled receptor. J Lipid Res. 2021;62:100040.
-
Molday RS, Moritz OL. Photoreceptors at a glance. J Cell Sci. 2015;128:4039–45.
-
Tsin A, Betts-Obregon B, Grigsby J. Visual cycle proteins: structure, function, and roles in human retinal disease. J Biol Chem. 2018;293:13016–21.
-
Kiser PD, Golczak M, Maeda A, Palczewski K. Key enzymes of the retinoid (visual) cycle in vertebrate retina. Biochim Biophys Acta. 2012;1821:137–51.
-
Daiger SP, Sullivan LS. RetNet: summaries of genes and loci causing retinal diseases. Am J Hum Genet 2025;112:2253–65.
-
Daiger SP, Sullivan LS, Bowne SJ. Genes and mutations causing retinitis pigmentosa: genes and mutations causing retinitis pigmentosa. Clin Genet. 2013;84:132–41.
-
Ruiz A, Kuehn MH, Andorf JL, Stone E, Hageman GS, Bok D. Genomic organization and mutation analysis of the gene encoding lecithin retinol acyltransferase in human retinal pigment epithelium. Investig Ophthalmol Vis Sci. 2001;42:31–7.
-
Ruiz A, Winston A, Lim YH, Gilbert BA, Rando RR, Bok D. Molecular and biochemical characterization of lecithin retinol acyltransferase. J Biol Chem. 1999;274:3834–41.
-
Den Hollander AI, Roepman R, Koenekoop RK, Cremers FPM. Leber congenital amaurosis: genes, proteins and disease mechanisms. Prog Retin Eye Res. 2008;27:391–419.
-
Den Hollander AI, Lopez I, Yzer S, Zonneveld MN, Janssen IM, Strom TM, et al. Identification of novel mutations in patients with Leber congenital amaurosis and juvenile RP by genome-wide homozygosity mapping with SNP microarrays. Investig Ophthalmol Vis Sci. 2007;48:5690–8.
-
Talib M, van Schooneveld MJ, van Duuren RJG, Van Cauwenbergh C, Ten Brink JB, De Baere E, et al. Long-term follow-up of retinal degenerations associated with LRAT mutations and their comparability to phenotypes associated with RPE65 mutations. Transl Vis Sci Technol. 2019;8:24.
-
Dev Borman A, Ocaka LA, Mackay DS, Ripamonti C, Henderson RH, Moradi P, et al. Early-onset retinal dystrophy due to mutations in LRAT: molecular analysis and detailed phenotypic study. Investig Ophthalmol Vis Sci. 2012;53:3927.
-
Thompson DA, Li Y, McHenry CL, Carlson TJ, Ding X, Sieving PA, et al. Mutations in the gene encoding lecithin retinol acyltransferase are associated with early-onset severe retinal dystrophy. Nat Genet. 2001;28:123–4.
-
Batten ML, Imanishi Y, Tu DC, Doan T, Zhu L, Pang J, et al. Pharmacological and rAAV gene therapy rescue of visual functions in a blind mouse model of Leber congenital amaurosis. PLoS Med. 2005;2:e333.
-
Koster C, van den Hurk KT, Lewallen CF, Talib M, Ten Brink JB, Boon CJF, et al. The Lrat-/- rat: CRISPR/Cas9 construction and phenotyping of a new animal model for retinitis pigmentosa. Int J Mol Sci. 2021;22:7234.
-
Littink KW, Van Genderen MM, Van Schooneveld MJ, Visser L, Riemslag FCC, Keunen JEE, et al. A homozygous frameshift mutation in LRAT causes retinitis punctata albescens. Ophthalmology. 2012;119:1899–906.
-
Bulcha JT, Wang Y, Ma H, Tai PWL, Gao G. Viral vector platforms within the gene therapy landscape. Signal Transduct Target Ther. 2021;6:53.
-
Ronzitti G, Gross DA, Mingozzi F. Human immune responses to adeno-associated virus (AAV) vectors. Front Immunol. 2020;11. Available from: https://www.frontiersin.org/articles/10.3389/fimmu.2020.00670.
-
Ghoraba HH, Akhavanrezayat A, Karaca I, Yavari N, Lajevardi S, Hwang J, et al. Ocular Gene therapy: a literature review with special focus on immune and inflammatory responses. Clin Ophthalmol Auckl NZ. 2022;16:1753–71.
-
Auricchio A, Kobinger G, Anand V, Hildinger M, O’Connor E, Maguire AM, et al. Exchange of surface proteins impacts on viral vector cellular specificity and transduction characteristics: the retina as a model. Hum Mol Genet. 2001;10:3075–81.
-
Allocca M, Mussolino C, Garcia-Hoyos M, Sanges D, Iodice C, Petrillo M, et al. Novel adeno-associated virus serotypes efficiently transduce murine photoreceptors. J Virol. 2007;81:11372–80.
-
Han IC, Cheng JL, Burnight ER, Ralston CL, Fick JL, Thomsen GJ, et al. Retinal tropism and transduction of adeno-associated virus varies by serotype and route of delivery (intravitreal, subretinal, or suprachoroidal) in rats. Hum Gene Ther. 2020;31:1288–99.
-
Dalkara D, Byrne LC, Klimczak RR, Visel M, Yin L, Merigan WH, et al. In vivo–directed evolution of a new adeno-associated virus for therapeutic outer retinal gene delivery from the vitreous. Sci Transl Med. 2013;5. Available from: https://www.science.org/doi/10.1126/scitranslmed.3005708.
-
Taylor AW. Ocular immune privilege. Eye. 2009;23:1885–9.
-
Maguire AM, Russell S, Chung DC, Yu ZF, Tillman A, Drack AV, et al. Durability of voretigene neparvovec for biallelic RPE65-mediated inherited retinal disease: phase 3 results at 3 and 4 years. Ophthalmology. 2021;128:1460–8.
-
Maguire AM, Russell S, Wellman JA, Chung DC, Yu ZF, Tillman A, et al. Efficacy, safety, and durability of voretigene neparvovec-rzyl in RPE65 mutation-associated inherited retinal dystrophy: results of phase 1 and 3 trials. Ophthalmology. 2019;126:1273–85.
-
Russell S, Bennett J, Wellman JA, Chung DC, Yu ZF, Tillman A, et al. Efficacy and safety of voretigene neparvovec (AAV2-hRPE65v2) in patients with RPE65-mediated inherited retinal dystrophy: a randomised, controlled, open-label, phase 3 trial. Lancet Lond Engl. 2017;390:849–60.
-
Reichel FF, Seitz I, Wozar F, Dimopoulos S, Jung R, Kempf M, et al. Development of retinal atrophy after subretinal gene therapy with voretigene neparvovec. Br J Ophthalmol. 2023;107:1331–5.
-
Gange WS, Sisk RA, Besirli CG, Lee TC, Havunjian M, Schwartz H, et al. Perifoveal chorioretinal atrophy after subretinal voretigene neparvovec-rzyl for RPE65-mediated Leber congenital amaurosis. Ophthalmol Retina. 2022;6:58–64.
-
National Centre for the Replacement, Refinement & Reduction of Animals in Research. Experimental Design Assistant. Available from: https://eda.nc3rs.org.uk/experimental-design-group.
-
Cardiff RD, Miller CH, Munn RJ. Manual hematoxylin and eosin staining of mouse tissue sections. Cold Spring Harb Protoc. 2014;2014:655–8.
-
Bankhead P, Loughrey MB, Fernández JA, Dombrowski Y, McArt DG, Dunne PD, et al. QuPath: open source software for digital pathology image analysis. Sci Rep. 2017;7:16878.
-
Burke J, Engelmann J, Gibbon S, Hamid C, Moukaddem D, Pugh D, et al. OCTolyzer: fully automatic toolkit for segmentation and feature extraction in optical coherence tomography and scanning laser ophthalmoscopy data. Preprint at https://doi.org/10.48550/arXiv.2407.14128 2024.
-
Schindelin J, Arganda-Carreras I, Frise E, Kaynig V, Longair M, Pietzsch T, et al. Fiji: an open-source platform for biological-image analysis. Nat Methods. 2012;9:676–82.
-
Core R. Team. R: A language and environment for statistical computing. R Core Team. 2021.
-
signal developers. signal: signal processing. 2014. Available from: http://r-forge.r-project.org/projects/signal/.
-
Wickham H, Averick M, Bryan J, Chang W, McGowan L, François R, et al. Welcome to the tidyverse. J Open Source Softw. 2019;4:1686.
-
L’Abbate D, Prescott K, Geraghty B, Kearns VR, Steel DHW. Biomechanical considerations for optimising subretinal injections. Surv Ophthalmol. 2024;69:722–32.
-
Hermes B, Reuss S, Vollrath L. Strain differences in the ratio of synaptic body types in photoreceptors of the rat retina. Vision Res. 1993;33:2427–30.
-
Jacobs GH, Fenwick JA, Williams GA. Cone-based vision of rats for ultraviolet and visible lights. J Exp Biol. 2001;204:2439–46.
-
Rohrer B, Lohr HR, Humphries P, Redmond TM, Seeliger MW, Crouch RK. Cone opsin mislocalization in Rpe65−/− mice: a defect that can be corrected by 11-cis retinal. Investig Ophthalmol Vis Sci. 2005;46:3876.
-
Bourin M, Hascoët M. The mouse light/dark box test. Eur J Pharmacol. 2003;463:55–65.
-
He T, Itano MS, Earley LF, Hall NE, Riddick N, Samulski RJ, et al. The influence of murine genetic background in adeno-associated virus transduction of the mouse brain. Hum Genet Ther Clin Dev. 2019;30:169–81.
-
Khabou H, Desrosiers M, Winckler C, Fouquet S, Auregan G, Bemelmans A, et al. Insight into the mechanisms of enhanced retinal transduction by the engineered AAV2 capsid variant -7m8. Biotechnol Bioeng. 2016;113:2712–24.
-
Carroll L, Uehara H, Zhang X, Ambati B. Tropism of the novel AAVBR1 capsid following subretinal delivery. Int J Mol Sci. 2022;23:7738.
-
Carvalho LS, Xiao R, Wassmer SJ, Langsdorf A, Zinn E, Pacouret S, et al. Synthetic adeno-associated viral vector efficiently targets mouse and nonhuman primate retina in vivo. Hum Gene Ther. 2018;29:771–84.
-
Hsu Y, Bhattarai S, Thompson JM, Mahoney A, Thomas J, Mayer SK, et al. Subretinal gene therapy delays vision loss in a Bardet-Biedl syndrome type 10 mouse model. Mol Ther Nucleic Acids. 2023;31:164–81.
-
Boye SE, Alexander JJ, Witherspoon CD, Boye SL, Peterson JJ, Clark ME, et al. Highly efficient delivery of adeno-associated viral vectors to the primate retina. Hum Gene Ther. 2016;27:580–97.
-
Pang Jjing, Boye SL, Kumar A, Dinculescu A, Deng W, Li J, et al. AAV-mediated gene therapy for retinal degeneration in the rd10 mouse containing a recessive PDEβ mutation. Investig Ophthalmol Vis Sci. 2008;49:4278.
-
Chang B, Hawes NL, Pardue MT, German AM, Hurd RE, Davisson MT, et al. Two mouse retinal degenerations caused by missense mutations in the β-subunit of rod cGMP phosphodiesterase gene. Vision Res. 2007;47:624–33.
-
Bhatt Y, Hunt DM, Carvalho LS. The origins of the full-field flash electroretinogram b-wave. Front Mol Neurosci. 2023;16:1153934.
-
Lau D, McGee LH, Zhou S, Rendahl KG, Manning WC, Escobedo JA, et al. Retinal degeneration is slowed in transgenic rats by AAV-mediated delivery of FGF-2. Investig Ophthalmol Vis Sci. 2000;41:3622–33.
-
Ertl HCJ. Immunogenicity and toxicity of AAV gene therapy. Front Immunol. 2022;13:975803.
-
Bucher K, Rodríguez-Bocanegra E, Dauletbekov D, Fischer MD. Immune responses to retinal gene therapy using adeno-associated viral vectors – Implications for treatment success and safety. Prog Retin Eye Res. 2021;83:100915.
-
Sobh M, Lagali PS, Ghiasi M, Montroy J, Dollin M, Hurley B, et al. Safety and Efficacy of adeno-associated viral gene therapy in patients with retinal degeneration: a systematic review and meta-analysis. Transl Vis Sci Technol. 2023;12:24.
-
Venditti CP. Safety questions for AAV gene therapy. Nat Biotechnol. 2021;39:24–6.
-
Suoranta T, Laham-Karam N, Ylä-Herttuala S. Strategies to improve the safety profile of AAV vectors. Front Mol Med. 2022;2. Available from: https://www.frontiersin.org/articles/10.3389/fmmed.2022.1054069.
-
Xiong W, Wu DM, Xue Y, Wang SK, Chung MJ, Ji X, et al. AAV cis-regulatory sequences are correlated with ocular toxicity. Proc Natl Acad Sci USA. 2019;116:5785–94.
-
Westenskow PD, Kurihara T, Bravo S, Feitelberg D, Sedillo ZA, Aguilar E, et al. Performing subretinal injections in rodents to deliver retinal pigment epithelium cells in suspension. J Vis Exp. 2015;95:52247.
-
Hassan S, Hsu Y, Thompson JM, Kalmanek E, VandeLune JA, Stanley S, et al. The dose-response relationship of subretinal gene therapy with rAAV2tYF-CB-hRS1 in a mouse model of X-linked retinoschisis. Front Med. 2024;11:1304819.
-
Qi Y, Dai X, Zhang H, He Y, Zhang Y, Han J, et al. Trans-corneal subretinal injection in mice and its effect on the function and morphology of the retina. PloS One. 2015;10:e0136523.
-
Koponen S, Kokki E, Tamminen T, Ylä-Herttuala S. AAV2 and AAV9 tropism and transgene expression in the mouse eye and major tissues after intravitreal and subretinal delivery. Front Drug Deliv. 2023;3:1148795.
-
Yang K, Jin X, Wang Z, Fang Y, Li Z, Yang Z, et al. Robot-assisted subretinal injection system: development and preliminary verification. BMC Ophthalmol. 2022;22:484.
-
Łajczak PM, Nawrat Z. Sharper vision, steady hands: can robots improve subretinal drug delivery? Systematic review. J Robot Surg. 2024;18:235.
-
Yiu G, Chung SH, Mollhoff IN, Nguyen UT, Thomasy SM, Yoo J, et al. Suprachoroidal and subretinal injections of AAV using transscleral microneedles for retinal gene delivery in nonhuman primates. Mol Ther Methods Clin Dev. 2020;16:179–91.
-
Reichel FF, Peters T, Wilhelm B, Biel M, Ueffing M, Wissinger B, et al. Humoral immune response after intravitreal but not after subretinal AAV8 in primates and patients. Investig Ophthalmol Vis Sci. 2018;59:1910.
-
Seitz IP, Michalakis S, Wilhelm B, Reichel FF, Ochakovski GA, Zrenner E, et al. Superior retinal gene transfer and biodistribution profile of subretinal versus intravitreal delivery of AAV8 in nonhuman primates. Investig Ophthalmol Vis Sci. 2017;58:5792.
-
Daruich A, Rateaux M, Batté E, De Vergnes N, Valleix S, Robert MP, et al. 12-month outcomes after voretigene neparvovec gene therapy in paediatric patients with RPE65-mediated inherited retinal dystrophy. Br J Ophthalmol. 2025;109:281–5.
Acknowledgements
We gratefully acknowledge the late Arthur Bergen for his indispensable contributions in conceptualizing and supporting this study. This study was performed as part of a collaboration within the European Reference Network for Rare Eye Diseases (ERN-EYE). ERN-EYE is cofunded by the Health Program of the European Union under the Framework Partnership Agreement #739543—“ERN-EYE” and cofunded by the Hôpitaux Universitaires de Strasbourg. CJFB is a member of ERN-EYE. CJFB and CK are also supported by LifeLongVision, funded by the Ministry of Education, Culture and Science of the Netherlands, Gravitation grant 024.006.034. Furthermore, we thank Anne Fleur van Groningen for preparing the cryostat eye sections of the AAV pilot study.
Funding
This project was funded by Health Holland (PPP grant number AMR-23645).
Ethics declarations
Competing interests
The authors declare no competing interests.
Ethical approval
We conducted all animal experiments in accordance with the ARVO Statement for the Use of Animals in Ophthalmic and Vision Research, and they were approved by the Netherlands’ national committee and the animal welfare body of the Amsterdam UMC (license number AVD11400202011085, protocol number SP2400053).
Additional information
Publisher’s note Springer Nature remains neutral with regard to jurisdictional claims in published maps and institutional affiliations.
Supplementary information
Rights and permissions
Springer Nature or its licensor (e.g. a society or other partner) holds exclusive rights to this article under a publishing agreement with the author(s) or other rightsholder(s); author self-archiving of the accepted manuscript version of this article is solely governed by the terms of such publishing agreement and applicable law.
About this article

Cite this article
El-Kalaani, A.M., Ten Brink, J.B., Boon, C.J.F. et al. AAV-mediated gene replacement therapy for LRAT-associated retinitis pigmentosa: a proof-of-concept study in a patient-based rat model. Gene Ther (2026). https://doi.org/10.1038/s41434-026-00601-9
-
Received:
-
Revised:
-
Accepted:
-
Published:
-
Version of record:
-
DOI: https://doi.org/10.1038/s41434-026-00601-9