Introduction
Breast cancer remains one of the leading causes of cancer-related mortality among women globally, with brain metastasis significantly worsening patient prognosis. Brain metastatic breast cancer (BMBC) presents unique challenges, particularly due to the phenomenon of metastatic dormancy, where disseminated tumor cells (DTCs) enter a quiescent state, evading therapeutic interventions and potentially leading to late relapse1. Dormancy is characterized by the persistence of cancer cells in a non-proliferative but viable state. These dormant cells exhibit remarkable plasticity, allowing them to adapt to various microenvironments, survive therapeutic stress, and resist conventional and targeted therapies2,3,4. The resistance of dormant cells to treatment is largely due to their non-cycling nature, as most cytotoxic therapies target rapidly dividing cells5. Understanding the mechanisms underlying dormancy-associated resistance to treatment is crucial for developing more effective treatments.
DTCs can be maintained either as independent dormant cells—a state known as cellular dormancy—or as small clusters of cells where a balance between proliferation and cell death leads to a constant tumor size, referred to as tumor mass dormancy6. These DTCs can form micrometastatic lesions whose size does not increase due to this equilibrium, allowing the tumor to remain undetected and exhibit resistance to therapies targeting rapidly dividing cells. Dormancy in the micrometastasis is influenced by several factors, such as alterations in the extracellular matrix (ECM) and signaling pathways such as p38 and ERK, which regulate the balance between dormancy and proliferation7,8. ECM, a major component of the tumor microenvironment (TME), differs significantly between brain and breast tissues9. These differences in ECM composition and structure can profoundly affect the behavior of dormant micrometastasis. These interactions not only influence their survival but also determine their eventual reactivation and proliferation under specific microenvironmental conditions. In the context of dormancy, the biophysical and biochemical characteristics of the ECM—such as stiffness and cell-scaffold interactions—are critical in maintaining the dormant state10. Consequently, studying ECM-induced dormancy has become a significant area of interest. While traditional in vivo models have provided valuable insights into the mechanisms of BMBC and dormancy, they often lack the ability to precisely tune the TME. This limitation, coupled with the significant challenge of BMBC resistance to therapy, underscores the need for in vitro models to investigate the effects of drugs on dormant BMBC micrometastasis and elucidate the mechanisms underlying their responses.
Dormant cancer cells resist drugs through a complex interplay of cellular adaptations, microenvironmental influences, and molecular mechanisms. Known mechanisms of drug resistance in cancer cells include: failure of cytotoxic therapies designed to target proliferative cells to affect dormant cells4; engagement with the ECM activating integrin signaling pathways that promote survival11; maintenance of cells in dormancy enhancing their ability to withstand stress12; and elevated efflux of chemotherapeutic drugs from cancer cells leading to lower drug accumulation13. However, the specific mechanisms through which this resistance is sustained in the context of dormant BMBC require further investigation. Understanding the mechanisms of drug resistance associated with ECM-induced dormancy could potentially benefit the development of effective therapies for BMBC.
To this end, Kondapaneni et al., previously demonstrated that a biomimetic hyaluronan (HA) hydrogel model induced dormancy in BMBC spheroids, while a free suspension culture promoted proliferation14. However, the ability of the model to study dormancy-associated drug resistance and the associated mechanisms was not explored. In this study, we aimed to address this gap by comparing the drug response of dormant and proliferating three-dimensional (3D) BMBC spheroids, wherein we hypothesized that HA hydrogel-induced dormant spheroids would exhibit resistance to therapy compared to proliferative spheroids cultured in suspension. We employed Paclitaxel (PTX) as a chemotherapy (for the triple negative breast cancer subtype) and Lapatinib (LAP) as a targeted therapy (for the human epidermal growth factor receptor 2 (HER2) subtype)15,16,17. We evaluated cell proliferation and apoptosis, as well as the percentage of cells positive for phosphorylated-ERK and phosphorylated-p38 in BMBC spheroids following drug treatment. Additionally, we investigated if modulating the culture environment reverses therapy response in BMBC spheroids. Finally, we focused on the p38 signaling pathway, which has been linked to both dormancy and drug resistance18,19, to assess its role in modulating drug responses in dormant spheroids.
Results
Morphological characterization of spheroids on HA hydrogel and suspension culture in response to treatment
BMBC cell spheroids were prepared and treated for 72 h in suspension culture to determine cell viability as a function of drug concentration. Drug concentrations ranging from 25 nM to 50 µM were tested for PTX for the MDA-MB-231Br cell line (Fig. S1), while LAP at concentrations from 10 to 5000 nM was tested for the BT474Br3 cell line (Fig. S2). The lowest concentration for both the drugs at which cell viability was reduced to <~60% was determined to be ~50 nM. We chose this concentration to examine changes in response to treatment in suspension culture vs. the HA hydrogel condition. Specifically, we cultured MDA-MB-231Br or BT474Br3 BMBC spheroids in two different microenvironments: suspension culture, where the spheroid was freely suspended in the culture media, known to induce proliferation, and on top of a biomimetic HA hydrogel known to induce dormancy14. After 2 days of culture in their respective microenvironments, MDA-MB-231Br and BT474Br3 spheroids were exposed to PTX or LAP treatment (50 nM) for 72 h, respectively.
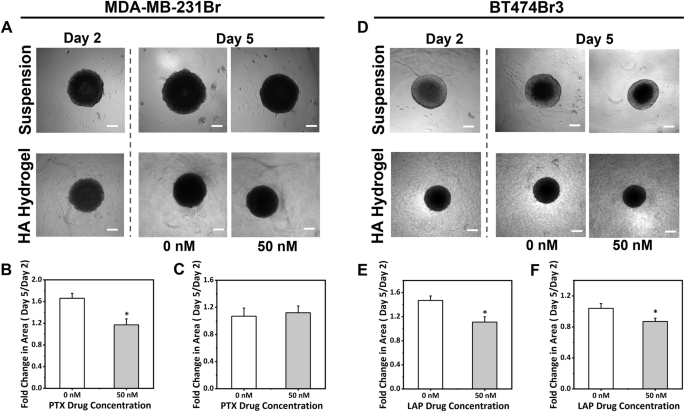
Morphological changes were quantified via cross-sectional area measurements. For MDA-MB-231Br spheroids, it was observed that the microenvironment influenced response to therapy. Particularly, in suspension culture, the control group showed a fold change in area of 1.7 ± 0.09, whereas the treated group had a fold change in area of 1.2 ± 0.1 (Fig. 1). This significant difference between the control and treated samples demonstrates that the spheroid growth was impacted by PTX treatment in suspension culture. However, for the spheroid cultured on the HA hydrogel, there was no significant change between the control and treated samples, as the recorded fold change in area were found to be 1.1 ± 0.1 and 1.1 ± 0.08 for control and treated conditions respectively (Fig. 1). In the case of BT474Br3 spheroids, the trend for the suspension culture condition was similar, with the fold change in area calculated to be 1.5 ± 0.07 for the control group and 1.1 ± 0.09 for the LAP treated group (Fig. 1). However, for BT474Br3 spheroid on the HA hydrogel, there was also a significant difference between the control and treated samples with fold change in area recorded to be 1.1 ± 0.06 and 0.9 ± 0.04, respectively (Fig. 1). However, the differences were higher in suspension conditions in comparison to hydrogel condition. Overall, these results using cross-sectional area measurements indicated that BMBC spheroids responded better to treatment in suspension cultures as opposed to those cultured on the HA hydrogel.

Bright-field images of A MDA-MB-231Br and D BT474Br3 spheroids. Scale bar = 200 µm. Fold change in cross-sectional area upon treatment with PTX for MDA-MB-231Br spheroid in B suspension culture and on C HA hydrogel or with LAP for BT474Br3 spheroid in E suspension culture and on F HA hydrogel. Each condition has N ≥ 12 replicates. Statistical significance (p < 0.05) indicated by * from Student’s t-test. Data are presented as mean ± standard error.
Cell proliferation in BMBC spheroids on HA hydrogel and suspension culture in response to treatment
As there were differences in the cross-sectional area of spheroids post-treatment in suspension culture vs. HA hydrogel, we sought to measure cell proliferation via the EdU assay, which is commonly used to detect proliferating cells20. For MDA-MB-231Br spheroid in suspension culture, the percentage of EdU-positive cells was 37.3 ± 2.9% for the control group and 23.9 ± 3.5% for the treated group. For MDA-MB-231Br spheroid on the HÀ hydrogel, the percentage of EdU-positive cells was 9.2 ± 1.3% and 8.6 ± 1.8%, respectively, for the control and treated groups (Fig. 2). For BT474Br3 spheroid in suspension culture, the percentage of EdU-positive cells was 26.9 ± 1.9% for the control group and 12.3 ± 2.7% for the treated group. For BT474Br3 spheroid on the HA hydrogel, the values were 9.7 ± 1.3% and 8.6 ± 1.7%, respectively, for the control and treated groups (Fig. 2). Proliferation levels were significantly higher in suspension-cultured spheroids than those on HA hydrogels, indicating HA hydrogel-induced dormancy. Moreover, treatment markedly reduced the percentage of proliferating cells in suspension cultures compared to their controls, whereas spheroids on HA hydrogels showed no significant change in proliferation upon treatment.

A Representative fluorescent image of EdU staining for MDA-MB-231Br cells, blue—DAPI (nucleus), green—EdU. Quantification of EdU-positive cells in MDA-MB-231Br spheroids in B suspension culture and on C HA hydrogel. D Representative fluorescent images of EdU staining for BT474Br3 cells, blue—DAPI (nucleus), green—EdU. Quantification of EdU-positive cells in BT474Br3 spheroids in E suspension culture and on F HA hydrogel. Scale bar = 100 µm. Each condition has N ≥ 6 replicates. Statistical significance (p < 0.05) indicated by * from Student’s t-test. Data are presented as mean ± standard error.
To corroborate EdU data, Ki67 immunostaining was performed, and the percentage of Ki67-positive cells was quantified. Ki67 is one of the most widely used markers of proliferation in oncology since detectable levels of Ki67 are present during the G1, S, G2, and M cell cycle phases and are down-regulated when cells exit the cell cycle and enter quiescence (G0 phase)21,22. The microenvironment significantly influenced the number of proliferating cells post-treatment for both cell lines. For MDA-MB-231Br spheroid in suspension culture, the percentage of Ki67-positive cells was 33.3 ± 2.0% for the control group and 17.8 ± 2.3% for the treated group. In contrast, for the MDA-MB-231Br spheroid on the HA hydrogel, the percentage of Ki67-positive cells was 7.1 ± 1.8% for the control group and 7.8 ± 1.2% for the treated group (Fig. S3). Similarly, for BT474Br3 spheroid in suspension culture, the percentage of Ki67-positive cells was 11.8 ± 1.1% for the control group and 5.7 ± 1.3% for the treated group. In contrast, for the BT474Br3 spheroid on the HA hydrogel, the percentage of proliferating cells was 4.4 ± 1.3% for the control group and 4.6 ± 2.2% for the treated group (Fig. S4). These results further corroborated the EdU data, suggesting that proliferating spheroids were responsive to treatment as opposed to dormant spheroids, which were non-responsive.
Cell Apoptosis in BMBC spheroids on HA hydrogel and suspension culture in response to treatment
To detect the percentage of apoptotic cells in response to treatment, we employed the standard Annexin V apoptosis assay23. Our results indicated a significant difference in apoptosis levels between the control and treated groups in the suspension culture condition. For MDA-MB-231Br spheroid in suspension culture, the percentage of Annexin V positive cells was 10.1 ± 1.6% in the control group and 18.7 ± 2.4% in the treated group. In contrast, for the MDA-MB-231Br spheroid on the HA hydrogel, the values were 9.7 ± 1.7% and 8.9 ± 1.1% for the control and treated groups, respectively (Fig. 3). A similar trend was observed for BT474Br3 spheroids. In particular, for BT474Br3 spheroid in suspension culture, the percentage of Annexin V positive cells was 3.5 ± 0.8% in the control group and 5.9 ± 1.2% in the treated group. On the HA hydrogel, these values were 6.3 ± 1.3% and 6.8 ± 1.6% for the control and treated groups, respectively (Fig. 3). Thus, for both cell lines, there was a significant increase in the percentage of apoptotic cells upon treatment in the suspension culture, whereas no significant difference was observed in the HA hydrogel. This suggests that the microenvironment plays a crucial role in the apoptotic response of BMBC spheroids to treatment.

A Representative fluorescent images of Annexin V staining for MDA-MB-231Br cells, blue—DAPI (nucleus), green—Annexin V. Quantification of Annexin V positive cells in MDA-MB-231Br spheroids in B suspension culture and on C HA hydrogel. D Representative fluorescent images of Annexin V staining for BT474Br3 cells, blue—DAPI (nucleus), green—Annexin V. Quantification of Annexin V positive cells in BT474Br3 spheroids in E suspension culture and on F HA hydrogel. Scale bar = 100 µm. Each condition has N ≥ 6 replicates. Statistical significance (p < 0.05) indicated by * from Student’s t-test. Data are presented as mean ± standard error.
Percentage of p-ERK and p-p38 positive cells on HA hydrogel and suspension culture in response to treatment
Prior work has highlighted the involvement of the p38 mitogen-activated protein kinase (MAPK) pathway in cell stress and apoptosis, while the ERK/MAPK pathway is crucial for cell proliferation and differentiation, playing a significant role in cellular signaling24. To investigate the effect of drug treatment on these MAPK pathways, we quantified the percentage of cells positive for p-ERK and p-p38 within the spheroids in both suspension and HA hydrogel conditions. Our findings revealed that the percentage of p-p38 positive cells was significantly higher in suspension culture upon drug treatment, whereas there was no significant difference in the HA hydrogel condition. Conversely, the percentage of p-ERK positive cells was significantly lower in suspension culture upon treatment, while no significant difference was observed in the HA hydrogel condition. In particular, for MDA-MB-231Br spheroid in suspension culture, the percentage of p-ERK positive cells was 25.2 ± 1.3% in the control group and 17.9 ± 3.3% in the treated group, while the percentage of p-p38 positive cells was 12.8 ± 1.4% in the control group and 18.2 ± 1.6% in the treated group (Figs. 4 and 5). In contrast, for MDA-MB-231Br spheroid cultured on the HA hydrogel, the percentage of p-ERK positive cells was 13.3 ± 2.3% in the control group and 12.5 ± 1.9% in the treated group, and the percentage of p-p38 positive cells was 31.5 ± 1.7% in the control group and 29.1 ± 2.6% in the treated group (Figs. 4 and 5). A similar trend was observed for BT474Br3 spheroids. In particular, for BT474Br3 spheroid in suspension culture, the percentage of p-ERK positive cells was 17.4 ± 2.2% in the control group and 12.2 ± 1.8% in the treated group, while the percentage of p-p38 positive cells was 11.1 ± 1.5% in the control group and 16.8 ± 2.0% in the treated group. For BT474Br3 spheroid cultured on HA hydrogel, the percentage of p-ERK positive cells was 14.3 ± 1.8% in the control group and 13.5 ± 2.2% in the treated group, while the percentage of p-p38 positive cells was 24.8 ± 3.0% in the control group and 23.9 ± 2.3% in the treated group. The ratio of p-ERK to p-p38 dictates the balance between dormancy vs. proliferation, wherein a high ratio of p-ERK to p-p38 indicates tumor growth and a low ratio indicates tumor growth arrest18. Lower mean ratios of percentage of p-ERK to p-p38 positive cells were observed in treated conditions for both MDA-MB-231Br and BT474Br3 cell spheroids in suspension culture. In contrast, these ratios remained unchanged for spheroids cultured on the HA hydrogel (Table 1). These findings indicate that the treatment resistance observed in HA hydrogels for both spheroid models is partially mediated by the ERK and p38 signaling pathways.

A Representative fluorescent image of p-ERK staining for MDA-MB-231Br cells, blue—DAPI (nucleus), green—p-ERK. Quantification of p-ERK positive cells in MDA-MB-231Br spheroids in B suspension culture and on C HA hydrogel. D Representative fluorescent images of p-ERK staining for BT474Br3 cells, blue—DAPI (nucleus), green—p-ERK. Quantification of p-ERK positive cells in BT474Br3 spheroids in E suspension culture and on F HA hydrogel. Scale bar = 100 µm. Each condition has N ≥ 6 replicates. Statistical significance (p < 0.05) indicated by * from the Student’s t-test. Data are presented as mean ± standard error.

A Representative fluorescent image of p-p38 staining for MDA-MB-231Br cells, blue- DAPI (nucleus), green- p-p38. Quantification of p-p38 positive cells in MDA-MB-231Br spheroids in B suspension culture and on C HA hydrogel. D Representative fluorescent images of p-p38 staining for BT474Br3 cells, blue—DAPI (nucleus), green—p-p38. Quantification of p-p38 positive cells present in BT474Br3 spheroids in E suspension culture and on F HA hydrogel. Scale bar = 100 µm. N ≥ 6 replicates for each condition. * Indicates statistical significance (p < 0.05) from Student’s t-test. Data presented as mean ± standard error of the mean.
Modulating the culture environment alters drug response
Dormancy in cancer cells is often reversible, allowing cells to reenter the cell cycle in response to physiological stimuli25. To assess whether dormant spheroids become responsive to treatment upon transfer from a dormancy-inducing environment to a proliferation-inducing environment, spheroids were grown on HA hydrogel for five days before being transferred to two different conditions: (1) from HA hydrogel to a scaffold-free system, and as a control (2) from HA hydrogel to another HA hydrogel. The spheroids were allowed to acclimate to their new environments for five additional days, followed by a 72-h drug treatment. Initially, the fold change in cross-sectional area upon treatment was recorded, showing a significant decrease in area for the treated group compared to the control group for MDA-MB-231Br spheroids (fold change in area of 1.4 ± 0.2 for control vs. 0.9 ± 0.1 for treated) (Fig. 6). Subsequently, to confirm the observed morphological changes, cell proliferation was assessed via EdU staining. It was found that post-transfer and treatment, the percentage of EdU-positive cells decreased significantly to 24.7 ± 2.6% for the treated group compared to 42.3 ± 3.1% in the control group (Fig. 6). Similarly, for BT474Br3 spheroids, a significant decrease in area for the treated group compared to the control group was noted (fold change in area of 1.4 ± 0.07 for control vs. 0.8 ± 0.08 for treated) (Fig. 7). Furthermore, upon EdU staining, it was found that post-transfer and treatment, the percentage of EdU-positive cells decreased significantly to 12.1 ± 2.1% for the treated group compared to 23.9 ± 2.7% in the control group (Fig. 7). Spheroids were also cultured on the HA hydrogels and transferred to newly prepared HA hydrogels for the control study. However, the fold change in area for the control and treated groups showed no significant changes (1.0 ± 0.05 for control vs. 1.1 ± 0.04 for treated group) in the case of MDA-MB-231Br spheroids (Fig. 6); whereas there was a slight but significant decrease for BT474Br3 spheroids (1.1 ± 0.07 for control and 0.9 ± 0.06 for the treated group) (Fig. 7). However, EdU staining revealed no significant change in cell proliferation post-transfer and treatment, with the percentage of EdU-positive cells being 10.2 ± 1.6% in the control group compared to 12.1 ± 2.2% in the treated group for MDA-MB-231Br spheroids (Fig. 6) and 11.9 ± 2.6% in the control group compared to 12.2 ± 1.8% in the treated group for BT474Br3 spheroids (Fig. 7). Overall, these results suggest that BMBC spheroids become responsive to treatment upon modulating the culture environment.

Representative bright field images of spheroids post transfer at day 5 and at day 8 with and without treatment for A HA hydrogel to suspension and E HA hydrogel to HA hydrogel. Scale bar = 200 µm. Fold change in area upon 72 h drug treatment for spheroids transferred from B HA hydrogel to suspension and F HA hydrogel to HA hydrogel. Representative fluorescent images of EdU staining for spheroids transferred from C HA hydrogel to suspension and G HA hydrogel to HA hydrogel, blue—DAPI (nucleus), green—EdU, scale bar = 100 µm. Quantification of EdU-positive cells present in spheroids transferred from D HA hydrogel to suspension and H HA hydrogel to HA hydrogel. N ≥ 6 replicates for each condition. * Indicates statistical significance (p < 0.05) from Student’s t-test. Data presented as mean ± standard error of the mean.

Representative bright field images of spheroids post transfer at day 5 and at day 8 with and without treatment for A HA hydrogel to suspension and E HA hydrogel to HA hydrogel. Scale bar = 200 µm. Fold change in area upon 72 h drug treatment for spheroids transferred from B HA hydrogel to suspension and F HA hydrogel to HA hydrogel. Representative fluorescent images of EdU staining for spheroids transferred from C HA hydrogel to suspension and G HA hydrogel to HA hydrogel, blue—DAPI (nucleus), green—EdU, Scale bar = 100 µm. Quantification of EdU-positive cells present in spheroids transferred from D HA hydrogel to suspension and H HA hydrogel to HA hydrogel. Each condition has N ≥ 6 replicates. Statistical significance (p < 0.05) indicated by * from Student’s t-test. Data are presented as mean ± standard error.
Inhibition of p38 pathway results in dormant-to-proliferative switch and response to therapy
Members of the MAPK family, such as p38 kinases, are stress-activated protein kinases that respond to environmental stresses and inflammatory signals, distinct from mitogen-activated ERK1 and ERK226. In breast cancer, p38 signaling has been linked to the induction of metastasis and chemoresistance, making it an intriguing target for cancer therapy27. To further test the involvement of p38 signaling, SB203580, a potent inhibitor of the p38 pathway28, was utilized to investigate the impact of drug treatment on the inhibition of this pathway for spheroids cultured on top of HA hydrogel28. For MDA-MB-231Br spheroids, the percentage of EdU-positive cells in the control and PTX-treated groups was at 12.1 ± 1.1% and 12.3 ± 2.9% respectively. However, upon treatment with the p38 inhibitor alone at 2 µM, the percentage of EdU-positive cells significantly increased to 24.1 ± 2.2%. Conversely, when the p38 inhibitor was combined with PTX treatment, the percentage of EdU-positive cells markedly decreased to 6.6 ± 1.7%, significantly lower than all other groups (Fig. 8). Similarly, in the case of BT474Br3 spheroids, the percentage of EdU-positive cells in the SB203580 treated group was 21.6 ± 2.8%, significantly greater than in all other conditions, while the percentage of EdU-positive cells was 11.1 ± 3.9% for control group, 10.8 ± 2.2% for 50 nM LAP treated group and 5.7 ± 3.2% for the LAP and p38 inhibitor combination treatment group (Fig. 9). These findings suggest the involvement of p38 signaling in regulating resistance to therapy in dormant BMBC spheroids.

A Representative fluorescent images of EdU staining, blue—DAPI (nucleus) and green—EdU. B Quantification of EdU-positive cells. Scale bar = 100 µm. Each condition has N ≥ 6 replicates. Statistical significance (p < 0.05) is indicated by * based on ANOVA followed by Tukey’s HSD post-hoc analysis. Data are presented as mean ± standard error.

A Representative fluorescent image of EdU staining, blue—DAPI (nucleus) and green—EdU. B Quantification of EdU-positive cells. Scale bar = 100 µm. Each condition has N ≥ 6 replicates. Statistical significance (p < 0.05) is indicated by * based on ANOVA followed by Tukey’s HSD post-hoc analysis. Data are presented as mean ± standard error.
Discussion
In this study, we demonstrate the ability of an in vitro HA hydrogel-based model to study dormancy-associated drug resistance in BMBC spheroids. By employing this model, we compared drug responses between proliferating and dormant BMBC spheroids and identified a mechanism of resistance associated with HA hydrogel-induced dormancy. Our study underscores the utility of such platforms in identifying new therapeutic interventions, particularly for understanding and overcoming treatment resistance in BMBC. Specifically, the novelty of our work lies in the application of the HA hydrogel platform to investigate dormancy-mediated resistance mechanisms in BMBC spheroids and the identification of p38 inhibition strategies to modulate BMBC spheroid responses.
Despite ongoing efforts to develop brain tissue-like microenvironments for studying BMBC hallmarks in vitro, significant gaps remain. For instance, Turker et al. created a 3D thiolated hyaluronic acid (HA-SH)-based hydrogel reflecting the mechanical characteristics of a brain-like ECM to study the growth of TNBC cells; however, dormancy was not explored in their model9. Farino et al. utilized a polyethylene glycol (PEG)-based hydrogel to investigate the effects of chemotherapy on BMBC cells at the single cell level, but did not examine the specific pathways involved in chemoresistance29. Similarly, Yakati et al. demonstrated the impact of matrix stiffness on the drug response of BMBC cells at the single-cell level, which falls short in replicating the 3D architecture of tumors23. By addressing these limitations, our study elucidates how matrix-induced dormancy contributes to chemoresistance using 3D spheroid models in BMBC.
The molecular subtype of BMBC significantly influences patient outcomes, with HER2+ and TNBC subtypes presenting more advanced disease at initial diagnosis and higher mortality rates compared to other breast cancer subtypes30,31,32. This diversity necessitates distinct treatment strategies: patients with HER2+ breast cancer typically receive targeted therapy as an initial systemic treatment, whereas TNBC primarily relies on chemotherapy due to the lack of specific molecular targets33,34. By utilizing these different BMBC subtypes in our study, we aim to elucidate the responses of cancer cells to various therapeutic approaches, providing insights into the role of the ECM-mediated dormancy in drug resistance.
In our study comparing proliferating and dormant BMBC spheroids, we observed that dormant BMBC spheroids cultured on HA hydrogel exhibited minimal changes in proliferation and apoptosis following treatment, consistent with previous research indicating that dormant cancer cells are less responsive to standard therapies29,35,36,37. Quantitative analysis, including fold change in spheroid area (Fig. 1), EdU staining (Fig. 2), Ki67 staining (Figs. S3 and S4), and Annexin V staining (Fig. 3), confirmed that dormant spheroids showed little to no response to paclitaxel and lapatinib. In contrast, suspension-cultured (proliferating) spheroids exhibited significant reduction in proliferation and increased apoptosis post-treatment, reflecting the expected drug-specific effects on the cell cycle: paclitaxel’s action at the G2/M phase and lapatinib’s targeting of the G1 phase, along with their cell death-inducing effects38. These findings reinforce the observation that dormant spheroids remain unresponsive to therapy. In addition, in conventional 2D culture, cells typically exhibit a proliferative phenotype and respond to therapy39, indicating the importance of culture platforms in modulating cell phenotypes.
To better understand the molecular mechanisms underlying drug resistance in dormant BMBC spheroids, we investigated the involvement of p38 and the ERK pathway by immunostaining for p-p38 and p-ERK27. For both cell lines, the percentage of p-ERK positive cells was upregulated in the control groups of proliferating spheroids compared to the treated groups (Fig. 4). Higher percentage of p-ERK positive cells is strongly associated with cell division and is significantly higher during the S-G2 phase40. A corresponding decrease in the percentage of p-ERK-positive cells was observed in the treated proliferating spheroids. Conversely, the percentage of p-p38 positive cells was upregulated upon treatment in proliferating spheroids (Fig. 5). In contrast, dormant spheroids showed no significant difference in either p-p38 or p-ERK levels post-treatment, suggesting maintenance of a balanced signaling state. The ERK/p38 ratio, an important determinant of dormancy41, remained unchanged post-treatment in the dormant spheroids, while a significant reduction in this ratio was observed in the proliferating spheroids (Table 1). These findings underscore the role of ERK and p38 signaling pathways in mediating drug resistance during dormancy and highlight the differential responses of proliferating and dormant spheroids to treatment.
While multiple in vitro studies demonstrate that changing the culture environment can reawaken dormant cancer cells14,42, literature also supports that cancer cells remodel their ECM in various ways to induce drug resistance. For example, they may induce resistance by altering stromal cells, modifying non-cellular ECM components such as stiffness, or by entering a dormant state themselves43,44,45. To investigate whether the observed ECM-induced therapy resistance in dormant spheroids could be reversed by altering the microenvironment, we conducted microenvironment swapping studies. In our experiment, EdU staining and morphological analysis revealed that in Condition 1 (transferring spheroids from HA hydrogel to a scaffold-free system), the cells exited dormancy and became responsive to the drugs in both cell lines, as evidenced by a significant reduction in proliferation (~50%) and a decrease in cross-sectional area. Conversely, in Condition 2 (maintaining spheroids on the HA hydrogel), no significant reduction in proliferation was observed upon treatment, indicating that the spheroids remained dormant and unresponsive to the drugs. Our results suggest that manipulating the environment can reverse dormancy and sensitize cancer cells to therapy, highlighting a potential strategy to overcome drug resistance in BMBC.
After demonstrating that the ECM-induced dormant BMBC spheroids exhibited a therapy-resistant phenotype, we sought to understand the underlying mechanisms contributing to this resistance to therapy. Notably, we observed that the percentage of p-p38 positive cells was higher in spheroids cultured on top of HA hydrogel compared to those cultured in suspension conditions, consistent with previous findings14. Since activation of the p38 MAPK pathway has been shown to maintain cancer cells in a non-proliferative, quiescent state enabling them to evade chemotherapies that target rapidly dividing cells, we decided to investigate this pathway further. For instance, Wee et al. demonstrated that lung metastatic triple-negative breast cancers often exhibit overexpression of interleukin-1 receptor-associated kinase 1 (IRAK1), which is activated by paclitaxel and leads to p38-mediated chemoresistance in both in vitro and in vivo conditions; consequently, blocking IRAK1 or p38 activation restored paclitaxel sensitivity46. Similarly, Donnelly et al. showed that resistance to HER2-targeted therapies involves p38 activation, and inhibiting p38 restored sensitivity to trastuzumab in HER2-overexpressing cancer cell lines in vitro47. However, none of these studies explored the role of the ECM in p38-mediated resistance during chemotherapy or targeted therapy. To investigate the role of p38 pathway in the drug resistance of ECM-induced dormant BMBC spheroids, we utilized SB203580, an inhibitor of p38 alpha and beta isoforms, at a non-cytotoxic concentration of 2 µM28. BMBC spheroids were treated with SB203580, both alone and in combination with PTX or LAP. EdU staining revealed increased proliferation in spheroids cultured on HA hydrogel upon treatment with SB203580 alone, indicating that inhibition of p38 can induce dormant cells to exit quiescence and re-enter the cell cycle. Furthermore, when the p38 inhibitor was combined with PTX or LAP, there was a significant decrease in proliferation in both cell lines (Figs. 8 and 9), suggesting that inhibition of p38 sensitizes the spheroids to therapy. Overall, our findings are consistent with the established role of p38 in mediating chemoresistance in breast cancer and, importantly, extend this knowledge by demonstrating the involvement of ECM-mediated dormancy in this process. By demonstrating that p38 inhibition can reverse ECM-induced dormancy and enhance the efficacy of therapeutic agents in BMBC spheroids, our study highlights the critical interplay between the ECM and intracellular signaling pathways in mediating drug resistance. These results suggest that targeting the p38 MAPK pathway within the context of the ECM may represent a promising therapeutic strategy to overcome drug resistance in BMBC. Thus, combining current chemotherapeutics or targeted therapies with agents that could reverse drug resistance holds potential for improving clinical outcomes in patients with BMBC.
In summary, we demonstrated the ability of the in vitro HA hydrogel platform to study how dormant TNBC and HER2 + BMBC spheroids respond to treatment and exhibit resistance through p38 signaling. However, it is important to acknowledge that the brain’s unique ECM, which includes proteoglycans, glycoproteins, and other structural elements48, was not fully replicated in our model. This limitation could affect the relevance of our findings, as the full range of interactions within the brain TME was not captured. The TME also consists of stromal cells that plays a critical role in cancer progression and treatment resistance49. Interactions between breast cancer cells and stromal cells can activate paracrine and juxtracrine signaling pathways, contributing to therapy resistance mediated by stromal cells50. Therefore, studying how the involvement of other stromal cells affects response to therapy would also be beneficial. Additionally, while this study provides an insightful in vitro model, it does not fully address key clinical considerations related to BMBC dormancy and treatment resistance. In patients, BMBC dormancy can persist for years, whereas our study evaluates dormancy over a 5–7 day period, limiting its ability to replicate long-term dormancy mechanisms. Furthermore, the use of two established BMBC lines may not reflect patient-derived heterogeneity. Finally, future studies could focus on modulating spheroid size and microenvironmental interactions to better understand drug penetration and distribution within 3D spheroids, providing deeper insights into how these factors influence treatment efficacy and resistance in BMBC. In addition, future work would focus on further understanding the mechanisms, including evaluating CD44 and/or integrin signaling, and testing additional markers of dormancy (e.g., NR2F1)51,52. Future studies incorporating patient-derived cells and in vivo validation would be essential to enhance translational relevance.
In conclusion, an in vitro HA hydrogel dormancy-inducing platform was employed to compare the drug responses of dormant versus proliferating BMBC cell spheroids. Our findings reveal that HA hydrogel-induced dormant TNBC and HER2-positive BMBC spheroids exhibit heightened resistance to both chemotherapy and targeted therapies compared to proliferative spheroids. In HA hydrogels, the percentage of tumor cells positive for the dormancy marker p-p38 remained unaffected upon treatment, whereas in the scaffold-free system, the percentage p-p38-positive cells was upregulated following treatment. Conversely, the percentage of tumor cells positive for p-ERK decreased upon treatment in the scaffold-free system but remained unchanged in HA hydrogels. This resistance was reversed by modulating the culture environment. In addition, this resistance was mediated, at least in part, by the p38 signaling pathway, as spheroids cultured on HA hydrogel exhibited a proliferative phenotype and responded to drugs upon p38 inhibition. Moving forward, this platform could be utilized to study the molecular mechanisms of dormancy-associated drug resistance.
Methods
Cell culture, spheroid formation, and imaging
In this study, we employed triple-negative MDA-MB-231Br and HER2-positive BT474Br3 BMBC cells, which were cultured as described previously14. In brief, MDA-MB-231Br cells were grown in Dulbecco’s modified Eagle medium (DMEM) with high glucose obtained from Sigma Aldrich, while BT474Br3 cells were maintained in DMEM/ F12 (1:1 ratio) obtained from Gibco. Both cell types were supplemented with 10% fetal bovine serum (FBS) from VWR Life Science and 1% penicillin–streptomycin from Gibco and cultured in a 37 °C and 5% CO2 environment.
The formation of spheroids, dissociation, and imaging of cell spheroids were carried out following previously established protocols53. In brief, a conical bottom plate (Thermo Fisher Scientific) was prepared by applying a coating of 35 µL of 20 mg/mL poly(2-hydroxyethyl methacrylate) (p-HEMA) (Sigma Aldrich) solution and allowing it to dry in a laminar flow hood. Subsequently, when the cells reached ~80% confluency, they were passaged using trypsin (Gibco) and ~10,000 cells were seeded into each well and subjected to centrifugation at 1000 g for 10 min. Following centrifugation, each well received an addition of 2.5% v/v Matrigel (Corning) and was then incubated overnight. On the following day, the cell spheroids were transferred from the conical bottom plate and cultured either atop an HA hydrogel or in a suspension culture for a duration of 5 days. For the suspension culture, spheroids were maintained in p-HEMA-coated 96-well flat-bottom plates, which prevented the spheroids from adhering to the plate. To monitor spheroid growth over the 5-day period, bright-field images were captured using an Olympus IX83 microscope equipped with a spinning disk confocal attachment. The cross-sectional area of the spheroids was measured using Image J software as previously described14.
Preparation of HA Hydrogels
Hyaluronic acid methacrylate (HAMA) was synthesized as described in prior studies using HA (molecular weight ~66–90 kDa; Lifecore Technologies)20,53. For creating HA hydrogels, 5% w/v HAMA in DMEM and 0.01 M dithiothreitol (DTT) from Sigma Aldrich were mixed. 90 µL of this mixture was added to each well of a 96-well flat-bottom plate and was left overnight to form the hydrogel. This formulation results in ~0.4 kPa HA hydrogels known to induce dormancy as described previously14,20. To enhance cell attachment to these hydrogels, an integrin-binding peptide, RGD (at a concentration of 1 mg/mL, Anaspec), was added as described previously14.
Drug dilution and treatment
Paclitaxel was sourced from Sigma and diluted with DMSO to create a 10 mM stock solution. This stock was then diluted with the culture medium to prepare various concentrations of the drug. Lapatinib was sourced from LC Laboratories and diluted similarly to paclitaxel, starting from a 10 mM stock solution. Following the culture of spheroids either on the HA hydrogel or in suspension for 2 days, the culture medium was removed and 100 µL of the drug at a concentration of 50 nM prepared with the culture medium was introduced to the spheroids and incubated for 72 h.
Spheroid dissociation
On day 5 (72 h post drug treatment), spheroids were collected and combined into designated Eppendorf tubes according to their culture conditions. They were washed twice with 1X phosphate-buffered saline (PBS) (Gibco). The spheroids were then incubated in 300 µL of accutase (Corning) for 15 min at 37 °C, with mechanical stirring every 5 min to ensure thorough dissociation. After centrifugation to settle the single cells, a PBS wash was performed, and the cells were then transferred to a 96-well plate for subsequent staining.
5-Ethynyl- 2′-deoxyuridine (EdU) cell proliferation assay
The percentage of proliferating cells within cell spheroids was quantified using a Click-iT EdU Cell Proliferation Kit (Thermo Fisher Scientific), following previously established protocols20. On day 5, media containing 10 µM EdU was added and left to incubate overnight. The next day, cell spheroids were dissociated into single cells and placed into a 96-well plate. These cells were then fixed at room temperature for 20 min using 100 µL of 4% paraformaldehyde. Following this, the cells underwent a wash with PBS and were permeabilized at room temperature with 100 µL of 0.5% Triton-X for 15 min. Cells were then blocked using 100 µL of 5% bovine serum albumin for 30 min at 4 °C. After blocking, the cells were incubated with the reaction cocktail for 30 min in the dark at room temperature, as directed by the kit’s protocol. DAPI staining was then applied for 5 min at room temperature in the dark to counterstain the nuclei. Between each step, the cells were washed with PBS. To ensure that cells settled at the bottom of the plate before removing any liquid, the plate was centrifuged for 3 min at 1000 g. Fluorescence microscopy images were captured using an Olympus IX83 microscope with a spinning disk confocal attachment. A minimum of five images per well were taken. The percentage of EdU-positive cells was measured using ImageJ software.
Annexin V apoptosis assay
To quantify the percentage of apoptotic cells, the Annexin V assay (Santa Cruz Biotechnology, Inc.) was employed. For this assay, spheroids were harvested on day 5 and dissociated into single cells. These cells were then washed twice with PBS and incubated with Annexin V for 15 min. This step was followed by fixing the cells with paraformaldehyde for 20 min at room temperature. The cells were then further stained with DAPI at room temperature and washed with PBS. Fluorescence images were then captured using an Olympus IX83 microscope equipped with a spinning disk confocal attachment, and ImageJ software was used to calculate the percentage of apoptotic cells as described previously23.
Immunofluorescence staining
Immunofluorescence staining was performed to evaluate the percentage of proliferating cells (using Ki67 protein as a marker), and cells positive for phosphorylated ERK or p38, following published methods14. On day 5, spheroids were collected, combined into an Eppendorf tube according to their respective culture conditions, and washed twice with 1× PBS. Cells were then fixed, permeabilized and blocked and incubated with primary antibodies solution (p-ERK [Cell Signaling Technology, C#4370S-1:400]; p-p38 [Cell Signaling Technology, C#9216S-1:400]; Ki67 [Abcam, C#ab15580-1:150]) diluted in 1× PBS overnight at 4 °C. On the subsequent day, cells were treated with secondary antibodies for 1 h at 4 °C. For the detection of Ki67 and phosphorylated ERK, a goat anti-rabbit antibody (A11034 1:1000, Invitrogen) was used, while a goat anti-mouse antibody (A11001 1:1000, Invitrogen) facilitated the detection of phosphorylated p38. Subsequently, DAPI was applied to counterstain the cells for 5 min in the dark at room temperature. Fluorescent images were obtained using an Olympus IX83 microscope equipped with a spinning disk confocal attachment. For quantification, at least five images were captured for each well. The percentages of cells positive for Ki67, phosphorylated ERK, or phosphorylated p38 were quantified using ImageJ software.
Culture environment switching study
To determine the impact of switching the microenvironment on drug response, BMBC spheroids were initially cultured on HA hydrogels for 5 days. After this initial culture period, the spheroids were collected and transferred to one of two new conditions: (1) suspension culture or (2) on top of freshly prepared HA hydrogels, using the same protocol described earlier. The spheroids were then cultured under these new conditions for an additional 5 days, followed by a 72 h drug treatment. After the treatment, the spheroids were collected, dissociated into single cells, and subjected to EdU staining to assess proliferation.
p38 inhibition study
To investigate the impact of p38 inhibition, BMBC spheroids were first formed and cultured on top of HA hydrogels for 2 days. Following this initial culture period, the spheroids were treated with a p38 inhibitor, SB203580 (LC Laboratories) at 2 µM for 72 h. The impact of p38 inhibition in combination with PTX (50 nM) or LAP (50 nM) treatment was also tested. After the treatment period, the spheroids were collected and dissociated into single cells, following which EdU staining was performed to assess proliferation.
Statistical analysis
Statistical analysis was performed by utilizing JMP Pro software. Each spheroid cultured on an individual hydrogel was considered a biological replicate. For morphological analyses, ≥12 spheroids were quantified per condition in at least two independent experiments. For immunofluorescence assays, ≥6 spheroids per condition were analyzed across at least two independent experiments. Data are reported as mean ± SEM. To analyze statistical significance between samples, a Student’s t-test or ANOVA followed by Tukey’s HSD post-hoc analysis was used. A p-value < 0.05 was considered as a statistically significant difference.
Data availability
All data are available from the corresponding author on reasonable request.
References
-
Ghajar, C. M. Metastasis prevention by targeting the dormant niche. Nat. Rev. Cancer 15, 238–247 (2015).
-
Obenauf, A. C. & Massagué, J. Surviving at a distance: organ-specific metastasis. Trends Cancer 1, 76–91 (2015).
-
Gomis, R. R. & Gawrzak, S. Tumor cell dormancy. Mol. Oncol. 11, 62–78 (2017).
-
Quintanal-Villalonga, A. et al. Lineage plasticity in cancer: a shared pathway of therapeutic resistance. Nat. Rev. Clin. Oncol. 17, 360–371 (2020).
-
Prieto-Vila, M., Takahashi, R. U., Usuba, W., Kohama, I. & Ochiya, T. Drug resistance driven by cancer stem cells and their niche. Int. J. Mol. Sci. 18, 2574 (2017).
-
Richbourg, N. R., Irakoze, N., Kim, H. & Peyton, S. R. Outlook and opportunities for engineered environments of breast cancer dormancy. Sci. Adv. 10, eadl0165 (2024).
-
Sosa, M. S., Bragado, P. & Aguirre-Ghiso, J. A. Mechanisms of disseminated cancer cell dormancy: an awakening field. Nat. Rev. Cancer 14, 611–622 (2014).
-
Park, S. Y. & Nam, J. S. The force awakens: metastatic dormant cancer cells. Exp. Mol. Med. 52, 569–581 (2020).
-
Turker, E. et al. Breast tumor cell survival and morphology in a brain-like extracellular matrix depends on matrix composition and mechanical properties. Adv. Biol. (Weinh.) 8, e2400184 (2024).
-
Winkler, J., Abisoye-Ogunniyan, A., Metcalf, K. J. & Werb, Z. Concepts of extracellular matrix remodelling in tumour progression and metastasis. Nat. Commun. 11, 5120 (2020).
-
Ghajar, C. M. et al. The perivascular niche regulates breast tumour dormancy. Nat. Cell Biol. 15, 807−817 (2013).
-
Sosa, M. S., Avivar-Valderas, A., Bragado, P., Wen, H. C. & Aguirre-Ghiso, J. A. ERK1/2 and p38α/β signaling in tumor cell quiescence: opportunities to control dormant residual disease. Clin. Cancer Res. 17, 5850–5857 (2011).
-
Gote, V., Nookala, A. R., Bolla, P. K. & Pal, D. Drug Resistance in metastatic breast cancer: tumor targeted nanomedicine to the rescue. Int. J. Mol. Sci. 22, 4673 (2021).
-
Kondapaneni, R. V., Shevde, L. A. & Rao, S. S. A biomimetic hyaluronic acid hydrogel models mass dormancy in brain metastatic breast cancer spheroids. Adv. Biol. ((Weinh.)) 7, e2200114 (2023).
-
Abd El-Sadek, I. et al. Label-free drug response evaluation of human derived tumor spheroids using three-dimensional dynamic optical coherence tomography. Sci. Rep.-Uk 13, 15377 (2023).
-
Filipiak-Duliban, A., Brodaczewska, K., Kajdasz, A. & Kieda, C. Spheroid culture differentially affects cancer cell sensitivity to drugs in melanoma and RCC models. Int. J. Mol. Sci. 23, 1166 (2022).
-
Gilazieva, Z., Ponomarev, A., Rutland, C., Rizvanov, A. & Solovyeva, V. Promising applications of tumor spheroids and organoids for personalized medicine. Cancers 12, 2727 (2020).
-
Kudaravalli, S., Den Hollander, P. & Mani, S. A. Role of p38 MAP kinase in cancer stem cells and metastasis. Oncogene 41, 3177–3185 (2022).
-
Flem-Karlsen, K. et al. p38 MAPK activation through B7-H3-mediated DUSP10 repression promotes chemoresistance. Sci. Rep.-Uk 9, 5839 (2019).
-
Narkhede, A. A., Crenshaw, J. H., Crossman, D. K., Shevde, L. A. & Rao, S. S. An in vitro hyaluronic acid hydrogel based platform to model dormancy in brain metastatic breast cancer cells. Acta Biomater. 107, 65–77 (2020).
-
Miller, I. et al. Ki67 is a graded rather than a binary marker of proliferation versus quiescence. Cell Rep. 24, 1105-+ (2018).
-
Di Rosa, F., Cossarizza, A. & Hayday, A. C. To Ki or not to Ki: re-evaluating the use and potentials of Ki-67 for T cell analysis. Front. Immunol. 12, 653974 (2021).
-
Yakati, V., Shevde, L. A. & Rao, S. S. Matrix stiffness influences response to chemo and targeted therapy in brain metastatic breast cancer cells. Biomater. Sci.-Uk 12, 3882–3895 (2024).
-
Guo, Y. J. et al. ERK/MAPK signalling pathway and tumorigenesis (Review). Exp. Ther. Med. 19, 1997−2007 (2020).
-
Chen, W., Dong, J., Haiech, J., Kilhoffer, M. C. & Zeniou, M. Cancer stem cell quiescence and plasticity as major challenges in cancer therapy. Stem Cells Int. 2016, 1740936 (2016).
-
Canovas, B. & Nebreda, A. R. Diversity and versatility of p38 kinase signalling in health and disease. Nat. Rev. Mol. Cell Biol. 22, 346–366 (2021).
-
Lee, S., Rauch, J. & Kolch, W. Targeting MAPK signaling in cancer: mechanisms of drug resistance and sensitivity. Int. J. Mol. Sci. 21, 1102 (2020).
-
Duzgun, S. A. et al. Differential effects of p38 MAP kinase inhibitors SB203580 and SB202190 on growth and migration of human MDA-MB-231 cancer cell line. Cytotechnology 69, 711–724 (2017).
-
Farino, C. J., Pradhan, S. & Slater, J. H. The influence of matrix-induced dormancy on metastatic breast cancer chemoresistance. ACS Appl. Bio Mater. 3, 5832–5844 (2020).
-
Hung, M. H. et al. Effect of age and biological subtype on the risk and timing of brain metastasis in breast cancer patients. PLoS ONE 9, e89389 (2014).
-
Martin, A. M. et al. Brain metastases in newly diagnosed breast cancer a population-based study. JAMA Oncol. 3, 1069–1077 (2017).
-
Darlix, A. et al. Impact of breast cancer molecular subtypes on the incidence, kinetics and prognosis of central nervous system metastases in a large multicentre real-life cohort. Br. J. Cancer 121, 991–1000 (2019).
-
Wang, H. J. Lapatinib for the treatment of breast cancer in the People’s Republic of China. Oncotargets Ther. 7, 1367–1373 (2014).
-
Jusino, S., Fadul, C. E. & Dillon, P. Systematic review of the management of brain metastases from hormone receptor positive breast cancer. J. Neurooncol. 162, 45–57 (2023).
-
Fang, J. Y. et al. From competency to dormancy: a 3D model to study cancer cells and drug responsiveness. J. Transl. Med. 14, 38 (2016).
-
Manjili, M. H. The Inherent premise of immunotherapy for cancer dormancy. Cancer Res. 74, 6745–6749 (2014).
-
Anlas, A. A. & Nelson, C. M. Soft microenvironments induce chemoresistance by increasing autophagy downstream of integrin-linked kinase. Cancer Res. 80, 4103–4113 (2020).
-
Gross, S. M. et al. Analysis and modeling of cancer drug responses using cell cycle phase-specific rate effects. Nat. Commun. 14, 3450 (2023).
-
Narkhede, A. A., Crenshaw, J. H., Crossman, D. K., Shevde, L. A. & Rao, S. S. An invitro hyaluronic acid hydrogel based platform to model dormancy in brain metastatic breast cancer cells. Acta Biomater. 107, 65–77 (2020).
-
Stern, A. D. et al. Relating individual cell division events to single-cell ERK and Akt activity time courses. Sci. Rep.-Uk 12, 18077 (2022).
-
Sosa, M. S., Avivar-Valderas, A., Bragado, P., Wen, H. C. & Aguirre-Ghiso, J. A. ERK1/2 and p38alpha/beta signaling in tumor cell quiescence: opportunities to control dormant residual disease. Clin. Cancer Res. 17, 5850–5857 (2011).
-
Goodarzi, K., Lane, R. & Rao, S. S. Varying the RGD concentration on a hyaluronic acid hydrogel influences dormancy versus proliferation in brain metastatic breast cancer cells. J. Biomed. Mater. Res. A 112, 710–720 (2024).
-
Li, C. et al. Extracellular matrix-derived mechanical force governs breast cancer cell stemness and quiescence transition through integrin-DDR signaling. Signal Transduct.Target. Ther. 8, 247 (2023).
-
Darvishi, B., Eisavand, M. R., Majidzadeh-A, K. & Farahmand, L. Matrix stiffening and acquired resistance to chemotherapy: concepts and clinical significance. Br. J. Cancer 126, 1253–1263 (2022).
-
Prakash, J. & Shaked, Y. The interplay between extracellular matrix remodeling and cancer therapeutics. Cancer Discov. 14, 1375–1388 (2024).
-
Wee, Z. N. et al. IRAK1 is a therapeutic target that drives breast cancer metastasis and resistance to paclitaxel. Nat. Commun. 6, 8746 (2015).
-
Donnelly, S. M. et al. P38 MAPK contributes to resistance and invasiveness of HER2-overexpressing breast cancer. Curr. Med. Chem. 21, 501–510 (2014).
-
Lam, D. et al. Tissue-specific extracellular matrix accelerates the formation of neural networks and communities in a neuron-glia co-culture on a multi-electrode array. Sci. Rep.-Uk 9, (2019).
-
Tufail, M., Cui, J. & Wu, C. Breast cancer: molecular mechanisms of underlying resistance and therapeutic approaches. Am. J. Cancer Res. 12, 2920–2949 (2022).
-
Boelens, M. C. et al. Exosome transfer from stromal to breast cancer cells regulates therapy resistance pathways. Cell 159, 499–513 (2014).
-
Wu, R. R. et al. NR2F1, a tumor dormancy marker, is expressed predominantly in cancer-associated fibroblasts and is associated with suppressed breast cancer cell proliferation. Cancers 14, 2962 (2022).
-
Witschen, P. M. et al. Tumor cell associated hyaluronan-CD44 signaling promotes pro-tumor inflammation in breast cancer. Cancers 12, 1325 (2020).
-
Kondapaneni, R. V. & Rao, S. S. Matrix stiffness and cluster size collectively regulate dormancy versus proliferation in brain metastatic breast cancer cell clusters. Biomater. Sci. 8, 6637–6646 (2020).
Acknowledgements
This work was supported by the American Cancer Society (RSG-21-032-01-CSM to S. R.) and, in part, by the National Science Foundation (CBET 1749837 to S.R.).
Ethics declarations
Competing interests
The authors declare no competing interests.
Additional information
Publisher’s note Springer Nature remains neutral with regard to jurisdictional claims in published maps and institutional affiliations.
Supplementary information
Rights and permissions
Open Access This article is licensed under a Creative Commons Attribution-NonCommercial-NoDerivatives 4.0 International License, which permits any non-commercial use, sharing, distribution and reproduction in any medium or format, as long as you give appropriate credit to the original author(s) and the source, provide a link to the Creative Commons licence, and indicate if you modified the licensed material. You do not have permission under this licence to share adapted material derived from this article or parts of it. The images or other third party material in this article are included in the article’s Creative Commons licence, unless indicated otherwise in a credit line to the material. If material is not included in the article’s Creative Commons licence and your intended use is not permitted by statutory regulation or exceeds the permitted use, you will need to obtain permission directly from the copyright holder. To view a copy of this licence, visit http://creativecommons.org/licenses/by-nc-nd/4.0/.
About this article

Cite this article
Sarker, P., Shevde, L.A. & Rao, S.S. An in vitro hydrogel-based model to study dormancy associated drug resistance in metastatic breast cancer spheroids. npj Biomed. Innov. 2, 39 (2025). https://doi.org/10.1038/s44385-025-00043-9
-
Received:
-
Accepted:
-
Published:
-
Version of record:
-
DOI: https://doi.org/10.1038/s44385-025-00043-9