Introduction
Tomato (Solanum lycopersicum Mill.) native to South America is one of the most extensively cultivated vegetable crop and holds significant economic importance as a member of the Solanaceae(nightshade) family1,2. Because of its high nutritional content and adaptability, it is referred to as a protective food. It may be eaten both fresh and in processed forms such as soup, sauces, ketchup, powders, and canned goods3. It is particularly well-known for having a high concentration of lycopene, a potent antioxidant, and for being a great source of vitamins C and A, both of which lower the risk of prostate cancer4,576, 77. In 2021–22, approximately 20,300.19 tons of tomato were produced in the country making up almost 9.63 per cent of the total vegetable production. The area under tomato has climbed 865.29 million hectares in 2021–22 from 546.93 million hectares in 2005–06 resulting into production of 20300.19 tons from 99.67 thousand tons in 2005–066.
Wild tomato species are often used in traditional breeding programs as source of genes that confer tolerance or resistance to biotic and abiotic stresses7. Tomato is one of the crops that have been studied the most in the domains of breeding, genetics and genomics8. Since it facilitates the development of novel varieties and boosts production and productivity, an understanding of germplasm diversity is crucial for plant breeding and conservation efforts9,10. Several molecular maps based on crosses between different tomato accessions and wild species have been created since it was one of the first crop to have a genetic linkage map created11. Understanding the genetic diversity within tomato germplasm is crucial for improving yield potential and enhancing desirable traits12. Genetic analysis of tomato has been carried out using various methods, including morphological, biochemical, and molecular techniques13.
Morphological and molecular parameters can be used to evaluate tomato diversity. Seasons and genotypes showed notable variances in morphological features, which reflected variations in genotypic variability and the impact of growing conditions1,8. Previous studies have shown significant genetic diversity in tomato using morphological and molecular markers. Ezekiel et al.14 and Gbadamosi et al.15 reported high polymorphism using RAPD and SSR markers, respectively, while16 highlighted genetic variation for heat-stress tolerance, aiding trait improvement in breeding programs. Morphological characteristics have historically been used to categorize tomato accessions. Nevertheless, these characteristics are frequently erratic and vulnerable to external factors. Techniques for assessing genetic diversity have evolved over time, incorporating biochemical and molecular markers in addition to physical traits. Despite their drawbacks, morphological markers are nevertheless useful for differentiating genotypes and are still essential in tomato breeding initiatives17.
Simple sequence repeat (SSR) markers, amplified fragment length polymorphism (AFLP), and random amplified polymorphic DNA (RAPD) are molecular markers frequently employed to evaluate genetic variation. DNA-based markers and other molecular markers are phenotypically neutral and offer a more accurate method of analyzing tomato genetic variation18. Breeding programs can be benefitted from the insights into genetic variation provided by these markers, which enable researchers to scan the complete genome19. RAPD is a PCR-based method that uses a single arbitrary primer to identify nucleotide sequence polymorphisms in DNA. This method creates a unique genetic fingerprint for an individual by amplifying complementary DNA sequences to the primer. RAPD is a powerful tool for evaluating genetic diversity, identifying specific markers linked to important agronomic traits, and studying the phylogenetic relationships among tomato accessions20. The technique has been employed in various applications, including varietal identification, gene mapping, biodiversity studies, and the construction of genetic maps in tomato21.
The current study uses morphological characteristics as well as molecular characterisation using RAPD markers to investigate the genetic diversity of tomato germplasm. In order to improve important crop characteristics including yield and nutritional value, this combined strategy will offer deeper insights into the genetic heterogeneity within tomato germplasm. The study aims to provide a thorough understanding of tomato genetic diversity by combining morphological and molecular approaches. This will make it easier to identify variable genotypes for upcoming breeding initiatives.
Materials and methods
Collection of genetic material
Nineteen elite tomato seed accessions were obtained from the Department of Horticulture, Sardar Vallabhbhai Patel University of Agriculture & Technology, Meerut (Uttar Pradesh). The experiment to evaluate morphological traits was conducted at the Scientific and Applied Research Centre, Meerut, adhering to standard agronomic practices in Completely Randomized Design (CRD). The experiment was conducted in two replications using healthy seeds to ensure reliable results. The seeds were germinated on soaked paper tissues for three days and then sown in 98 cell trays filled with a 3:1:1 (v/v) mixture of cocopeat, vermiculite, and perlite. Four weeks after sowing, the seedlings were transplanted into pots (Table 1).
Reagents and chemicals
Reagents and chemicals used in this study were procured from Bangalore Genei, Qualigens (India), Merck (Germany), Himedia, and Imperial (IDT). PCR-specific reagents, including Taq Polymerase, Taq Buffer, dNTPs, and MgCl2, were procured from Bangalore Genei, while custom primers for molecular profiling were synthesized by Integrated DNA Technology (IDT), USA (Table 2). Morphological data were collected from ten plants of each accession or genotype for various traits. The data were analyzed using cluster analysis with the UPGMA method in NTSYSpc software (version 2.2).
Molecular analysis
Fresh young tomato leaves were collected from potted plants and immediately packed into polybags, frozen in liquid nitrogen (−196 °C), and stored in a deep freezer (−80 °C) to preserve their integrity for genomic DNA isolation. The molecular analysis using Random Amplified Polymorphic DNA (RAPD) markers involved three key steps: genomic DNA isolation and quantification, DNA amplification using RAPD primers via PCR, and resolution of the PCR-amplified products.
Genomic DNA isolation and quantification
Genomic DNA was extracted from young, healthy tomato leaves using the CTAB method 22 with slight modifications. One gram of leaf tissue was ground into a fine powder in liquid nitrogen with polyvinylpyrrolidone (PVP) to minimize phenolic interference. The extraction buffer (2% w/v CTAB, 1.4 M NaCl, 20 mM EDTA, 100 mM Tris–HCl, pH 8.0, and 0.2% w/v 2-mercaptoethanol) was preheated to 60 °C, and 2 mL was added to the ground tissue, followed by incubation at 60 °C for 60 min with intermittent swirling. DNA was purified using chloroform:isoamyl alcohol (24:1), centrifuged at 10,000 rpm for 10 min, and the aqueous phase was collected. This step was repeated to enhance purity. DNA precipitation was carried out by adding 0.5 volumes of 5 M NaCl and two volumes of ice-cold isopropanol, followed by overnight incubation at − 20 °C.
DNA purification involved the removal of polysaccharides, RNA, and proteins using CTAB, RNase treatment, and phenol–chloroform extraction. Purified DNA was precipitated with sodium acetate and ethanol, followed by centrifugation, ethanol washing, vacuum drying, and dissolution in TE buffer. Quality assessment was performed via 0.8% agarose gel electrophoresis in 1X TBE buffer with ethidium bromide staining. DNA concentration was determined spectrophotometrically at 260/280 nm, with purity assessed based on an A260/A280 ratio of 1.85–1.95.
DNA amplification using RAPD primers
The RAPD marker sequences used in this study were sourced from Bangalore Genei, Bangalore. A total of 25 decamer oligonucleotides were selected for PCR amplification based on the protocol by23. The PCR reaction volume was 15 µL, containing the following components: 20 ng/µL template DNA, 0.4 µM single primer, 0.6 U Taq DNA polymerase, 0.2 µM dNTPs, 1.5 mM MgCl2, and 10 mM Tris–HCl, 50 mM KCl buffer. A total of 20 RAPD primers were tested across 19 tomato genotypes. PCR reactions were carried out using a Long Gene thermal cycler, with 50 ng genomic DNA in 10 µL volumes. The PCR reaction was carried out in a 10 µL reaction mixture containing 1.5 mM MgCl2, 1X Taq buffer, 250 µM dNTPs, 0.25 mM each of forward and reverse primers, 1 U Red Taq polymerase, and 50 ng of template DNA, with the volume adjusted using nuclease-free water.
DNA amplification was carried out using RAPD primers in the PCR mixture containing Taq DNA polymerase, dNTPs, MgCl2, and specific primers. The thermal cycling conditions were as follows: initial denaturation at 94 °C for 4 min, followed by 35 cycles of 94 °C for 30 s, 36 °C for 1 min, and 72 °C for 2 min. A final extension step was performed at 68 °C for 7 min.
Resolving PCR amplified products
PCR products were separated by electrophoresis on a 1.5% agarose gel, stained with ethidium bromide, and visualized under UV light. A DNA ladder was used as a reference to estimate the sizes of the fragments.
Scoring the amplified fragments
Fragments were scored as ‘1’ (present) or ‘0’ (absent). The percentage of polymorphism was calculated using the formula:
$${text{Percent polymorphism }} = frac{{text{Number of polymorphic bands}}}{{text{Total number of bands}}} times 100$$
Molecular marker data analysis
For each RAPD marker, Polymorphism Information Content (PIC) was determined as24 PIC is a measure of allele diversity at a locus and is equal to 1-∑(P2ij),where Pij is the frequency of Jth allele for ith locus summed across all allele in the locus .PIC is synonymous with the term “gene diversity” as described by Sharma et al.25.The PIC valve ranging from ‘0’ (Monomorphic) to ‘1’ (highly discriminative with many alleles in equal frequency) is an indication of discriminative power of marker , not only for number of alleles at a locus but also for relative frequencies of those allele in the genotypes under study. For example, a marker has four alleles, but one allele is found in very high frequency has overall less discriminative capability than a locus where alleles are found in more equal frequencies.
Statistical analysis
Data from molecular and morphological analyses were using XLSTAT platform (Addinsoft, New York, USA). The agglomerative hierarchical clustering was calculated using squared Euclidean distance method and genotypes were clustered based on ward’s method26. The genetic similarity was determined by calculating pairwise Jaccard’s coefficients. NTSYSpc-2.10 software27 was used to calculate the genetic similarity, and to construct a dendrogram through the un-weighted pair group method with arithmetic mean (UPGMA) method28.
The RAPD marker data were first quality-checked, and markers with more than 10% missing data were excluded. The remaining missing data were imputed using the mean allele frequency for each marker. All analyses were performed on the binary (presence/absence) marker data.
Population structure was inferred using two complementary approaches. First, the Bayesian clustering method implemented in STRUCTURE v2.3.428 was used. We ran the analysis for K (number of clusters) from 1 to 10, with 10 replicates per K, each consisting of a 50,000 iteration burn-in followed by 100,000 MCMC iterations. The optimal K was determined using the ΔK method29. Second, discriminant analysis of principal components (DAPC) was performed using the adegenet package in R30,31 to visualize the genetic differentiation among groups without assuming Hardy–Weinberg equilibrium.
Molecular analysis of variance (AMOVA) was conducted to partition the genetic variation among and within the inferred populations using the GenAlEx v6.5 software32. The PhiPT statistic, an analogue of FST for binary data, was calculated, and significance was tested with 9999 permutations.
Genetic diversity within populations was assessed by calculating the percentage of polymorphic loci (PPL) and Shannon’s diversity index (I) using GenAlEx v6.532. Additionally, pairwise PhiPT values between populations were computed, and their significance was tested with 9999 permutations.
All statistical analyses were performed in R v4.0.533, and data visualization was carried out using the ggplot2 package34.
Results and discussion
Morphological characterization
The study examined 19 tomato accessions s/genotypes, revealing significant variation in key morphological traits. Data were analysed for traits such as plant height, days to 50% flowering, number of primary branches, fruits per plant, locules per fruit, fruit length, diameter, and weight. Descriptive statistics, including range, mean, standard error, variance, and standard deviation were calculated. A dendrogram generated using NTSYS-pc software grouped the cultivars into distinct clusters based on phenotypic data.
Morphological traits and their mean performance
The mean performance and range of 8 quantitative traits for 19 tomato accessions/genotypes are summarized in Table 3. Plant height varied from 98.3 cm (Angoorlata) to 143.3 cm (DVRT-1 and PB-UPMA), with a mean of 128.34 cm. Days to 50% flowering ranged from 50 days (Angoorlata) to 63 days (PB-UPMA), with a mean of 55.89 days. The number of primary branches ranged from 6 (EC-538423) to 14 (PB-UPMA), with a mean of 9.01. The number of fruits per plant varied from 28.3 (DVRT-2) to 317.6 (PB-UPMA), with a mean of 148.67. The number of locules per fruit ranged from 3 (EC-538155) to 7 (FLA-7421), with a mean of 5.63. Fruit length ranged from 2.2 cm (EC-538155) to 6.3 cm (Angoorlata), with a mean of 4.41 cm. Fruit diameter ranged from 2.6 cm (EC-538405) to 5.3 cm (Angoorlata), with a mean of 3.48 cm. The highest fruit weight was 115.0 g (PDT-3-1-1), and the lowest was 31.6 g (BT-12), with a mean of 58.54 g.
PB-UPMA exhibited the highest values for plant height, days to 50% flowering, number of primary branches, and number of fruits per plant. In contrast, Angoorlata showed the lowest values for plant height (98.3 cm) and days to 50% flowering. These findings are consistent with previous studies35,36,37,38. The highest variability was observed in the number of fruits per plant (28.3–317.6), followed by plant height (98.3–143.3 cm), fruit weight (31.6–115 g), days to 50% flowering (50.1–62.9), number of primary branches (5.9–13.6), number of locules per fruit (3.3–7.1), fruit length (2.2–6.3 cm), and fruit diameter (2.6–5.3 cm). The highest variance was recorded for the number of fruits per plant (6316.78), followed by fruit weight (759.84), plant height (180.75), and days to 50% flowering (17.19). The lowest variance was observed for fruit diameter (0.65), number of locules per fruit (1.15), fruit length (1.51), and number of primary branches (5.09). The high variance observed for most traits indicates a strong genetic component contributing to the total variation. These results suggest that these traits are crucial for selection and can be exploited in breeding programs. Similar findings have been reported by Mohanty39 and Khan et al.53.
Correlation of morphological traits in tomato genotypes
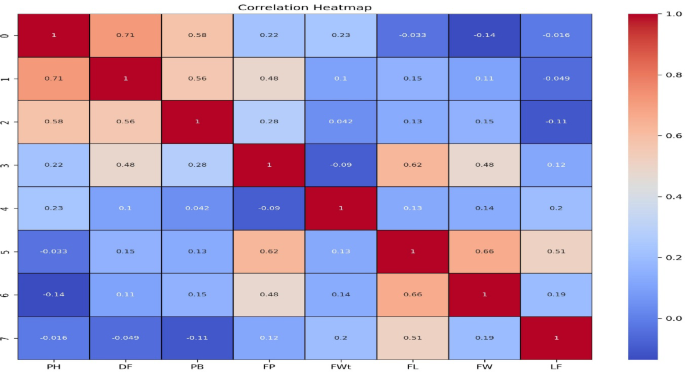
Key relationships between morphological traits were identified by the correlation (Fig. 1). For example, plant height (PH) showed a strong positive and significant correlation with primary branches (PB) (r = 0.580**) and days to flowering (DF) (r = 0.715**), indicating that taller plants typically have more branches and flower later. Additionally, FP demonstrated strong positive connections with fruit length (FL) (r = 0.625**), fruit width (FW) (r = 0.478**), DF, and PB (r = 0.280*), while DF also demonstrated significant positive associations with PB (r = 0.563**) and fruit per plant (FP) (r = 0.483**). There was a substantial correlation between FL and FW (r = 0.660**), and FL and leaf length (LF) were positively associated (r = 0.514**). Although not statistically significant, there was a positive connection between LF and FW (r = 0.194 NS), FP (r = 0.121 NS), and FWt (r = 0.197 NS). Strong relationships between fruit per plant (FP) and fruit width (FW) (r = 0.478**) and fruit length (FL) (r = 0.625**) are noteworthy; these relationships are consistent with earlier research highlighting the significance of fruit shape in determining yield19. Taller genotypes may have delayed blooming, which could impact earliness and total crop duration, according to the positive correlation between plant height (PH) and days to flowering (DF) (r = 0.715**)54. These trait connections assist focused breeding techniques for better performance of tomato by offering helpful recommendations for choosing genotypes with balanced vegetative and reproductive growth55.

Graphical representation of correlation matrix for growth and yield traits in tomato accessions.
Population structure analysis
Based on RAPD marker data, the population structure analysis using K-means clustering (K = 10) showed a distinct genetic partitioning among the 19 tomato genotypes (Fig. 2). With a 100% membership probability, each genotype was allocated to a unique genetic cluster, suggesting that there was no admixture between accessions. High degrees of genetic divergence among the accessions under study are suggested by the STRUCTURE plot, which shows that all genotypes strictly organized into 10 clusters. Notably, other elite lines like IIHR-1 (Cluster 3), DVRRT-1 (Cluster 5), and FLA-7421 (Cluster 9) were also allocated to different clusters, along with PB Chuhara and PB Keshri (Cluster 1 and 2, respectively). These results corroborate those of the PCA and dendrogram analyses, which also indicated a high degree of molecular difference between these accessions.

Population structure analysis using K-means clustering (K = 10) among the 19 tomato genotypes.
The usefulness of RAPD markers in separating accessions is confirmed by the unambiguous separation of tomato genotypes into 10 distinct clusters without admixture, highlighting the substantial molecular diversity shown by these markers56,57. As previously mentioned by Parveen et al.58, this absence of mixing indicates limited gene flow, most likely as a result of different geographic or breeding origins. It also fits with the grouping patterns observed in the dendrogram and PCA. As parents for breeding programs aimed at heterosis and genetic enrichment, genotypes such as DVRRT-1 and FLA-7421, which formed distinct clusters, show promise59.
Hierarchical clustering dendrogram
Based on their RAPD profiles, the 19 tomato genotypes were divided into two primary groups by the hierarchical clustering dendrogram created using Ward’s approach (Fig. 3). Ten genotypes, including DVRRT-2, FED-2, BT-12, EC-38155, FLA-7421, EC-38405, and H-86, made up the first significant cluster (Cluster I), indicating a close genetic link between these lines. The remaining genotypes, including DVRRT-1, VRRT-2, PB Chuhara, PB Keshri, EC-38450, IIHR-1, EC-38158, PDT3-1-1, PB-UPMA, Angoorlata, and VR-1, were included in the second major cluster (Cluster II), which showed greater genetic divergence from Cluster I. Within each sub-cluster, genotypes showed a high degree of genetic similarity. BT-12 and EC-38155, for instance, were closely packed together, and PB Chuhara and PB Keshri were in a different sub-cluster. This clustering pattern supports the variation observed in RAPD-based similarity indices and aligns with the STRUCTURE-based genetic grouping.

Hierarchical clustering dendrogram among the 19 tomato genotypes.
The usefulness of RAPD markers in resolving genetic links was confirmed by the dendrogram, which showed substantial genetic variability across tomato accessions with two major clusters and discrete subgroupings56,57. While DVRRT-1 and PB-UPMA formed distinct branches, indicating distinct genetic histories, genotypes such as DVRRT-2, FED-2, and BT-12 clustered nearby, suggesting similar heritage. These grouping patterns supported the validity of RAPD-based diversity assessment by mirroring those seen in PCA and STRUCTURE analyses58,59. It is noteworthy that distant genotypes like Angoorlata and H-86 show promise as candidates to expand the genetic base in breeding operations60.
To investigate the phenotypic diversity among the 19 tomato genotypes, morphological traits were subjected to principal component analysis (PCA). According to Fig. 4, the first two principal components (PC1 and PC2) explained 35.41% and 26.91% of the total variance, respectively. Significant phenotypic variance was indicated by the genotypes’ clear distribution throughout the PCA biplot. Genotypes with opposing morphological features, such as EC-538155 and PB Chuhara, were located on the negative axis of PC1, whereas PB-UPMA and VR-1 occupied the extreme positive side. It’s interesting to note that the morphological dispersion and the genetic clusters (K = 10) found by STRUCTURE analysis were mostly consistent, confirming the relationship between genotypic and phenotypic diversity. Genotypes Angoorlata and VRRT-2, positioned in the upper quadrants of the PCA plot, also showed strong separation from the core cluster, indicating their unique trait combinations and potential as diverse genetic resources.

Principal component analysis of morphological traits in 19 tomato genotypes.
In addition to the STRUCTURE and dendrogram analyses, the PCA of morphological features provided a good illustration of the phenotypic variation among tomato genotypes. Angoorlata, VR-1, and PB-UPMA are examples of distinct genotypes that exhibit distinct trait profiles, indicating their potential for breeding for stress tolerance, fruit size, or yield59,60. The efficacy of combining phenotypic and molecular data for germplasm evaluation is further supported by the excellent agreement between morphological PCA clusters and RAPD-based groupings57. The same quadrant positioning of DVRT-1 and PB Keshri further supports the findings of Parveen et al.58 by confirming their genetic and physical closeness.
To evaluate the molecular-level diversity among 19 tomato genotypes, genetic PCA based on RAPD markers was conducted (Fig. 5). Together, PC1 (28.61%) and PC2 (18.75%), the first two main components, accounted for 47.36% of the genetic variance. There was noticeable genetic heterogeneity as the genotypes were dispersed among several quadrants. High genetic distinctiveness was suggested by the places that the genotypes EC-538158, PDT-3-1-1, and H-86 held in the upper half of the PCA space. On the other hand, genotypes like PB-UPMA, EC-538423, and EC-538450 grouped together in the lower left quadrant, indicating a greater level of molecular similarity. Color-coded grouping was used to depict the 10 clusters that were obtained from the K-means analysis, exposing genetic structural patterns. Genotypes within the same K-means cluster generally appeared closer in PCA space, affirming the clustering accuracy.

Principal component analysis of RAPD marker data revealing molecular diversity among 19 tomato genotypes.
In addition to hierarchical clustering and STRUCTURE analysis, the genetic PCA provides a thorough display of molecular variation among tomato genotypes. The genetic heterogeneity present in the examined panel is emphasized by the dispersion throughout the PCA space. Significantly, genotypes like EC-538158 and PDT-3-1-1 highlighted their genetic uniqueness by demonstrating a greater degree of separation from the core group. This is consistent with the diversity shown in the STRUCTURE-based clusters and the dendrogram. The findings of Bhutia et al. 60 and Chaudhary et al. 60, who also used molecular markers to show significant genetic variation among tomato genotypes, are corroborated by the PCA results.
The congruence between cluster analysis and principal component dispersion, as reported by58, is further supported by the placement of genotypes such as PB Keshri, Angoorlata, and PB-UPMA into shared PCA quadrants, which confirms their genetic relatedness. The association between phenotypic and genotypic structure is confirmed by the molecular PCA, which also supports the morphological PCA, where a number of genotypes (such as PB-UPMA, VR-1, and Angoorlata) preserved comparable relative location. To increase selection efficiency and maximize parent choice for hybrid creation, tomato diversity research has placed a strong emphasis on such integrated approaches59.
The Analysis of Molecular Variance (AMOVA) revealed that 62.45% of the total genetic variation among the 19 tomato genotypes was attributed to differences between clusters identified through K-means clustering, indicating a strong population structure and substantial genetic differentiation among groups (Fig. 6). In contrast, 37.55% of the variation occurred within clusters, reflecting a moderate level of genetic diversity among genotypes within each group. These results suggest that the clustering method effectively captured the underlying genetic structure, highlighting the presence of well-defined and genetically distinct groups within the studied tomato genotypes.

AMOVA-based partitioning of genetic variation among and within tomato clusters.
Genetic dissimilarity matrix and cluster analysis based on morphological data
Morphological markers have been widely used to assess the genetic relationships among tomato germplasm and estimate the genetic diversity among 19 tomato accessions. The pooled quantitative data were analysed using numerical taxonomic techniques, specifically cluster analysis61, with the help of the NTSYS-pc software (Numerical Taxonomy and Multivariate Analysis System) version 2.2 to construct the dendrogram. The resulting dissimilarity coefficients were used to evaluate relationships among the tomato lines for cluster analysis. UPGMA-based clustering was performed using the SAHN module of NTSYS-pc. The genetic dissimilarity coefficients for the 19 tomato accessions based on morphological traits ranged from 0.019 to 0.994 (Table 4). The highest dissimilarity coefficient was observed between DVRT-2 and PB-UPMA, at 99.4%, and the lowest dissimilarity coefficient was found between EC-538158 and EC-538423, at 1.9%.
A dendrogram was constructed based on clustering of the 19 tomato accessions, as shown in Fig. 7. The resulting dendrogram divided the accessions into 5 distinct clusters: Cluster A, B, C, D, and E, containing 5, 3, 3, 2, and 2 accessions, respectively (Table 5). Cluster A was divided into two subclusters: A-1 and A-2. Subcluster A-1 consisted of only 2 accessions, PB Chhuhara and EC-538450, with a dissimilarity coefficient of 0.046. Subcluster A-2 included 3 accessions: EC-538158, EC-538423, and EC-538405. The maximum dissimilarity in Subcluster A-2 occurred between EC-538158 and EC-538405 (0.041), while the minimum dissimilarity was between EC-538158 and EC-538423 (0.019). Notably, DVRT-2 was isolated at the top of the dendrogram, and three genotypes (Angoorlata, EC-538155, and PDT-3-1-1) were isolated at the end of Cluster A. Cluster B consisted of 3 accessions: PB Keshri, IIHR-1, and DVRT-1. The maximum dissimilarity occurred between PB Keshri and DVRT-1 (0.069), and the minimum dissimilarity was between PB Keshri and IIHR-1 (0.055). Cluster C included 3 accessions: FED-2, BT-12, and H-86. The highest dissimilarity occurred between FED-2 and H-86 (0.128), and the lowest dissimilarity was between FED-2 and BT-12 (0.023). Cluster D contained only two accessions, FLA-7421 and VR-1, with a dissimilarity coefficient of 0.106. Cluster E also contained two accessions, VRT-2 and PB-UPMA, with a dissimilarity coefficient of 0.177. The dendrogram reveals significant genetic diversity among the tomato accessions and genotypes, indicating substantial variability within the germplasm. Similar findings have been reported by Shashikanth et al.62, Sharma et al.63, Chernet et al.64, Henareh et al.65 and Rashid et al.66. Based on the results of this study, it is recommended that breeding programs prioritize crosses between accessions or genotypes from Cluster A and Cluster E. This approach could aid breeders in selecting and identifying accessions or genotypes with desirable traits for inclusion in tomato breeding efforts.

UPGMA based cluster analysis of 19 tomato using morphological traits.
Molecular characterization
Molecular profiling of tomato accessions using RAPD primers
To assess genetic diversity among 19 tomato accessions, genomic DNA was amplified using 20 RAPD primers showed in Table 6. RAPD profiling of 19 tomato accessions using primer OPA-01 in Fig. 8 and OPA-20 in Fig. 9. This analysis revealed significant genetic variation, with 129 bands produced, of which 96 were polymorphic (72.63% polymorphism) and 31 were monomorphic. On average, each primer generated 6.45 bands, of which 4.8 were polymorphic and 1.55 were monomorphic. The polymorphism percentage varied between primers, with OPA-01 showing the highest polymorphism (100%), followed by OPA-20 and OPB-20 (90%), and OPA-03 showing the lowest (25%). OPA-01 generated the highest number of bands (12), while OPA-20 and OPB-20 each produced 9 bands, indicating substantial genetic diversity among the tomato accessions. The observed 72.63% polymorphism aligns with previous studies of Shah et al.67 reported an average 73.5% polymorphism, and Azhar et al.68 found 78% polymorphism across 15 tomato accessions. Comparatively, Mansy et al.16 also highlighted the effectiveness of RAPD markers in assessing genetic diversity under heat stress conditions, confirming their utility for identifying stress-tolerant genotypes. Similarly, Olawuyi and Ajie52 and Bădulescu et al.69 demonstrated RAPD marker efficiency in tomato molecular characterization, revealing substantial genetic variation among cultivars. Khan et al.53 emphasized the role of molecular markers in distinguishing morpho-molecular and biochemical variations, which is consistent with the high genetic differentiation observed in the present study. Additionally, Rasul et al.51 and Al-Khayri et al.70 used RAPD markers in population structure assessments and confirmed their robustness in identifying genetic variability, supporting the findings of the present research. The results further align with Ezekiel et al.14 and Gbadamosi et al.15 who demonstrated that RAPD markers are highly effective in revealing genetic relationships among diverse tomato genotypes.

RAPD profiling of 19 tomato accessions with primer OPA-01.

RAPD profiling of 19 tomato accessions with primer OPA-20.
Genetic similarity matrix and cluster analysis
Genetic relationships among 19 tomato accessions were assessed using RAPD markers and analysed with NTSYS-pc software. The genetic similarity coefficients, based on Jaccard’s coefficient, ranged from 0.605 to 0.915 (Table 7). The highest similarity (91.5%) was observed between PDT-3-1-1 and PB Keshri, and IIHR-1 and DVRT-1, while the lowest similarity (60.5%) was between EC-538155 and EC-538423. This indicates substantial genetic diversity (60–91%) among the genotypes. A dendrogram (Fig. 10) classified the 19 accessions into six distinct clusters: A, B, C, D, E, and F. Cluster A included DVRT-2, FED-2, and BT-12, with the highest similarity between DVRT-2 and FED-2 (0.845). Cluster B comprised PB Chhuhara, PDT-3-1-1, and PB Keshri, with the highest similarity between PDT-3-1-1 and PB Keshri (0.915). Cluster C, consisting of Angoorlata and EC-538450, showed a similarity of 0.86. Cluster D, subdivided into D-1 and D-2, contained EC-538405 and H-86 (similarity = 0.899), and IIHR-1 and DVRT-1 (similarity = 0.915), respectively. Cluster E, consisting of FLA-7421 and EC-538155, had a similarity of 0.806. Cluster F included VRT-2, VR-1, and PB-UPMA, with the highest similarity between VRT-2 and VR-1 (0.822) and the lowest between VRT-2 and PB-UPMA (0.729).

UPGMA based cluster analysis of 19 tomato cultivars using RAPD primers.
The dendrogram constructed through RAPD fingerprinting reveals significant genetic diversity and provides insights into the phylogenetic relationships among the tomato accessions. Similar studies have demonstrated the utility of RAPD markers in assessing genetic diversity and phylogenetic relationships in tomato by Ezekiel et al.14 and Elham et al.71. Recent studies have further corroborated the effectiveness of RAPD markers in evaluating genetic diversity among tomato genotypes. Similarly, a study by Manst et al.16 evaluated six tomato lines under heat stress at morphological, molecular, and cytological levels, demonstrating the utility of RAPD markers in genetic diversity analysis. These findings align with previous research of Shah et al.67, and reported an average polymorphism of 73.5% using RAPD markers, and Huh et al.72 found an average of 6.3 bands per primer. Collectively, these studies underscore the robustness of RAPD markers in revealing genetic variability among tomato accessions, thereby facilitating effective germplasm evaluation and utilization in breeding programs. RAPD analysis offers a powerful tool for understanding genetic variation, which is crucial for breeding programs aimed at improving tomato accessions. These findings align with previous reports on the genetic relationships within the Lycopersicon genus, supporting the application of molecular markers in selecting parent accessions for breeding.
Both dendrograms effectively group the 19 tomato accessions, but variations exist in clustering patterns, reflecting the influence of environmental factors on morphological traits compared to the genetic stability of molecular markers. PB-UPMA and DVRT-2, which exhibited the highest morphological dissimilarity (99.4%), also showed substantial genetic diversity in the RAPD-based dendrogram. PDT-3-1-1 and PB Keshri, with the highest molecular similarity (91.5%), formed a close cluster in both analyses, supporting the genetic resemblance detected via RAPD markers. Morphological clustering grouped FLA-7421 and VR-1 together, which was also observed in the RAPD dendrogram, suggesting that these accessions share genetic and phenotypic similarities. Some accessions, like EC-538405 and H-86, clustered differently in the two dendrograms, indicating possible environmental influences or epistatic interactions affecting morphological traits51,70,73,74, 76.
The accessions that showed consistent grouping in both dendrograms (e.g., PB Keshri and PDT-3-1-1) can be targeted for association mapping to identify RAPD markers linked to high yield or fruit quality. Divergent accessions (e.g., DVRT-2 and PB-UPMA) may carry novel genetic variations, useful for breeding programs focusing on stress tolerance or yield improvement. Locule number and fruit size showed strong variation, suggesting that RAPD markers associated with these traits could be validated using further genotypic-phenotypic correlations49,52,69.
The determination of genetic distance between genotypes is crucial for plant breeders, as it aids in selecting appropriate parent plants to create new genetic combinations. This is particularly important for developing accessions with enhanced resistance to pathogens and adverse environmental conditions75. The findings of this study provide valuable DNA-based marker information for commonly cultivated tomato genotypes in India. These insights have significant implications for breeding programs aimed at improving tomato accessions. Additionally, the results could support the development of a genetic map for tomato genotypes, enhancing efforts to improve genetic traits and support future tomato variety improvement programs.
Conclusion
This study highlights significant morphological and molecular diversity among 19 tomato accessions, with key traits such as plant height, fruit weight, and number of fruits per plant showing substantial variation. Five distinct genetic groups were identified, with RAPD markers confirming 72.63% polymorphism and genetic similarity ranging from 60.5 to 91.5%, validating the diversity observed. The integration of morphological and molecular analyses emphasizes the potential for selective breeding, particularly by utilizing genetically distant accessions for yield and quality enhancement. These findings provide a strong foundation for marker-assisted selection (MAS) and future genomic studies such as GWAS to identify key genes for stress tolerance and productivity. Further validation across diverse environments and integration with advanced genomic tools will enhance precision breeding, ensuring the development of high-yielding, climate-resilient tomato cultivars.
Data availability
The datasets used and/or analysed during the current study available from the corresponding author on reasonable request.
References
-
Nawaz, S., Chaudry, Z., Bibi, A., Jan, S. A. & Bibi, K. Agro-morphological and molecular characterization of local tomato cultivars grown in Pakhal region of Pakistan using RAPD markers. Middle-East J. Sci. Res. 23(5), 856–860 (2015).
-
Rick, C. M. Origin of cultivated tomato, current status of the problems. Abstract XI International Botanical Congress, 180 (1969).
-
Geetha, P. & Rani, C. I. Post-harvest technology and value addition of tomatoes. Food Sci. J. Res. 11(2), 217–229 (2019).
-
Hossain, M. M., Khalequzzaman, K. M., Hossain, M. A., Mollah, M. R. A. & Siddique, M. A. Influence of planting time on the extension of the picking period of four tomato varieties. J. Biol. Sci. 4, 616–619 (2004).
-
Li, T. S. C. Vegetables and fruits: Nutritional and therapeutic values (CRC Press, Boca Raton, 2008).
-
APEDA (2021 & 2022). Agricultural and Processed Food Products Export Development Authority, Ministry of Commerce and Industry, Govt. of India. (http://www.apeda.gov.in/ apedawebsite. html).
-
Kochieva, E. Z., Ryzhova, N. N., Khrapalova, I. A. & Phukhaskyi, V. A. Using RAPD for estimating genetic polymorphism in and phylogenetic relationships among species of the genus Lycopersicon (Tourn) Mill. Russian J. Genet. 38(9), 1104–1108 (2002).
-
Foolad, R. M. Genome mapping and molecular breeding of tomato. Int. J. Plant Genomics. 2007, 52 (2007).
-
Poczai, P., Varga, I., Bell, N. E. & Hyvönen, J. Genetic diversity assessment of bittersweet (Solanum dulcamara, Solanaceae) germplasm using conserved DNA-derived polymorphism and intron-targeting markers. Ann. Appl. Biol. 159(1), 141–153. https://doi.org/10.1111/j.1744-7348.2011.00482.x (2011).
-
Herison, C., Handajaningsih, M., Fahrurrozi, F. & Rustikawati, R. Wet season trials on growth and yield of six newly developed chili pepper hybrids at three different locations. IJASEIT Int. J. Adv. Sci. Eng. Inf. Technol. 7(5), 1913–1919 (2017).
-
Tanksley, S. D. et al. High density molecular linkage maps of the tomato and potato genomes. Genetics 132(4), 1141–1160 (1992).
-
Kumar, S. et al. Hybrid seed production of solanaceous vegetables. A practical manual. IIVR Tech. Bull. 9, 1–34 (2003).
-
Garcia, A. A. F., Benchimol, L. L., Barbosa, A. M. M., Geraldi, I. O. & Souza, C. L. Comparison of RAPD, RFLP, AFLP, and SSR markers for diversity studies in tropical maize inbred lines. Genet. Mol. Biol. 27, 579–588 (2004).
-
Ezekiel, C. N., Nwangburuka, C. C., Ajibade, O. A. & Odebode, A. C. Genetic diversity in 14 tomato (Lycopersicon esculentum Mill.) varieties in Nigerian markets by RAPD-PCR technique. Afr. J. Biotechnol. 10(25), 4961–4967 (2011).
-
Gbadamosi, A. E., Ajayi, A. T., Osekita, O. S. & Omotuyi, I. O. Genetic diversity in tomato accessions [Solanum lycopersicum (L.) H. Karst] from Nigeria employing morphological and SSR markers. Plant Physiol. Rep. https://doi.org/10.1007/s40502-020-00531-7 (2020).
-
El-Mansy, A. B. et al. Genetic diversity analysis of tomato (Solanum lycopersicum L.) with morphological, cytological, and molecular markers under heat stress. Horticulturae 7(4), 65 (2021).
-
Osei, M. K., Bonsu, K. O., Agyeman, A. & Choi, H. S. Genetic diversity of tomato germplasm in Ghana using morphological characters. Int. J. Plant Soil Sci. 3(3), 220–231 (2014).
-
Herison, C., Sutjahjo, S. H., Sulastrini, I., Rustikawati, R. & Marwiyah, S. Genetic diversity analysis in 27 tomato accessions using morphological and molecular markers. AGRIVITA J. Agric. Sci. 40(1), 36–44 (2018).
-
Singh, M., Singh, N. P., Arya, S., Singh, B. & Vaishali, V. Diversity analysis of tomato germplasm (Lycopersicom esculentum Markers) using SSR. Int. J. Agric. Sci. Res. (IJASR) 4(4), 41–48 (2014).
-
Williams, J. G. K., Hanafey, M. K., Rafalski, J. A. & Tingey, S. V. Genetic analysis using random amplified polymorphic DNA markers. Methods Enzymol. 218, 704–740 (1993).
-
Sharma A. K, Sharma, A. Plant Chromosomes Analysis Manipulation and Engineering. ISBN. 90(3), 5702–387 (1999).
-
Murray, H. G. & Thompson, W. F. Rapid isolation of high molecular weight DNA. Nucleic Acids Res. 8, 4321–4325 (1980).
-
Williams, J. G. K., Kubelik, A. R., Livak, K. J., Rafalski, J. A. & Tingey, S. V. DNA polymorphisms amplified by arbitrary primers are useful as genetic markers. Nucleic Acids Res. 18, 6531–6535 (1990).
-
Sonker, S., Sharma, T. & Tandan, N. SSR-based molecular characterization and diversity analysis of cowpea. Plant Arch. 19(1), 995–1001 (2019).
-
Sharma, T., Kumar, A., Dwivedi, S. C. & Vyas, R. P. Molecular characterization and genetic diversity analysis of selected maize inbreds using SSR markers. J. Environ. Biol. 39(2), 228–236 (2018).
-
Ward, J. H. Hierarchical grouping to optimize an objective function. J. Am. Stat. Assoc. 58, 236–244 (1963).
-
Rohlf, F. J. NTSYS-pc: Numerical taxonomy and multivariate analysis system, Version 2.1 (Exeter Publications, 2000).
-
Pritchard, J. K., Stephens, M. & Donnelly, P. Inference of population structure using multilocus genotype data. Genetics 155, 945–959 (2000).
-
Evanno, G., Regnaut, S. & Goudet, J. Detecting the number of clusters of individuals using the software STRUCTURE: A simulation study. Mol. Ecol. 14, 2611–2620 (2005).
-
Jombart, T. adegenet: A R package for the multivariate analysis of genetic markers. Bioinformatics 24, 1403–1405 (2008).
-
Jombart, T., Devillard, S. & Balloux, F. Discriminant analysis of principal components: A new method for the analysis of genetically structured populations. BMC Genet. 11, 94 (2010).
-
Peakall, R. & Smouse, P. E. GenAlEx 6.5: Genetic analysis in Excel. Population genetic software for teaching and research—an update. Mol. Ecol. Resour. 12, 187–192 (2012).
-
R Core Team. R: A language and environment for statistical computing (R Foundation for Statistical Computing, Vienna, 2021).
-
Wickham, H. ggplot2: Elegant graphics for data analysis (Springer-Verlag, 2016).
-
Kumar, A., Yadav, R. S. & Kumar, R. Estimation of genetic parameters and correlation between morphological traits in selected chickpea (Cicer arietinum L.) accessions. Plant Arch. 13(2), 719–723 (2013).
-
Kumar, A., Yadav, R. S. & Kumar, R. Assessment of variability and relationship among some quantitative traits in elite accessions of chickpea (Cicer arietinum L.). Prog. Agric. 14(1), 63–68 (2014).
-
Sharma, T., Kumar, A., Dwivedi, S. C. & Vyas, R. P. Estimate of genetic factors and correlation analysis in maize (Zea mays L.). Plant Arch. 14(1), 19–21 (2014).
-
Taiana, T., Harun-Ur-Rashid, M., Parveen, S., Sarowar, H. M. & Azadul, H. M. Selection strategies to choose better parents in tomato using genetic parameters. Plant Knowl. J. 4(1), 33–39 (2015).
-
Mohanty, B. K. Studies on variability, heritability, interrelationship, and path analysis in tomato. Ann. Agric. Res. 33, 65–69 (2002).
-
Lecomte, L. et al. Fine mapping of QTLs of chromosome 2 affecting the fruit architecture and composition of tomato. Mol. Breed. 13(1), 1–14 (2004).
-
Ghosh, K. P., Islam, A. K. A., Mian, M. A. K. & Hossain, M. M. Variability and character association in F2 segregating population of different commercial hybrids of tomato (Solanum lycopersicum Mill.). J. Appl. Sci. Environ. Manag. 14(2), 91–95 (2010).
-
Bernousi, I., Emami, T. A., Darvishzadeh, M. & Henareh, M. Studies on genetic variability and correlation among the different traits in tomato (Solanum lycopersicum Mill.). Notulae Botanicae Horti Agrobotanici, Cluz-Napoca 39(1), 152–158 (2011).
-
Manna, M. & Paul, A. Studies on genetic variability and character association of fruit quality parameter in tomato (Solanum lycopersicum Mill.). HortFlora Res. Spectr. 1(2), 110–116 (2012).
-
Naik, A. Characterization of fenugreek (Trigonella foenumgraecum L.) genotypes through morphological characters. Int. J. Agric. Environ. Biotechnol. 5(4), 445–449 (2012).
-
Patel, S. A., Kshirsagar, D. B., Bhalekar, M. N. & Khute, N. S. Correlation studies in tomato (Solanum Lycopersicum Mill.). Veg. Sci. 40(2), 217–218 (2013).
-
Agrawal, A., Arya, N. & Ahmed, Z. Genetic variability studies in tomato (Solanum Lycopersicum Mill.). Progress. Hortic. 46(2), 50–52 (2014).
-
Khapte, P. S. & Jansirani, P. Genetic variability and performance studies of tomato (Solanum lycopersicum Mill.) genotypes for fruit quality and yield. Trends Biosci. 7(12), 1246 (2014).
-
Prajapati, S., Tiwari, A., Kadwey, S. & Jamkar, T. Genetic variability, heritability and genetic advance in tomato (Solanum Lycopersicon Mill.). IJAEB 8(2), 245–251 (2015).
-
Anjum, S. et al. Genetic divergence for seedling and qualitative traits of tomato (Solanum lycopersicum) germplasm. Pure Appl. Biol. 9(1), 776–789 (2020).
-
Islam, S., Hassan, L. & Hossain, M. A. Breeding potential of some exotic tomato lines: A combined study of morphological variability, genetic divergence, and association of traits. Phyton https://doi.org/10.32604/phyton.2022.017251 (2021).
-
Rasul, K. S., Grundler, F. M. W. & Tahir, N. A. Genetic diversity and population structure assessment of Iraqi tomato accessions using fruit characteristics and molecular markers. Hortic. Environ. Biotechnol. 63, 523–538 (2022).
-
Olawuyi, O. J. & Ajie, V. I. Diverse morphological and molecular patterns of tomato (Solanum lycopersicum Linn.) accessions. Plant Gene https://doi.org/10.1016/j.plgene.2023.100423 (2023).
-
Khan, T. et al. Genetic and phenotypic diversity in Solanum lycopersicum genotypes: Insights from morpho-molecular and biochemical analyses. Plant Biotechnol. Rep. https://doi.org/10.1007/s11816-024-00894-5 (2024).
-
Kumar, R., Sharma, V. K. & Sharma, B. B. Correlation and path coefficient analysis for yield and yield contributing traits in sweet pepper (Capsicum annuum L.). J. Hill Agric. 7(2), 188–192 (2016).
-
Meena, S. R., Meena, O. P. & Choudhary, R. C. Genetic diversity studies in bell pepper (Capsicum annuum L.) using morphological and quality traits. Veg. Sci. 49(1), 75–82 (2022).
-
Bai, Y. et al. Cross-species amplification of tomato SSR markers in eggplant and pepper. Theor. Appl. Genet. 107, 544–550. https://doi.org/10.1007/s00122-003-1265-5 (2003).
-
Bhutia, N. D., Zorammuana, S. & Shingh, D. B. Assessment of genetic diversity in tomato using RAPD markers. J. Pharmacogn. Phytochem. 7(5), 2835–2840 (2018).
-
Parveen, K., Rajpoot, M. S. & Ahmad, A. Molecular characterization and diversity analysis in tomato (Solanum lycopersicum L.) using RAPD markers. J. Pharmacogn. Phytochem. 8(3), 350–356 (2019).
-
Hazra, P., Chattopadhyay, A., Karmakar, K. & Dutta, S. Modern technology for vegetable production (New India Publishing Agency, 2011).
-
Chaudhary, R. C., Singh, A. & Meena, O. P. Genetic divergence studies in tomato (Solanum lycopersicum L.) based on morphological and molecular markers. Int. J. Agric. Sci. 7(11), 795–798 (2015).
-
Sneath, P. H. A. & Sokal, R. R. Numerical taxonomy: The principles and practice of numerical classification 573 (W.F. Freeman & Co., 1973).
-
Shashikanth, N. B., Hosamani, R. M. & Patil, B. C. Genetic variability in tomato (Solanum lycopersicon [Mill.] Wettsd.). Karnataka J. Agric. Sci. 23(3), 536–537 (2010).
-
Sharma, T., Kumar, A., Dwivedi, S. C. & Vyas, R. P. Assessment of genetic diversity of maize inbred lines using morphological traits. Plant Arch. 13(1), 477–480 (2013).
-
Chernet, S., Belew, D. & Abay, F. Genetic diversity studies for quantitative traits of tomato (Solanum lycopersicon L.) genotypes in Western Tigray, Northern Ethiopia. J. Plant Breed. Crop Sci. 6(9), 105–113 (2014).
-
Henareh, M., Dursun, A. & Mandoulakani, B. A. Genetic diversity in tomato landraces collected from Turkey and Iran revealed by morphological characters. Acta Sci. Pol. Hortorum Cultus. 14(2), 87–96 (2015).
-
Rashid, S., Abbas, M., Bano, Q., Javed, A. & Akram, A. Genetic diversity assessment of tomato (Solanum lycopersicum L.) germplasm based on agro-morphological traits. Adv. Plants Agric. Res. 3(3), 00097 (2016).
-
Shah, M. A. et al. Genetic diversity of some tomato cultivars and breeding lines commonly used in Pakistani breeding programs. Turk. J. Agric.-Food Sci. Technol. 3(3), 126–132 (2015).
-
Azhar, S. M. et al. Genetic diversity of some tomato cultivars and breeding lines commonly used in Pakistani breeding programs. Turk. J. Agric.-Food Sci. Technol. 3(3), 126–132 (2015).
-
Bădulescu, A., Popescu, C. F., Dumitru, A. M. & Sumedrea, D. I. New varieties of tomato – morphological aspects and molecular characterisation with RAPD and SSR markers. Notulae Scientia Biologicae 12(4), 818–828 (2020).
-
Al-Khayri, J. M. et al. Pre-breeding genetic diversity assessment of tomato (Solanum lycopersicum L.) cultivars based on molecular, morphological, and physicochemical parameters. Phyton https://doi.org/10.32604/phyton.2023.027375 (2023).
-
Elham, A. A. et al. Phylogenetic diversity and relationships of some tomato varieties by electrophoretic protein and RAPD analysis. J. Am. Sci. 6(11), 434–441 (2010).
-
Huh, M. K., Youn, S. J. & Kang, S. C. Identification and genetic diversity of Korean tomato cultivars by RAPD markers. J. Life Sci. 21(1), 15–21 (2011).
-
Yadav, L. P. et al. Genetic diversity, morphological and quality traits of Momordica dioica. Sci. Rep. 14, 30241. https://doi.org/10.1038/s41598-024-81828-7 (2024).
-
Yadav, L. P. et al. Genetic variability, morphological diversity, and antioxidant potential in gynoecious Coccinia accessions: Implications for breeding and biofortification. BMC Plant Biol. https://doi.org/10.1186/s12870-025-06335-x (2025).
-
Weeden, N. F. Inheritance and reliability of RAPD markers. in Application of RAPD technology to plant breeding. pp. 12-17 (1992).
-
Yadav, L. P. et al. Genetic diversity, morphological traits, quality traits and antioxidants potentiality of Coccinia grandis germplasm under rainfed semi-arid region. Sci Rep 14, 868 https://doi.org/10.1038/s41598-023-49091-4 (2024).
-
Yadav, L. P. et al. Thar Anant: Lycopene rich and heat tolerant variety of Tomato. Current Horticulture, 9(1), 68–68 (2021).
-
Yadav, L. P. et al. Thar Anant: Lycopene rich heat tolerant variety of tomato suitable for arid and semi-arid regions. Indian Horticulture, 65(4), https://epubs.icar.org.in/index.php/IndHort/article/view/107281(2020).
Funding
Authors are thankful to the Ongoing Research Funding program, (ORF-2025-194), King Saud University, Riyadh, Saudi Arabia.
Ethics declarations
Competing interests
The authors declare that they have no competing interests.
Ethical approval
Not applicable.
Rights and permissions
Open Access This article is licensed under a Creative Commons Attribution-NonCommercial-NoDerivatives 4.0 International License, which permits any non-commercial use, sharing, distribution and reproduction in any medium or format, as long as you give appropriate credit to the original author(s) and the source, provide a link to the Creative Commons licence, and indicate if you modified the licensed material. You do not have permission under this licence to share adapted material derived from this article or parts of it. The images or other third party material in this article are included in the article’s Creative Commons licence, unless indicated otherwise in a credit line to the material. If material is not included in the article’s Creative Commons licence and your intended use is not permitted by statutory regulation or exceeds the permitted use, you will need to obtain permission directly from the copyright holder. To view a copy of this licence, visit http://creativecommons.org/licenses/by-nc-nd/4.0/.
About this article

Cite this article
Yadav, A., Singh, R., Yadav, V. et al. Assessment of morphological and molecular diversity in tomato accessions using quantitative traits and RAPD markers. Sci Rep 15, 37151 (2025). https://doi.org/10.1038/s41598-025-21062-x
-
Received:
-
Accepted:
-
Published:
-
DOI: https://doi.org/10.1038/s41598-025-21062-x