
Introduction
Rapid industrialization and increased human activities escalated the issue of water pollution and shortage of resources encouraged researchers to treat the polluted water with energy efficient technologies1,2,3. Since wastewater treatment is an energy intensive process hence new technological innovations are explored to reduce the wastewater treatment cost. Microbial fuel cell (MFC) is one such environment friendly technique, which produces electricity from wastewater rich in oxidizable organic matter by redox reactions4,5. Conventional MFC has wastewater and bacteria at the anode, which undergoes oxidative degradation of organic matter, producing electrons and protons6. The protons pass via the proton exchange membrane to the cathode and combine with oxygen and electrons to produce water. However, a dual-chamber photosynthetic microalgae-assisted microbial fuel cell (PMA-MFC) has a unique configuration of MFC wherein CO2 is produced in the dark anodic chamber, while the photosynthetic cathodic chamber, containing live microalgae, utilizes this CO2 7. Moreover, microalgae provide free oxygen during photosynthesis for the oxidation-reduction reaction8. Higher the division of microalgae, the more oxygen is produced, resulting in increased power output9. However, as the cell density increases and reaches a plateau, the division stops, and the shading effect and light attenuation to deeper layers limit oxygen production and hence all other associated mechanisms linked with that system10. The light and dark reactions of the cathode are provided in following Eqs. (1) to (3)11,12.
$$text{Light reaction at cathode} :6text{C}text{O}_text{2}:+:{12text{H}}^{+}:+:12{e}^{-}:to::text{C}_text{6}text{H}_text{12}text{O}_text{6}:+:3text{O}_text{2}:$$
(1)
$$text{Dark reaction} :text{C}_text{6}text{H}_text{12}text{O}_text{6}:+6text{O}_text{2}:to::6text{C}text{O}_text{2}:+:6text{H}_text{2}text{O}:$$
(2)
$$text{Cathodic reaction} :text{O}_text{2}:+:4{text{H}}^{+}+::4{e}^{-}to::2text{H}_text{2}text{O}$$
(3)
Hybridizing the algal cathodic chamber or photobioreactor with wastewater in anodic chamber for bioelectricity production makes the MFC technology economical as well as promising13. Microalgae can be used both at anode as well as cathode for multiple resource recovery. Studies have demonstrated use of some common microalgae used at cathode in a PMA-MFC like Spirulina14Chlorella vulgaris15Synechococcus sp16. C. pyrenoidosa, Scenedesmus obliquus, Spirulina, Microcystis aeruginosa, and Chlamydomonas reinhardtii17. One such microalgae not yet tested in a PMA-MFC is Haematococcus lacustris. Among the various pigments harvested from microalgae, astaxanthin from H. lacustris has a high market cost. It was 7500 USD kg− 1 in year 2022 based on its annual growth rate18with its overall production in market projected to rise by 965 million US dollars by 202619,20,21.
During stress, the Haematococcus cells double in their size, hence harvesting astaxanthin becomes tedious and expensive22,23. To address the high cost of algal pigments, PMA-MFC can play a pivotal role in economical and multiple resource recovery in the form of biomass, carotenoids, and lipids from H. lacustris, while the hybridized reactor treats wastewater and generates bioelectricity24,25. However, efforts are required to operate this technology efficiently on a large scale. This might include designing a more efficient coupling system for reducing cost and increasing photosynthetic conversion efficiency. At anode, the dead microalgae powder can be additionally used as a substitute for organic matter to produce electrons via oxidation during respiration or fermentation and also as adsorbent for pollutants26,27,28. Khan et al. (2022), demonstrated that diatom Nitzschia palea acted as biocatalyst at anode producing a maximum polarisation power density (PDmax) of up to 13 mW m− 2 and coulombic efficiency (CE) of 23%29.
In the present investigation, H. lacustris was isolated and screened using Molecular Identifier (MID) Analysis. It has been used for the first time in PMA-MFC to test its efficacy in hybridized algal photobioreactor compared to flask grown cultures. The present study thus focuses on a sustainable approach for PMA-MFC operating under different setup conditions for wastewater remediation and resource recovery. The research also emphasizes characterizing microbes present in it using metagenomic analysis. This is done to evaluate population diversity and relative abundance and the efficiency of these microbes in a PMA-MFC.
Results and discussions
The aim of this research was to develop the PMA-MFC system using microalgae H. lacustris in the cathodic chamber. Furthermore, the microbial communities at the anode were investigated by metagenomics to check potential microbes catalysing the organic matter for bioelectricity production. Hence, this investigation will prove to be of great value for remediating wastewater, producing bioelectricity, analysing the population of dominant electrogenic microbes, and recovering value-added products from H. lacustris, during the electrochemical redox reactions in a PMA-MFCt1, PMA-MFCt2, PMA-MFCnw and PMA0-MFC system (Supplementary file Fig. S1).
Performance of the photosynthetic microalgal microbial fuel cell test
Physiochemical parameters at anode and cathode
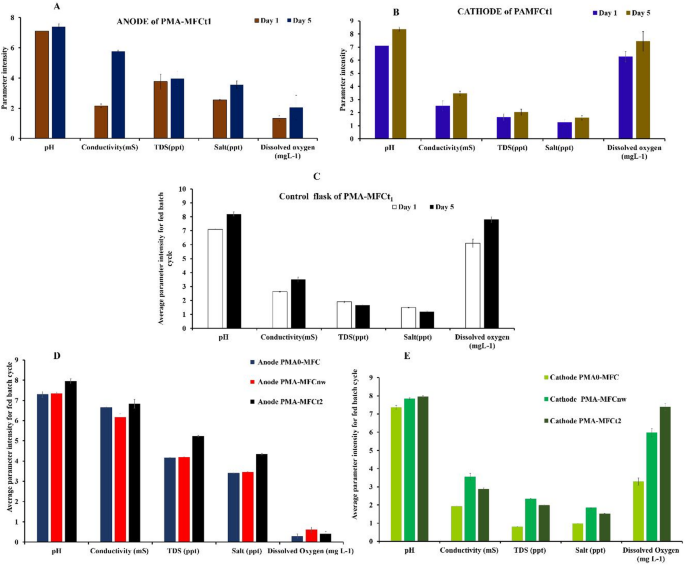
In PMA-MFCt1, the DO value showed no significant changes at the anode after five fed batch cycle and was 1.33 mg L−1 on day 1 and 2.04 mg L−1 on day 5 (Fig. 1A). However, the DO level in the catholyte was 6.26 mg L−1 on day 1 and reached to 7.43 mg L−1 on day 5, and it has been a source for sustaining continuous oxygen production due to photosynthesis (Fig. 1B). Increasing DO at cathode ensures continuous power generation and supportive reactor efficiency in a PMA-MFCt1. In the cathodic chamber of PMA-MFCs, DO acts as an electron acceptor, and electron generation occurs on the anode side. This synergistic mechanism overall affects the total power output at anode and bioproducts recovery at cathode. Different species of microalgae have different biomass productivity and hence different resulting DO values30. Besides the type of microalgae, temperature, and light intensities also play a very important role in achieving the desired DO in a particular MFC31. Cyanobacteria, mostly C. vulgaris are generally used in a PMA-MFC to boost its power output, cell density, lipids and value-added products and with its DO reaching to 6.38 mg L− 1 after the fed batch cycle32.
The pH values of the medium in both anodic and cathodic chambers were monitored regularly to observe any major differences that may influence the overall performance of the MFC. The average pH values of anolyte were 7.1 on day 1 and 7.4 on day 5 (Fig. 1A). The increase in pH at anode is due to proton migration out of the anodic chamber, limited back-diffusion of H+ and possible OH− migration from cathode33. The average pH of catholyte in PMA-MFCt1 increased from 7.12 on day 1 to 8.37 on the day 5, coherent with reports in previous investigations, where pH of the catholyte having C. vulgaris changed from 7.3 to 8.3 on the initial and final days of polarisations 34,35 (Fig. 1B). In a study where C. vulgaris was introduced to the cathodic chamber, the catholyte’s pH increased from approximately 7.5 to a range of 8.5–9.0 during the experiment, correlating with enhanced algal growth, oxygen production and power density achieved (24.4 mW m−2)36.
Liu et al.37 demonstrated that in the MFC with C. vulgaris as a biocathode the catholyte’s pH rose to above 12. The wastewater in the anodic chamber of PMA-MFCt1 showed some changes in conductivity, total dissolved solids (TDS) and salt concentrations too. The conductivity was higher in anodic chamber, 2.16 mS on day 1 and 5.77 mS on day 5 compared to 2.52 mS on day 1 and 3.17 mS on day 5 in cathodic chamber (Fig. 1A,B). The significant increase in conductivity at the anodic chamber suggests metabolism of electroactive bacteria, which break down organic substrates and release ions, leading to increased conductivity38,39. This rise is beneficial as it can enhance electron transfer efficiency, improving the power generation capabilities of the MFC. However, at the cathode there was not much change in average conductivity, being 2.5 mS on day 1 and 3.5 mS on the day 5 of the polarisation cycle. Little enhancement in conductivity indicates a slower accumulation of ions compared to the anode. This slowdown could be due to the relatively stable conditions in the cathode, where photosynthetic activity by microalgae may also affect ionic balance.
The average TDS measured in parts per thousand (ppt) at the anodic chamber of PMA-MFCt1 was 3.77 ppt and 3.95 ppt on day 1 and day 5, respectively. The TDS of catholyte was significantly lower than anolyte; however, it showed an increasing trend over operational time (1.64 ppt on day 1 to 2.02 ppt by day 5). The difference in TDS levels between the two chambers of PMA-MFCt1 serves as a proxy for ion movements and electrochemical gradients, which are crucial for generating the proton exchange between anode and cathode that drives current production. TDS may decrease or increase depending upon microalgal photosynthetic activity at the cathode of a PMA-MFCt1. If microalgae are actively assimilating nitrates, phosphates, and other nutrients, with time TDS will decrease, and if microalgae are releasing certain extracellular or intracellular organic compounds, TDS may increase40.
The average salinity in PMA-MFCt1 in the anode salinity 2.54 ppt and 3.55 ppt was higher (Fig. 1D) than that in cathode chamber was 1.25 ppt and 1.60 ppt on day 1 and day 5 respectively (Fig. 1E). This is probably due to accumulation of ionic products in anode due to bacterial activity, whereas decrease in electrolyte salinity at cathode is due to algal cells adsorbing metal ions and salts reducing free ionic concentrations41.
In control conical flask for PMA-MFCt1 having H. lacustris kept under the same laboratory conditions, the DO of control on day 1 and day 5 was 6.43 mg L−1 and 8.03 mg L−1 on day 5 (Fig. 1C). The DO in control on day 5 was slightly higher than in catholyte of test PMA-MFCt1 (7.43 mg L−1). This was followed by the pH, conductivity, TDS and salt to be 7.13, 2.65 mS, 1.89 ppt, 1.46 ppt, respectively; on day 1. Similarly on day 5 these parameters viz., the pH, conductivity, TDS and salt were 8.33, 3.40 mS, 1.67 ppt, 1.24 ppt respectively. As can be seen these values in control having H.lacustris were close in terms of pH, conductivity and DO with H. lacustris at cathode of PMA-MFCt1 h. However, TDS and salinity of H. lacustris in control flask showed variation when compared to that of catholyte of test, PMA-MFCt1. As reported in earlier research where Spirulina was used at cathode in a PMA-MFC using swine wastewater at anode, it was observed that the pH in cathode of a PMA-MFC was higher (0.5–1 unit) compared to that in MFC free cultures or open conical flasks as controls14.
Similarly, another set of PMA-MFC was run simultaneously; one was PMA-MFCt2, which was a replica of test PMA-MFCt1with difference of nutrient media at cathode being replinished in PMA-MFC t1 and not in PMA-MFCt2.The control for PMA-MFCt2 was PMA-MFCnw with its electrode wires not connected (just like control flask of PMA-MFCt1 but here as apart of PMA-MFC system), hence no polarisation data was recorded. The aim to take PMA-MFCnw was to compare physiochemical parameters, and microalgal cell growth at cathode with and without wires connected. Additionally, a set, PMA0-MFC was taken as reference, in which cathode was replaced with only water. This was done to see the role or efficiency of PMA-MFC without microalgae at the cathode. The average physicochemical parameters of PMA-MFCt2, PMA-MFCnw and PMA0-MFC at anode and cathode are shown in Fig. 1D,E. However, these parameters with respect to the run time of a reactor (40 days) are presented in Supplementary Fig. S2.
At anode, it is seen that the pH, conductivity, TDS, and salt of PMA-MFCt2 are higher (pH 7.9; conductivity 6.8 mS, TDS 5.2 ppt, salt 4.3 ppt than PMA-MFCnw and PMA0-MFC. The DO at anode in PMA-MFCt2 was 0.4 mg L−1, PMA-MFCnw was 0.6 mg L−1 and that of PMA0-MFC DO was 0.28 mg L−1, which were less than 1 mg L−1 indicating anaerobic conditions. At the cathode, the pH of PMA-MFCt2 is 7.94, and the pH of PMA-MFCnw was nearly the same 7.84; however, in PMA0-MFC, in which the cathode had tap water, the pH was 7.36. It was seen that at cathode where microalgae were present in PMA-MFCt2 and PMA-MFCnw, the latter showed higher conductivity (3.55 mS), TDS (2.34 ppt), salt (1.84 ppt) compared to PMA-MFCt2. The PMA0-MFC, although showed the least comparative values for these parameters, being (pH 7.3, conductivity 1.92 mS, TDS 0.80 ppt, salt 0.97 ppt) at cathode.
The average DO at cathode was also the least in PMA0-MFC, being 3.29 mgL−1, with PMA-MFCnw at 5.97 mg L−1 and that at PMA-MFCt2 at 7.39 mg L−1. This clearly shows that that PMA-MFC with only water has least DO compared to those PMA-MFC’s with microalgae at cathode. Comparing the connection/disconnection of electric load influences the oxygen reduction pathway (ORR) in biological process of PMA-MFC’s. In PMA-MFCt2 oxygen is being consumed in ORR , however, the microalgae are stimulated to produce more oxygen, due to higher oxygen demand. This oxygen reduction drives the cathodic reaction, thus creating a demand for electrons, enhancing electron transfer from the anode and sustaining the electrochemical circuit11. However, in PMA-MFCnw, oxygen is produced by microalgae by photosynthesis, but there is no pull or stimulus for producing more of oxygen42. This leads to differences in the ionic balances and hence varied changes in physiochemical parameters at different electrolytes in different PMA-MFC’s.
Voltage, polarization curve and power density
It was observed that during start-up time, the open circuit voltage (OCV) value was 543.93 mV for PMA-MFCt1. On the offset, OV in the PMA-MFCt1 was lower, and, after 2 days it started giving stable voltage performance. After 48 h, PMA-MFCt1 showed daily OV values of 257.70 ± 15.00 mV. Thereafter, the power output and current density were estimated by polarization curve for PMA-MFCt1 using different external resistances (20,000 Ω to 50 Ω). The net power of the PMA-MFCt1 was 220.12 mW with a net current of 0.86 mA and a voltage of 256.97 mV at 300 Ω based on daily OV values. Mehrotra et al. (2021) used Scenedesmus dimorphus in cathodic chamber and achieved voltage of 285.70 ± 0.45 mV at 720 Ω43. Moreover, the highest voltage, 0.35 V, was reported in a dual-chamber MFC with mixed microalgae Chlorella sp., Desmodesus sp. and Scenedesmus sp. at cathode44. The anode of PAMFCt1 demonstrated a high PDmax of 33.76 mW m−2 with 1250 mL of synthetic wastewater (SWW) in anodic chamber and algal nutrient media (BG-11) supporting the growth of H.lacustris in the cathodic chamber (Fig. 2A). The PDmax reached a maximum current density value of 115.75 mA m−2 at an external resistance of 300 Ω in PMA-MFCt1. Similarly, PMA-MFCt2 showed a PDmax of 15.36 mW m−2 at current density of 106.67 mAm−2 (Fig. 2B) and PMA0-MFC showed PDmax of 8.05 mWm−2 and a current density of 57.92 mAm−2 (Fig. 2C) at resistance of 300 Ω. The treatment of wastewater and concurrent CE output of the PMA-MFC were used to estimate the performance and remediation efficiency. In this experiment, initially the COD removal from SWW on day 5 of PMA-MFCt1 operation was 46.42% and it was 68.05% in PMA-MFCt2 and 63.43% in PMA0-MFC (Fig. 2D).
High PDmax (33.76 mW m− 2) and lower COD (46%) in PMA-MFCt1 compared to higher COD removal and low PDmax in PMA-MFCt2 is mainly due to the replenished media in PMA-MFCt1. This leads to microalgae multiplication, and hence stable electron flow resulting into high PDmax. On the offset, frequent addition of media at cathode may result in slowing down proton flow, disturbing ionic balance, and thus affecting anode metabolism. A disturbed ionic balance in dual-chamber MFCs can suppress the proton transfer across the membrane, resulting in increased internal resistance and reduced voltage output. Replenishing media also affects the concentration gradient, impacting charge carrier mobility across the clay separator48. High COD (68.05%) at PMA-MFCt2 might be due to pH or ionic imbalances leading microbial communities at anode to undergo stress, shifting towards more oxidizing organic matter.
In PMA0-MFC, as discussed earlier, no constant oxygen supply was there because no living microalgae used at the cathode, which resulted in the lowest PDmax (8.05 mW m−2). However, as there is no dilution or sample taken out from cathodic chamber in PMA0-MFC, the ionic balance is maintained, not putting the microbial communities in stress, leading to high COD removal of 63.43%. When conferring wastewater treatment, total COD removal is a crucial factor that regulates the efficiency of any treatment system and depends on the higher activity of the anodic microbes for degradation of the organic matter present in the wastewater. The COD removal in this experiment demonstrates that the PMA-MFC is effective in reducing organic load over a short operational period in different PMA-MFCs, ranging from 46 to 68%. In an algal-microbial fuel cell where dairy wastewater at anode was treated using Scenedesmus dimorphus at cathode, the COD removal was 72% in 3-day fed-batch cycle mode43. The output voltage is positively related to COD removal efficiency and the pH at the anode.
Moreover, Coulombic efficiency (CE) and stability of power output both play important roles in the practical applicability of the MFCs. The CE for the PMA-MFCt1 was 5%, 1.7% for PMA-MFCt2 and it was 1.77% for PMA0-MFC, since PMA-MFCnw was open circuit no CE for it, indicating important electron loss in different metabolic processes6,47,49,50. Despite the increase in power density from 8.05mW m−2 to 33.76 mW m−2 across PMA0-MFC and PMA-MFCt1, the CE remained low (1.7–5%), suggesting that a significant portion of electrons from substrate oxidation were diverted to competing metabolic processes such as methanogenesis or aerobic respiration. This aligns with observations in other investigations, where MFCs demonstrated low CE despite high power due to anodic microbial inefficiencies51,52. The CE ranging from 0.8% to 1.9% has been reported in MFC while treating urban wastewater53. In a dual-chamber MFC, Chlamydomnas reinhardtii at cathode demonstrated CE of 9%17.
The obtained PDmax for PMA-MFCt1 (33.76 mW m−2) is compared to other PAMFCt2, PMA0-MFC, and other previous studies (Table 1). A study in an MFC with tapioca wastewater at anode and Spirulina platensis at cathode attained PDmax value of 14.47 mW m−254. In clay-based dual-chamber MFC, where Chlorella sp. was used in cathodic chamber, the current production was 3.1 mA with 0.852 V constant voltage generation and PDmax value of 54.48 mW m−246. In yet another study, the PDmax of PMA-MFC containing C. pyrenoidosa was 30.15 mW m−255. Scenedesmus sp. was used as microalgal powder at anode and C. vulgaris AG30007 UTEX 0000265 was used as biocathode in a dual-chamber MFC with highest recorded PDmax of 1926 ± 21.4 mW m−2 56. This was associated with CE of 6.3%. Additionally, the microalgae at cathode (C. vulgaris) lead to the production of biomass of 1247 mg L− 156.
The growth kinetics of C. vulgaris (FACHB-26) in the cathodic chamber of a MFC showed a biomass concentration of 0.376 gL−157. The system achieved a PDmax of 0.467 W m−3. These results demonstrated the effective growth and metabolic activity of C. vulgaris under the given experimental conditions, contributing to both biomass production and power generation. Furthermore, besides producing bioelectricity, the PMA-MFCt1 and PMA-MFCt2 produce valuable algal biomass, making them cost effective compared to the cultivation of microalgae in photobioreactor58. However, as algal biomass at cathode increases, which is dependent upon temperature, the current decreases due to exhaustion of substrate at anode59.
On the offset, MFC may achieve the maximal NER, which can be influenced by power output, organic loading rate, and flow rate of wastewater. The NER is based on wastewater characteristics, which were 0.043 kWh m−3 in the PMA-MFCt1, 0.0128 kWh m−3 in the PMA-MFCt2, and 0.011 kWh m−3 in the PMA0-MFC. These NER values were equivalent to that of domestic wastewater treatment in MFC as reported earlier (0.04 kWh m− 3)60. Power generation is an imperative and an essential factor for calculating NER, however, NER depends on the type of wastewater, volume of MFC reactor, COD removal, power output, etc61,62. Future studies focusing on energy recovery need to be done to enhance NER, along with further improving PDmax.
Taxonomic analysis and 16s RNA sequencing of microbes in anodic chamber of PMA-MFCt1
The 16s rRNA gene sequencing taxonomic analysis and phylogeny distribution of bacteria genus and their abundance in wastewater were done. A classified heat map analysis was performed to confirm the taxonomic abundance of bacterial genera in wastewater sludge for PMA-MFCt1 till its final completion on day 40 through a heat map (Fig. 3).
The PMA-MFCt1 anodic communities identified were from their own distinct cluster, which contained well-known electrogenic bacteria such as Proteobacteria, Firmicutes, Bacteroidetes, and Actinobacteria in the inoculum. The metagenomic results demonstrated the composition and phylogenetic distribution of bacteria in different genus and species on the first and last days of different polarisation cycles of PMA-MFCt1 run till day 40 as shown (Supplementary Fig. S3). The bacterial phyla, Proteobacteria was the most dominant representing 71.94% of the total bacteria in the samples; furthermore, Firmicutes, which has a recognized diversity of electricity-producing microbes, accounted for 8.5% and both these phyla play a crucial role in the degradation of organic matter63. Moreover, γ-proteobacteria are electrogenic in nature, hence having the metal reducing ability, which can remove heavy metals like Ni and Cd from polluted wastewater64. Additionally, Bacteroidetes (8.2%), Actinobacteria (4.1%), Chloroflexi (1.7%), and Acidobacteria (1.4%) were in abundance in the anodic chamber on day 1. Other bacterial communities such as Verrucomicrobia (0.81%), Synergistetes (0.65%), Euryarchaeota (0.53%), Planctomycetes (0.42%), Gemmatimonadetes (0.05%), Lentisphaerae (0.04%), Nitrospirae (0.02%), and Tenericutes (0.0%) were frugally present in the initial anaerobic sludge in the PMA-MFC at the anode. The structure of the bacterial communities substantially altered on day 40.
The relative abundance of Proteobacteria decreased to 33.48%, while Firmicutes increased up to 46.62%. On the other hand, there was an increase in the relative abundance or population of Bacteroidetes and Tenericutes from 12.69% to 2.91%, respectively. These bacteria sustainably affected the electricity generation of the PMA-MFC65. In a study by Liu et al.66 in a MFC it was reported that the relative abundance of Proteobacteria decreased to 40–70%; whereas Firmicutes, which was 1% in the raw sludge, increased to 19–26%.
Phyla Firmicutes showed the presence of Clostridia (8%), Bacteroidia (6%), Actinobacteria (3%), and Anaerolineae (2%), with Archaea (0.5%). There was variation in the population on day 40, where the microbial population got reduced, wherein β-proteobacteria was 5%, α-proteobacteria was 5%, γ-proteobacteria was 5%, and δ-proteobacteria went up to 2%. Additionally, a low abundance of Mollicutes (3%) and Synergistia (2%), also observed on day 40.
The distribution structure of microbial population in anodic chamber is represented in the multilevel Krona function annotation diagrams using radial space-filling display, where each cycle represents taxonomic levels of the bacterial communities, such as Proteobacteria, Betaproteobacteria, Rhodocyclaceae, Firmicutes, Actinobacteria, Bacilli, Lactobacilli etc., in wastewater samples on day 1 and day 40 at anode in a PMA-MFCt1 (Supplementary Fig. S4). Furthermore, the percentage of archaea, which is a biocatalyst, gets reduced from 0.5 to 0.05% on day 40, suggesting degradation of organic matter at anode by them. The Krona chart featuring a red-green colour gradient illustrated average values on the dominance of phylum Proteobacteria on day 1 with β-proteobacteria (54%), α-proteobacteria (9%), γ-Proteobacteria (5%), and δ- proteobacteria (3%), indicating that Proteobacteria are beneficial to improve the efficiency of PMA-MFCt1.
An increase in Firmicutes has thus proved to play a vital role in improving the electricity generation, and stability of the reactor67 and showed better adaptation along with an increased population of Clostridia, which was 16% of the total population. Moreover, the electrogenic bacteria Bacilli population increased to 31%, which has the ability to produce power and capacity for efficient COD removal68.
The dominant phyla in the wastewater sludge in anodic chamber of the PMA-MFC thus included Proteobacteria, Firmicutes, Bacteroidetes, Actinobacteria, Chloroflexi, Acidobacteria, Verrucomicrobia, Synergistetes, Euryarchaeota, Planctomycetes, Gemmatimonadetes, Lentisphaerae, Nitrospirae, and Tenericute, which were identified and screened with the metagenomics study. These are all anaerobic bacteria participating in electron transfer in PMA-MFCt1. Additionally, the quantitative DNA sequencing results of the DNA bands confirm the presence of these microbes. The 16 S rRNA gene clone libraries were identified phylogenetically and were grouped by class, family, genus, order, and species. Hence, the occurrence of different electrogenic bacterial species in the PMA-MFCt1 anode supported the sustainable performance of the reactor for wastewater remediation, COD removal, and electricity generation.
Microalgal cell growth and production of value-added compounds at cathode
Haematococcus lacustris growth analysis
The H. lacustris at cathode of PMA-MFC was collected from the lower Himalayas and was identified by Molecular Identifier (MID) Analysis for Single-Read sequences. These sequences were deposited in the NCBI, USA bank by accession numbers OQ619015 and OQ619014 (SUB12949021 NS1_E01.ab1 OQ619014 and SUB12949021 NS4_E06.ab1 OQ619015).The genetic sequences of the microalgae were revealed by studying FASTA sequences of DNA barcoding region of H.lacustris and information from NCBI database (Supplementary Fig. S5). The H. lacustris cell density increased from 2.9 × 10⁴ cells mL−1 on day 1 to 8.7 × 10⁴ cells mL−1 on day 40 in the catholyte of PMA-MFCt1 which showed similar growth as in its control flask, 2.9 × 10⁴ cells mL−1 on day 1 to 8.6 × 10⁴ cells mL−1 on day 40 (Fig. 4A). The increase in algal density is responsible for providing more oxygen to the PMA-MFCt1, which ultimately resulted in higher power output69. The growth rate of microalgae C. vulgaris at the cathode in a lipid-extracted biomass fed MFC also showed higher growth rates in a study conducted by Khandelwal et al.8. The logistic kinetics of H. lacustris cell count in the control flask and in PMA-MFCt1 showed a similar sigmoidal curve for its growth, and predicted logistic growth representing a balance between growth and limiting factors. It increases linearly over time, slowing down due to self-limiting factors, for both control and test (PMA-MFCt1) (Fig. 4B).
Moreover, the initial H. lacustris biomass at cathode was 23 mg mL−1 DW on day 1, which reached up to 118 mg L−1 DW on day 40 of the experiment. On comparing this with cell growth and biomass productivity with H. lacustris being grown in a control sample in a normal conical flask, there was not much variation being 22.06 mg L−1 DW at day 1 to 123.66 mg L−1 DW at day 40. This, shows that microalgae divided comparably in the PMA-MFCt1 as in the conical flask under the same control conditions (Light and temperature kept same), as seen in (Fig. 4C). Higher biomass production capability of H. lacustris favoured cell multiplication and generated more O2 during the photosynthesis process in PMA-MFCt1 and helped in maintaining higher O2 concentration in the catholyte. The semi-log plot for growth kinetics analysed via biomass concentration (Xmax) versus reactor run time is shown in Fig. 4D. On extracting specific growth rate (µ) from the best-fit line linear regression equation, the slope (µ) was 0.0448 day− 1 in PMA-MFCt1 (Fig. 4D). This indicates that every day, the microalgal population is growing by approximately 4.48% of its current biomass in the exponential phase. A study on Spirulina as a catholyte in PMA-MFC showed almost equal biomass (0.1 g DM L− 1 d− 1) at catholyte and control microalgal cultures in a 9-day fed batch cycle14.
Similarly, microalgal cell growth measured in terms of optical density at 750 nm in PMA-MFCt2 was 0.130 on day 1 and 0.410 on day 40, and in PMA-MFCnw it was 0.128 on day 1 and 0.434 on day 40, showed an exponential growth till day 8, and thereafter a plateau was reached till day 40 of observation. The cell count in PMA-MFCt2 (2.84 × 10⁴ cells mL− 1 on day 1 and 8.41 × 10⁴ cells mL−1 on day 16, decreasing to 5.91 × 10⁴ cells mL−1 on day 40) and PMA-MFCnw (3.04 × 10⁴ cells mL−1 on day 1 and 7.7 × 10⁴ cells mL−1 on day 16, decreasing to 5.25 × 10⁴ cells mL−1 on day 40) showed a distinctive pattern of lag, exponential, stationery, and death phase without any replinished media (Supplementary file Fig. S6A,B). The biomass in PMA-MFCt2 and PMA-MFCnw showed a stable and similar pattern like that in cell count till day 8 (0.006 g L− 1 DW); thereafter, PMA-MFCt2 showed stationary biomass on day 40, it being 0.106 g L− 1 (DW) in PMA-MFCt2 and 0.083 g L− 1 (DW) in PMA-MFCnw (Supplementary file Fig. S6C).
Lipid production and estimation by UV-Vis spectrophotometry
The relative content of lipid from H. lacustris at cathode increased from 26% on day 1 to 71% on day 24 (Fig. 4E). Additionally, the lipid concentration was determined by the sulfo-phospho vanillin (SPV) method, which revealed that the maximum lipid accumulation was about 172.3 µg g−1 on day 8 and decreased further w.r.t its biomass dry weight in a PMA-MFCt1 (Fig. 4E). The kinetics of lipid concentration in PMA-MFCt2 and PMA-MFCnw show that lipid concentration decreased till day 8 to 3.06 µg g−1 and 2.67 µg g−1, respectively; thereafter, from day 16 to day 40, it remained constant at > 2 µg g−1, unlike a constant increase in PMA-MFCt1 till day 40 (Fig. 4E and Supplementary file Fig. S6D). The decrease in lipid % till day 8 in PMA-MFCt2 was 39.02% and 19.82% in PMA-MFCnw. However, at day 40, the lipid % in microalgal cells in PMA-MFCt2 decreased by 58.03%, whereas in PMA-MFCnw it decreased to 68.31%.
The decrease in lipid in PMA-MFCnw can be due to many reasons, one being that due to no replenishment of nutrient BG-11 media at cathode, microalgae started going into oxidative stress. Since electrons are produced at anode in a PMA-MFCnw, but they cannot flow to cathode causing redox imbalance at cathode. This leads to faster depletion of intracellular lipid reserves as microalgae tap into energy storage for stress survival. The decline in lipid concentration after day 8 suggests that the cells shifted their metabolic priorities. Future studies could explore altering growth conditions after peak lipid accumulation, such as introducing nutrient stress to further increase lipid content70,71.
The composition of lipids in a photosynthetic microalgal microbial fuel cells (PMMFCs) with four microalgae species (C. vulgaris (FACHB-31), Chlorella sp. (FACHB-9), T. obliquus (FACHB-416) and M. aeruginosa (FACHB-905)) was 1.6 times higher (14.5 mg g− 1 dry mass) than that in control groups (9 mg g− 1 dry mass)32. Further PMMFC showed increased C16-1 due to expression of fatty acid biosynthesis genes stimulated by electron flow32. It has been reported that lipid extracted algal (LEA) biomass in MFC on being compared with fruit extract biomass at anode, having C. vulgaris at cathode showed higher potential of electrochemical parameters8. The power density was 2.7 W m−3, current density of 30 Am−3, COD removal was 70.8 ± 4%, algal biomass productivity of 0.0288 kg m−3 day−1, and volumetric lipid energy productivity of 0.0782 kWh m−3 day−1 at cathode was observed8. Thus, incorporating microalgae into the cathodic chamber offers several advantages, both operationally and economically. Microalgae not only enhance the overall performance of the MFC by producing oxygen through photosynthesis, but they also eliminate the need for external oxygenation in the cathode. This step significantly reduces the operational costs, as the system would otherwise rely on the continuous supply of oxygenated water to maintain proper cathodic reactions. Hence, microalgae by naturally supplying oxygen, make the MFC system more sustainable and cost-effective.
Chlorophyll, total carotenoids and astaxanthin estimation
Estimation by UV-Vis spectrophotometry
The amounts of chlorophyll ‘a’ and chlorophyll ‘b’ were 151.42 µg g−1 and 99.0 µg g−1 of biomass, respectively, on day 1 in PMA-MFCt1 (Fig. 4F). The total chlorophyll (a + b) of microalgae was 250.43 µg g−1 on day 1, which significantly decreased 59.66 µg g−1 by day 40 (Fig. 4F). The maximum values for chlorophyll ‘a’ and total chlorophyll (a + b) were reported on day 16, while chlorophyll ‘b’ was on the day 8 of PMA-MFC operation. The values for chlorophyll ‘a’, chlorophyll ‘b’, and total chlorophyll (a + b) were 546.08 µg g−1, 215.80 µg g−1 and 699.69 µg g−1, respectively. The initial increased chlorophyll content indicated quasi-exponential growth of H. lacustris concordant with cell growth at cathodic chamber of PMA-MFCt1. Since the pigments are key participants in the photosynthetic reaction, the total carotenoids in the H. lacustris cells on day 1 at cathodic chamber were estimated as 39.99 µg g−1, which increased up 224.62 µg g−1 on day 16 of the PMA-MFCt1 run, as is evident in Fig. 4F.
Though on day 8 the total carotenoids content dropped to 65.8 µg g−1. The amount of astaxanthin on day 1 was 2.29 µg g−1, and it decreased to 1.39 µg g−1 on day 40 compared to 2.26 µg g−1 on day 1 and 1.76 µg g−1 on day 40 in the control flask and PMA-MFCt1, respectively, as seen in Fig. 4G. The fall in astaxanthin in the control and PMA-MFCt1 on day 40 was due to the fact that cathode was replenished with media every time microalgal cells were collected for biochemical analysis. The astaxanthin content was very less in the cells both in the control as well in the cells in the cathodic chamber as there was no stress given to microalgal cells. Probably absent/scanty dormant cells (incapable of photosynthesis), hence low astaxanthin resulted into high PDmax in PMA-MFCt124.
Chlorophyll content in PMA-MFCt2 and PMA-MFCnw was also observed to check if redox reactions happening in PMA-MFC will produce certain physiological changes, since these two MFCs varied in connected/disconnected wires comparison. It was observed that in PMA-MFCnw the chlorophyll ‘a’ (108.75 µg g−1) was higher compared to PMA-MFCt2 (59.06 µg g−1) on day 32. The chlorophyll ‘a’ was 41.33 µg g−1 in PMA-MFCnw and 40.48 µg g−1 in PMA-MFCt2 on day 40 dropping to 1–2 µg g−1 (Supplementary file Fig. S7A). Similarly, on day 32, chlorophyll ‘b’ was 24.25 µg g−1 for PMA-MFCnw and 23.40 µg g−1 in PMA-MFCt2, showing that the microalgal cells in both connected and disconnected electric load PMA-MFC’s followed a similar pattern of cell growth and photosynthesis (Supplementary file Fig. S7B). On the offset, the total carotenoids were higher in PMA-MFCt2 (27.21 µg g−1) compared to PMA-MFCnw (23.51 µg g−1) (Supplementary file Fig. S7C).
Chlorophyll content indicates the photosynthetic activity of microalgae in the cathodic chamber concurrent energy supply, release of O2, and consumption of CO2. High chlorophyll content leads to an upsurge of power generation, which directly indicates the microalgae cell division and biomass yield. High temperature can adversely affect the production of chlorophyll content in microalgal cells. In dual-chamber MFC where microalgae was used as a biocathode demonstrated that initially the biomass was 7.21 µg mg−1 and chlorophyll ‘a’ was 2.34 µg mg−1; chlorophyll ‘b’ was 4.87 µg mg−1, which during spring increased to 15.61 µg mg−1 where chlorophyll ‘a’ increased to 3.97 µg mg−1; chlorophyll ‘b’ to 11.64 µg mg−159.
On the other hand, astaxanthin, an important pigment in H. lacustris, analysed from PMA-MFCt2 and PMA-MFCnw, showed that the astaxanthin content in PMA-MFCt2 was 14.51 µg g−1 and that in PMA-MFCnw was 14.32 µg g−1 (Supplementary file Fig. S7D). In both PMA-MFC’s, astaxanthin was present as a mixed carotenoid form in intracellular lipids. It decreased on day 24 and again increased on days 32 and day 40. PMA-MFCnw showed a slightly higher astaxanthin accumulation on day 40 (13.14 µg g−1) compared to PMA-MFCt2 (11.92 mg g−1 ) the reason is possibly that the PMA-MFCnw reactor had electron accumulation but reduced or no flow across, resulting microalgal cells, to come under stress and hence producing little higher astaxanthin compared to PMA-MFCt2. This reinforces the theory that redox imbalance and lack of electron flow trigger oxidative stress in algae, shifting their metabolism towards secondary carotenoid production such as astaxanthin.
This metabolic shift is a survival mechanism, though it inversely affects photosynthetic efficiency and oxygen generation72. A study has shown that unaerated cultures, nutrient stress and cultures with high and continuous illumination have shown higher astaxanthin accumulation73,74. Thus, if only astaxanthin harvest is the motto then PMA-MFC may not sustain as cathodic chambers need to be aerated for high photosynthesis, thus maintaining the ORR pathways for electron generation and flow. The insignificant astaxanthin accumulation in PMA-MFCt1 and PMA-MFCt2 and PMA-MFCnw coherent with their respective PDmax discussed earlier.
Estimation of carotenoid pigments by liquid chromatography-mass spectrometry
Von Flotow75 and Aflalo et al.76 have reported that as Haematococcus changes from the green stage to the red stage, chlorophyll content drops72. This is because as the cells grew exponentially till day 40, the nutrient stress shifted the H. lacustris cells from green to its intermediate red or aplanospore stage, wherein the astaxanthin starts synthesizing and chlorophyll starts depleting77. Green cells indicate cells actively performing photosynthesis and hence generation of O2, which may drive towards more power output. Though H. lacustris cells will always contain some amount of astaxanthin even at their green stage, though it may be in small amounts78. In the present research the H. lacustris cells still looked green but on microscopy showed few intermediate red green stages, which is not very metabolically active stage78.
In summary, the study found that while the H. lacustris cells looked healthy on day 40, they were transitioning to a dormant state that would not support the desired energy production in the PMA-MFCt1 setup; hence, the PMA-MFC set was terminated on day 40. Hence, astaxanthin amount was calculated at day 1 and day 40 of the PMA-MFCt1 experiment. In PMA-MFCt1, microalgal samples extracted from cathodic chamber showed an astaxanthin fragment at RT 3.68 min at m/z 279.08 and halocynthiaxanthin at RT 6.71 min at m/z 233.08 were detected in day 1 sample (Fig. 5A,B). On day 40, LC-MS detected additional major fatty acids, specifically docosahexaenoic acid (DHA), at RT 4.36 min of m/z 326.42 (Fig. 5C,D). Furthermore, at RT 7.11 min of m/z 139.08 value fragments of fatty acid hexacosanedioic acid were detected along with carotenoids neoxanthin and vioxanthin in the sample of day 40. Astaxanthin diester at RT 8.23 m/z 1119.58 (Fig. 5E,F), major carotenoid astaxanthin monoesters at RT 15.92 min at m/z 579.58 along with palmitic acid at RT 15.92 min of m/z 255.33. The molecular mass found for these carotenoids is significantly higher at 600 m/z and about 1200 m/z, indicating the presence of astaxanthin and other multiple functional groups.
The liquid chromatography data for standard astaxanthin showed a peak at m/z 597.17 (Supplementary Fig. S8A). The identification of carotenoid pigments from the microalgal cathodic chamber in a PMA-MFCt1 using LC-MS/MS demonstrated the presence of several different metabolites, including astaxanthin with its mono- and diesters, neoxanthin, siphonaxanthin and vioxanthin (Supplementary Fig. S8B). Several metabolites were detected in the standard sample at retention time (RT) 9.65 min at m/z values like 597.17 and 579.29, identified as astaxanthin and its monoesters, respectively79.
Materials and methods
Experimental setup of photosynthetic microalgae-assisted microbial fuel cell
A dual-chamber PMA-MFC setup was used in this experiment for microalgae H. lacustris cultivation in cathodic chamber and sucrose based synthetic wastewater (SWW) treatment 80 in the anodic chamber. Anaerobic sludge, collected from septic tank near Green Hostel, Dr Harisingh Gour Vishwavidyalaya (A Central University), Sagar, Madhya Pradesh, 470003, India, was used as inoculum in the anodic chamber. The performance of PMA-MFC’s and their controls was observed for a period of 40 days to analyse various parameters. At anode, parameters like polarisation cycles, coulombic efficiency (CE), normalised energy recovery (NER), chemical oxygen demand (COD) etc., were analysed.
For the cathodic chamber having microalgae, the parameters like cell density, biomass, chlorophyll, and pigments like astaxanthin were analysed. However, the overall physicochemical parameters which include, pH, conductivity, total dissolved solids (TDS), salinity, and dissolved oxygen (DO) were analysed in both anodic and cathodic chambers. In first set, test was PMA-MFCt1 with SWW at anode and H. lacustris at cathode. The control for PMA-MFCt1was conical flask having H. lacustris cells of same cell density similar as that of test kept at 25 ± 2 °C, with a light intensity of 40 µmol m2s −1 and a photoperiod 16 h:08 h::Light: Dark cycle. However, to check if microalgae growth was affected by the electrical circuit in a PMA-MFC, the experiment was repeated after completion of PMA-MFCt1, with two more PMA-MFCs. This included one more test, PMA-MFCt2, like PMA-MFCt1 having control reactor with its electrical circuit not connected (nw), with no resistance, labelled as PMA-MFCnw.
Hence, for PMA-MFCt2 all the electrochemical, physiochemical, and biological parameters were analysed, but for PMA-MFCnw, all except polarisation measurement were analysed as it was not wired. Additionally, a major difference between PMA-MFCt1, PMA-MFCt2 and PMA-MFCnw was that in PMA-MFCt1, every time H. lacustrus samples were taken out from cathodic chamber, an equal number of BG-11 media was replenished. However, in case of PMA-MFCt2 and PMA-MFCnw, the cathodic chamber was not replenished with media every time H. lacustrus cells were taken out for analysis. This was done to check the effect of polarisation on microalgal cell physiology. Additionally, to establish that microalgae act as mediators in enhancing the efficiency of PMA-MFC, one more MFC was set up in which only water was taken in the cathodic chamber with no microalgal cells and was labelled as PMA0-MFC (photosynthetic microalgal-assisted minus microbial fuel cell).
Fabrication of PMA-MFCs
The fabrication and operation of PMA-MFC was done using a reactor as reported earlier5,25. The size of PMA-MFC was of dimension 24 cm × 16.5 cm × 6.5 cm, separated by a clayware plate into anodic and cathodic chambers of volume 1250 mL each. The composition of clayware plate separator was 20% montmorillonite baked and designed of optimum size and thickness (16.5 cm × 6.5 mm × 6 mm)81. Carbonaceous non coated carbon electrode felt (purchased from Nickunj Eximp Entp P Ltd, Mumbai, India) is suitable to provide superficial area for microbes/bacteria to colonize, helping to enhance the power output and achieving higher power and current density82. Two carbon felts each of size: 14 cm × 6 cm were used as anode and cathode and connected with copper wire (Length:15 cm) to work as current collector. This was further connected with a fixed resistance of 300 Ω, and a multimeter to complete the circuit thus enabling the current flow (Supplementary Fig. S1A–D). The complete operational set up of PMA-MFC with H. lacustris at cathode in PMA-MFCt1, PMA-MFCt2 and PMA-MFCnw are shown in Supplementary Fig. S1A’–C’.
Synthetic wastewater in anaerobic anodic chamber
The SWW with a working volume of 1250 mL was used as an anolyte in PMA-MFCs. The composition of synthetic wastewater is shown in Supplementary Table S1A. The anodic chambers of the PMA-MFCs were inoculated with 10% of mixed anaerobic sludge, which was pre-treated at 105 °C for 15 min to inhibit the activity of methanogens83. The PMA-MFCs were operated with a fresh feeding frequency of SWW on the 5th day regularly for 40 days in multiple fed-batch cycles for better replicability of the performance results. The anodic chamber was hermetically sealed to prevent any external air exchange and treated with N2 gas to make the condition anerobic. All the readings were recorded in triplicate, with results reported as an average of three values.
Identification and cultivation of microalgae in cathodic chamber
The H. lacustris cells were isolated from the lower Himalayas at 30.65° North and 77.07° East. The cells were cultured initially in BG-11 media (Supplementary Table S1B) and sub-cultured to obtain a pure colony. The volume of anolyte and catholyte in PMA-MFCt1, PMA-MFCt2, PMA-MFCnw and PMA0-MFC was 1250mL. After each cycle of polarization (5 days), 1000 mL of wastewater with a syringe was carefully removed and fresh 1000 mL of the feed was added to the anodic chamber to maintain the volume. Microalgal samples (5 mL) was collected from the cathodic chamber for biochemical analysis of the microalgae till the 3 cycles of polarisation were taken and refed with fresh 5 mL media. This was done until day 20 during which polarisation optimisation readings were taken. After day 20, the reactors were maintained at a fixed external resistance of 300 Ω, and no further electrochemical measurements were conducted; however, biochemical compounds from microalgae H.lacustris in the cathode chamber were analyzed up to day 40. Similar process was done for control flasks and PMA-MFCs also. Before sampling, the microalgal sample was mixed to ensure a uniform distribution of microalgae in the medium.
The microalga was identified by MID using sequencing of their deoxyribonucleic acid (DNA) barcoding region with primer pair 5′-GTAGTCATATGCTTGTCTC-3′ and 5′-CTTCCGTCAATTCCTTTAAG-3′ from Eurofins Genomics Laboratory. H. lacustris cells in BG-11 broth media (Himedia) counting about 2.9 × 10⁴ cells mL−1 were inoculated inside cathodic chamber. Artificial light was supplied to the microalgae culture during photoperiod of 16 h using white LED bulb (12 W), producing 5000 lx illumination, measured by a lux meter (Hanna HI97500) to maintain 40 µmol m2 s−1 light intensity at 25 ± 2 °C temperature.
Analysis of wastewater and identification of microbes in anodic chamber
Physiochemical parameters
The pH, TDS, conductivity, salt, and DO (Electronic India Model 831E) values were recorded for control and for anodic and cathodic chambers of PMA-MFC using probes supplied by Hanna H198107. Chemical oxygen demand (COD) was measured by COD digester (Royal Scientific RSW 143-4) on the first and last days of polarisation cycle in triplicate and their average was determined for all three PMA-MFCs (PMA-MFCt1, PMA-MFCt2, PMA-MFCnw, and PMA0-MFC) using open reflux method according the procedure described by Klindworth et al.84.
16 S microbiome profiling
The bacterial consortia from sludge samples of only PMA-MFCt1 were identified by metagenomics targeting the prokaryotic 16S ribosomal RNA gene (16S rRNA) by Eurofins Genomics Laboratory, India. DNA was extracted using a commercially available Nucleospin kit (Takara Bio Companies, India), whereas the quantitative (absorbance at 260 nm) and qualitative (A260/A280 ratio) estimations were done using a NanoDrop ND-1000 spectrophotometer (Nanodrop technologies, USA). The amplicon library was prepared using the Nextera XT Index Kit (Illumina sequencing) as per the 16S Metagenomic Sequencing Library protocol and pooled together for sequencing. The primers for the amplification of the bacterial genomes targeting 16S rRNA were forward primer (5′-GCCTACGGGNGGCWGCAG-3′) and reverse primer (5′-ACTACHVGGGTATCTAATCC-3′)85. Polymerase chain reaction (PCR) amplification of the bacterial 16 S region was carried out at 95 °C for 3 min, followed by 8 cycles at 95 °C for 30 s, 55 °C for 30 s, and 72 °C for 30 s, 72 °C for 5 min, with the temperature held at 4 °C. The 3 µl of PCR product was resolved on 1.2% agarose gel at 120 V till the samples reached 3/4 of the gel (60 min). The amplified libraries were analysed on 4200 Tape Station system (Agilent Technologies, USA) using D1000 Screen tape as per manufacturer instructions. After obtaining the mean peak size from the Tape Station profile, the libraries were loaded onto MiSeq reporter (on-system software) at an appropriate concentration (10–20 ppm) for cluster generation and sequencing. A taxonomic classification was performed using the green gene database.
Wastewater treatment and energy recovery
Open circuit voltage and operating voltage
A reaction cycle time of 5 days was sustained, and fresh feed of SWW was given after decanting the supernatant from the anodic chamber. The operating voltage (OV) and open circuit voltage (OCV) data were collected daily with a multimeter. Polarization was done by varying the external resistance from 20,000 Ω to 50 Ω over a fixed time to assess current and power density using the resistance box to calculate the maximum power density (PDmax) and internal resistance of PMA-MFC86 using Eq. (4).
$$:P:=:V:times::I.$$
(4)
where, V is voltage in volt (V), and I is current in ampere (A).
Coulombic efficiency
Coulombic efficiency (CE) of the wastewater in the PMA-MFC was estimated by using the Eq. (5)87.
$$:CE=frac{M{int:}_{0}^{t}:Idt}{FbVvarDelta:COD}$$
(5)
where, M is the molecular weight of oxygen, I is current (A), t is time (s), F is Faraday constant, b is the number of electrons for reduction of 1 mol oxygen, V is the wastewater volume in the anodic chamber, ΔCOD is change in COD over time t.
Normalized energy recovery
Normalized energy recovery (NER) is presented in kilowatt-hours per cubic meter volume of wastewater being treated to understand the amount of energy being recovered from the PMA-MFC or power divided by flow rate of wastewater at a given unit of time (Eq. 6).
$$:text{N}text{E}text{R}:=frac{left(text{P}text{o}text{w}text{e}text{r}:text{x}:text{t}text{i}text{m}text{e}::right)}{left[text{w}text{a}text{s}text{t}text{e}text{w}text{a}text{t}text{e}text{r}:text{v}text{o}text{l}text{u}text{m}text{e}:left(text{t}text{r}text{e}text{a}text{t}text{e}text{d}:text{w}text{i}text{t}text{h}text{i}text{n}:text{t}text{i}text{m}text{e}:right)right]}$$
(6)
Biochemical analysis of microalgae from cathodic chamber
Microalgal growth and biomass determination
The growth of H. lacustris at the cathode in PMA-MFCt1, PMA-MFCt2, and PMA-MFCnw was determined by counting the microalgal cells using Neubauer chamber counter (Rhom, India) under the light microscope (Model: Olympus CH20i) on days 1, 8, 16, 24, 32, and 40. This was compared with total dry weight of microalgal biomass in a PMA-MFC using the formula mentioned in Eq. (7) at 7 day intervals. Aliquots were centrifuged at 3000 x g for 5 min (REMI R-8 C, REMI, India), and the remaining pellets were then dried at 60 °C in an oven until a constant weight was obtained.
$$:TDW={W}_{f}-{W}_{i}$$
(7)
where TDW: Total dry weight of biomass; (:{W}_{f}::) Final weight of microcentrifuge tube with biomass and (:{W}_{i}:): initial weight of microcentrifuge tube.
Growth kinetics of microalgae
Specific growth and logistic kinetics
There are many growths kinetic models, among them logistic model is most suitable for autotrophic microalgal cell cultures. The rate of microalgal cells is directly proportional to its algal cell concentration at a time ‘t’. Once the cells reach the stationary phase its growth stops and cells reach stationary phase. The logistic Eq. (8) depicts the logistic curve Eq. (8)8.
$$:frac{dx}{dt}=mu:maxXleft(1-frac{X}{Xm}right)$$
(8)
where dx/dt is specific growth rate. The logistic curve has a sigmoidal curve.
X = biomass concentration (g/L or cells/mL), t = time (days, hours), µmax = maximum specific growth rate (per unit time), Xm = maximum biomass concentration (carrying capacity), µmax = Maximum specific growth rate, mentioned in Eq. (11). Logistic curve kinetic is depicted by Eq. (9).
$$:Xleft(tright)=frac{Xmax}{1+left(Xmax-frac{X0}{X0}right)e-mu:maxt}$$
(9)
Xt = Cell count at time t, X0 = Initial cell count.
Semi-log plot method to determine specific growth rate (µ)
A Plot of ln (Biomass) as X vs. Time (Days) to create a semi-log plot and fit a linear regression model to find the specific growth rate (µ) was made to check the semi-log kinetics as shown in Eq. (10).
$$:lnX=lnX0+mu:t:$$
(10)
The specific growth rate (µ), is calculated from the best-fit line equation y = mx + c, the slope (µ) calculated by Eq. (11).
$$:mu:=frac{lnX2-lnX1}{t2-t1}$$
(11)
where X1 and X2 are biomass concentrations at time t1 and t2.
Pigment extraction and quantification from microalgal biomass
The H. lacustris cells were collected from cathode of PMA-MFC’s on different days and extracted in 100% ethanol. The extracted pigments were quantified by recording absorption spectra at wavelengths of 664 nm, 649 nm and 470 nm, using UV-VIS spectrophotometer (Model: LabIndia UV-3000, India). The concentrations of chlorophyll ‘a’, chlorophyll ‘b’ and total carotenoids were calculated using the standard equations as shown in Eq. (12) to (14)89.
$$:{text{C}}_{{text{a}}} left( {upmu {text{g}}:{text{mL}}^{{ – 1}} } right){text{ = 13}}.{text{36}}:{text{A}}_{{{text{664}}}} – {text{5}}{text{.19A}}_{{{text{649}}}}$$
(12)
$$:{C}_{b}left(mu:text{g}{:text{m}text{L}}^{-1}right)=::27.43{A}_{649}-8.12{A}_{664}$$
(13)
$$:{C}_{X+C}:left({upmu:}text{g}{:text{m}text{L}}^{-1}right)=(1000{A}_{470}-2.13:{C}_{a}-97.64{C}_{b})/:209$$
(14)
where Ca is chlorophyll ‘a’, Cb is chlorophyll ‘b’, Cx+c is total carotenoids.
Among the carotenoid pigments extracted from H. lacustris in this PMA-MFC, astaxanthin estimation was done following the procedure described by Boussiba and Vonshak with some modifications on day 1 and day 40 for cells at cathode and control flask90. The 5 mL H. lacustris cells were harvested and centrifuged at 4000 × g for 10 min. They were then treated with 5% KOH in 30% methanol (1:1) saponified at 70 °C for 5 min to remove all chlorophyll. Thereafter the pellet was kept and the supernatant discarded. The pellet was extracted with dimethyl sulphoxide (DMSO > 99%) at 70 °C until all astaxanthin is extracted and colour of pellet has turned completely white. The extracted pigment was observed in UV VIS spectrophotometer at 490 nm, the per unit volume astaxanthin concentration (mg L−1 (DW)) was calculated by using Eq. (15)91.
$$:Astaxanthin:left({text{mL}}^{-text{1}}:right)=:4.5:times::A490:times:frac{Va}{Vb}$$
(15)
where, A490 = the absorbance of the extracts at 490 nm; Va = volume of extracts; and Vb = volume of culture samples.
The astaxanthin productivity (mg L−1 day−1) in column PBRs was calculated using Eq. (16)
$$:text{A}text{s}text{t}text{a}text{x}text{a}text{n}text{t}text{h}text{i}text{n}:text{p}text{r}text{o}text{d}text{u}text{c}text{t}text{i}text{v}text{i}text{t}text{y}:=frac{text{C}text{t}:-:text{C}0}{text{t}}:$$
(16)
where Ct is the astaxanthin concentration (mg L−1) in the PBR after t days induction; C0 is the initial astaxanthin concentration (mg L−1); and t is the induction time (days).
The extracted astaxanthin pigment from H. lacustris cells at cathode was analysed by recording their absorbance at 490 nm using UV-Vis spectrophotometer. The amount of astaxanthin from H. lacustris cells was measured using a standard astaxanthin obtained from Sigma (Aldrich, USA) at 490 nm. Identification of other unknown carotenoid components was analysed using liquid chromatography-mass spectrometry/mass spectrometry (LCMS/MS) system (LC-Finnigan Surveyor MS-LCQ Fleet) equipped with a photodiode array (PDA) detector using astaxanthin standard.
Lipid extraction and quantification
H. lacustris cells were collected from cathodic chamber of the PMA-MFC for lipid analysis. The cells were trans-esterified for lipid estimation using Bligh and Dyer method on day 1, 4, 8, 16, 32 and 42 with some modifications92. Total weight of lipid produced was measured using Eqs. (17) and (18)93.
$$:text{W}text{e}text{i}text{g}text{h}text{t}:text{o}text{f}:text{l}text{i}text{p}text{i}text{d}:text{p}text{r}text{o}text{d}text{u}text{c}text{e}text{d}:=:text{w}text{e}text{i}text{g}text{h}text{t}:text{o}text{f}:text{v}text{i}text{a}text{l}:text{w}text{i}text{t}text{h}:text{l}text{i}text{p}text{i}text{d}:-:text{w}text{e}text{i}text{g}text{h}:text{o}text{f}:text{e}text{m}text{p}text{t}text{y}:text{v}text{i}text{a}text{l}$$
(17)
$$text{Total lipid percentage} = :left(frac{text{W}text{e}text{i}text{g}text{h}text{t}:text{o}text{f}:text{l}text{i}text{p}text{i}text{d}:text{p}text{r}text{o}text{d}text{u}text{c}text{e}text{d}}{text{T}text{o}text{t}text{a}text{l}:text{w}text{e}text{i}text{g}text{h}text{t}:text{o}text{f}:text{b}text{i}text{o}text{m}text{a}text{s}text{s}}right)times:100$$
(18)
Moreover, lipid concentrations for all the test samples collected on different days were determined using the standard linseed oil (Supelco, PA, USA; 1000 mg). All samples prepared for lipid estimation were quantified by a UV–Vis spectrophotometer at 530 nm29. The gas chromatography mass spectroscopy (GC-MS) was further done on the esterified lipid using fatty acid methyl ester (FAME) standard methyltrideconate (99%, Sigma-Aldrich, Japan).
Statistical treatment
The statistical analysis of the study was performed using Link: Microsoft® excel (2024) and Origin 2024. The pigment and lipid analysis of H. lacustris with respect to time was used to plot the graphs and to do statistical analysis. The multilevel graphs metagenomics data representation and analysis was obtained from biotech company Medgenome Labs and using MiSeq reporter (on-system software) and general tools like R software, Conda and python tools to extrapolate heatmaps. LC-MS, plots were made using Origin 2024.
Conclusions
This investigation has assessed the use of H. lacustris in a PMA-MFC for wastewater treatment, bioelectricity generation, and recovery of value-added products. It showed remarkable performance in terms of PDmax as 33.77 mW m−2, which can be further improved in future studies. The 16 S rRNA sequencing showed the dominance of Proteobacteria(71.94%). Furthermore, high algal biomass (118 mg L−1 (DW)), total carotenoids (224.6 µg g−1), astaxanthin (1.76 µg g−1) and lipids (172.31 µg g−1) were revealed on day 40 in PMA-MFCt1. The research cross-checked the PMA-MFCt2 with a control having its electrode wires not connected (PMA-MFCnw) and with the cathodic media not replenished every time microalgal samples were taken for analysis. It was found that PMA-MFCt1 outperformed PMA-MFCt2 in terms of bioelectricity, cell growth and physiological and biochemical parameters. The daily dry biomass accumulation in PMA-MFCt1 was lower than its control, while in PMA-MFCt2, it exceeded that of its control (PMA-MFCnw). These trends can be attributed to the addition of nutrient media in both PMA-MFCt1 and its control, whereas no such supplementation was provided in PMA-MFCt2 or its control. The production of insignificant astaxanthin in PMA-MFCt1 and its higher PDmax, and significant astaxanthin in PMA-MFCt2 and its poor PDmax, whereas no microalgae in PMA0-MFC are correlated to photosynthetic and electron flux in ORR pathways. However, besides using H. lacustris other potential microalgae can be further explored as a cathodic species towards multiple resource recovery of value-added products.

Average physiochemical parameters intensity changes of five fed batch cycles for 40 days in a PMA-MFCt1, (A) Anode, (B) Cathode, (C) Control, (D) Anode of PMA-MFCt2, PMA-MFCnw, PMA0-MFC and (E) Cathode of PMA-MFCt2, PMA-MFCnw, PMA0-MFC.

Polarization curve of reactors (A) PMA-MFCt1, (B) PMA-MFCt2, (C) PMA0-MFC and (D) COD removal of PMA-MFCt1, PMA-MFCt2, PMA-MFCnw, PMA0-MFC.

Summary of microbial community profiles in the multilevel Krona function annotation diagram depicting taxonomic hierarchies where each cycle represents taxonomic levels of the bacterial communities in wastewater of PMA-MFCt1 (A) sample of 1st day and (B) sample of day 40 at anodic chamber; (C) Heatmap is representing the abundance of different taxonomic groups of bacteria and the number are representing the percentage of abundance of a particular group on day 1 and day 40.

Haematococcus lacustris in cathode of PMA-MFCt1 from day 1 to day 40 (A) Cell count (B); Specific growth and Logistic kinetics with respect to cell count in PMA-MFCt1 and control flask (C) total weight of biomass of control flask and PMA-MFCt1 reactor from day 1 to 40 days, (D) Semi log plot growth kinetics with respect to biomass in PMA-MFCt1 and control flask (E) total lipid percentage and lipid concentration MFC reactor and (F) Chlorophyll ‘a’, ‘b’, ‘a + b’ and total carotenoids in PMA-MFCt1 and Astaxanthin in PMA-MFCt1 and control flask.

Astaxanthin and other carotenoids identified by liquid chromatography-mass spectrometry (LC-MS) from Haematococcus lacustris cells at cathode in a PMA-MFCt1 for the presence of, (A) Astaxanthin fragment at RT 3.68 at m/z 279.08 detected in day 1 sample and on day 40, the LCMS showed (B) Halocynthiaxanthin at RT 6.71 min at m/z 233.08; (C) Docosahexaenoic acid (DHA) at 4.36 min at m/z 326; (D) at 7.11 min at m/z 139.08 fragments of fatty acid hexacosanedioic acid, carotenoids neoxanthin and vioxanthin; (E) astaxanthin diester at RT 8.23 m/z 1119.58; (F) Astaxanthin mono esters at retention time (RT) 15.92 min at m/z 579.58 and 596.83 and palmitic acid at 15.92 min at m/z 255.33.
Data availability
Data availability Data available at accession numbers NCBI, USA at accession numbers OQ619015 and OQ619014(SUB12949021 NS1_E01.ab1 OQ619014 and SUB12949021 NS4_E06.ab1 OQ619015). https://submit.ncbi.nlm.nih.gov/subs/genbank/SUB12949021/overview.
References
-
Hiew, B. Y. Z. et al. Review on synthesis of 3D graphene-based configurations and their adsorption performance for hazardous water pollutants. Process Saf. Environ. Prot. 116, 262–286 (2018).
-
Verma, P. et al. A comprehensive review on microalgal chromium detoxification in tannery wastewater: paving the way for biobased products. Process Saf. Environ. Protection (2024).
-
Anandapadmanaban, B. H., Liu, S. H. & Lin, C. W. Prospects of microalgae in the cathode chamber of microbial fuel cells: from sequestration to bioproduct production. Biomass Bioenerg. 194, 107616 (2025).
-
Logan, B. E. & Regan, J. M. Electricity-producing bacterial communities in microbial fuel cells. Trends Microbiol. 14, 512–518 (2006).
-
Rai, A. et al. Textile dye removal using diatomite nanocomposites: a metagenomic study in photosynthetic microalgae-assisted microbial fuel cells. RSC Adv. 15, 8300–8314 (2025).
-
Logan, B. E. et al. Microbial fuel cells: methodology and technology. Environ. Sci. Technol. 40, 5181–5192 (2006).
-
Greenman, J., Gajda, I. & Ieropoulos, I. Microbial fuel cells (MFC) and microalgae; photo microbial fuel cell (PMFC) as complete recycling machines. Sustain. Energy Fuels. 3, 2546–2560 (2019).
-
Khandelwal, A., Vijay, A., Dixit, A. & Chhabra, M. Microbial fuel cell powered by lipid extracted algae: a promising system for algal lipids and power generation. Bioresour. Technol. 247, 520–527 (2018).
-
Arun, S., Sinharoy, A., Pakshirajan, K. & Lens, P. N. Algae based microbial fuel cells for wastewater treatment and recovery of value-added products. Renew. Sustain. Energy Rev. 132, 110041 (2020).
-
Melis, A. Solar energy conversion efficiencies in photosynthesis: minimizing the chlorophyll antennae to maximize efficiency. Plant Sci. 177, 272–280 (2009).
-
Saba, B., Christy, A. D., Yu, Z. & Co, A. C. Sustainable power generation from bacterio-algal microbial fuel cells (MFCs): an overview. Renew. Sustain. Energy Rev. 73, 75–84 (2017).
-
Lin, C. C., Wei, C. H., Chen, C. I., Shieh, C. J. & Liu, Y. C. Characteristics of the photosynthesis microbial fuel cell with a spirulina platensis biofilm. Bioresour. Technol. 135, 640–643 (2013).
-
Sevda, S. & Abu-Reesh, I. M. Improved petroleum refinery wastewater treatment and seawater desalination performance by combining osmotic microbial fuel cell and up-flow microbial desalination cell. Environ. Technol. 40, 888–895 (2019).
-
Colombo, A. et al. Assisting cultivation of photosynthetic microorganisms by microbial fuel cells to enhance nutrients recovery from wastewater. Bioresour. Technol. 237, 240–248 (2017).
-
Abazarian, E., Gheshlaghi, R. & Mahdavi, M. A. Impact of light/dark cycle on electrical and electrochemical characteristics of algal cathode sediment microbial fuel cells. J. Power Sources. 475, 228686 (2020).
-
Mohamed, S. N., Hiraman, P. A., Muthukumar, K. & Jayabalan, T. Bioelectricity production from kitchen wastewater using microbial fuel cell with photosynthetic algal cathode. Bioresour. Technol. 295, 122226 (2020).
-
Sharma, A. & Chhabra, M. Performance evaluation of a photosynthetic microbial fuel cell (PMFC) using chlamydomonas reinhardtii at cathode. Bioresour. Technol. 338, 125499 (2021).
-
Panis, G. & Carreon, J. R. Commercial Astaxanthin production derived by green Alga haematococcus pluvialis: A microalgae process model and a techno-economic assessment all through production line. Algal Res. 18, 175–190 (2016).
-
Wilawan, B. et al. Advancement of carotenogenesis of Astaxanthin from haematococcus pluvialis: recent insight and way forward. Mol. Biotechnol. 1–22 (2023).
-
Ahirwar, A. et al. Light modulates transcriptomic dynamics upregulating Astaxanthin accumulation in haematococcus: A review. Bioresour. Technol. 340, 125707 (2021).
-
Liyanaarachchi, V. C. et al. Astaxanthin accumulation in the green microalga haematococcus pluvialis: effect of initial phosphate concentration and stepwise/continuous light stress. Biotechnol. Rep. 28, e00538 (2020).
-
Ahirwar, A. et al. Nanotechnological approaches to disrupt the rigid cell walled microalgae grown in wastewater for value-added biocompounds: commercial applications, challenges, and breakthrough. Biomass Convers. Biorefinery. 1–26 (2021).
-
Sirotiya, V. et al. Astaxanthin bioaccumulation in microalgae under environmental stress simulated in industrial effluents highlighting prospects of haematococcus pluvialis: knowledge gaps and prospective approaches. Phytochem. Rev. 22, 1041–1066 (2023).
-
Ahirwar, A. et al. Photosynthetic microbial fuel cell for bioenergy and valuable production: A review of circular bio-economy approach. Algal Res. 70, 102973 (2023).
-
Das, S., Raj, R., Das, S. & Ghangrekar, M. M. Evaluating application of photosynthetic microbial fuel cell to exhibit efficient carbon sequestration with concomitant value-added product recovery from wastewater: a review. Environ. Sci. Pollut. Res. 30, 98995–99012 (2023).
-
Mekuto, L. et al. Microalgae as a Biocathode and feedstock in anode chamber for a selfsustainable microbial fuel cell technology: a review. S. Afr. J. Chem. Eng. 31, 7–16 (2020).
-
Khan, M. J. et al. Diatom microalgae as smart nanocontainers for biosensing wastewater pollutants: recent trends and innovations. Bioengineered. 12, 9531–9549 (2021).
-
Khandelwal, P. et al. Physiochemical and biological techniques in wastewater treatment with an emphasis on algal microbial fuel cell. Emerg. Trends Adv. Microb. Electrochem. Technol. 341–382 (2024).
-
Khan, M. J., Das, S., Vinayak, V., Pant, D. & Ghangrekar, M. Live diatoms as potential biocatalyst in a microbial fuel cell for harvesting continuous diafuel, carotenoids and bioelectricity. Chemosphere. 291, 132841 (2022).
-
Reddy, C. N., Nguyen, H. T., Noori, M. T. & Min, B. Potential applications of algae in the cathode of microbial fuel cells for enhanced electricity generation with simultaneous nutrient removal and algae biorefinery: current status and future perspectives. Bioresour. Technol. 292, 122010 (2019).
-
Juang, D., Lee, C. & Hsueh, S. Comparison of electrogenic capabilities of microbial fuel cell with different light power on algae grown cathode. Bioresour. Technol. 123, 23–29 (2012).
-
Qin, L. et al. Photosynthetic microalgae microbial fuel cells for bioelectricity generation and microalgae lipid recovery using Gd-Co@ N-CSs/NF as cathode. Chem. Eng. J. 490, 151647 (2024).
-
Zhang, L., Li, C., Ding, L., Xu, K. & Ren, H. Influences of initial pH on performance and anodic microbes of fed-batch microbial fuel cells. J. Chem. Technol. Biotechnol. 86, 1226–1232 (2011).
-
Popat, S. C., Ki, D., Rittmann, B. E. & Torres, C. I. Importance of OH – transport from cathodes in microbial fuel cells. ChemSusChem. 5, 1071–1079 (2012).
-
Liu, T., Rao, L., Yuan, Y. & Zhuang, L. Bioelectricity generation in a microbial fuel cell with a self-sustainable photocathode. Sci. World J. 2015 (2015).
-
Wu, X., Song, T., Zhu, X., Wei, P. & Zhou, C. C. Construction and operation of microbial fuel cell with chlorella vulgaris Biocathode for electricity generation. Appl. Biochem. Biotechnol. 171, 2082–2092 (2013).
-
Liu, T., Rao, L., Yuan, Y. & Zhuang, L. Bioelectricity generation in a microbial fuel cell with a self-sustainable photocathode. Sci. World J. 2015, 864568 (2015).
-
Logan, B. E. Exoelectrogenic bacteria that power microbial fuel cells. Nat. Rev. Microbiol. 7, 375–381 (2009).
-
Mahto, K. U. & Das, S. Electroactive biofilm communities in microbial fuel cells for the synergistic treatment of wastewater and bioelectricity generation. Crit. Rev. Biotechnol. 45, 434–453 (2025).
-
Mohan, S. V., Raghavulu, S. V., Peri, D. & Sarma, P. Integrated function of microbial fuel cell (MFC) as bio-electrochemical treatment system associated with bioelectricity generation under higher substrate load. Biosens. Bioelectron. 24, 2021–2027 (2009).
-
Logan, B. E. et al. Microbial fuel cells: methodology and technology. 40, 5181–5192 (2006).
-
Koók, L., Nemestóthy, N., Bélafi-Bakó, K. & Bakonyi, P. Investigating the specific role of external load on the performance versus stability trade-off in microbial fuel cells. Bioresour. Technol. 309, 123313 (2020).
-
Mehrotra, S., Kumar, V. K., Gajalakshmi, S. & Pathak, B. Bioelectrogenesis from ceramic membrane-based algal-microbial fuel cells treating dairy industry wastewater. Sustain. Energy Technol. Assess. 48, 101653 (2021).
-
Kakarla, R. & Min, B. Sustainable electricity generation and ammonium removal by microbial fuel cell with a microalgae assisted cathode at various environmental conditions. Bioresour. Technol. 284, 161–167 (2019).
-
Powell, E. E., Mapiour, M. L., Evitts, R. W. & Hill, G. A. Growth kinetics of chlorella vulgaris and its use as a cathodic half cell. Bioresour. Technol. 100, 269–274 (2009).
-
Yadav, G., Sharma, I., Ghangrekar, M. & Sen, R. A live bio-cathode to enhance power output steered by bacteria-microalgae synergistic metabolism in microbial fuel cell. J. Power Sources. 449, 227560 (2020).
-
Ieropoulos, I., Greenman, J. & Melhuish, C. Improved energy output levels from small-scale microbial fuel cells. Bioelectrochemistry. 78, 44–50 (2010).
-
Rozendal, R. A., Hamelers, H. V. & Buisman, C. J. Effects of membrane cation transport on pH and microbial fuel cell performance. Environ. Sci. Technol. 40, 5206–5211 (2006).
-
Liu, H., Ramnarayanan, R. & Logan, B. E. Production of electricity during wastewater treatment using a single chamber microbial fuel cell. Environ. Sci. Technol. 38, 2281–2285 (2004).
-
Pant, D., Van Bogaert, G., Diels, L. & Vanbroekhoven, K. A review of the substrates used in microbial fuel cells (MFCs) for sustainable energy production. Bioresour. Technol. 101, 1533–1543 (2010).
-
Capodaglio, A. G. et al. Microbial fuel cells for direct electrical energy recovery from urban wastewaters. Sci. World J. 2013, 634738 (2013).
-
Pant, D., Van Bogaert, G., De Smet, M., Diels, L. & Vanbroekhoven, K. Use of novel permeable membrane and air cathodes in acetate microbial fuel cells. Electrochim. Acta. 55, 7710–7716 (2010).
-
Capodaglio, A. G. et al. Microbial fuel cells for direct electrical energy recovery from urban wastewaters. Sci. World J. 2013 (2013).
-
Hadiyanto, H., Christwardana, M. & da Costa, C. Electrogenic and biomass production capabilities of a Microalgae–Microbial fuel cell (MMFC) system using tapioca wastewater and spirulina platensis for COD reduction. Energy Sources Part. A Recov. Util. Environ. Effects. 1–12 (2019).
-
Xu, C., Poon, K., Choi, M. M. & Wang, R. Using live algae at the anode of a microbial fuel cell to generate electricity. Environ. Sci. Pollut. Res. 22, 15621–15635 (2015).
-
Don, C. D. Y. A. & Babel, S. Circulation of anodic effluent to the cathode chamber for subsequent treatment of wastewater in photosynthetic microbial fuel cell with generation of bioelectricity and algal biomass. Chemosphere. 278, 130455 (2021).
-
Wang, Y. et al. Cost-effective domestic wastewater treatment and bioenergy recovery in an immobilized microalgal-based photoautotrophic microbial fuel cell (PMFC). Chem. Eng. J. 372, 956–965 (2019).
-
Koller, M. Design of closed photobioreactors for algal cultivation. Algal Biorefineries: 2: Prod. Refin. Design. 133–186 (2015).
-
Mohan, S. V., Srikanth, S., Chiranjeevi, P., Arora, S. & Chandra, R. Algal Biocathode for in situ terminal electron acceptor (TEA) production: synergetic association of bacteria–microalgae metabolism for the functioning of biofuel cell. Bioresour. Technol. 166, 566–574 (2014).
-
Ge, Z., Li, J., Xiao, L., Tong, Y. & He, Z. Recovery of electrical energy in microbial fuel cells: brief review. Environ. Sci. Technol. Lett. 1, 137–141 (2014).
-
Park, Y., Park, S., Yu, J. & Lee, T. Effects of anode spacing and flow rate on energy recovery of flat-panel air-cathode microbial fuel cells using domestic wastewater. Bioresour. Technol. 258, 57–63 (2018).
-
Yolanda, Y. D. et al. Simultaneous nutrient-abundant hydroponic wastewater treatment, direct carbon capture, and bioenergy harvesting using microalgae–microbial fuel cells. Desalin. Water Treat. 321, 100941 (2025).
-
Tao, Z., Jing, Z., Tao, M. & Chen, R. Recycled utilization of ryegrass litter in constructed wetland coupled microbial fuel cell for carbon-limited wastewater treatment. Chemosphere. 302, 134882 (2022).
-
Zhang, K., Cao, H., Luo, H., Chen, W. & Chen, J. Enhanced MFC sensor performances and extracellular electron transport efficiency mediated by Biochar and underlying biochemical mechanisms. J. Environ. Manag. 332, 117282 (2023).
-
Mei, X. et al. The interplay of active energy harvesting and wastewater organic loading regulates fermentation products and microbiomes in microbial fuel cells. Resour. Conserv. Recycl. 183, 106366 (2022).
-
Liu, Q. et al. Interpreting the degradation mechanism of triclosan in microbial fuel cell by combining analysis Microbiome community and degradation pathway. Chemosphere. 321, 137983 (2023).
-
Ni, H. et al. Effects of concentration variations on the performance and microbial community in microbial fuel cell using swine wastewater. Energies. 13, 2231 (2020).
-
Ismail, Z. Z. & Jaeel, A. J. Sustainable power generation in continuous flow microbial fuel cell treating actual wastewater: influence of biocatalyst type on electricity production. Sci. World J. 2013 (2013).
-
del Campo, A. G. et al. Characterization of light/dark cycle and long-term performance test in a photosynthetic microbial fuel cell. Fuel. 140, 209–216 (2015).
-
Mourya, M. et al. Enhancing the biochemical growth of haematococcus pluvialis by mitigation of broad-spectrum light stress in wastewater cultures. RSC Adv. 13, 17611–17620 (2023).
-
Elakkiya, E. & Niju, S. Simultaneous treatment of lipid rich ghee industry wastewater and power production in algal Biocathode based microbial fuel cell. Energy Sour. Part A Recover. Util. Environ. Eff. 47, 252–262 (2025).
-
Solymosi, K. & Schoefs, B. Vol. 166 269–273 (Taylor & Francis, 2019).
-
Domınguez-Bocanegra, A., Legarreta, I. G., Jeronimo, F. M. & Campocosio, A. T. Influence of environmental and nutritional factors in the production of Astaxanthin from haematococcus pluvialis. Bioresour. Technol. 92, 209–214 (2004).
-
Ma, R. et al. Hyper-production of Astaxanthin from haematococcus pluvialis by a highly efficient nitrogen feeding strategy accompanied with high light induction. Algal Res. 85, 103865 (2025).
-
von Flotow, J. Über Haematococcus pluvialis. (1843).
-
Aflalo, C., Meshulam, Y., Zarka, A. & Boussiba, S. On the relative efficiency of two-vs. one‐stage production of Astaxanthin by the green Alga haematococcus pluvialis. Biotechnol. Bioeng. 98, 300–305 (2007).
-
Sirotiya, V. et al. Astaxanthin bioaccumulation in microalgae under environmental stress simulated in industrial effluents highlighting prospects of haematococcus pluvialis: knowledge gaps and prospective approaches. Phytochem. Rev. 1–26 (2022).
-
Khoo, K. S. et al. Recent advances in biorefinery of Astaxanthin from haematococcus pluvialis. Bioresour. Technol. 288, 121606 (2019).
-
Pantami, H. A. et al. Comprehensive GCMS and LC-MS/MS metabolite profiling of chlorella vulgaris. Mar. Drugs. 18, 367 (2020).
-
Das, S. & Ghangrekar, M. Tungsten oxide as electrocatalyst for improved power generation and wastewater treatment in microbial fuel cell. Environ. Technol. (2019).
-
Ghadge, A. N. & Ghangrekar, M. Development of low cost ceramic separator using mineral cation exchanger to enhance performance of microbial fuel cells. Electrochim. Acta. 166, 320–328 (2015).
-
Zhang, W. et al. Electrochemical activation of graphite felt electrode for VO2+/VO2 + redox couple application. Electrochim. Acta. 89, 429–435 (2013).
-
Tiwari, B. & Ghangrekar, M. Enhancing electrogenesis by pretreatment of mixed anaerobic sludge to be used as inoculum in microbial fuel cells. Energy Fuels. 29, 3518–3524 (2015).
-
Karthikeyan, R., Selvam, A., Cheng, K. Y. & Wong, J. W. C. Influence of ionic conductivity in bioelectricity production from saline domestic sewage sludge in microbial fuel cells. Bioresour. Technol. 200, 845–852 (2016).
-
Klindworth, A. et al. Evaluation of general 16S ribosomal RNA gene PCR primers for classical and next-generation sequencing-based diversity studies. Nucleic Acids Res. 41, e1–e1 (2013).
-
Bhowmick, G., Das, S., Verma, H., Neethu, B. & Ghangrekar, M. Improved performance of microbial fuel cell by using conductive ink printed cathode containing Co3O4 or Fe3O4. Electrochim. Acta. 310, 173–183 (2019).
-
Wang, H. et al. Degradation of algal organic matter using microbial fuel cells and its association with trihalomethane precursor removal. Bioresour. Technol. 116, 80–85 (2012).
-
Bailey, J. E. & Ollis, D. F. Biochemical Engineering Fundamentals (McGraw-Hill, 2018).
-
Lichtenthaler, H. K. & Buschmann, C. Extraction of phtosynthetic tissues: chlorophylls and carotenoids. Curr. Protoc. Food Anal. Chem. 1, F4. 2.1-F4. 2.6 (2001).
-
Boussiba, S. & Vonshak, A. Astaxanthin accumulation in the green Alga haematococcus pluvialis. Plant Cell Physiol. 32, 1077–1082 (1991).
-
Davies, B. & Goodwin, T. Chemistry and biochemistry of plant pigments. Carotenoids. 2, 38–165 (1976).
-
Bligh, E. G. & Dyer, W. J. A rapid method of total lipid extraction and purification. Can. J. Biochem. Physiol. 37, 911–917 (1959).
-
Mathimani, T., Uma, L. & Prabaharan, D. Optimization of direct solvent lipid extraction kinetics on marine trebouxiophycean Alga by central composite design–bioenergy perspective. Energy. Conv. Manag. 142, 334–346 (2017).
-
Li, M. et al. Carbon dioxide sequestration accompanied by bioenergy generation using a bubbling-type photosynthetic algae microbial fuel cell. Bioresour. Technol. 280, 95–103 (2019).
-
Zhang, Y., Zhao, Y. & Zhou, M. A photosynthetic algal microbial fuel cell for treating swine wastewater. Environ. Sci. Pollut. Res. 26, 6182–6190 (2019).
-
Jadhav, D. A., Jain, S. C. & Ghangrekar, M. M. Simultaneous wastewater treatment, algal biomass production and electricity generation in clayware microbial carbon capture cells. Appl. Biochem. Biotechnol. 183, 1076–1092 (2017).
-
Zhang, Y., He, Q., Xia, L., Li, Y. & Song, S. Algae cathode microbial fuel cells for cadmium removal with simultaneous electricity production using nickel foam/graphene electrode. Biochem. Eng. J. 138, 179–187 (2018).
-
Bazdar, E., Roshandel, R., Yaghmaei, S. & Mardanpour, M. M. The effect of different light intensities and light/dark regimes on the performance of photosynthetic microalgae microbial fuel cell. Bioresour. Technol. 261, 350–360 (2018).
-
Nguyen, H. T., Kakarla, R. & Min, B. Algae cathode microbial fuel cells for electricity generation and nutrient removal from landfill leachate wastewater. Int. J. Hydrog. Energy. 42, 29433–29442 (2017).
-
Ali, J. et al. Turning harmful algal biomass to electricity by microbial fuel cell: A sustainable approach for waste management. Environ. Pollut. 266, 115373 (2020).
-
Hadiyanto, H., Christwardana, M. & da Costa, C. Electrogenic and biomass production capabilities of a microalgae–microbial fuel cell (MMFC) system using tapioca wastewater and spirulina platensis for COD reduction. Energy Sour. Part A Recover. Util. Environ. Eff. 45, 3409–3420 (2023).
-
Ndayisenga, F., Yu, Z., Yu, Y., Lay, C. H. & Zhou, D. Bioelectricity generation using microalgal biomass as electron donor in a bio-anode microbial fuel cell. Bioresour. Technol. 270, 286–293 (2018).
Acknowledgements
AA is thankful to CEFIPRA Indo French project for SRF and Pre doctoral fellowships. MJK is thankful to DST Nanomission for post doc fellowships. GS is thankful to University Grant commission for the JRF fellowship; PK is thankful to Dr Harisingh Gour Central University for the University fellowship. VV would like to thank DST Nanomission project no (SR/NM/NT-1090/2014(G) and Indo-French Centre for the Promotion of Advanced Research IFCPAR/CEFIPRA) project number (PPMB-7133/2020) Indo-France Project sanctioned for the financial aids.
Ethics declarations
Competing interests
The authors declare no competing interests.
Additional information
Publisher’s note
Springer Nature remains neutral with regard to jurisdictional claims in published maps and institutional affiliations.
Supplementary Information
Rights and permissions
Open Access This article is licensed under a Creative Commons Attribution-NonCommercial-NoDerivatives 4.0 International License, which permits any non-commercial use, sharing, distribution and reproduction in any medium or format, as long as you give appropriate credit to the original author(s) and the source, provide a link to the Creative Commons licence, and indicate if you modified the licensed material. You do not have permission under this licence to share adapted material derived from this article or parts of it. The images or other third party material in this article are included in the article’s Creative Commons licence, unless indicated otherwise in a credit line to the material. If material is not included in the article’s Creative Commons licence and your intended use is not permitted by statutory regulation or exceeds the permitted use, you will need to obtain permission directly from the copyright holder. To view a copy of this licence, visit http://creativecommons.org/licenses/by-nc-nd/4.0/.
About this article

Cite this article
Ahirwar, A., Khan, M.J., Khandelwal, P. et al. Bioelectromics of a photosynthetic microalgae assisted microbial fuel cell for wastewater treatment and value added production. Sci Rep 15, 30196 (2025). https://doi.org/10.1038/s41598-025-13271-1
-
Received:
-
Accepted:
-
Published:
-
DOI: https://doi.org/10.1038/s41598-025-13271-1