Introduction
All living organisms undergo cellular processes to maintain a healthy life. These cellular processes are categorized into primary and secondary metabolism, and their difference lies in their biological effects1. Primary metabolites, including nucleotides, carbohydrates, and amino acids, are vital for growth, cellular maintenance, and the development of microorganisms. The secondary metabolites, also known as natural products (NPs), are not directly involved in growth or reproduction and the above-mentioned basic cellular functions. They play a chief role in ecological interactions, such as communication, defense mechanisms, and competition with other organisms2. Studies have revealed that more than 300,000 natural products are derived from diverse biological sources, such as marine organisms, plants, and microorganisms. These bioactive compounds have revolutionized the therapeutic industry, with approximately 50% of all marketed drugs originating from natural products. The remarkable structural diversity and therapeutic potential of NPs serve as a foundation for developing novel immunosuppressants, antineoplastic, and antibiotic agents3,4,5.
The historic discovery of the natural product penicillin, derived from Penicillium notatum, a filamentous fungus, by Sir Alexander Fleming in 1929, defined the therapeutic use of this compound in the 1940s. This event marked the onset of the usage of microorganisms instead of plants as vital sources of natural therapeutic products6,7. Microorganisms are a significant source of structurally diverse bioactive metabolites that have yielded some predominant products for the pharmaceutical industry. Among the microbiota, bacteria have proven to be the most extensive microbial producers of bioactive natural products. They are considered living bio-factories due to their versatile biocatalytic activity, allowing them to interact with various substrates and undergo rapid evolutionary change8,9.
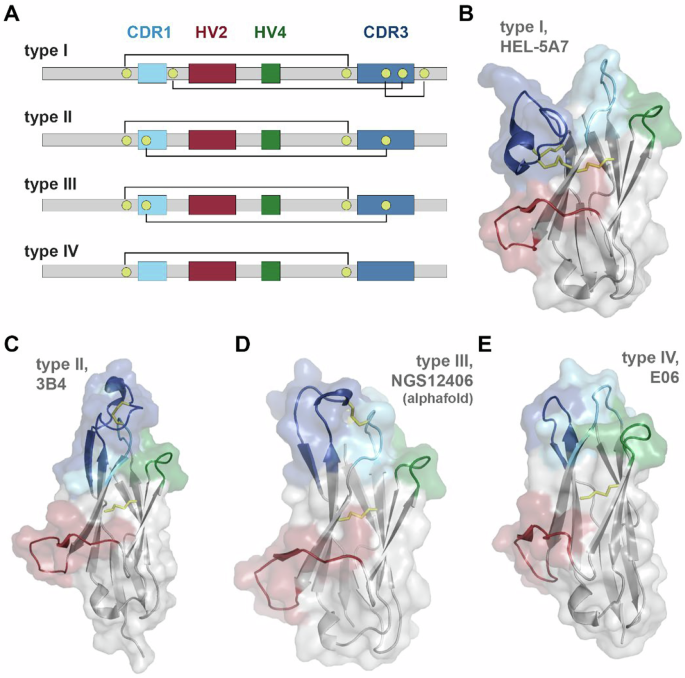
Novel natural therapeutic products can be obtained by applying advanced applications, such as genetic engineering of microorganisms, animal models, genome sequencing, and high-throughput analysis (Fig. 1)10,11. NPs like antibiotics, such as penicillin (from Penicillium notatum and Penicillium chrysogenum), cephalosporins (from Cephalosporium acremonium), aminoglycosides (from Streptomyces griseus and Micromonospora purpurea), tetracyclines (from Streptomyces aureofaciens and Streptomyces rimosus), and other polyketides of many structural types have their different modes of action12,13,14. This is due to the difference in chemical and biological properties of the microorganisms from which they are derived, allowing them to act differently on pathogens. NPs such as immunosuppressive agents, cholesterol-lowering agents, anti-helminthic agents, antidiabetic agents, antineoplastic agents, etc., also act as per their source microorganisms15,16.

Schematic Representation of the production and processing of NPs.
Bacteria exhibit a method for exchanging genetic information, enabling them to modify chemical production for various applications. It is mainly due to a group of co-localized genes known as biosynthetic gene clusters (BGCs). BGCs perform their functions by encoding ‘core biosynthetic and tailoring enzymes’ and providing resistance to ‘small molecular compounds’. The genetic packages coded by BGCs, also known as “Selfish Operons”, are highly evolved for horizontal gene transfer17. They are considered independent evolutionary entities due to their mobile genetic elements. This exchange of genetic elements is highly favored among closely related strains due to the mechanism of DNA mismatch, repair, and maintenance. These genomic clusters mainly work via two major biosynthetic pathways: Polyketide Synthases (PKSs), type 1 and type 2, and Non-Ribosomal Peptide Synthases (NRPSs)18,19. PKS and NRPS are renowned targets in genome mining for producing natural therapeutic products. PKSs have a large multifunctional enzyme that acts successively in an assembly line fashion by adding acyl units onto the growing polyketide chain20. Consequently, non-ribosomal peptide synthetases function by adding an extended unit of amino acids. They perform post-translational modifications of ribosome-synthesized precursors. Numerous prominent peptide-derived metabolites, such as penicillin, cephalosporin, glycopeptide, and cyclosporin, are assembled in both bacteria and fungi by the NRPS21,22.
Different investigations have shown that bacteria constitute several ‘Orphan BGCs’, which do not encode for natural products. ‘Genome Mining’ has enabled easier isolation and taxonomical analysis for myriad compounds. However, most of these compounds are not linked to their respective BGCs. It is difficult to decipher the number of ‘Orphan Clusters’ that encode for novel or known compounds whose biosynthetic machinery has not been identified yet23,24. The current study exhibits the isolation, identification, and analysis of four novel bacterial isolates: Klebsiella pneumoniae, Klebsiella quasi-pneumoniae, Streptomyces minutiscleroticus, and Streptomyces peucetius. It highlights their antagonistic activity and potential to produce natural therapeutic products by studying the optimization of media conditions and establishing a statistical and neural network regression model. Further research could lead to the development of novel medications that can contribute to expanding the understanding of microbial biochemistry and pave the way for the progress of innovative pharmaceuticals that could play a crucial role in addressing current challenges in healthcare and transforming the landscape of natural therapeutic products.
Materials and methods
Sample collection
The bacterial samples were collected from agricultural fields near the Ranga Reddy district, Telangana, India (“17.3891 N 77.8367 E”). The sampling site was rich in flora and consisted of diverse agricultural plant species. A soil probe or trowel was utilized to collect the rhizosphere soil samples at varying depths. Subsequently, numerous soil sub-samples were prepared, added to a larger container, and mixed thoroughly to make a homogenous mixture. After mixing, a small amount (~ 300 mg) of the prepared homogenous mixture was added to 50 mL sterilized, self-sealed, and labeled Falcon tubes. The sterilized Falcon tubes were initially kept at ambient temperature and then at 4 °C. The temperature was maintained until the next step of analysis25,26.
Isolation of the microbial consortia
After field sampling, the collected bacterial consortia were isolated, 90 mL of peptone saline solution (0.1% peptone (w/v), 0.85% NaCl) and 10 g of the homogenized soil sample were suspended, incubated in an orbital shaker for 1 h at 30 °C at 150 rpm, and then allowed to stand for 30 min. After incubation, 1mL of the aliquot was taken and added to 99 mL of nutrient broth (g/L): 5U supplemented with 5 U of peptone, 1 U of beef/yeast extract, 15 U of agar, 5 U of NaCl and distilled water (HiMedia, India). 4 U of nystatin antifungal agent was added to prevent fungal growth and the solution was then re-incubated for 3–4 days at 30 °C at 150 rpm. After incubation, suspensions were serially diluted (10−1 to 10−8). 100 µL from each dilution was spread plated onto the nutrient agar plates using a L-shaped sterilized spreader. The plates were re-incubated at 30 °C for 48 h. Distinct bacterial colonies were chosen and subjected to subculturing in fresh nutrient media. Pure cultures were stored at 4 °C. The concentration of the bacterial consortia was obtained using a UV/Vis spectrophotometer (Optical Density (OD) at A600) (Thermo Fisher Scientific)6,27,28.
Standardization and preparation of the inoculum to produce NPs
For the standardization procedure, a 0.5 McFarland solution was prepared by mixing 99.5 mL of 0.18 mol/L (1% v/v) of sulfuric acid (H2SO4) and 0.5 mL of 0.048 mol/L (1.1750% w/v) of dehydrated barium chloride (BaCl2) solution. Subsequently, the turbidity of the standardized solution was calculated in different test tubes. The absorbance of 0.5 McFarland solution was computed at OD – 600 nm (A600) (0.8–1.0) (Thermo Fisher Scientific). To prevent evaporation and concentration loss due to light, the standardized solution was kept in an airtight container at room temperature (RT). Before comparing the bacterial suspension, the turbidity standard tube was thoroughly mixed using a vortex to obtain a consistent turbid appearance. After overnight incubation, a 5 mL (0.5 McFarland) bacterial culture was suspended in a nutrient broth and incubated for 4 h at 37 °C. The turbidity was regulated by employing a sterile cotton swab. The inoculum was distributed uniformly in the entire agar medium by swirling the plate at an angle of 60°28,29.
Screening of the bacterial isolates to produce NPs
Primary screening
The production of NPs was assessed by determining the potential antagonistic activity of the selected isolates. The primary screening was conducted against the test bacterial strains by employing a transverse pattern on nutrient agar plates. The selected bacterial strains were streaked horizontally and incubated for 24–36 h at 30 °C. After incubation, the test microorganisms (Escherichia coli (MTCC 739) and Bacillus subtilis (MTCC 121)) were streaked perpendicularly (at 90 °) to the screened isolates. The plates were re-incubated for 24–48 h at 30 °C. The antagonistic activity was determined by observing the inhibitory or lytic activity at the intersecting regions. The bacterial isolates that gave affirmative results were selected for secondary screening to validate their bioactivity. All the experiments were conducted in triplicate. Their outcomes were assessed in the form of mean ± standard error mean (SEM)30,31.
Seed overlay method/crowd plate technique
The bacterial isolates displaying antagonistic activity in primary screening were subjected to the seed overlay assay. The isolates were spot-inoculated using a sterile metal needle onto a rich nutrient agar plate and incubated for 48 h at 30 °C. After incubation, 2 mL of chloroform was added to each plate to stop the bacterial growth and allow production of secondary metabolites only. The plates were re-incubated for 1 h at RT. 100 µL of test pathogenic bacteria (Bacillus subtilis (MTCC 121)) was mixed thoroughly with 2 mL of chilled nutrient broth containing 0.6% agar and spread uniformly over treated plates and incubated for 24 h. The antagonistic activity was determined by calculating the zone of inhibition (ZOI), suggesting the effective production of bioactive compounds. All the experiments were conducted in triplicate. Their outcomes were assessed in the form of mean ± standard error mean (SEM)31,32.
Secondary screening
The bacterial strains that demonstrated positive results in the preceding assays were further selected for secondary screening by using the agar well diffusion method. All the active bacterial strains were cultured in the nutrient broth at 30 °C and 150 rpm for 24 h. After incubation, the cultures were adjusted to procure an OD-600 nm (A600) ~ 0.8 using a UV/Visible Spectrophotometer (Thermo Fisher Scientific). The cultures were centrifuged for 10 min at 5000 x g to obtain a cell-free crude extract, then stored at 4 °C.
The test pathogen (Staphylococcus aureus (MTCC 96)) was swabbed onto Muller Hinton (MH) agar (HiMedia, India) plates to generate a carpet texture using a sterile cotton swab. After swabbing, five wells (6 mm diameter and 10 mm deep) were constructed on the agar plate using a sterile cork borer. Each well was loaded with 100 µL of the crude extract at different concentrations: C1–100%, C2–50%, and C3–25%. An antibiotic disc (ciprofloxacin) at 100 ppm was used as the positive control, while distilled water was used as the negative control. The plates were allowed to rest for 1–2 h and incubated for 24 h at 37 °C, and then their ZOIs were measured. All the experiments were conducted in triplicate. Their outcomes were assessed in the form of mean ± standard error mean (SEM)24,24.
Determination of MBC and MIC
The Minimum Bacterial Concentration (MBC) and Minimum Inhibitory Concentration (MIC) of the subsequent bacterial strains were determined from the cell-free crude extract against the test pathogen (Staphylococcus aureus (MTCC 96)). The secondary metabolites obtained from secondary screening were extracted and concentrated in a dissolved nutrient broth. A two-fold serial dilution of the extract was made at varying concentrations (100%, 50%, 25%, 12.5%, 6.25%, 3.125%, and 1.562%). 0.1 mL of the standardized test inoculum and 0.1 mL of cell extract were added to all eight test tubes. Additionally, 0.1 mL of distilled water was added as a negative control in the remaining test tube. All the test tubes were incubated for 18–24 h at 37 °C. After incubation, the MIC was determined by observing the test tubes with no visible turbidity. 0.1 mL solution was taken from these test tubes and plated onto MH agar (HiMedia, India) and incubated for 24 h at 37 °C. Following incubation, MBC was assessed by studying the presence or absence of bacterial colonies. All the experiments were conducted in triplicate. Their outcomes were assessed in the form of mean ± standard error mean (SEM)24,33.
Antibiotic susceptibility testing (AST)
Antibiotic Susceptibility Testing (AST) was conducted, employing the disk diffusion method. The selected bacterial cultures were swabbed onto MH agar plates (HiMedia, India) using a sterile cotton swab to make a carpet texture. The plates were then incubated for 10 min. After equal spreading, the selected isolates were tested for their activity against six antimicrobial agents at various concentrations: amoxicillin (10 µg), cefotaxime (30 µg), ampicillin (10 µg), ciprofloxacin (5 µg), amikacin (30 µg), and erythromycin (15 µg). The plates were then sealed and incubated for 24 h at 37 °C. Antagonistic behavior was determined by measuring the ZOI. All the experiments were conducted in triplicate. Their outcomes were assessed in the form of mean ± standard error mean (SEM)33,34.
Biochemical and morphological screening
The examined bacterial isolates were stored in nutrient slants at 4 °C. Primary identification was done by determining the cell morphology characteristics, colony formation, and Gram staining. A series of biochemical tests were conducted to identify secondary identification of bacterial strains. The observed bacterial characteristics were compared with Bergey’s Manual of Determinative Bacteriology as a reference. A temperature of 37 °C was maintained for all the biochemical tests35.
gDNA isolation, purification, and PCR amplification
After a series of screening procedures, the genomic DNA (gDNA) was extracted, employing the phenol/chloroform method. For verifying the purity and integrity of the bacterial strains, the extracted gDNA was run on 1% agarose gels in 1x TAE buffer (Tris-acetate-EDTA: pH 8.3, 89 mM Tris base, 89 mM boric acid, and 2 mM EDTA in 1 L of water) at 10 V mm-1 for 90 min. The results were inspected under a UV transilluminator and recorded using Bio-Rad’s Gel Doc XR. The samples were amplified using GeneJET PCR Purification and Gel Extraction Kit (Thermo Fisher Scientific), which contained a master mix of 50 µL: 1 µL of Taq DNA polymerase enzyme (3U/mL), 1 µL of gDNA template, 10X Polymerase assay buffer, 4 µL of deoxy-nucleoside triphosphates dNTPs (2.5mM each), 2 µL of universal forward and reverse universal primers (each), 1X of gel loading buffer, and 30 µL of water. The amplified products were run for 30 cycles. The gDNA was stored at 4 °C. PCR product was obtained and reloaded onto the 1% agarose gels against the 500 bp ladder for gDNA detection32,36,37,38,39.
16S rRNA sequencing
The amplified and eluted gene products were further subjected to chain termination sequencing (16S rRNA sequencing; ribotyping) to identify the specific bacterial 16S rRNA gene products. After obtaining the necessary partial sequences, raw data files (trace files exhibiting forward and reverse sequence information) were procured from each sequenced sample. DNA Baser software version 5.15 was used to assemble the trace files (.ABI files) that were obtained from the sequencer to create the contigs. The contigs were stored in fasta format for further bioinformatic analysis40,41,42,43,44,45. The bacterial source of the sequence was identified by aligning it against sequences exhibiting the maximum identity score from the NCBI-GenBank Database46. For comparative analysis, the BLASTn47 was used. BLASTn-generated hits of the recorded sequences exhibiting < 95% similarity were considered poor quality and were excluded from the study48.
Molecular identification and phylogenetic analysis
Phylogenetic analysis plays a chief role in revealing the systematic relationships among diacritic species, especially those that fall within novel microcosm lineages. The topological similarities among phylogenetic trees can be projected by employing specific algorithms that incorporate the nodal structures of a tree and construct a multidimensional model. These algorithms are further applied to quantify the discrepancies between subtrees49,50. The phylogenetic trees were constructed by formulating a taxonomic list that included the information on the procured 16S rRNA sequences and similarity search-driven sequences via BLASTn. The highly similar sequences were subsequently aligned with each other in multiple sequence alignment (MSA) format by utilizing the Muscle algorithm51,52,53. The Neighbor-Joining (NJ) method was used for the database set, which included the unweighted pair-group method with arithmetic averaging (UPGMA) and the maximum likelihood model for tree construction. The bootstrap test results were aggregated after 1000 replicates for all taxa. Molecular Evolutionary Genetics Analysis version XI (MEGA-XI) software was used for conducting the evolutionary analysis54,55.
Optimization of media components to produce NPs
The media optimization was performed by preparing the inoculum as mentioned above. The antagonistic activity was calibrated by the agar well diffusion method. The different parameters were optimized using a one-variable-at-a-time (OVAT) approach to obtain a substantial result56.
Effect of different media
To enhance the yield of the NPs and analyze their antagonistic activity, different liquid media cultures were used, such as, Starch Inorganic Salt broth (SIS), Yeast Malt Dextrose extract broth (YMD), Starch Casein broth (SC), Tryptone Yeast extract broth (TYE), Glycerol-Asparagine broth (GA), Glucose Soybean Meal broth (GSB), Oat-Meal broth (OM) and Tyrosine broth (TB). The initial pH of all the cultures was adjusted to 7.0. Each culture medium was incubated at 37 °C for 7 days at 150 rpm with 1% (v/v) inoculum56,57.
Effect of incubation pH
To determine the optimal pH for maximum antagonistic activity, a 5 mL aliquot of spore suspension of the Streptomyces peucetius strain was inoculated into a 250 mL flask containing 100 mL of SC medium at different pH values (3–11). Each culture medium was incubated at 37 °C for 7 days at 150 rpm36,57,58.
Effect of the incubation temperature
To determine the optimal incubation temperature for maximum antagonistic activity, a 5 mL aliquot of spore suspension of the Streptomyces peucetius strain was inoculated into a 250 mL flask containing 100 mL of SC medium at various temperatures (28–51 °C). Each culture medium was incubated at 37 °C for 7 days at 150 rpm36,57,58.
Effect of the incubation period
To determine the optimal incubation period for maximum antagonistic activity, a 5 mL aliquot of spore suspension of the Streptomyces peucetius strain was inoculated into a 250 mL flask containing 100 mL of SC medium and incubated for 1–14 days under constant conditions (pH 7, 150 rpm, 37 °C). 5 mL of culture was taken aseptically at 24-hour intervals over the stipulated period36,57,58.
Effect of carbon and nitrogen source and their concentrations
To determine the optimal carbon source for maximum antagonistic activity, a 5 mL aliquot of spore suspension of the Streptomyces peucetius strain was inoculated into a 250 mL flask containing 100 mL of SC medium. The cultures were supplemented with 1% (w/v) of different carbon sources: rhamnose, sucrose, D-glucose, maltose, inositol, starch, lactose, mannitol, xylose, D-fructose, or D-galactose. Consecutively, the cultures were supplemented with 0.4% (w/v) of different nitrogen sources: ammonium sulfate, casein, sodium nitrate, peptone, L-asparagine, yeast extract, potassium nitrate, urea, beef extract, and tryptone. Subsequently, the best carbon and nitrogen supplies were regulated independently at different concentrations to yield the maximum antagonistic activity. Each culture medium was incubated at 37 °C for 7 days at 150 rpm36,57,58.
Analysis and extraction of the optimized NPs
At the end of each optimization step, 5 mL of the culture was taken aseptically. Each culture broth was centrifuged at 5000 rpm for 10 min to separate the biomass. The supernatants were filtered via Millipore filter, then transferred aseptically into a conical flask and stored at 4 °C. Consequently, solvent extraction of secondary metabolites was conducted using ethyl acetate59.
Dry weight of NPs
Extracts were utilized to analyze NP’s dry weight, purity, and concentration. The initial wet weight of the extract was determined by meticulously weighing the designated sample with an analytical balance. The extract was dried in an oven at 80 °C to evaporate the moisture in a 24-hour cycle. After drying, the samples were re-weighed to calculate the final dry weight60,61. The following calculations (Eq. i and Eq. ii) were conducted to evaluate the amount of water removed during the process:
$$begin{aligned}Final:dry:weight: of: NP hspace{0.17em}=&hspace{0.17em} ,initial:wet:weight:of:petri:plate:-\ & qquad qquad quad , weight:with:water:removedend{aligned}$$
(i)
$$:Dry: weight: of: NP :left({%}right)=:frac{Final:dry:weight:}{Initital:wet:weight}:mathsf{X}:100::$$
(ii)
Statistical optimization to produce NPs
Statistical optimization of the medium components was performed to obtain the maximum yield of NPs from the bacterial strains. The study was conducted in three phases: Plackett–Burman (PB) design, followed by a response surface methodology (RSM) method in conjunction with a Box–Behnken design (BBD), and lastly an artificial neural network design (ANN). The responses were expressed as their ZOI. The investigation was carried out in triplicate. The findings were expressed as mean ± standard error mean (SEM).
Plackett–Burman design (PBD)
Plackett–Burman design (PBD), a two-level factorial design method, was used to identify the optimum medium components that significantly affect the production of natural therapeutic products62. The Plackett–Burman experimental design is formally based on a first-order regression model that employs the following formula (Eq. iii):
$$:{Y=beta}_{0}+{sum}^{k}{beta}_{i}{chi}_{i}$$
(iii)
where Y is the response variable, β0 denotes the model intercept, β denotes the linear coefficient, ({chi}_{i}) denotes the independent variables in the coded format, and k denotes the number of variables involved.
The model designates no integration among factors. It was primarily utilized for screening and evaluating the factors that strongly influence the production of NPs from a pool of available candidates63. Using the deductions of OVAT, Inositol and L-asparagine were found to be excellent carbon and nitrogen sources, respectively, to produce NPs64,65,66. The screened carbon and nitrogen sources were evaluated along with other aggregates for PBD optimization experiments. In total, ten independent variables were used: three physical — pH, temperature, and inoculum period, and seven nutritional — inositol, starch, L-asparagine, yeast extract, K2HPO4, FeSO4.7H2O, and ZnSO4.7H20 (Table 1). The experiments were designed using R programming version 4.3.167. The investigations were determined at two different levels: low (−1) and high (+ 1)64,68,69,70,71.
Box‒Behnken design (BBD)
The investigations from the PBD were utilized for executing the response surface methodology (RSM) experimental model. The RSM model is a compilation of mathematical and statistical techniques that revolve around fitting the polynomial equation of the experimental data. Following the preliminary range of the extraction variables, a three-level, three-full-factor design (TFFD) Box‒Behnken design (BBD) experimental model was devised for determining the finest combination of extraction variables72,73.
Sixteen experimental runs of the BBD were performed to assess the three independent variables – pH (4, 7, and 10), temperature (10, 30, and 60), and inositol concentration (2, 4, and 6) at three distinct coded levels; low (−1), medium (0) and high (+ 1). The significance level of each variable was established based on data from preliminary studies (Table 2).
To predict the optimal point, a second-order polynomial equation was fitted, determining the correlation between the independent variables and the NPs by the bacterial isolates (Eq. iv):
$$:Y={beta}_{0}+::sumnolimits_{i=1}{beta}_{ii}{X}_{i}^{2}:+:sumnolimits_{i=1}^{n}sumnolimits_{j=i+1}^{n}{beta}_{ij}{X}_{i}{X}_{j}:+varepsilon:::::::$$
(iv)
where Y is the response variable; β0, βi, βii, and βij denote the regression coefficients for the intercept, linear, quadratic, and interaction terms, respectively; Xi and Xj denote the independent variables (i ≠ j). ε signifies the random error or discrepancies between the predicted and measured values. R programming version 4.3.1 was used for conducting the regression analysis of the experimental model74,75,76,77.
Statistical analysis of the data
The data regarding the production of NPs by the bacterial isolates were subjected to evaluate the t-value, p-value, and other statistical determinants (Eqs. v-vii). An analysis of variance (ANOVA) was conducted to evaluate the model’s statistical significance, impact, and interactions of the independent variables. The goodness and lack of fit of all the model equations were expressed by the coefficient of determination R2 and Adjusted-R2. The statistical and regression coefficient significance were determined by employing Fisher’s test at a probability value (p) ≤ 0.05. The optimal extraction conditions were assessed via linear and multiple regression model analysis using graphical presentations: pareto (2D), response surface (3D), and cube (3D) plots by employing the R programming version 4.3.164,66,67,68,69,70,71,72,73,74,75,76,77. Additionally, statistical heatmaps were constructed using Python programming version 3.12.478.
$$:text{M}text{S}text{E}:=:::frac{1}{n}:sumnolimits_{i=1}^{n}(y-widehat{y})^2$$
(v)
$$:text{R}text{M}text{S}text{E}:=:sqrt{frac{1}{n}}sumnolimits_{i=1}^{n}(y-widehat{y})^2:$$
(vi)
$$:text{M}text{A}text{E}:=::frac{1}{n}sumnolimits_{i=1}^{n}left|widehat{y}-yright|:$$
(vii)
where Mean Squared Error (MSE), Root Mean Squared Error (RMSE), and Mean Absolute Error (MAE). n denotes the number of samples, y signifies the anticipated values of the response variable, and (:widehat{y}) signifies the predicted values of the response variable.
Artificial neural network (ANN)
An Artificial Neural Network (ANN) configuration was employed for optimizing and predicting the target variables based on the input features. Python version 3.12.478 and PyTorch version 2.6.079 were employed for constructing the neural network model. The ANN model was trained by utilizing the independent variables from the RSM model80,81. To enhance the prediction capability, the dataset was pre-processed before conducting the model training. The Standard-Scaler module from scikit-learn82 was employed for normalizing and standardizing the input features (pH, temperature, and inositol concentration) and target variables (ZOI). Equitable assessment of the model was facilitated by classifying the dataset: training (70%), testing (15%), and validation (15%)83.
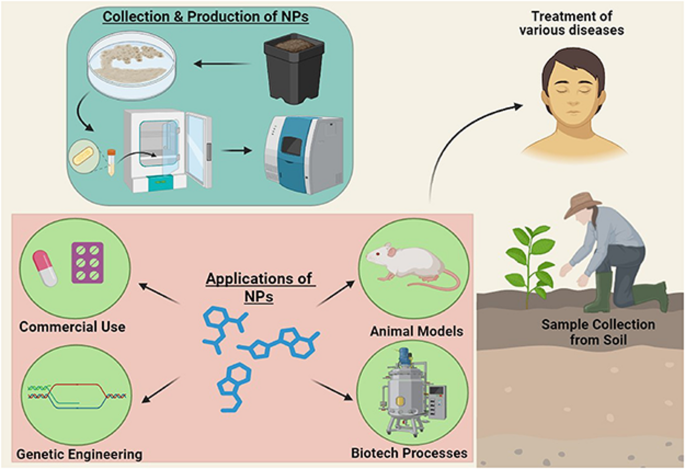
The ANN model skeleton constituted a three-layer feedforward neural network framework. The model topology exhibited an input layer with three neurons, the hidden layer with adaptive neurons (between three to seven), and the output layer with one neuron. The hidden layer deployed a hyperbolic tangent (Tansig) activation function, while the output layer incorporated a pure linear activation function (Purelin). The graphical working representation of the ANN model has been illustrated in Fig. 2. The predicted values of the ANN model were determined by calculating the output from each neuron in the hidden layer and by summing each neuron and its weight (Eqs. viii-ix)84,85:
$$:{H}_{i}:=tanhleft(0.5right(sumnolimits_{m=1}^{N_i}left({w}_{i.m}{x}_{m}right)+:{b}_{i}left)right)$$
(viii)
$$:Y_{ANN}=sumnolimits_{i=1}^{N_h}{{w}}_{2,{i}}{{H}}_{{i}}:+:{{b}}_{{h}}$$
(ix)
where Hi is the hidden layer, Xm, is the value for the input variable, bi and bh are the biases in the input and hidden layers, respectively.
Schematic representation of the ANN model.
The model training was executed by the implementation of the Levenberg-Marquardt (LM) algorithm, using the Limited-memory Broyden-Fletcher-Goldfarb-Shanno (LBFGS) optimizer. L2 regularization was used to improve the model’s generalizability and mitigate the model’s overfitting capability. The MSE loss function was applied as the parameter for evaluating the performance of the model and calculating the difference between the experimental and predicted values. The training of the model effectively terminated when the generalization procedure ceased to improve due to a rise in the validation MSE values. Sensitivity analysis was conducted based on the Garson equation86 (Eq. x). The final model was subjected to numerous statistical measures87,88.
$$:{I}_{j}=frac{sum:_{m=1}^{m={N}_{h}}left{:right(:frac{left|{W}_{jm}^{jh}right|}{sum:_{k=1}^{{N}_{i}}left|{W}_{km}^{ih}right|}):times::|{W}_{mn}^{ho}left|right}}{sum:_{k=1}^{k={N}_{i}}{:sum:_{m=1}^{m={N}_{i}}(:frac{left|{W}_{km}^{jh}right|}{sum:_{k=1}^{{N}_{i}}left|{W}_{km}^{h}right|}):times::|{W}_{mn}^{ho}left|right}}:times::100$$
(x)
where Ij is the relative importance (%) for jth parameter of model output. Ni and Nh are the input and hidden layer neurons, respectively. W is the connection weight, while i, h, and o are the input, hidden, and output layers, respectively. The variables k, m, and n are the neuron numbers in the input, hidden, and output layers, respectively.
Validation of the ANN models
The validation analysis of the ANN model is a crucial step in evaluating the model’s robustness, generalization, and reliability for varied datasets. The focus was to assess the ANN model’s performance with the concealed data. It further inhibited the underfitting or overfitting process. Therefore, k-fold Cross-Validation (CV) was employed to determine the model’s performance. Python version 3.12.4 and PyTorch version 2.6.0 were employed to conduct the validation analysis54,89.
Determination of the 16S rRNA structure
The secondary structures of 16S rRNA were constructed by applying free energy minimization techniques. These free energies were procured from experimental measurements of RNA structural element stability25,90,91,92,93,94,95. The secondary structure determination of the 16S rRNA was performed by utilizing the Unified Nucleic Acid Folding and Hybridization Package (UNAfold) with the MFold server. This server implements the Zuker-Stiegler algorithm for calibrating the minimum free-energy structure depending on the nearest neighbor model. The empirical estimates of the thermodynamic properties and the sub-optimal structures having a certain degree of free energy were determined for the rRNA structures. The mole fractions of the structures as a function of UV absorbance (A260), heat capacity (Cp), temperature, and complete melting profiles for melting simulations were also calculated96,97,98,99,100.
Results
Sample collection, isolation, and biochemical characterization of bacteria to produce NPs
The collected microbial consortia were grown on a nutrient agar medium. The pure bacterial colonies were obtained, in which one hundred and seventy-two different colonies from bacterial genera were isolated and characterized (Fig. 3 (a)). Among the total bacterial samples, four gave positive and affirmative results for the antagonistic activity. The screened cultures belonged to different bacterial species: Klebsiella pneumoniae (Isolate 1–5.37 108 CFU/mL), Klebsiella quasipneumoniae (Isolate 2–5.05 108 CFU/mL), Streptomyces minutiscleroticus (Isolate 3–5.32 108 CFU/mL), and Streptomyces peucetius (Isolate 4–5.6 108 CFU/mL). A comprehensive list and analysis of the biochemical test results are provided in [Supplementary Material 1, Table S1, and Figures S1–S9] and Fig. 3(b).

a) Distribution of bacteria in the microbial consortia, b) Biochemical tests for Streptomyces peucetius (Isolate 4); A: Pure culture of the isolate, B: Gram staining, C: Citrate utilization test, and D: Urease test.
Quantitative screening of soil samples to produce NPs
Primary screening
The antagonistic potential of the selected bacterial isolates was determined via transverse streaking. The four bacterial strains (Isolate 1 – Isolate 4) were streaked horizontally on nutrient agar plates and incubated for 24–36 h at 30 °C. After incubation, the test bacteria (Escherichia coli (MTCC 739) and Bacillus subtilis (MTCC 121)) were vertically streaked on the nutrient plates. Table 3 portrays the results for all the isolates’ transverse streaking patterns, suggesting that the bacterial strains (Isolate 1 – Isolate 4) were more sensitive against the gram-positive test organisms. The result for Streptomyces peucetius has been illustrated in [Supplementary Material 1, Figure S10 (a)].
Seed Overlay – Crowd plate technique
The seed overlay method was applied to ensure the production of NPs in the nutrient agar culture containing the isolates. It was revealed that all the isolates exhibited antagonistic behavior against B. subtilis. The antagonistic activity was demonstrated by calculating the occurrence of halo zones in the plates (Table 4). The result for Streptomyces peucetius has been illustrated in Fig. 4 (a) and [Supplementary Material 1, Figure S10 (b)].
Secondary screening and determination of MIC and MBC
The antagonistic activity of the isolates was determined by secondary screening via the agar disc diffusion method. S. aureus was swabbed onto MH agar plates. The crude extracts of the isolates were added at various concentrations: C1, C2, and C3, at 100%, 50%, and 25%, respectively. The well denoted as the positive control contained the antibiotic ciprofloxacin (100 ppm), while the well for the negative control contained 100 µL of distilled water. The results of the agar well diffusion method for all the bacterial isolates are depicted in Table 5. The result for Streptomyces peucetius has been illustrated in Fig. 4 (b) and [Supplementary Material 1, Figure S10 (c)].
The MIC and MBC were also calibrated from the test tubes (Table 6). Additionally, it was revealed that test tubes with higher concentrations of crude extract exhibited little to mild turbidity, in contrast to those with lower concentrations.
Antibiotic susceptibility testing
The antibiotic susceptibility testing was conducted using the disk diffusion method on an MH agar medium. The susceptibility profiles of all the bacterial strains are described in Table 7. The results revealed that Streptomyces peucetius displayed the highest susceptibility towards cefotaxime and ciprofloxacin and the least susceptibility to amoxicillin and erythromycin. Notably, although ciprofloxacin was administered at the lowest concentration (5 µg), it exhibited enhanced sensitivity as compared to other antimicrobial agents, including amikacin, which was tested at a greater concentration (30 µg). This determined the augmented intrinsic potency of ciprofloxacin against Streptomyces peucetius. The representative antibiotic susceptibility results for Streptomyces peucetius are displayed in Fig. 4 (c) and [Supplementary Material 1, Figure S10 (d)].

Visual representation of the antagonistic activity of Streptomyces peucetius: a) Seed Overlay Assay, b) Agar Diffusion Assay, and c) Antibiotic Susceptibility Testing.
Identification of the bacterial isolates
The gDNA was isolated from all designated samples by the phenol/chloroform extraction method. The samples were subjected to gene amplification in a thermal cycler using PCR. Four sets of PCR cocktail mixes were prepared, and different molecular characteristics were confirmed. Taxonomic tests revealed familiar and distinctive traits for Klebsiella and Streptomyces species. For PCR gene amplification, genus-specific universal primers were used: (forward) 5’-GGATGAGCCCGCGGCCTA-3’ and (reverse) 5’-CGGTGTGTACAAGGCCCGG-3’ for Isolates 1 – Isolates 2, while (forward) 5’-ATGTGCAAGGCCGGTTTCGC-3’ and (reverse) 5’-TACGAGTCCTTCTGGCCCAT-3’ for Isolates 3 – Isolates 4. After amplification, the proteins were quantified with a NanoDrop and Qubit fluorometer. The DNA yield was in the range of (1279.3 µgL−1 – 1281.6 µgL−1) for all the isolates via Qubit fluorometer, which was of suboptimal quality and purity.
The ribotyping results were further used to study the taxonomic and molecular characteristics of the isolated bacterial strains, in which both the forward and reverse template strands were sequenced. The trace files (.ABI files) obtained from the sequencer were further assembled using DNA Baser software to produce the contigs, which were then saved in fasta format. The procured sequences were aligned against the BLASTn software. This approach yielded an array of myriad taxonomic sequences exhibiting high grades of homology, but none demonstrated a 100% similarity match, suggesting their novel identity. The partial 16S rRNA sequences were deposited in the GenBank database and named Klebsiella pneumoniae strain ABSKSLAB01, Klebsiella quasipneumoniae strain ABSKSLAB02, Streptomyces minutiscleroticus strain ABSKSLAB03 and Streptomyces peucetius strain ABSKSLAB04, with accession numbers ‘OP597532’, ‘OP597545’, ‘OQ061473’ and ‘PP086938’, exhibiting 1396 bp, 1284 bp, 1025 bp and 908 bp respectively. The GC% for the strains ABSKSLAB01 – ABSKSLAB04 was 54.94%, 54.6%, 59.32%, and 58.37%, while AT% was 45.06%, 45.4%, 40.68%, and 41.63%, respectively.
Molecular phylogenetic analysis
The comparative rRNA/ITS database BLASTn analysis generated a 1200-hit taxonomic list for the sample input sequences. Twenty sequences that exhibited > 95% similarity were selected. The generated BLASTn hits pertained to query coverage, percentage identity score, E-value, and other edifying details.
The phylogenetic assessment was performed by multiple sequence alignment using the Muscle algorithm in MEGA-XI software. The algorithm calculated a complex matrix that was manually aligned. Species-specific trees were constructed by employing the NJ method. The coding gaps were signified in binary format. The branch support and the subsequent topology were unaffected by the missing data. A phylogram was devised by taking twenty nucleotide sequences in total. All the ambiguous positions were removed from every sequence pair using the pairwise deletion position method. All the trees were inferred from 1000 replicates of the bootstrap consensus algorithm. The branches reproducing partitions in < 50% bootstrap replicates were collapsed. The trees devised for strains ABSKSLAB01 - ABSKSLAB04 had the Sum of Branched Length (SBL) values of 0.056, 0.045, 0.018, and 0.043, respectively. The designated positions for the final dataset entry for evolutionary analysis were 1397, 1285, 1025, and 913, respectively. The phylogenetic tree and evolutionary heatmap for Streptomyces peucetius strain ABSKSLAB04 have been illustrated in Fig. 5; for all the other species, the trees and their subsequent heatmaps have been demonstrated in [Supplementary Material 2, Figures S11–S13]. The evolutionary heatmaps were constructed using R programming version 4.3.1 by employing ggplot2101, ggtree102, and phylogram103 libraries.
Among the identified strains, the top three strains with the highest identity to the query sequence for ABSKSLAB01 were Klebsiella pneumoniae strain DSM 30,104 (99.50%), Klebsiella pneumoniae subsp. ozaenae strain ATCC 11,296 (99.28%), and Klebsiella quasipneumoniae subsp. quasipneumoniae strain 01A030 (99.28%). Similarly, for ABSKSLAB02 were Klebsiella quasipneumoniae subsp. similipneumoniae strain 07A044 (99.45%), Klebsiella pneumoniae subsp. rhinoscleromatis strain R-70 (99.45%), and Klebsiella africana strain SB5857 (99.30%). For ABSKSLAB03, the primary hits were Streptomyces minutiscleroticus strain NLR2A3 (99.51%), Streptomyces minutiscleroticus strain NBRC 13,000 (99.51%), and Streptomyces carpiniensis strain NRRL B-16,921 (98.41%). For ABSKSLAB04 were Streptomyces peucetius strain NBRC 100,596 (99.27%), Streptomyces peucetius strain 0 M-30-152 (98.88%), and Streptomyces peucetius strain JCM 9920 (98.18%).
The phylogenetic assessment of all the novel isolates indicated the total number of sites in each alignment with the total number of conserved, variable, singleton, and parsimonious-info sites. A gamma distribution (0.0500) was employed for determining the evolutionary rate differences among these diacritic sites. The substitution patterns and rates were assessed by using the Tamura–Nei model. The mean evolutionary rates in these cadres were 0.00, 0.00, 0.00, 0.03, and 4.97 substitutions per site, for which the tree topology was computed for maximum log-likelihood [Supplementary Material 2, Table S2]. It was calculated using the substitution matrix rules [Supplementary Material 2, Tables S3, S5, S7, and S9] that estimated the transition/transformation bias (R): 1.73, 1.46, 0.9, and 1.04 of samples via the Kimura 2-parameter model.
The maximum composite likelihood and UPGMA models were used for calibrating the evolutionary distances. The results were devised in units of the number of base substitutions per site. The sum of substitution (r) was set equal to 100. All the ambiguous positions were removed using pairwise deletion [Supplementary Material 2, Tables S4, S6, S8, and S10]. Distance metric and statistical analysis via Tajima’s neutrality test were conducted, which removed all the ambiguous positions from each sequence pair. It revealed that the selected novel isolates did not evolve neutrally, confirming their conserved nature [Supplementary Material 2, Tables S11-S12].

Phylogenetic analysis of the Streptomyces peucetius strain ABSKSLAB04; a) Phylogenetic tree and b) Phylogenetic heatmap.
Optimization of Streptomyces peucetius to produce NPs
The ability of the Streptomyces peucetius to produce NPs was influenced by the selective medium, nutrients, and growth conditions. The maximum antagonistic activity was obtained in the SC medium, followed by the GSB medium. The modified starch casein medium was composed of 1 g/L carbon and a nitrogen source, 0.3 g/L casein, 2 g/L K2HPO4, 0.10 g/L CaCO3, 2 g/L KNO3, 2 g/L NaCl, 2 g/L K2HPO4, 0.01 g/L ZnSO4, 0.1 g/L MgSO4, 0.01 g/L ZnSO4, 0.01 g/L FeSO4, and distilled water (1 L). This composition showed the highest activity and was selected as the production medium for further experiments. The other media displayed mitigated growth and decreased bioactivity (Fig. 6 (i)).
The optimal nutritional and culture parameters strongly influenced the growth of Streptomyces peucetius to produce NPs. The bioactivity was estimated at various pH values, in which the maximum value was obtained at pH 7.0 (ZOI = 26 mm), suggesting its stability at neutral pH. The activity was also determined at varying temperatures, in which the temperature range between 30 and 40 °C gave the maximum value (ZOI = 27 mm), suggesting its mesophilic growth. Moreover, this also suggests that this is an ideal temperature for the chaperone development that may influence the formation of various therapeutic products (Fig. 6 (ii-iii)). The incubation period was adjusted within a fixed range (1–14 days) by cultivating the culture in the production medium that revealed maximum bioactivity on the 8th day. The bioactivity remained stable between the 7th and 9th day, after which it started to decrease (Fig. 6 (iv)).
Furthermore, optimal nutritional conditions were employed to increase the yield of NPs. Different carbon and nitrogen sources were investigated in the production medium. The antagonistic activity was obtained from all the carbon sources, in which the maximum value was obtained by inositol (ZOI = 29 mm), followed by starch (ZOI = 27 mm). The least activity was by rhamnose (ZOI = 5 mm). Studies have revealed that the digestion of complex carbon sources (polysaccharides) is a slow process and thus induces the synthesis of therapeutic products. This can mainly be explained by glucose catabolic repression, which causes the inhibition of essential enzymes to produce NPs. Subsequently, among the nitrogen sources, L-asparagine had the maximum activity (ZOI = 26 mm), followed by potassium nitrate (ZOI = 24 mm), and tryptone had the least activity (ZOI = 9 mm) (Fig. 6 (v-vi)). The best carbon and nitrogen sources were also assessed at various independent concentrations, which revealed maximum activity at 4% (carbon) and 0.3% (nitrogen) (Fig. 6 (vii-viii)). Thus, explaining the importance of amino acids and nitrogen sources as the direct precursor of NPs.


(i) different media, (ii) pH, (iii) temperature, (iv) incubation period, (v) carbon source, (vi) nitrogen source, (vii) carbon concentration, and (viii) nitrogen source concentration for procuring maximum antagonistic activity for Streptomyces peucetius.
Statistical optimization of the media components to produce NPs by Streptomyces peucetius
The statistical optimization of medium components for maximum antagonistic activity was implemented in three steps: Plackett–Burman design, RSM employing Box–Behnken design, and Artificial Neural Network.
Screening of potent factors via Plackett–Burman design
The Plackett–Burman design was used to investigate the influence of different variables on determining the efficiency of Streptomyces peucetius to produce NPs. In total, ten independent variables that varied in their media components were screened. Each variable was examined in twelve trials, with high levels denoted as + 1 and lower levels denoted as −1.
The PDB matrix determined the outcome of the experimental design and the predicted values of the response variable as represented by (Y). The results determined that the highest value of the response variable was represented by 26.2742 mm – 12th run, and the lowest value was represented by 9.2792 mm – 6th run. Consequently, for the predicted values, the highest value was represented by 26.2993 mm – 12th run, and the lowest was represented by 9.3043 mm – 6th run. The large variation in these values indicated the importance of medium optimization for augmenting the production of NPs. The experimental data was then fitted into a 1 st -order linear polynomial equation that numerically explained the statistical significance of each variable with their anticipated and experimental values [Supplementary Material 3, Table S13] and graphically represented as a heatmap (Fig. 7 (a)) with the equation below (Eq. xi):
$$begin{aligned}&text{NP} = 20.77828 + 2.33984^*text{A} – 2.25225^*text{B} + 0.884218^*text{C} \ &- 0.04588^*text{D} – 1.35969^*text{E} + 0.754922^*text{F} + 1.810143^*text{G}\ & qquad quad + 2.94044^*text{H} + 4.525359^*text{I} – 0.75075^*text{J}end{aligned}$$
(xi)
The statistical analysis revealed that the coefficient R2, which reflected the model’s goodness of fit, was 1.0, and the adjusted R2 (adj– R2) was 99%. A higher score suggests a more favorable match between the experimental and predicted values. The values of the adj–R2 need to be high and relatively close to the normal R2, confirming the numerical explanation by the regression model. The significance of the model was further confirmed by employing Fisher’s test of F-model = 7459 on 10 and 1 DF, with a p-value of 0.00901, which indicated 99.01% confidence.
The factors examined in this study contributed differently to produce NPs by Streptomyces peucetius, which corresponds to the following factors; positive outcome: inositol, L-asparagine, FeSO4.7H2O, and ZnSO4.7H20, pH, and temperature. In addition, some factors had negative outcomes: starch, K2HPO4, yeast extract, and incubation period (Fig. 7 (b)). Other parameters of the regression model, such as the main effect and t-value, were also calibrated, along with the normal plot of the standardized effect designating the significance of the model [Supplementary Material 3, Figures S14–S16]. The results of the statistical coefficients (Table 8) and ANOVA analysis with the lack of fit (Table 9) reflected a clear fit. All the plots were constructed using R programming version 4.3.1, while statistical heatmap was constructed using Python programming version 3.12.4 by employing Matplotlib and Seaborn libraries104 for enhanced clarity.

PBD Plots; a) PBD Result Matrix, and b) Pareto Chart of Coefficient Estimates.
Optimization of Streptomyces peucetius via Box–Behnken design
Response Surface Methodology (RSM) is a key technique for modeling and analyzing engineering queries. The RSM model was conjugated with the Box–Behnken model design. The BBD model exhibited sixteen experimental runs with three replicates of the central point for attaining the statistical data. [Supplementary Material 3, Table S14] denotes the BBD design matrix, which shows the outcomes of the experimental design and the predicted values of the response variable. The antagonistic activity’s mean diameter was calculated, in which the highest value was represented by the 12th run (29.8197 mm), and the lowest value was represented by the 5th run (4.1627 mm). Conversely, for the predicted values, the highest value was denoted by the 2nd run (27.9418 mm), while the lowest value was denoted by the 3rd run (5.7571 mm). The results are graphically represented as a heatmap (Fig. 8 (a)). The experimental data were then fitted into a three-factor interaction, 2nd -order quadratic polynomial equation, in which the model numerically explained the substantial correlation between the anticipated and experimental values, as depicted below (Eq. xii):
$$begin{aligned}&qquadquadtext{NP} = 5.757196 + 1.423655text{ph} – 1.53755: text{temp} – 6.37797: text{inositol} \ &quad- 6.39424: text{ph}^*text{temp} +0.357947: text{ph}^*text{inositol} + 0.227785: text{temp}^* text{inositol} \ &+ 7.248436: text{ph}^2 + 4.531289: text{temp}^2 + 7.492491: text{inositol}^2 end{aligned}$$
(xii)
The regression model was further examined by assessing the coefficients. The student’s t-test was employed to establish the significance of each coefficient (Table 10). The ANOVA results demonstrated that the model adequately represented the data. It had coefficients of multiple determinations, with Fisher’s test value of 11.798 for the F-model and 0.00355 for DF 3 and 9. It had a p-value of 0.00355 with 99.64% confidence (Table 11). Furthermore, multiple R2 and Adjusted R2 (adj-R2) values were evaluated, corresponding to 91.65% and 86.63%, respectively, suggesting higher accuracy. The MSE (3.6785) and RMSE (1.918) displayed the least amount of difference between the actual and expected values. The model’s accuracy was also supported by the MAE (1.698), suggesting a low average prediction error.
Two-dimensional contour plots, three-dimensional response plots, and three-dimensional cube plots were generated to test the stability of producing NPs by Streptomyces peucetius against the dependent variables (pH, temperature, and inositol concentration) (Fig. 8 (b-d)). Moreover, the model diagnostics were performed in which, the power transformation of the response variables was calibrated via box – cox plot suggesting its stability within 95% confidence range [Supplementary Material 3, Figure S17], the quality of the regression model was determined using residual v/s run plot, indicating the acceptable range of the residuals [Supplementary Material 3, Figure S18]. The normal probability plot for residuals and standardized effect also confirmed the significance of the regression model [Supplementary Material 3, Figures S19-S20]. The plot [Supplementary Material 3, Figure S21] defined the actual and predicted values, revealing that they are close to each other. All the plots were constructed using R programming version 4.3.1, while statistical heatmap was constructed using Python programming version 3.12.4 for enhanced clarity.


RSM plots; a) RSM Result Matrix, b) 2D surface plots, c) 3D response plots, and d) 3D cube plots.
Optimization of Streptomyces peucetius via artificial neural network
Artificial Neural Networks (ANN) have been established as an alternative for modeling complex and non-linear relationships in various scientific fields. The performance of the ANN model was systematically determined by calculating the statistical metrics of the training, test, and validation datasets, which revealed an average MSE (0.0277), an average R² value (92.23%), an average adjacent-R² (90.83%), an average RMSE (0.1477), and an average MAE (0.0968). The augmented value of R² indicated the exceptional predictive capacity of the model. The statistical significance was further calculated by a p-value (7.63e-19), suggesting a highly robust correlation between the predicted and experimental values. The highest and lowest ANN-predicted values follow the same trend as the experimental values. The results are graphically represented as a heatmap (Fig. 9 (a)), and the result matrix is situated in [Supplementary Material 3, Table S15].
The model exhibited a network topology of three neurons in the input layer, varying hidden neurons (five models; neurons between three and seven), and a single neuron in the output layer. The model exhibited an iteration count of 112, 1000 epochs per model, and a learning rate of 0.01 for the LBFGS optimizer. These parameters allowed a suitable trade-off between stability and training speed. The connection weight analysis suggested that pH is a key parameter, followed by inositol concentration and temperature [Supplementary Material 3, Table S16].
Furthermore, the model’s performances were examined with key visualizations. The loss curve illustrated the progressive iterations in the model training method with a gradual decline in the MSE values. It had minimal fluctuations followed by stabilization over successive training epochs, suggesting high efficacy of the model to generalize beyond training data (Fig. 9 (b)). The model’s assessment was further determined with the help of regression analysis (Fig. 9 (c)) and parity plot [Supplementary Material 3, Figure S22]. This provided an in-depth insight into the model’s reliability, predictiveness, and accuracy. The data points from all the datasets were plotted with their experimental and predicted values. It showed that maximum predictions were clustered around the reference line of Y = X, with a small number of deviations, indicating a negligible systematic bias for the calibrated model. Despite a few tolerable deviations in the datasets, the model confirmed its fitness since most data points existed near the centered zero line [Supplementary Material 3, Figure S23]. The error distribution plot demonstrated an error density spread near the centered zero line, indicating a normal distribution and confirming the absence of significant bias in the model [Supplementary Material 3, Figure S24]. All the plots were constructed using Python programming version 3.12.4.

a) ANN Result Matrix Heatmap, b) ANN MSE loss curve, and c) ANN Regression Analysis.
Validation of RSM-governed ANN model
The cross-validation results demonstrated that the ANN model attained a mean MSE value of 0.0533, which is very close to the constructed ANN mean MSE value of 0.027. Hence, this suggests the model sustains a lower error rate amongst different validation folds. The fluctuations in the MSE values remained in the tolerable range. The final iterations were in the stabilized category [Supplementary Material 3, Figure S25]. Subsequently, the validatory model had a mean R² of 97.71%, as compared to the constructed ANN R² value of 92.23%, suggesting a good fit. These results imply that the constructed ANN model generalizes well across different datasets, with no significant overfitting or bias. Moreover, it can also be seen that the predicted values are very close to the experimental values. Thus, optimal values for three independent variables were measured: pH 7 ± 1.2, temperature 40 ± 5 °C, and inositol concentration 5.5 ± 1.5, to produce maximum natural therapeutic product.
Additionally, the production yield of NPs was evaluated under both pre- and post-optimized conditions. Under the pre-optimized conditions, the crude extract yield was measured at 370 mg/L. Optimization through RSM enhanced the yield to 450 mg/L, resulting in a 1.22-fold increase. Consequently, the yield content was evaluated at 580 mg/L under ANN optimization, resulting in a 1.57-fold increase from the pre-optimized conditions, and a 1.29-fold enhancement over the RSM model. These outcomes highlighted the importance of ANN models and their superior nature over other models. All the plots were constructed using Python version 3.12.4.
Comparison of RSM and ANN models
ANN has proven to be a chief paradigm in computational modeling, having higher efficiency in analyzing intricate data, multidimensional affairs, and optimizing complex progressions. It works as an adaptive data-driven structure exhibiting hidden patterns and non-linear associations with high fidelity. Other statistical approaches, such as RSM, operate with a parametric architecture by analyzing quadratic and linear problems. This mitigates its applicability in systems that have intricate dependencies. In the current study, the performance of the constructed ANN model was systematically determined by taking the inputs from the RSM experimental design, consisting of three variables at three distinct levels. The predictions from both models were compared as previously shown in Fig. 9 (a).
The results demonstrated that ANN predictions are much closer to the experimental values, signifying the high efficiency in predictiveness. Furthermore, the predictability of the models was chiefly governed by the statistical evaluations [Supplementary Material 3, Table S17]. The results revealed that the ANN model was superior to the RSM model, due to higher values of R2 and Adj- R2 and mitigated values of MSE, RMSE, and MAE. This determined a higher generalization capacity of the constructed ANN model for different datasets [Supplementary Material 3, Figure S26]. The performance can also be understood by comparing the residual and parity plots, which show that the datapoints of the ANN model are closer to the central zero line, as compared to the datapoints of the RSM model [Supplementary Material 3, Figures S27 and S28, respectively]. All the plots were constructed using Python version 3.12.4.
Elucidation of 16S rRNA secondary structure
The 16S rRNA secondary structure was determined by employing RNA-UNAFOLD software, which revealed helical regions exhibiting an interior hairpin, bulged regions, and multi-branched loops that might bind with 23S rRNA, as illustrated in [Supplementary Material 4, Figures S29-S31 (a)] and Fig. 10 (a) for ABSKSLAB04. The ABSKSLAB01 – ABSKSLAB04 strains exhibited free energies (∆G) of −552.40 kcal/mol, −513.10 kcal/mol, −452.10 kcal/mol, and − 381.20 kcal/mol, respectively. The thermodynamic results from the dataset were also obtained (Table 12). Moreover, the entropy of the RNA structures was estimated using the Vienna RNA-fold server that generated an energy hill plot, as illustrated in [Supplementary Material 4, Figures S29-S31 (b)] and Fig. 10 (b) for ABSKSLAB04. The results suggested that the isolates have a stable secondary structure that can be used for further studies.

a) 16S rRNA 2° structure and b) Hill plot representing the sequence-wise energy and entropy distributions.
Discussion
Microorganisms are notable sources of structurally diverse bioactive metabolites and have produced myriad important compounds in the therapeutic sector. Natural products (NPs) are secondary metabolites that indirectly affect these microbes. Bacteria are vital producers of bioactive natural compounds. They have adaptable biocatalytic activity that allows them to interact with a wide range of substrates, which controls their unique ability to transform swiftly. The development of high-throughput analysis and genetic engineering has made it simpler to investigate the pathways for novel secondary metabolites. The studies have provided insight into the principles underlying their biosynthesis, which involve a collection of co-localized genes known as biosynthesis gene clusters (BGCs).
The present study aims to isolate, identify, and analyze four novel bacterial strains from Ranga-Reddy district, Telangana, that exhibit the potential to produce NPs, namely, Klebsiella pneumoniae strain ABSKSLAB01, Klebsiella quasipneumoniae strain ABSKSLAB02, Streptomyces minutiscleroticus strain ABSKSLAB03, and Streptomyces peucetius strain ABSKSLAB04.
Klebsiella species are traditionally nosocomial pathogens. They can survive in immune-compromised situations in varied hosts and acquire multidrug resistance. However, recent studies have highlighted that these facultative anaerobes have the potential as biotechnological commodities due to their diverse metabolic systems to produce numerous NPs, such as capsular polysaccharides, bacteriocins, lipopolysaccharides, and siderophores. These metabolites have acquired importance in pharmaceuticals, immunotherapy, and antimicrobial drug development applications. Despite numerous advantages, the industrial and clinical exploitation of Klebsiella species remains a huge burden due to the biosafety concerns. Studies have shown that these limitations can be overcome by the usage of advanced CRISPR-based genome editing and synthetic biology, causing deactivation of virulence-causing factors in the biosynthetic pathways. These genetically engineered Klebsiella strains can be analyzed in sealed bioreactor systems for ensuring safety and scalability105,106,107. Furthermore, studies have shown that genus Streptomyces has the capability to produce numerous NPs, due to their diverse metabolomes and higher genetic amenability108,109. The strain Streptomyces peucetius is widely known as the potent producer of the anthracycline antibiotics: daunorubicin and its semi-synthetic derivative, doxorubicin. These drugs are the prime functional agents due to their broad-spectrum efficacy against hematological malignancies and are highly used in the oncological sector110,111.
In this study, the designated samples were subjected to biochemical and antagonistic screening. Among these, the most significant outcome was obtained by Streptomyces peucetius strain ABSKSLAB04 (Isolate 4). Previous studies have proven the therapeutic potential of S. peucetius by characterizing peucemycin, a novel macrolide exhibiting antitumor and antibacterial capabilities. Therefore, Streptomyces species are considered a paramount resource due to their high metabolic flexibility and versatility to govern the biosynthesis of pharmacologically robust and structurally diverse NPs112.
The primary screening by transverse streaking revealed moderate to strong inhibitory effects against B. subtilis and E. coli, with Streptomyces peucetius (Isolate 4) demonstrating the highest inhibition. The seed overlay assay was performed as a confirmatory test, and the results were analyzed by measuring the ZOI around the designated bacterial strains. The results revealed that the ZOI for the Streptomyces species was larger as compared to the Klebsiella species. The secondary screening via the agar well diffusion assay was used to validate the efficiency of bacterial strains against S. aureus. The crude extracts of Streptomyces peucetius exhibited a substantially larger ZOI, especially against the control antibiotic ciprofloxacin. This suggests that the strain has high bioactive effectiveness and can be an appropriate candidate for natural therapeutic applications. The antagonistic efficiency of Streptomyces peucetius was further evaluated, and it showed very low MIC and MBC values. This implies that it can cease bacterial growth at mitigated concentrations. The antibiotic susceptibility testing for Streptomyces peucetius determined diagnostic degrees of sensitivity and resistance against generic antibiotics. It showed resistance against amoxicillin and erythromycin but was highly susceptible to ciprofloxacin and cefotaxime. This differential susceptibility suggests that the produced bacterial metabolites could have a novel mode of action, distinct from commonly used antibiotics. Moreover, after attaining all the results from the quantitative screening, the results were compared with other strains of Streptomyces and Streptomyces peucetius. It showed that the designated isolate, Streptomyces peucetius strain ABSKSLAB04, demonstrated higher antagonistic bioactivity than the previously isolated strains, ascertaining a novel precision.
The growth of the selected bacterial strain, ABSKSLAB04, was further optimized by altering different environmental and nutritional parameters via the OVAT approach to obtain maximum antagonistic activity. The maximum bioactivity was obtained by SC medium, followed by GSB at pH 7.0 and temperature between 30 and 40 °C. The optimum growth was between an incubation period of 7–10 days at 4% inositol (carbon source) and 0.3% L-asparagine (nitrogen source). The concentration and composition of the medium play a vital role. This is highly applicable for microbial secondary metabolite biosynthesis, where simple changes in the production medium can have large effects. The choice of carbon and nitrogen sources exerts a major impact on the biosynthesis of NPs and influences their antagonistic activity. A study implied that the production of cephamycin C, β-lactam antibiotic produced by Streptomyces clavuligerus, exhibited numerous challenges in the presence of glycerol as a carbon source due to the suppressive impact on the bioactivity of cephamycin C113. Similarly, another study dictated the production process of a macrolide antibiotic, spiramycin from Streptomyces ambofaciens, used for the treatment of toxoplasmosis. It showed that the presence of certain carbon sources, such as glucose and glycerol, apparently impacted the production of the subsequent antibiotic114. Thus, it is very important to use the right parameters and nutritional sources to produce NPs.
Additionally, the statistical optimization of the medium components was conducted in three phases, using the PBD, RSM-BBD, and ANN model. In the PBD, ten independent variables exhibiting different media components were screened and examined in twelve trials. Both the experimental and predicted values were determined by fitting the raw data into a first-order linear polynomial equation, with high levels denoted as + 1 and lower levels denoted as −1. The highest activity was represented by the 12th run − 26.27 mm, while the lowest activity was represented by the 6th run − 9.30 mm. Statistical analysis was conducted to determine the statistical coefficients, ANOVA analysis, and the lack of fit of the PBD model. The model had a higher level of goodness of fit with R2 and adj-R2 of 0.99 (each), a p-value (0.00901), and an F-model (7459) on 10 and 1 DF. The investigations from the PBD were further applied to execute the RSM-BBD experimental model. It constituted sixteen experimental runs with three replicates of the central point for attaining the statistical results. The experimental raw data were fitted into a second-order quadratic polynomial equation, where the model numerically explained the substantial correlation between the anticipated and experimental values. The RSM model had a high level of goodness of fit with R2 and adj-R2 of 91.65% and 86.63%, respectively, with a p-value (0.00355) and an F-model (0.00355) on 3 and 9 DF. It was followed by statistical analysis: MSE (3.6785), RMSE (1.918), and MAE (1.698), suggesting the model’s high predictive capacity. Moreover, numerous visual plots were designed for both models, which ascertained the high predictiveness and efficiency.
ANN model was used to detect the intricate relationships between independent variables. The model was designed by utilizing the three key independent variables—pH, temperature, and inositol concentration from the RSM study. The entire dataset was standardized and split into training (70%), testing (15%), and validation (15%) to govern the reliability of the model. The model topology consisted of three neurons in the input layer, a variable number of neurons (three – seven) in the hidden layer, and a single neuron in the output layer. The results showed that the ANN model was of superior quality as it demonstrated high predictiveness and achieved lower mean values of the statistical results: MSE (0.0277), RMSE (0.1477), MAE (0.0967), and higher mean values of R2 (92.23%) and adj-R2 (90.83%), suggesting the high generalization ability. Moreover, the model was also validated using the k-5-fold cross-validation method, which rendered the MSE value of 0.0533 with a 97.91% accuracy fit. The final optimal values for the three independent variables were determined to be pH 7 ± 1.2, temperature 40 ± 5 °C, and inositol concentration of 5.5 ± 1.5, resulting in the antagonistic activity of 29.81 mm. The production yield of NPs was also calculated, in which the standard yield (370 mg/L) was obtained, as compared to 450 mg/L and 580 mg/L with 1.22-fold and 1.57-fold increase under RSM and ANN optimized conditions, respectively. There was a 1.29-fold enhancement by ANN model over the RSM model. A study conducted by Pathak et al.115 and Yu et al.116 also applied the optimization of Streptomyces species and documented that the ANN model is a better fit when compared to the RSM model. Despite ANN being a superior model, RSM is the chief tool due to its high interpretability. RSM governs unambiguous mathematical equations and parametric sensitivity analysis, which makes the system behave in a more accessible manner. Therefore, the hybrid modeling techniques that display both RSM and ANN have been devised, which would capitalize on the interpretability of the RSM model and the amplified predictiveness of the ANN model. This dual model technique has been highly successful in chemical engineering, bioprocess optimization, and environmental modeling, where it maintains an equilibrium between precision and interpretability.
To execute the molecular characterization, 16S rRNA chain termination sequencing was used to confirm the identity of the isolates, followed by myriad bioinformatic analyses. The novel partial sequences (ABSKSLAB01 – ABSKSLAB04) were deposited in the GenBank database with accession numbers: ‘OP597532’, ‘OP597545’, ‘OQ061473’, and ‘PP086938’, respectively, followed by phylogenetic assessment via MEGA-XI software. Species-specific trees were constructed, and evolutionary distances were calculated. Construction, thermodynamic evaluation, and secondary structural analysis of the 16S rRNA were performed with UNAFOLD software.
The novel isolates have the potential to produce antagonistic (antimicrobial and antineoplastic) natural therapeutic products that can further be amplified by utilizing industrial-driven applications within biotechnological processes. The study provides a unique insight into the underlying isolates in therapeutic applications for treating numerous ailments.
Conclusion
The present study isolated, identified, and analyzed four novel bacterial strains—Klebsiella pneumoniae strain ABSKSLAB01, Klebsiella quasipneumoniae strain ABSKSLAB02, Streptomyces minutiscleroticus strain ABSKSLAB03, and Streptomyces peucetius strain ABSKSLAB04. The potential of these strains to produce NPs was assessed with the aid of quantitative screening, molecular characterization, bioinformatic analysis, phylogenetic analysis, media optimization, and statistical optimization techniques. The study enunciated the capability of bacterial isolates, especially Streptomyces peucetius strain ABSKSLAB04, to produce natural compounds that fall under the antimicrobial and antineoplastic categories. The PBD acknowledged the chief features influencing the production of NPs, while eliminating less significant variables. RSM conjugated with BBD optimized the best culture conditions from the PBD and attained high and significant results (R2 − 91.65% and MSE − 3.6785). The ANN model established superior predictive capability, with a higher R² (92.23%) and a lower MSE (0.0277), with an enhanced crude extract yield of 580 mg/L (1.57-fold increase), as compared to the RSM model (450 mg/L − 1.22-fold) over preoptimized conditions (370 mg/L). There was a 1.29-fold enhancement by the ANN model over the RSM model. This signifies the ANN model’s effectiveness and augmented predictiveness in handling nonlinear biological interactions and complex variable dependencies, making it a more robust optimization approach. Therefore, the current research highlights the subsequent strains’ biotechnological potential to produce NPs and paves the way for scaling the production of natural bioactive compounds with advancements in the pharmaceutical and industrial sectors.
Data availability
Most of the data generated or analyzed during this study are included in this article. We have included additional data in the supplementary material. The 16S rRNA sequence data that support the findings of this study are available in GenBank database with following links. Moreover, queries can be directed to the corresponding author for any clarifications about the study if needed.https://www.ncbi.nlm.nih.gov/nuccore/OP597532https://www.ncbi.nlm.nih.gov/nuccore/OP597545https://www.ncbi.nlm.nih.gov/nuccore/OQ061473https://www.ncbi.nlm.nih.gov/nuccore/PP086938.
References
-
Selim, M. S. M., Abdelhamid, S. A. & Mohamed, S. S. Secondary metabolites and biodiversity of actinomycetes. Journal of Genetic Engineering and biotechnology, 19(1), p.72. Sidra, J., Hanif, M.A., Khan, M.M. and Qadri, R.W.K., 2014. Natural products sources and their active compounds on disease prevention: a review. International Journal of Chemical and Biochemical Sciences, 6, pp.76–83. (2021).
-
Li, G. & Lou, H. X. Strategies to diversify natural products for drug discovery. Med. Res. Rev. 38 (4), 1255–1294 (2018).
-
Gurnani, N., Mehta, D., Gupta, M. & Mehta, B. K. Natural products: source of potential drugs. Afr. J. Basic. Appl. Sci. 6 (6), 171–186 (2014).
-
Newman, D. J. & Cragg, G. M. Natural products as sources of new drugs from 1981 to 2014. J. Nat. Prod. 79 (3), 629–661 (2016).
-
Mushtaq, S., Abbasi, B. H., Uzair, B. & Abbasi, R. Natural products as reservoirs of novel therapeutic agents. EXCLI J. 17, 420 (2018).
-
Crits-Christoph, A., Diamond, S., Butterfield, C. N., Thomas, B. C. & Banfield, J. F. Novel soil bacteria possess diverse genes for secondary metabolite biosynthesis. Nature 558 (7710), 440–444 (2018).
-
Barreiro, C., Martínez-Cámara, S., García-Estrada, C., de la Torre, M. & Barredo, J. L. Chapter 5 – Beta-lactam antibiotics. In Developments in Microbiology, Antibiotics – Therapeutic Spectrum and Limitations (eds Dhara, A. K. et al.) 89–122 (Academic Press, 2023).
-
Girija, A. et al. Harnessing the natural pool of polyketide and non-ribosomal peptide family: A route map towards novel drug development. Curr. Mol. Pharmacol. 15 (2), 265–291 (2022).
-
Hug, J. J., Krug, D. & Müller, R. Bacteria as genetically programmable producers of bioactive natural products. Nat. Reviews Chem. 4 (4), 172–193 (2020).
-
Chen, S. et al. Emerging biotechnology applications in natural product and synthetic pharmaceutical analyses. Acta Pharm. Sinica B. 12 (11), 4075–4097 (2022).
-
Lin, X. & Kück, U. Cephalosporins as key lead generation beta-lactam antibiotics. Appl. Microbiol. Biotechnol. 106 (24), 8007–8020 (2022).
-
Roy, A., Ahuja, S. & Garg, S. Fungal secondary metabolites: biological activity and potential applications. Recent Trends in Mycological Research: Volume 1: Agricultural and Medical Perspective, pp.159–188. (2021).
-
Albarano, L., Esposito, R., Ruocco, N. & Costantini, M. Genome mining as new challenge in natural products discovery. Marine drugs, 18(4), p.199. (2020).
-
Almabruk, K. H., Dinh, L. K. & Philmus, B. Self-resistance of natural product producers: past, present and future focusing on self-resistant protein variants. ACS Chem. Biol. 13 (6), 1426–1437 (2018).
-
Gasparrini, A. J. et al. Tetracycline-inactivating enzymes from environmental, human commensal and pathogenic bacteria cause broad-spectrum tetracycline resistance. Communications biology, 3(1), p.241. (2020).
-
Tan, M. et al. Recent developments in the regulation of cholesterol transport by natural molecules. Phytother. Res. 35 (10), 5623–5633 (2021).
-
Carretero Molina, D. Expanding the chemical space of microbial specialized metabolites: Structure elucidation and biosynthesis of novel bioactive natural products from actinomycetes (Doctoral dissertation, Universidad de Granada). (2024).
-
Weber, T. & Kim, H. U. The secondary metabolite bioinformatics portal: computational tools to facilitate synthetic biology of secondary metabolite production. Synth. Syst. Biotechnol. 1 (2), 69–79 (2016).
-
Hwang, S., Lee, N., Cho, S., Palsson, B. & Cho, B. K. Repurposing modular polyketide synthases and non-ribosomal peptide synthetases for novel chemical biosynthesis. Frontiers in molecular biosciences, 7, p.87. (2020).
-
Rutledge, P. J. & Challis, G. L. Discovery of microbial natural products by activation of silent biosynthesis-related gene clusters. Nat. Rev. Microbiol. 13 (8), 509–523 (2015).
-
Park, H., Jin, H., Kim, D. & Lee, J. Cell-Free Systems: Ideal Platforms for Accelerating the Discovery and Production of Peptide-Based Antibiotics. International Journal of Molecular Sciences, 25(16), p.9109. (2024).
-
Hertweck, C. Decoding and reprogramming complex polyketide assembly lines: prospects for synthetic biology. Trends Biochem. Sci. 40 (4), 189–199 (2015).
-
Komaki, H., Tamura, T. & Igarashi, Y. Classification and secondary metabolite-biosynthetic gene clusters of marine Streptomyces strains including a lobophorin-and divergolide-producer. Hydrobiology 2 (1), 151–161 (2023).
-
Shaik, M., Sankar, G. G., Iswarya, M. & Rajitha, P. Isolation and characterization of bioactive metabolites producing marine Streptomyces parvulus strain sankarensis-A10. J. Genetic Eng. Biotechnol. 15 (1), 87–94 (2017).
-
Nayarisseri, A. & Singh, S. K. Genome analysis of biosurfactant producing bacterium, Bacillus tequilensis. Plos One 18(6), e0285994 (2023).
-
Roh, S. W. et al. Arthrobacter soli sp. nov., a novel bacterium isolated from wastewater reservoir sediment. The Journal of Microbiology, 46, pp.40–44. (2008).
-
Arifuzzaman, M., Khatun, M. R. & Rahman, H. Isolation and screening of actinomycetes from sundarbans soil for antibacterial activity. Afr. J. Biotechnol. 9 (29), 4615–4619 (2010).
-
Sapkota, A. et al. Isolation, characterization and screening of antimicrobial-producing Actinomycetes from soil samples. International journal of microbiology, 2020(1), p.2716584. (2020).
-
Biniarz, P., Łukaszewicz, M. & Janek, T. Screening concepts, characterization, and structural analysis of microbial-derived bioactive lipopeptides: a review. Crit. Rev. Biotechnol. 37 (3), 393–410 (2017).
-
Al-Dhabi, N. A., Esmail, G. A., Duraipandiyan, V., Valan Arasu, M. & Salem-Bekhit, M. M. Isolation, Identification and Screening of Antimicrobial Thermophilic Streptomyces Sp. Al-Dhabi-1 Isolated from Tharban Hot Sp.ing, Saudi Arabia20pp.79–90 (Extremophiles, 2016).
-
Prashanthi, R., Shreevatsa, G. K., Krupalini, S. & Manoj, L. Isolation, characterization, and molecular identification of soil bacteria showing antibacterial activity against human pathogenic bacteria. Journal of Genetic Engineering and Biotechnology, 19(1), p.120. (2021).
-
Al Farraj, D. A. et al. Antibiotics production in optimized culture condition using low-cost substrates from Streptomyces sp. AS4 isolated from Mangrove soil sediment. J. King Saud University-Science. 32 (2), 1528–1535 (2020).
-
Singh, H. et al. Antimicrobial properties of the novel bacterial isolate Paenibacilllus sp. SMB1 from a halo-alkaline lake in India. Scientific reports, 9(1), p.11561. (2019).
-
Dietvorst, J., Vilaplana, L., Uria, N., Marco, M. P. & Muñoz-Berbel, X. Current and near-future technologies for antibiotic susceptibility testing and resistant bacteria detection. TrAC Trends in Analytical Chemistry, 127, p.115891. (2020).
-
Bergey, D. H. Bergey’s manual of determinative bacteriology (Lippincott Williams & Wilkins, 1994).
-
Khattab, A. I., Babiker, E. H. & Saeed, H. A. Streptomyces: isolation, optimization of culture conditions and extraction of secondary metabolites. Int. Curr. Pharm. J. 5 (3), 27–32 (2016).
-
Lertcanawanichakul, M. & Sahabuddeen, T. Characterization of Streptomyces Sp. KB1 and its Cultural Optimization for Bioactive Compounds Production11pe14909 (PeerJ, 2023).
-
Kalyani, P., Botsa, S. M., Laxmi, K. D. & Anil, S. Optimization of cultural conditions for biomass and antibacterial metabolite production by Aspergillus fumigatus strain MF1. Hybrid. Adv. 2, 100016 (2023).
-
Shehata, M. G., Badr, A. N., Sohaimy, E., Asker, S. A., Awad, T. S. & D. and Characterization of antifungal metabolites produced by novel lactic acid bacterium and their potential application as food biopreservatives. Annals Agricultural Sci. 64 (1), 71–78 (2019).
-
Jaiswal, M. et al. Identification and characterization of alkaline protease producing Bacillus firmus species EMBS023 by 16S rRNA gene sequencing. Interdisciplinary Sciences: Comput. Life Sci. 6 (4), 271–278 (2014). [PMID: 25118655].
-
Nadh, G. et al. Identification of Azo dye degrading Sphingomonas strain EMBS022 and EMBS023 using 16S rRNA gene sequencing. Curr. Bioinform. 10 (5), 599–605 (2015).
-
Nayarisseri, A., Suppahia, A., Nadh, A. G. & Nair, A. S. Identification and characterization of a pesticide degrading Flavobacterium species EMBS0145 by 16S rRNA gene sequencing. Interdisciplinary Sciences: Comput. Life Sci. 7 (2), 93–99 (2015).
-
Amareshwari, P. et al. Isolation and characterization of a novel Chlorpyrifos degrading Flavobacterium species EMBS0145 by 16S rRNA gene sequencing. Interdisciplinary Sciences: Comput. Life Sci. 7 (1), 1–6 (2015).
-
Chandok, H. et al. Screening, isolation and identification of probiotic producing Lactobacillus acidophilus strains EMBS081 & EMBS082 by 16S rRNA gene sequencing. Interdisciplinary Sciences: Comput. Life Sci. 7 (3), 242–248 (2015).
-
Nayarisseri, A., Singh, P. & Singh, S. K. Screening, isolation and characterization of biosurfactant-producing Bacillus tequilensis strain ANSKLAB04 from brackish river water. Int. J. Environ. Sci. Technol. 16 (11), 71037112 (2018).
-
Schoch, C. L., Ciufo, S., Domrachev, M., Hotton, C. L., Kannan, S., Khovanskaya, R.,… Karsch-Mizrachi, I. (2020). NCBI Taxonomy: a comprehensive update on curation, resources and tools. Database, 2020, baaa062.
-
Khan, A., Nayarisseri, A. & Singh, S. K. Characterization and optimization of Azo dyes degrading microbes isolated from textile effluent. Sci. Rep. 15 (1), 11241 (2025).
-
Montaño, E. T. et al. Isolation and characterization of Streptomyces bacteriophages and Streptomyces strains encoding biosynthetic arsenals. PloS One. 17 (1), e0262354 (2022).
-
Zaman, S. A. U., Bhrdwaj, A., Nayarisseri, A., Khazanehdari, K. A. & Bhuyan, R. Isolation and characterization of novel hydrocarbon-degrading bacteria from oil polluted soil near nacharam, hyderabad, India. Sci. Rep. 15 (1), 1–26 (2025).
-
Anuraj, N. S. et al. Identification and characterization of proteases and amylases producing bacillus licheniformis strain EMBS026 by 16S rRNA gene sequencing. Int. J. Microbiol. Res. 4 (5), 231–235 (2012).
-
Edgar, R. C. Muscle5: High-accuracy alignment ensembles enable unbiased assessments of sequence homology and phylogeny. Nature Communications, 13(1), p.6968. (2022).
-
Nayarisseri, A., Khandelwal, R. & Singh, S. K. Identification and characterization of lipopeptide biosurfactant producing Microbacterium Sp isolated from brackish river water. Curr. Top. Med. Chem. 20 (24), 2221–2234 (2020).
-
Pyde, A. N. et al. Identification and characterization of foodborne pathogen Listeria monocytogenes strain Pyde1 and Pyde2 using 16S rRNA gene sequencing. J. Pharm. Res. 6 (7), 736–741 (2013).
-
Phanse, N., Rathore, P., Patel, B. & Nayarisseri, A. Characterization of an industrially important alkalophilic bacterium, Bacillus agaradhaerens strain nandiniphanse5. J. Pharm. Res. 6 (5), 543–550 (2013).
-
Tamura, K., Stecher, G. & Kumar, S. MEGA11: molecular evolutionary genetics analysis version 11. Mol. Biol. Evol. 38 (7), 3022–3027 (2021).
-
Kalyani, P., Botsa, S. M., Laxmi, K. D. & Anil, S. Optimization of cultural conditions for biomass and antibacterial metabolite production by Aspergillus fumigatus strain MF1. Hybrid Advances, 2, p.100016. (2023).
-
Al-ghazali, L. H. & Omran, R. Optimization of medium composition for antibacterial metabolite production from Streptomyces Sp. OPTIMIZATION, 10(9) (2017).
-
Abd-Elnaby, H., Abo-Elala, G., Abdel-Raouf, U., Abd-elwahab, A. & Hamed, M. Antibacterial and anticancer activity of marine Streptomyces parvus: optimization and application. Biotechnol. Biotechnol. Equip. 30 (1), 180–191 (2016).
-
Nam, Y. H., Choi, A. & Chung, E. J. Antibacterial activities of strain Pantoea sp. S3W-11 and optimization of culture conditions. KSBBJ 64–71 (2020).
-
Fatima, H. et al. Extraction optimization of medicinally important metabolites from Datura innoxia mill.: an in vitro biological and phytochemical investigation. BMC Complement. Altern. Med. 15, 1–18 (2015).
-
Singh, V. et al. Strategies for fermentation medium optimization: an in-depth review. Frontiers in microbiology, 7, p.2087. (2017).
-
Sheik, G. B., Abdel, R. A. I. A., Alzeyadi, Z. A. & AlGhonaim, M. I. Application of Plackett–Burman design for optimization of silver nanoparticles produced by Streptomyces sp. DW102. Int. J. Adv. Biotechnol. Res. 10(2), 143 –151 (2019).
-
Mohammad, N. H. et al. Optimization of bacterial cellulose production using Plackett–Burman and response surface methodology. Egypt. J. Med. Microbiol. 30 (4), 93–101 (2021).
-
Kavitha, R. & Damodharan, N. Statistical optimization of prodigiosin production by Plackett-burman design for Bacteria isolated from Indian marine soil. J. Pure Appl. Microbiol. 15(3), 1517–1526 (2021).
-
Youssef, G. A., El-Maghraby, W. & El-Aassar, S. Statistical optimization of fermentation conditions by Plackett–Burman methodology for a new extracellular cholesterol Oxidase-Producing Bacillus cytotoxicus strain. Egypt. J. Bot. 62 (3), 851–864 (2022).
-
Abdelhafez, A. A., Husseiny, S. M., Ali, A. A. A. & Sanad, H. M. Optimization of β-carotene production from agro-industrial by-products by Serratia marcescens ATCC 27117 using Plackett–Burman design and central composite design. Annals Agricultural Sci. 61 (1), 87–96 (2016).
-
Kaya, E., Agca, M., Adiguzel, F. & Cetin, M. Spatial data analysis with R programming for environment. Hum. Ecol. Risk Assessment: Int. J. 25 (6), 1521–1530 (2019).
-
Vasiee, A., Behbahani, B. A., Yazdi, F. T. & Moradi, S. Optimization of the production conditions of the lipase produced by Bacillus cereus from rice flour through Plackett-Burman design (PBD) and response surface methodology (RSM). Microb. Pathog. 101, 36–43 (2016).
-
Warda, E. A., Abeer, A. A. E. A., Eman, R. H., Mahmoud, A. S. & Ahmed, I. E. D. Applications of Plackett–Burman and central composite design for the optimization of novel Brevundimonas diminut a KT277492 chitinase production, investigation of its antifungal activity. Brazilian Archives Biology Technol. 59 (00), e16160245 (2016).
-
Wang, L. et al. Application of response surface methodology to optimize the production of antimicrobial metabolites by Micromonospora Y15. Biotechnol. Biotechnol. Equip. 31 (5), 1016–1025 (2017).
-
Ju, Y. et al. Statistical optimization of culture medium for improved production of antimicrobial compound by Streptomyces rimosus AG-P1441. Food Sci. Biotechnol. 27, 581–590 (2018).
-
Roy, S., Halder, S. K. & Banerjee, D. Multiresponse optimization of granaticinic acid production by endophytic Streptomyces thermoviolaceus NT1, using response surface methodology. Bioengineering, 3(3), p.19. (2016).
-
Salman, M. et al. Development of regression model for bacteriocin production from local isolate of Lactobacillus acidophilus MS1 using Box–Behnken design. Biocatalysis and Agricultural Biotechnology, 24, p.101542. (2020).
-
Peng, X. et al. Box–Behnken design based statistical modeling for the extraction and physicochemical properties of pectin from sunflower heads and the comparison with commercial low-methoxyl pectin. Sci.Rep. 10(1), 3595 (2020).
-
Sun, S. et al. Optimization for microbial degradation of petroleum hydrocarbon (TPH) by Enterobacter sp. S-1 using response surface methodology. Pet. Sci. Technol. 37 (7), 821–828 (2019).
-
Yousefi, H., Moosavi-Nasab, M., Soleimanian-Zad, S., Golmakani, M. T. & Majdinasab, M. Antibacterial metabolites production by Lactobacillus plantarum PTCC 1896 in fermented whey and optimization of fermentation conditions for maximum production using RSM. International Dairy Journal, 152, p.105882. (2024).
-
Selvaraj, J. N., Ganapathi, U., Vincent, S. G. P., Ramamoorthy, S. & Thavasimuthu, C. Statistical optimization of media components for antibiotic production in Streptomyces sp. CMSTAAHAL-3. Electron. J. Biotechnol. 65, 1–13 (2023).
-
Dalmaijer, E. S. Python. In Python for Experimental Psychologists (1–7). Routledge. (2024).
-
Stevens, E., Antiga, L. & Viehmann, T. Deep Learning with PyTorch: Build, Train, and Tune Neural Networks Using Python Tools (Manning, 2020).
-
Podstawczyk, D., Witek-Krowiak, A., Dawiec, A. & Bhatnagar, A. Biosorption of copper (II) ions by flax meal: empirical modeling and process optimization by response surface methodology (RSM) and artificial neural network (ANN) simulation. Ecol. Eng. 83, 364–379 (2015).
-
Aklilu, E. G., Adem, A., Kasirajan, R. & Ahmed, Y. Artificial neural network and response surface methodology for modeling and optimization of activation of lactoperoxidase system. S. Afr. J. Chem. Eng. 37, 12–22 (2021).
-
Hao, J. & Ho, T. K. Machine learning made easy: a review of scikit-learn package in python programming Language. J. Educational Behav. Stat. 44 (3), 348–361 (2019).
-
Lahiri, D., Nag, M., Dutta, B., Sarkar, T. & Ray, R. R. Artificial neural network and response surface methodology-mediated optimization of bacteriocin production by Rhizobium leguminosarum. Iran. J. Sci. Technol. Trans. A: Sci. 45, 1509–1517 (2021).
-
de Luna, M. D. G. et al. Modeling and optimization of imidacloprid degradation by catalytic percarbonate oxidation using artificial neural network and Box-Behnken experimental design. Chemosphere, 251, p.126254. (2020).
-
Ram Talib, N., Syuhadah, M. I. E. & Halmi Siti Salwa Abd Ghani, Uswatun Hasanah Zaidan and Mohd Yunus Abd Shukor. Artificial Neural Networks (ANNs) and Response Surface Methodology (RSM) Approach for Modelling the Optimization of Chromium (VI) Reduction by Newly Isolated Acinetobacter radioresistens Strain NS-MIE from Agricultural Soil. BioMed research international no. 1 (2019): 5785387. (2019).
-
Comparison of the estimation capabilities of response surface methodology. and artificial neural network for the optimization of recombinant lipase production by E. coli BL21.
-
Estahbanati, M. R. K., Feilizadeh, M. & Iliuta, M. C. Photocatalytic valorization of glycerol to hydrogen: optimization of operating parameters by artificial neural network. Appl. Catal. B Environ. 209, 483e492. https://doi.org/10.1016/j.apcatb.2017.03.016 (2017).
-
Singh, V., Khan, M., Khan, S. & Tripathi, C. K. M. Optimization of actinomycin V production by Streptomyces triostinicus using artificial neural network and genetic algorithm. Appl. Microbiol. Biotechnol. 82, 379–385 (2009).
-
Goodfellow, I., Bengio, Y., Courville, A. & Bengio, Y. Deep Learning (Vol1 (MIT Press, 2016). No. 2.
-
Nayarisseri, A. et al. Impact of Next-Generation Whole-Exome sequencing in molecular diagnostics. Drug Invention Today. 5 (4), 327–334 (2013).
-
Nayarisseri, A. & Hood, E. A. Advancement in microbial cheminformatics. Curr. Top. Med. Chem. 18 (29), 2459–2461 (2018).
-
Krishnan, S. N., Nayarisseri, A. & Rajamanickam, U. Identification and characterization of Cresol degrading Pseudomonas monteilii strain SHY from soil samples. Bioinformation 14 (9), 455–464 (2018).
-
Sharma, B. et al. Coupling effect of ionophore and oxidoreductases produced by halotolerant novel fungal strain Trametesflavida WTFP2 on dye wastewater treatment: an optimized green bioprocess. J. Environ. Chem. Eng. 11 (3), 109629 (2023).
-
Nayarisseri, A. et al. Promoter–motif extraction from co-regulated genes and their relevance to co-expression using E. coli as a model. Brief. Funct. Genom. elac043 (2023).
-
Sharma, K., Nayarisseri, A. & Singh, S. K. Biodegradation of plasticizers by novel strains of bacteria isolated from plastic waste near Juhu beach, mumbai, India. Sci. Rep. 14 (1), 30824 (2024).
-
Reuter, J. S. & Mathews, D. H. RNAstructure: Software for RNA Secondary Structure Prediction and Analysis11pp.1–9 (BMC bioinformatics, 2010).
-
Schroeder, S. J. Advances in RNA structure prediction from sequence: new tools for generating hypotheses about viral RNA structure-function relationships. J. Virol. 83 (13), 6326–6334 (2009).
-
Ahmad, N. A., Zulkifli, R. M., Hussin, H. & Nadri, M. H. In silico approach for post-SELEX DNA aptamers: A mini-review. Journal of Molecular Graphics and Modelling, 105, p.107872. (2021).
-
Lorenz, R. et al. ViennaRNA Package 2.0. Algorithms for molecular biology, 6, pp.1–14. 93. (2011).
-
Zhao, C. & Sahni, S. October. Efficient RNA folding using Zuker’s method. In 2017 IEEE 7th International Conference on Computational Advances in Bio and Medical Sciences (ICCABS) (pp. 1–6). IEEE. (2017).
-
Tollefson, M. Graphics with the ggplot2 package: an introduction. In Visualizing Data in R 4: Graphics Using the Base, Graphics, Stats, and ggplot2 Packages 281–293 (A, 2021).
-
Yu, G. Using Ggtree to visualize data on tree-like structures. Curr. Protocols Bioinf. 69 (1), e96 (2020).
-
Revell, L. J. & Harmon, L. J. Phylogenetic Comparative Methods in R (Princeton University Press, 2022).
-
Bisong, E. Matplotlib and seaborn. In Building Machine Learning and Deep Learning Models on Google Cloud Platform: A Comprehensive Guide for Beginners 151–165 (A, 2019).
-
Tu, I. F. et al. Structural and biological insights into Klebsiella pneumoniae surface polysaccharide degradation by a bacteriophage K1 lyase: implications for clinical use. Journal of Biomedical Science, 29(1), p.9. (2022).
-
Choi, M. et al. The diversity of lipopolysaccharide (O) and capsular polysaccharide (K) antigens of invasive Klebsiella pneumoniae in a multi-country collection. Front. Microbiol. 11, 1249 (2020).
-
Miller, J. C., Cross, A. S., Tennant, S. M. & Baliban, S. M. Klebsiella pneumoniae Lipopolysaccharide as a Vaccine Target and the Role of Antibodies in Protection from Disease. Vaccines, 12(10), p.1177. (2024).
-
SJ, A., Kalyani, M. I. & Hosamani, Y. Isolation and Extraction of Antimicrobial Peptides from Streptomyces minutiscleroticus and Streptomyces (albogriseolus from Mangrove soil of Mangalore Coast, 2022).
-
Wang, D. et al. Identification, bioactivity and productivity of actinomycins from the marine-derived Streptomyces heliomycini. Frontiers in microbiology, 8, p.1147. (2017).
-
Lomovskaya, N. et al. Doxorubicin overproduction in Streptomyces peucetius: cloning and characterization of the DnrU ketoreductase and DnrV genes and the DoxA cytochrome P-450 hydroxylase gene. J. Bacteriol. 181 (1), 305–318 (1999).
-
Pudhuvai, B. et al. The Daunomycin: Biosynthesis, Actions and the Search for New Solutions to Enhance Production. Microorganisms, 12(12), p.2639. (2024).
-
Magar, R. T. et al. Biosynthetic pathway of peucemycin and identification of its derivative from Streptomyces peucetius. Appl. Microbiol. Biotechnol. 107 (4), 1217–1231 (2023).
-
Lebrihi, A., Lefebvre, G. & Germain, P. Carbon catabolite regulation of cephamycin C and expandase biosynthesis in Streptomyces clavuligerus. Appl. Microbiol. Biotechnol. 28, 44–51 (1988).
-
Kim, E. S., Hong, H. J., Choi, C. Y. & Cohen, S. N. Modulation of Actinorhodin biosynthesis in Streptomyces lividans by glucose repression of afsR2 gene transcription. J. Bacteriol. 183 (7), 2198–2203 (2001).
-
Pathak, L. et al. Artificial intelligence versus statistical modeling and optimization of cholesterol oxidase production by using Streptomyces Sp. PloS One. 10 (9), e0137268 (2015).
-
Yu, Z., Fu, H. & Wang, J. Modeling and optimization of the culture medium for efficient 4′-N-Demethyl-Vicenistatin production by Streptomyces parvus using response surface methodology and Artificial-Neural-Network-Genetic-Algorithm. Fermentation 10 (3), 154 (2024).
Acknowledgements
1. The authors are thankful to Eminent Biosciences and LeGene Biosciences Pvt Ltd, Indore, Madhya Pradesh, India for 16S rRNA sequencing of the bacteria. AB and SKS thankfully acknowledge the MHRD-RUSA Phase 2.0 under [grant sanctioned wide letter no. F.24-51/2014-U, Policy (TN Multi-Gen), Department of Education, Government of India, dated 09.10.2018]; Tamil Nadu State Council for Higher Education (TANSCHE) under [grant sanctioned wide letter no. AU: S.O. (P&D): TANSCHE Projects: 117/2021, dated 31.03.2021, File No. RGP/2019-20/ALU/HECP-0048 dated 27.04.2021]; Department of Biotechnology, Ministry of Science and Technology, New Delhi, under Grant/Award [No. BT/PR40154/BTIS/137/34/2021, dated 07.03.2022]; DST-PURSE 2nd Phase Program [Order No. SR/PURSE Phase 2/38 (G dated 21.02.2017) & DST-FIST (SR/FST/LSI—667/2016)]; DBT-NNP Project, New Delhi, under Grant/Award [No. BT/PR40156/BTIS/54/2023 dated 06.02.2023] for providing financial assistance, infrastructure facilities in the lab. AB thanks DBT-NNP for the Fellowship.
Ethics declarations
Competing interests
The authors declare no competing interests.
Consent to participate
Informed consent was obtained from all individual participants included in the study.
Consent to publish
The authors have consented to the submission of the case report to the journal.
Additional information
Publisher’s note
Springer Nature remains neutral with regard to jurisdictional claims in published maps and institutional affiliations.
Electronic supplementary material
Rights and permissions
Open Access This article is licensed under a Creative Commons Attribution-NonCommercial-NoDerivatives 4.0 International License, which permits any non-commercial use, sharing, distribution and reproduction in any medium or format, as long as you give appropriate credit to the original author(s) and the source, provide a link to the Creative Commons licence, and indicate if you modified the licensed material. You do not have permission under this licence to share adapted material derived from this article or parts of it. The images or other third party material in this article are included in the article’s Creative Commons licence, unless indicated otherwise in a credit line to the material. If material is not included in the article’s Creative Commons licence and your intended use is not permitted by statutory regulation or exceeds the permitted use, you will need to obtain permission directly from the copyright holder. To view a copy of this licence, visit http://creativecommons.org/licenses/by-nc-nd/4.0/.
About this article

Cite this article
Bhrdwaj, A., Nayarisseri, A. & Singh, S.K. Characterization of natural therapeutic compounds producing novel bacterial strains isolated from Hyderabad, India. Sci Rep 15, 25681 (2025). https://doi.org/10.1038/s41598-025-11615-5
-
Received:
-
Accepted:
-
Published:
-
DOI: https://doi.org/10.1038/s41598-025-11615-5