- Research
- Open access
- Published:
- Daniella V. Martinez1,
- Jenna Y. Schambach1,
- Oleg Davydovich1,
- Monica R. Mascarenas1,
- Sadi C. Butler1,
- Stephanie Kolker1,
- Jay E. Salinas1,
- Chuck R. Smallwood1,
- Hemant Choudhary2,3,
- Carlos Quiroz-Arita2 &
- …
- Michael S. Kent1
Biotechnology for Biofuels and Bioproducts volume 18, Article number: 73 (2025) Cite this article
Abstract
Advancing biomethane production from anaerobic digestion (AD) is essential for building a more reliable and resilient bioenergy system. However, incomplete conversion of lignocellulose-rich agricultural waste remains a key limitation, often leaving energy-dense residues in the digestate by-product. In this study, we introduce a novel application of chelator-mediated Fenton (CMF) post-treatment to recover untapped biomethane potential from these recalcitrant residues, representing a significant departure from conventional pre-treatment strategies. By systematically varying pH, iron-chelator concentration, and hydrogen peroxide dosage, we identified reaction conditions (pH 6–8, 5 mM Fe2+-dihydroxybenzene, 3–4 wt.% H2O2) that enhanced lignocellulose deconstruction and increased dissolved organic carbon (DOC) availability for methanogenesis. CMF post-treatment led to up to a tenfold increase in biomethane potential compared to untreated controls. Microbial community analysis revealed enrichment of cellulolytic species, suggesting enhanced hydrolytic activity as a driver of improved conversion. Application of the CMF post-treatment method to isolated poplar lignin further demonstrated its versatility for diverse lignocellulosic substrates. These findings position CMF post-treatment as a promising strategy to enhance AD efficiency and valorize digestate.
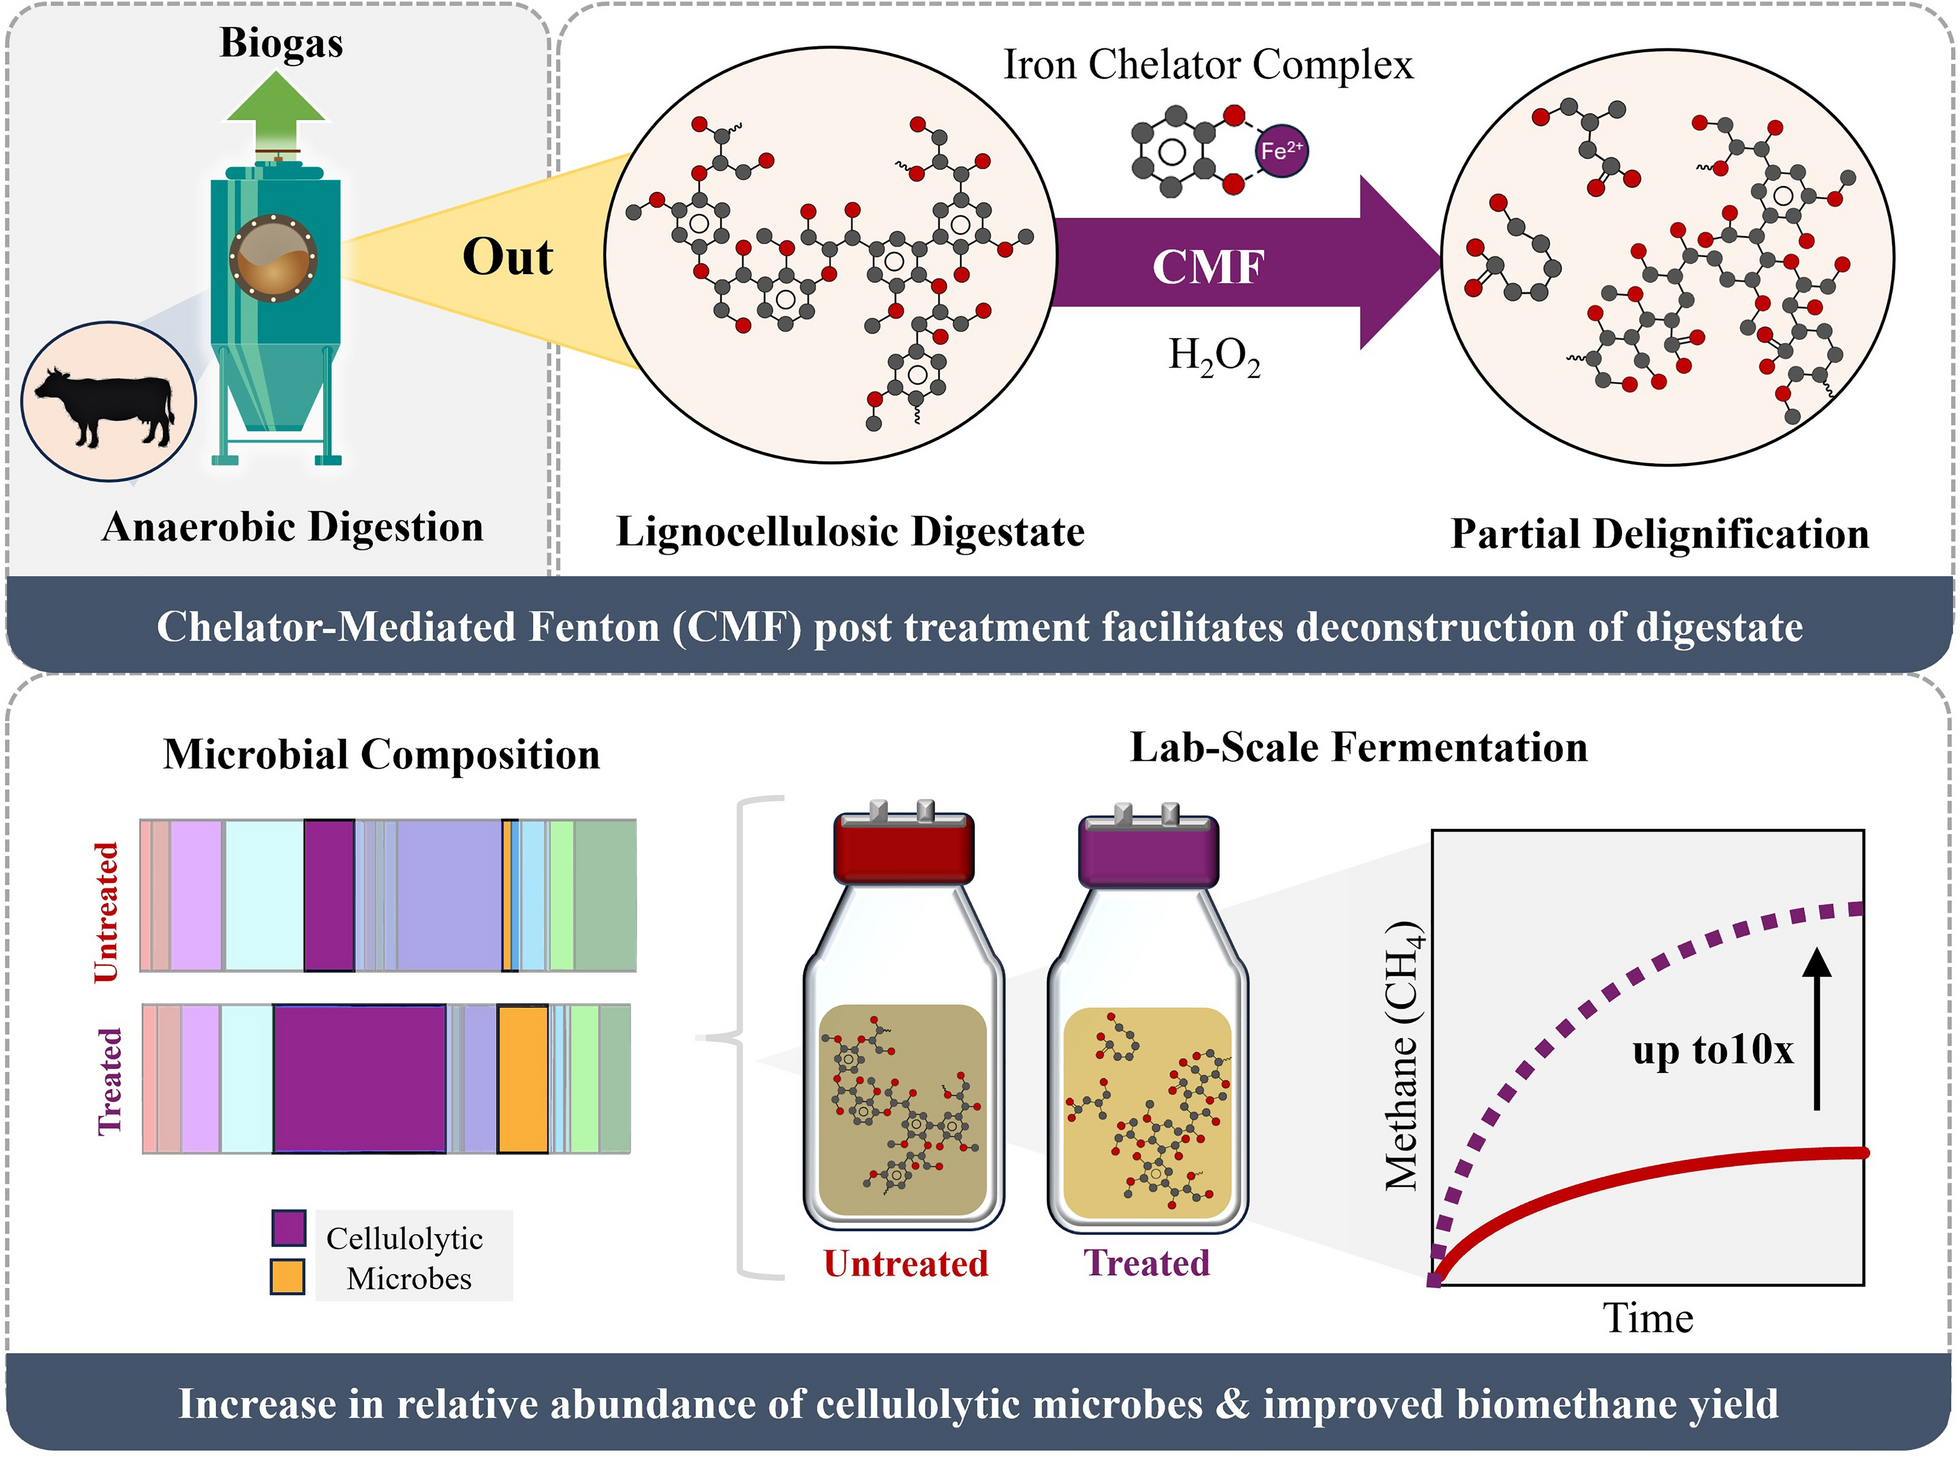
Graphical Abstract

Background
Anaerobic digestion (AD) systems play a vital role in strengthening energy infrastructure by producing biogas, a mixture primarily composed of methane (CH4) and carbon dioxide (CO2), which can be upgraded to pipeline-quality renewable natural gas or biomethane [1, 2]. As a high-purity fuel, biomethane is fully compatible with existing natural gas infrastructure and can be refined into value-added products such as hydrogen or synthetic aviation fuel (SAF) using established conversion processes [3, 4]. In addition to energy products, AD systems generate digestate, a nutrient-rich by-product commonly applied in agriculture as a soil amendment. However, the yield and value of both biogas and digestate are highly dependent on characteristics of the input feedstocks. Materials such as food waste, sewage sludge, and agricultural residues vary widely in their biochemical composition, which in turn influences microbial activity, biogas production rates, and nutrient recovery potential. Understanding and optimizing conversion is essential for maximizing the performance and economic viability of AD systems.
Despite the operational maturity and versatility of AD systems, maximizing their methane output remains a challenge. Agricultural wastes, such as livestock manure, serve as attractive feedstocks due to their abundance and low cost, yet they contain large fractions of lignocellulosic material, which significantly reduces AD efficiency. Lignocellulosic fractions, particularly lignin, are resistant to microbial hydrolysis, the first and rate-limiting step of the AD process [5]. The structural complexity of lignin impedes the breakdown of cellulose and hemicellulose, restricting access to fermentable sugars and slowing subsequent stages of digestion (i.e., acidogenesis, acetogenesis, and methanogenesis). As a result of this, and the indigestibility of lignin itself, up to 55% of the original carbon content may remain in the digestate, representing substantial unrealized energy potential [6,7,8]. Unlocking this energy through improved chemical treatment strategies offers a potential pathway to increase the biomethane yield of AD systems and enhance the availability of downstream fuels and chemicals for the industrial and transportation sectors.
Current efforts to increase methane yields from agricultural waste streams have focused primarily on chemical pre-treatments, aimed at disrupting the structural integrity of lignocellulose prior to AD. Among these, alkali, acidic, and oxidative pre-treatments (i.e., hydrogen peroxidation and ozonation) have been widely studied [9, 10]. While these methods can improve hydrolysis and boost methane yields, they are often non-selective, impacting both the recalcitrant and readily degradable components of the feedstock. This can lead to losses of easily fermentable carbon, unintended production of inhibitory compounds, and disruption of microbial activity during digestion, all of which can undermine AD efficiency [11]. As an alternative to pre-treatment, chemical post-treatment strategies have the potential to recover untapped biomethane from recalcitrant fractions without compromising the conversion of the initial digestion [12, 13]. The efficacy of post-treatment is significantly influenced by substrate characteristics, treatment parameters, and the microbial composition of the inoculum, all of which contribute to the variability of results observed in the literature.
We propose to use an advanced oxidation method based on Fenton chemistry as an innovative post-treatment approach tailored to lignocellulosic residues. While Fenton reactions are primarily utilized for degrading pollutants in wastewater and sludge, studies have demonstrated their potential for deconstructing lignocellulosic biomass [14, 15]. In a conventional Fenton reaction, Fe2+ is oxidized to Fe3+ by hydrogen peroxide (H2O2), generating reactive hydroxyl radicals that can disrupt the lignocellulosic matrix [16]. However, traditional Fenton systems face limitations, including narrow pH constraints, reagent instability, and economic challenges that hinder practical application. Incorporation of chelating agents has been proposed to stabilize iron ions and extend reaction efficacy, forming the basis for emerging chelator-mediated Fenton (CMF) systems [17]. Our previous work demonstrated chelators such as dihydroxybenzene (DHB) form complexes with Fe2+ and Fe3+ across a broad pH range, enhancing the reaction with H2O2 and facilitating lignin oxidation [18, 19]. However, this technology has yet to be explored for improving biomethane recovery from agricultural waste streams. Herein, a novel application of CMF treatment on lignocellulosic digestate was investigated, focusing on the effects of key reaction parameters—pH set-point, Fe2+-DHB concentration, and H2O2 dosage—on lignocellulose deconstruction, dissolved organic matter, and methane production. In addition, the influence of inoculum sourcing on methane yields was examined, highlighting the critical role of the microbial community in this process. Microbial community shifts were further analyzed through 16S rRNA gene sequencing, linking these dynamics to the observed increases in methane yield following CMF treatment. To demonstrate the feedstock-agnostic potential of CMF, high-performing conditions were applied to poplar lignin isolated from poplar wood with an ionic liquid pre-treatment, showcasing its applicability to various lignocellulosic substrates. The experimental workflow is illustrated in Scheme 1.

Experimental workflow for assessing the effects of CMF treatment parameters on delignification efficiency, biomethane potential, and microbial composition
Materials and methods
Raw feedstocks and inocula
Solid digestate (SD) served as the primary substrate for this study and was obtained from a commercial AD facility in Denmark. SD was sourced from a secondary digester, which employed a co-digestion process involving cattle manure, pig manure, deep litter, and various industrial wastes, including delactosed whey permeate. Following digestion, the facility conducted a separation process to isolate and dry the insoluble digestate fibers. The particle size of the SD fibers was then reduced to less than 2 mm in our laboratory using a Hamilton Beach electric coffee grinder, model 80410 (Hamilton Beach, Glen Allen, Virginia). Poplar lignin (PL) was the secondary lignocellulosic substrate used in this study. PL was isolated from poplar wood sourced from Idaho National Laboratory using a one-pot method with cholinium lysinate [Ch][Lys] (Proionic GmbH, Raaba-Grambach, Austria) as described by Choudhary et al. [20, 21].
Two inoculum samples (Inoculum A and B) were sourced from a local AD pilot plant (Tucumcari Bioenergy, Tucumcari, New Mexico), where cow manure was anaerobically digested under thermophilic conditions for a minimum of 30 days. Once the material ceased methane production, it was sent to our laboratory to inoculate our biomethane reactors. Inoculum A was sourced from a 30-day digestion, and Inoculum B was sourced from a separate 60-day digestion. The pH of the inocula ranged between 7 and 8, and the total solids (TS) content was measured between 4 and 6%, depending on the extent of digestion. Digestate materials were stored at 4 °C until further use.
Chelator-mediated Fenton (CMF) post-treatment
The TS of all substrates was adjusted to 5% (50 mg/mL) using Millipore water in separate, 100 mL glass bottles. A 0.5 M stock solution of iron (II) sulfate heptahydrate (Sigma Aldrich, St. Louis, MO) and 1,2-dihydroxybenzene (Sigma Aldrich, St. Louis, MO) was added to each reaction bottle to achieve the desired concentration of Fe2+-DHB complex. The pH of each solution was then adjusted to the desired set-point using 50% NaOH. To initiate the CMF reaction, aliquots of 35% H2O2 (Fisher Scientific, Hampton, NH) were added to each sample. Each aliquot resulted in 1 wt.% H2O2 within the total reaction volume of 100 mL. During the reactions, the pH was not maintained at a constant level; instead, it was adjusted to the target set-point after each aliquot of H2O2 was consumed. Aliquots were added until the desired concentration was achieved. The reaction temperature was maintained at 50 °C using a New Brunswick Innova® 42 Series incubator shaker (Eppendorf, Hamburg, Germany) set to 135 rpm. Peroxide strips were used to monitor H2O2 consumption, and the reactions were considered complete when H2O2 was no longer detectable in the solution (< 1 mg/L or 29 mM). The pH was then adjusted to 7 using 50% NaOH, in preparation for further analysis and AD experiments.
Total dissolved organic carbon (DOC) analysis
Aliquots of the treated and untreated samples were centrifuged at high speed for 10 min to separate the insoluble and soluble fractions. The supernatant was then filtered into a clean tube using a sterile 0.2 µm syringe filter. Triplicate samples (200 µL each) of the filtered supernatant were sent to Eurofins Environment Testing Laboratory (Eurofins, Albuquerque, New Mexico) for total organic carbon (TOC) analysis. The samples were diluted with Millipore water as necessary to conduct the TOC analysis according to Standard Method 5310B: total organic carbon by high-temperature combustion [22].
Elemental analysis and solids’ analysis
Insoluble fractions from both untreated and treated samples were dried overnight at 70 °C, ground with a mortar and pestle, and sent to ALS Global Company (ALS Global, Tucson, Arizona) for elemental analysis. Elemental analysis was conducted using a Perkin Elmer Series II 2400 CHNS/O Analyzer in CHN mode, where samples were combusted at 950 °C, followed by gas reduction at 640 °C, with gases detected by infrared cells. Calibration was performed using acetanilide OAS with an Elemental Microanalyzer B2000 and verified with acetanilide OAS and EDTA (Alpha Resources; AR2092) before and after the analysis. In addition, separate aliquots of the treated and untreated samples were freeze-dried, ground, and sent to ALS Global for additional elemental analysis, along with total solids and volatile solids (VS) analysis conducted according to Standard Method 2540 G [22].
Compositional analysis—lignin
All lignin compositional analyses were conducted in triplicate. Acetyl bromide-based lignin assay method was employed to determine the lignin content in samples as reported previously [23, 24]. 10 mg of the samples was weighed in a 1 dr screw cap glass vial containing a Teflon-coated magnetic stir bar. 1 mL 25% (v/v) acetyl bromide in glacial acetic acid was added to the vials containing the samples while in a fume hood. The vials were sealed and incubated at 50 °C for 2 h with continuous stirring. After 2 h of incubation, the vials were cooled in an ice bath for about 5 min before centrifuging the samples at 14,000 rpm for 5 min. The UV absorbance (at 280 nm) was measured by diluting 6 µL of supernatant with 60 µL master solution (obtained by mixing 48 µL acetic acid, 10 µL 2 M NaOH and 2 µL 0.5 M hydroxylamine hydrochloride) and 200 µL glacial acetic acid. A UV-transparent 96-well plate was used for UV measurements.
The lignin concentration was measured by calibration curve. In a 1 dr screw cap glass vial containing a Teflon-coated magnetic stir bar, 10 mg alkaline lignin was treated with 1 mL 25% (v/v) acetyl bromide in glacial acetic acid and incubated at 50 °C for 2 h with continuous stirring. After 2 h of incubation, vials were cooled in an ice bath for 5 min before centrifuging the samples at 14,000 rpm for 5 min. Standard samples were prepared by diluting 1, 2, 4, and 6 µL of supernatant with 60 µL master solution and 200 µL glacial acetic acid. UV absorbance was measured at 280 nm and compared against blank (60 µL master solution and 200 µL glacial acetic acid).
Compositional analysis—glucan and xylan
All glucan and xylan composition analyses were conducted in triplicate. Compositional analysis of samples was performed using two-step acid hydrolysis protocols from the National Renewable Energy Lab (LAP-002 and LAP-005) with some modifications [25]. Briefly, 10 mg of biomass was weighed into 4 mL Micronic vials (in a 48-vial holder). Weighed biomass and 100 μL of 72% sulfuric acid (H2SO4) were incubated at 30 °C while shaking at 200 rpm for 1 h. The solution was diluted to 4% H2SO4 with 2.8 mL of DI water and autoclaved at 121 °C for 1 h. The reaction was quenched by cooling down the flasks before removing the solids by filtration. Glucose and xylose concentrations were determined from the filtrate using Agilent HPLC 1260 infinity system (Agilent Technologies, Santa Clara, California) equipped with a Bio-Rad Aminex HPX-87H column and a Refractive Index detector. An aqueous solution of sulfuric acid (4 mM) was used as the eluent (0.6 mL min−1, column temperature 60 °C). The amount of glucan and xylan was calculated from the glucose and xylose content multiplied by the anhydro correction factors of 162/180 and 132/150, respectively.
Anaerobic digestion experiments
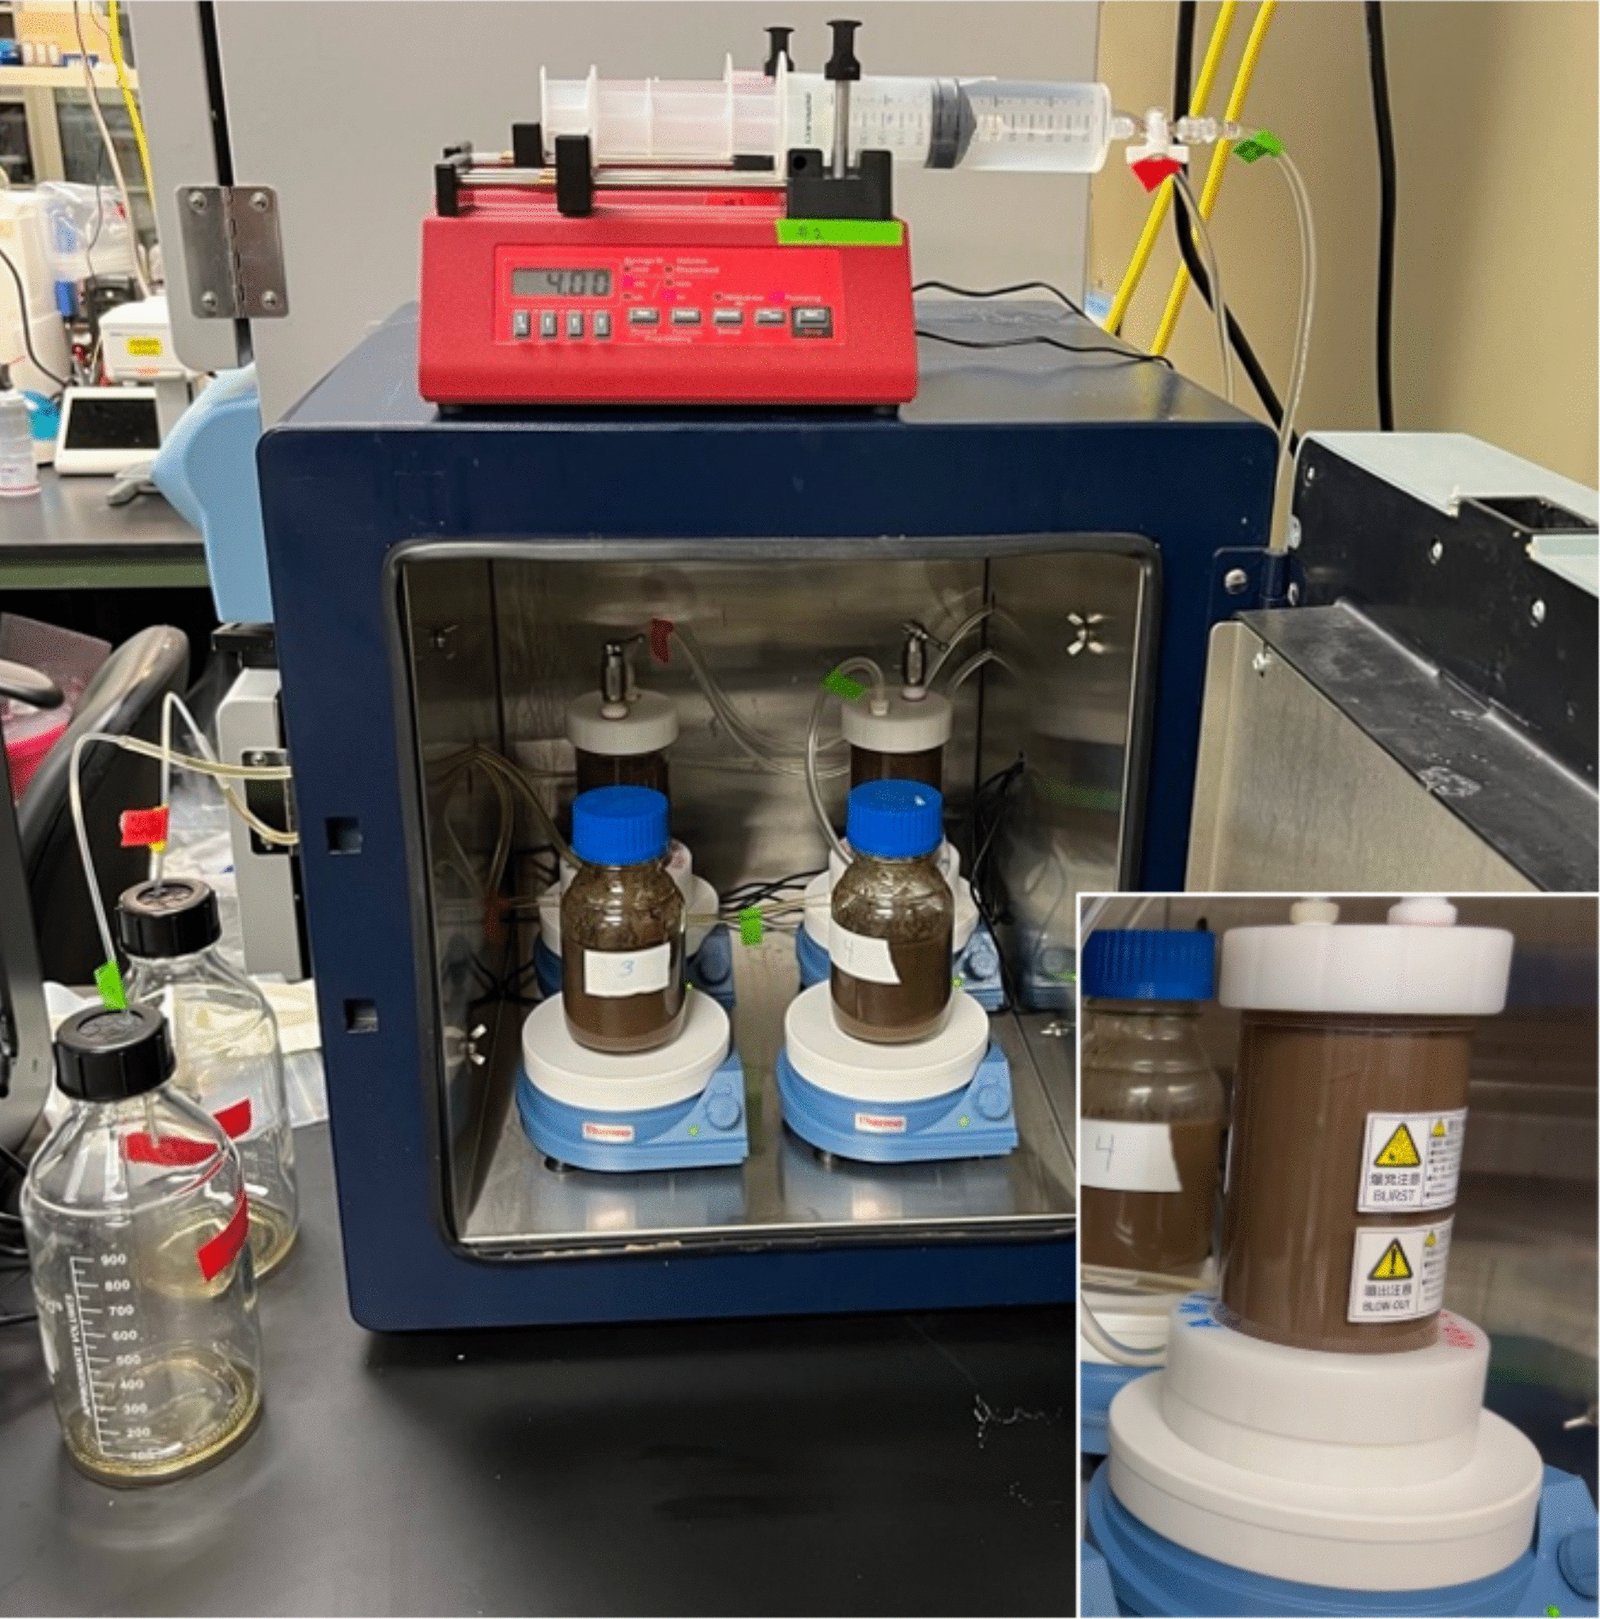
Biomethane potential (BMP) was evaluated using the Gas Endeavour III automatic gas flow measuring system, model 28-0000-03 (BPC Instruments, Lund, Sweden). This advanced system comprises three main units: Unit A, Unit B, and Unit C (Figure S1). The system is connected to a computer, enabling access to the data-logging software application for real-time monitoring and analysis. Unit A serves as an incubation unit, consisting of a linear shaking water bath that can accommodate up to 18 digestion vessels, each with a capacity of 250 mL. Each vessel is connected via Tygon tubing to a secondary glass vessel (Unit B) containing 200 mL of a 3 M NaOH alkaline solution, which effectively removes carbon dioxide (CO2) and hydrogen sulfide (H2S) from the biogas produced during the batch fermentation. The purified biomethane is then directed into a water-filled flow cell unit (Unit C) via Tygon tubing. The gas is trapped in the flow cell chamber until the lifting force of buoyancy is enough to trigger the opening of the flow cell. Upon opening, the gas is released, measured, and recorded with a resolution of 2 mL. For each measurement, ambient temperature and pressure is registered, and the gas volume is automatically normalized to standard temperature and pressure conditions (NmL at STP).
The TS content in each digestion vessel was adjusted to 4% (40 mg/mL) using an inoculum-to-substrate ratio (ISR) of 1:1 and a total working volume of 80 mL. Prior to initiating the experiments, each digestion vessel was flushed with nitrogen for 1 min to create an anaerobic environment. All substrates (untreated and treated) were tested in duplicate under thermophilic conditions (54 °C) for a minimum of 21 days. Inoculum-only controls were included to establish a baseline for microbial activity without substrate influence. Cumulative methane production data were downloaded from the data-logging platform and used for the calculation of BMP (NmL/g TS and NmL/g VS) in Eq. 1. Standard error propagation was calculated to account for the error from the methane production in the substrate, error in methane production in the inoculum, and error associated with the TS or VS measurements:
$${BMP}_{TS, or ,VS, ,substrate} =left[frac{({ Methane }_{Substrate ,(NmL)} – {Methane }_{Inoculum ,(NmL)})}{{TS ,or ,VS }_{substrate,(g)}}right]$$
(1)
16S rRNA gene sequencing
Changes in microbial community composition for each digestate treatment condition were assessed using 16S rRNA gene sequencing. A 1–2 mL sample was taken at the beginning and end of each experiment and shipped overnight to Zymo Research LLC for sequencing (Zymo Research, Irvine, California). This service included DNA extraction using the ZymoBIOMICS®−96 MagBead DNA Kit (Zymo Research, Irvine, CA), library preparation using Quick-16S™ NGS Library Prep Kit (Zymo Research, Irvine, California) with custom primers amplifying the V3–V4 region of the 16S rRNA gene. The Select-a-Size DNA Clean & Concentrator™ (Zymo Research, Irvine, California) was used to clean the final library; it was then quantified with TapeStation (Agilent Technologies, Santa Clara, California) and Qubit (Thermo Fisher Scientific, Waltham, WA). It was sequenced on Illumina Nextseq with a P1 reagent kit (600 cycles) and included a 30% PhiX spike-in.
Raw paired-end sequences were analyzed using the R (version 4.3.3) DADA2 pipeline (version 1.30.1), which includes filtering, dereplication, amplicon sequence variant (ASV) inference, chimera removal, merging reads, and taxonomic assignment [26]. The Zymo Research Database, a proprietary, custom-built and curated 16S database, and SILVA Small Subunit NR99 database (version 138.2) were used as the references for taxonomic assignment [27]. Using the R package Phyloseq (version 1.48.0), raw read counts were converted to relative abundance [28]. For ease of interpretation of the bar charts, a relative abundance threshold was used to display only taxa that contributed 2% or more to the total relative abundance in any one sample. Taxa that contributed 0.5% or more were retained to investigate a wider range of species that displayed a log-fold change in abundance between the beginning and the end of the AD reaction. Bar charts and raster plots were created in R using ggplot2 (version 3.5.0).
Statistical analysis
One-way analysis of variance was used to compare means of BMP, lignocellulose removal, and dissolved organic carbon (DOC) across each experimental series. In addition, Tukey honest significance difference method was employed for pairwise comparisons of means. These analyses were performed in R using the Stats package (version 4.4.1). p-values from the pairwise comparisons are included in the supplemental files.
Results and discussion
Chelator-mediated Fenton treatment of solid digestate (SD)
CMF post-treatment was applied to SD, using Fe2+ and H2O2 along with DHB, to 1) facilitate lignocellulose oxidation and 2) partially solubilize organic matter. DHB serves as a chelator, forming complexes with Fe2+ (Scheme S1), which enhances the generation of hydroxyl radicals (·OH) from H2O2, thereby improving the efficiency of the reaction [29]. The efficacy of this method is influenced by substrate characteristics and the reaction parameters. Composition analysis indicated that untreated SD is comprised of 21.0 wt.% lignin, 13.9 wt.% xylan, and 30.4 wt.% glucan, aligning well with findings in the literature for similar lignocellulosic digestates [30,31,32]. The total carbon content was 40.6 wt.%, with only 3% of the total carbon identified as DOC. The low proportion of DOC and high lignin content suggests that the organic matter in SD is not readily accessible for microbial metabolism, validating the need for post-treatment [33].
To evaluate the influence of different CMF treatment conditions, the following reaction parameters were investigated: pH (Series 1), Fe2+-DHB concentration (Series 2), and H2O2 concentration (Series 3). The reaction conditions and post-reaction slurries for each sample are shown in Table S1 and Figure S2, respectively. CMF treatment of SD increased the soluble mass fraction up to 192% and decreased the insoluble fraction up to 39%, indicating substantial deconstruction of SD (Table S2). Increases in solubility and deconstruction of the lignocellulosic structure can enhance the accessibility of the remaining carbohydrates for microbial degradation [5].
Impact of CMF treatment conditions on lignocellulose composition
To evaluate the changes in lignocellulosic composition following CMF post-treatment, we quantified delignification, hemicellulose (xylan) removal, and cellulose (glucan) removal. The lignin and carbohydrate content for each reaction series is provided in Table S3, along with the solids recovery for each substrate, which indicates the proportion of insoluble biomass recovered after treatment. The percentage removal of each component was calculated using Equation S1, as reported previously [34]. The results for each reaction series are also presented in Fig. 1, showing the extent of delignification, xylan removal, and glucan removal up to 55%, 79%, and 66%, respectively. Previous studies have reported that delignification of lignocellulosic residues can exceed 50% when employing common treatment methods, such as thermo-alkaline treatment at temperatures above 100 °C [35]. Our results show that CMF treatment can achieve comparable delignification results under milder temperature conditions (50 °C). Notably, the variations in the reaction parameters had a more significant impact (p-value < 0.05) on delignification than on the removal of xylan and glucan. This suggests that CMF reaction parameters can be tailored to improve delignification, which is critical for improving AD efficiency and valorization of lignocellulosic biomass. Thus, we focused our analysis on CMF-facilitated delignification.

Effect of CMF reaction parameters on delignification (blue), xylan removal (teal), and glucan (green) removal. In each reaction series (Series 1, 2 and 3), one parameter (pH set-point, Fe2+-DHB concentration, and H2O2 concentration) was varied, while the other parameters were held constant in the following reaction conditions: pH 6, 5 mM Fe2+ -DHB, and 3 wt.% H2O2. Standard error propagation was calculated for triplicate measurements of lignin, xylan and glucan content
In Series 1, CMF reactions conducted at pH 6 and pH 8 showed higher delignification (p-value < 0.05) compared to pH 4, reaching 46% at pH 8 (Fig. 1). The improved delignification at higher pH is likely due to pH-dependent complexation between DHB and Fe2+ ions [36]. At lower pH levels (< 5.5), unstable mono-complexes form, weakening DHB’s chelating effects and leading to rapid and unproductive H2O2 consumption [37, 38]. In contrast, higher pH levels promote the formation of stable bis-complexes, which enhance Fe2+ solubility and reduce unproductive H2O2 decomposition. In the reactions with initial pH 4, 6, and 8, the pH dropped below pH 3, 4, and 5, respectively, attributed to the deconstruction of lignin which can result in de-aromatization and carboxylic acid generation [39]. Given that reactions that started at pH 4 dropped below pH 3 after each aliquot, DHB complexation was likely unable to effectively cycle Fe3+ to Fe2+ and prevent precipitation of Fe2+, ultimately limiting the overall efficiency of the reaction. The stabilization of H2O2 at higher pH reduces the likelihood of unproductive termination of hydroxyl radicals and enhances the reduction of Fe3+ to Fe2+, ultimately leading to more efficient removal of lignin [38]. In addition, lignin becomes more soluble and can also chelate Fe2+ ions, leading to more localized oxidation reactions that enhance the efficiency of delignification.
Among the three Fe2+-DHB concentrations tested in Series 2 (5, 10, and 15 mM), the highest delignification results were achieved with 5 mM Fe2+-DHB. The corresponding molar ratios of H2O2/Fe2+-DHB were 176, 88, and 59 for the 5 mM, 10 mM, and 15 mM reactions, respectively. At lower molar ratios, excess Fe2+-DHB may scavenge hydroxyl radicals, reducing their availability for effective lignocellulose deconstruction. In addition, studies have shown that DHB is oxidized into biodegradable acids by Fenton processes [40, 41]. The concentration of the Fe2+-DHB complex likely influences the extent of DHB oxidation and the resulting degradation products. Any residual sulfate from the iron sulfate heptahydrate will likely enhance the fertilizer value of the undigested material, as sulfate is essential for crop growth. The optimal ratios of H2O2/Fe2+-DHB can vary depending on the substrate composition and other reaction parameters, highlighting the need for careful optimization to achieve maximum delignification [16, 42].
Four H2O2 concentrations (1, 2, 3 and 4 wt.%) were explored in Series 3. In the Fenton process, H2O2 serves as the primary source of hydroxyl radicals, which are critical for the reaction. A significant increase in delignification (p-value < 0.05) was observed from 1 to 3 wt.% H2O2, attributed to the increased availability of hydroxyl radicals in the solution. Maximum delignification occurred at the highest H2O2 concentration (4 wt.%), but the increase from 3 to 4 wt.% H2O2 was not statistically significant, suggesting that further increasing H2O2 dosage would likely not improve lignin removal. A similar phenomenon has been documented in previous studies, indicating a saturation point in delignification during Fenton oxidation [43]. Therefore, careful optimization of H2O2 dosing is essential to maximize reaction efficiency.
Evaluating carbon recovery and loss in CMF-treated digestate
The deconstruction of lignocellulose can result in a complex distribution of organic and inorganic compounds, which effects the carbon content of the biomass, a necessary component for AD. To evaluate the fate of the carbon following CMF treatment of SD, carbon content was analyzed for each reaction, via total dissolved organic carbon (DOC) and elemental analysis for insoluble carbon. The remaining carbon is assumed to be mineralized to CO2. The results are presented in Fig. 2 and Table S4, showing that carbon recovery, comprising DOC and insoluble carbon, ranged from 77 to 98%, depending on the reaction conditions. Notably, H2O2 dosage (> 2 wt.%) was the primary factor contributing to carbon loss as CO2, which is a typical outcome of the over-oxidation of low molecular weight organic compounds in Fenton processes [44].

Effect of CMF reaction conditions on the total carbon balance. Dissolved organic carbon (dark blue), insoluble carbon (blue-grey) and lost carbon (light grey). Experiments were performed under conditions of 5 mM Fe2+-DHB, pH 6, and 3 wt.% H2O2, with one parameter varied in each series while keeping the others constant. Percentages were normalized to a total of 100% based on the initial carbon content in SD. Standard error propagation calculated for triplicate DOC measurements and for single elemental analysis measurements for insoluble carbon for duplicate reactions
Soluble organic compounds released during oxidation processes, including sugars and organic acids, contribute to the overall DOC, which is critical for improved microbial fermentation [45]. DOC in the CMF-treated samples increased up to tenfold when compared to the untreated SD (p-value < 0.05). Significant increases in DOC (p-value < 0.05) were also observed with elevated pH (6 and 8), lower Fe2+-DHB content, and higher H2O2 concentrations (up to 3 wt.%), closely mirroring trends observed in delignification. In Series 1, DOC increased by 88% from pH 4 to 6, but no further increase was observed from pH 6 to 8. Series 2 showed a 27% reduction in DOC as Fe2+-DHB concentration increased from 5 to 15 mM. In Series 3, the DOC increased by 114% from 1 to 3 wt.% H2O2. Maximizing delignification and DOC while minimizing the H2O2 dosage is critical, as H2O2 is the major cost factor for Fenton processes. In addition, it is critical to prevent the loss of carbon as volatile species resulting from over-oxidation to preserve the organic material for AD and mitigate environmental effects associated with CO2 emissions.
Improvements in biomethane potential following CMF treatment
The volatile solids to total solids (VS/TS) ratio serves as an indicator of organic content, which is essential for biomethane production, provided that the organic material is bioavailable [46]. Analysis of the VS/TS ratios revealed that SD had a VS/TS ratio of 0.85, indicating substantial organic content (Fig. 3A). CMF-treated substrates showed lower VS/TS ratios, ranging from 0.68 to 0.79, attributed to the extent of deconstruction. To test the bioavailability of these substrates for methanogenesis, BMP tests were conducted over a 21-day period using untreated and treated substrates from Series 1, 2, and 3. Primary digestate slurry served as the inoculum seed, referred to as Inoculum A. Cumulative methane production values and corresponding BMP results (NmL CH4/g TS and NmL CH4/g VS) are summarized in Table S5. The BMP results for all substrates, reported in NmL CH4/g VS, are shown in Fig. 3B. Notably, all treated substrates exhibited significant improvements in BMP compared to untreated SD, with increases ranging from five to tenfold (p-value < 0.05). These findings suggest that, although the oxidative treatment resulted in a loss of some carbon as CO2, it enhanced the biodegradability of the remaining organic matter or altered the substrate composition in a way that favored microbial activity. Thus, the overall improvements in BMP were a result of improved deconstruction and increased SD solubility.

Anaerobic digestion organic solids analysis and biomethane potential results. A VS/TS ratio for each reaction series, representing the organic fraction of each substrate. Standard error calculated for duplicates. B Biomethane potential reported in NmL CH4/g VS for each substrate: untreated (dark grey), varied pH set-point (orange), varied Fe2+-DHB concentration (green) and varied H2O2 concentration (purple). Gas volume is automatically normalized to standard temperature and pressure conditions (NmL at STP). Standard propagated error calculated for duplicates
In AD Series 1, the BMP increased by 36% from pH 4 to pH 8 (p-value < 0.05), further supporting the conclusion that CMF reactions conducted at pH 6 or pH 8 enhanced the breakdown of the recalcitrant fibers. Although an average decrease in BMP was observed with increasing Fe2+-DHB concentration in Series 2, the variation in BMP was not statistically significant. 16S rRNA gene sequencing confirmed that the effects of pH set-point and Fe2+-DHB content on microbial community composition were generally minimal, with only minor changes in the relative abundances of taxa across these conditions (Figure S3 and S4). The concentration of H2O2 (Series 3) had the most notable effect on methane production, resulting in a 96% increase in BMP from 1 to 4 wt.% H2O2 (p-value < 0.05). While the variation of BMP in this H2O2 range is evident, 16S showed that only minor differences in microbial composition were detected (Fig. 4A and B). The improvements in BMP correlated with increases in DOC and enhanced deconstruction of lignocellulose, confirming the CMF treatment improved the accessibility of organic matter for methanogenesis. In addition, the observed stability in microbial composition likely suggests that the variations in substrate properties affected microbial function rather than altering the community structure. Principal coordinate analysis (PCoA) using Bray–Curtis distance was used for a reduced dimensionality comparison of 16S relative abundance as it related to tested CMF reaction parameters for Inoculum A (Figure S5). As expected, all CMF-treated samples, regardless of reaction condition, clustered away from the SD control.

Effect of inoculum and H2O2 concentration on biomethane potential and microbial composition. A Cumulative biomethane potential (NmL CH4/g VS) of CMF-treated substrates across varying H2O2 concentrations using Inoculum A. B Relative abundance of microbial taxa at the end of digestion in samples treated with Inoculum A. C Cumulative biomethane potential (NmL CH4/g VS) of CMF-treated substrates across varying H2O2 concentrations using Inoculum B. D Relative abundance of microbial taxa at the end of digestion in samples treated with Inoculum B. Error bars represent the standard error of duplicate measurements
Impact of inoculum on biomethane potential
Studies have shown that inoculum source can significantly impact methane potential, methane production rates, and microbial dynamics during the digestion process [47]. Different inocula may harbor distinct microbial populations with unique metabolic capabilities, affecting their efficiency in degrading the CMF-treated substrate and producing biomethane. To better understand how variations in microbial communities can impact methane yields, AD experiments were repeated using the same substrates from Series 3 and a different inoculum batch (Inoculum B). Substrates with varied H2O2 dosage were specifically chosen for this investigation because significant variations in delignification, DOC, and BMP were observed under these conditions. Inoculum B was obtained from the same AD pilot plant as Inoculum A, but it was sourced from a separate batch of digested cow manure, resulting in differences in chemical and microbial composition (Table S6). The results obtained with Inoculum B were then compared to those from Inoculum A to validate our key findings regarding the enhancement of BMP with increased H2O2 dosage. This comparison also allowed us to evaluate the influence of different microbial communities on BMP profiles and microbial composition (Fig. 4).
The direct comparison of BMP between the two inocula, across the varied H2O2 treatments, is shown in Fig. 5. When using Inoculum B, the positive correlation between H2O2 concentration and methane production was even more pronounced. CMF-treated substrates digested with Inoculum B yielded higher BMP values for all H2O2 doses. Substantial increases in BMP were observed in the 2 to 4 wt.% H2O2 range, with BMP values exceeding those associated with Inoculum A by as much as 53%. In addition to improved methane yields, Inoculum B exhibited notable shifts in microbial community composition in response to increasing H2O2 concentrations—changes that were less evident with Inoculum A (Fig. 4). These differing results suggest potential variations in the enzymatic capacities of the two inocula to degrade CMF-treated digestate. PCoA was used to compare the 16S relative abundance data across CMF H2O2 concentrations for Inoculum A and B (Figure S6). The analysis revealed clear separation of samples based on inoculum type, as well as distinct clustering between CMF-treated samples and untreated SD controls or inoculum-only samples. Understanding these dynamics is essential for the future industrial application of this treatment method. The implications of these microbial shifts for enhanced deconstruction and methane production are further discussed in the Microbial Community Dynamics section.

Final biomethane potential (NmL CH4/g VS) of CMF-treated substrates (5 mM Fe2+-DHB and pH 6) under varying H2O2 concentrations (1–4 wt.% H2O2) using Inoculum A (purple) and Inoculum B (blue), both at an ISR of 1:1, pH 7. Error bars represent the standard propagated error of duplicate measurements
Impact of lignocellulosic composition on CMF treatment efficacy
The lignocellulosic composition of agricultural waste digestates can vary significantly, depending on the initial feedstock and AD conditions. For instance, digestates produced from the AD of energy crops typically exhibit higher lignin content compared to those derived from manure, with lignin levels often exceeding 40 wt.% [48]. To better understand how variations in lignin content influence the efficacy of our CMF treatment method, we investigated its potential on a more recalcitrant material, specifically poplar lignin (PL). The carbon content in untreated PL was measured to be 50.9% (Table S7) on a dry basis, with less than 1% total DOC (Table S8). Composition analysis revealed that PL is comprised of 19.6 wt.% glucan, 3.5 wt.% xylan, and 41.8 wt.% lignin (Table S9). Notably, the lignin content in PL was double that of the untreated SD, and the combined glucan and xylan content was 47% lower. The higher lignin content and lower carbohydrate content in PL suggest a greater challenge for deconstruction and reduced availability of fermentable sugars for AD.
The following CMF reaction parameters were applied to PL: 5 mM Fe2+-DHB, pH 6, and 3 wt.% H2O2. Under these conditions, significant enhancements were observed in delignification, DOC, and BMP for SD. However, it is important to note that optimal CMF conditions are likely substrate dependent. The mass balance for untreated and treated PL samples was conducted similarly to the SD samples described above (Table S10). Treatment of PL resulted in a 50.6% reduction in lignin, a 73.1% reduction in xylan, and a 25.9% reduction in glucan (Table S9). In addition, a 32-fold increase in DOC was observed (Table S8), indicating that the breakdown of lignin and hemicellulose released soluble carbon. To evaluate improvements in bioavailability, a 21-day BMP test was conducted using PL as a substrate with Inoculum B. The comparative BMP results for both substrates (PL and SD) are summarized in Table S11 and shown in Fig. 6. SD-CMF reached a maximum BMP of 285 NmL CH4/g VS at the end of the digestion, representing a sixfold increase in BMP from the untreated SD control (p-value < 0.05). PL-CMF reached a final BMP of 173 NmL CH4/g VS, demonstrating a threefold increase in BMP when compared to the untreated PL control (p-value < 0.05). By day 12, PL-CMF had reached its maximum methane potential, indicating that the readily degradable organic matter in the substrate had been fully utilized by the microbial community. The elevated lignin content and lower levels of DOC in the CMF-treated PL substrate likely contributed to the early cessation of methane production and lower overall BMP compared to SD. However, the increase in BMP due to the treatment is still favorable, validating the treatment’s efficacy and ability to accommodate variability in lignocellulosic substrate composition.

Cumulative biomethane potential (NmL CH4/g VS) resulting from treatment of SD-CMF (teal) vs treatment of PL-CMF (purple), compared to their respective untreated controls. CMF treatments were conducted under the following reaction conditions: 5 mM Fe2+-DHB, pH 6, and 3 wt.% H2O2. Error bars represent the standard propagated error of duplicate measurements
Microbial community dynamics reveal inoculum-dependent responses to CMF treatment
Relative abundance using 16S rRNA gene sequencing was employed to understand the impact of CMF treatment on microbial community dynamics and subsequent changes in biomethane yields across different substrates and inocula. This analysis aimed to (1) assess the impact of CMF treatment on microbial community structure at a high level, (2) identify compositional differences between Inoculum A and Inoculum B that could account for variations in biomethane potential, and (3) explore potentially key microbial taxa that contribute to enhanced degradation and methane production.
The comparison of untreated SD to CMF-treated digestates, regardless of inoculum, revealed pronounced changes in the microbial community composition (Fig. 3B and D). With Inoculum A, this included increases in the relative abundance of Ruminococcaceae (family), Anaerolineaceae (family), Clostridia vadin BB60 group (class), and Methanosarcina sp., as well as decreases in Gelria sp. and Psychrobacillus sp. When using Inoculum B, substantial increases in the relative abundances of Ruminiclostridium sp. and Defluviitalea sp. were observed, while Ruminococcaceae (family), Sporosarcina sp., and Methanoculleus sp. decreased with increasing H2O2 concentrations. The differences in methane potential between the two inocula, highlighted in Fig. 4, indicate that the microbial communities may possess distinct metabolic capabilities and population dynamics which influenced the kinetics of substrate deconstruction. Figure S7 shows the overlapping and unique taxa across inocula, with some core taxa, Ruminiclostridium sp., Clostridia vadin BB60, and Mobilitalea sp., shared in all samples.
Differences in microbial composition were also compared for CMF-treated SD and PL (Fig. 7). Figure 7A summarizes endpoint community profiles, while Fig. 7B presents the log-fold changes in relative abundance from start to end of digestion, with Table S12 highlighting taxa with > 1.5-fold changes. In SD-CMF, increases in Ruminiclostridium sp. and Defluviitalea sp. and decreases in Methanoculleus sp. and Ruminococcaceae (family) were observed when compared to SD (Fig. 7A). In PL-CMF, there were increases in Ruminococcaceae (family) and decreases in Ruminiclostridium sp. when compared to PL (Fig. 7A). When comparing start to end, the genus Haloplasma increased in relative abundance, while the genera Pseudomonas and Sporosarcina decreased in relative abundance universally. For both PL-CMF and SD-CMF, there were relative increases in the genus Defluviitalea and decreases in Paenibacillus and Psychrobacillus. Unique to PL-CMF were increases in genera Ureibacillus, Dethiobacter, and Turicibacter. In SD-CMF, Christensenellaceae, Tepidimicrobium, Gelria, and Ruminiclostridium increased more significantly in relative abundance from start to end compared to SD, which was unique to this sample.

Microbial community analysis of CMF-treated and untreated PL and SD samples. A Relative abundance of microbial taxa in untreated and CMF-treated PL and SD samples at the end of anaerobic digestion using Inoculum B. B Log-fold changes in microbial taxa from the beginning to the end of digestion for untreated and CMF-treated PL and SD samples
Overall, Ruminiclostridium sp. and Ruminococcaceae (family) were prevalent across all conditions and are known for cellulolytic activity [49]. Defluviitalea also emerged as a potentially important fermentative organism particularly in Inoculum B. Co-culture of Ruminiclostridium sp. and Defluviitalea sp. has been reported to enhance cellulose hydrolysis and metabolic activity as a result of cross-feeding between the organisms [50]. The enrichment of these two organisms in CMF-treated samples could be indicative of this cross-feeding and will be explored in future work. Overall, the observed enrichment of cellulolytic organisms, combined with prior reports that Fenton oxidation does not extensively depolymerize lignin [18], suggests that most of the carbon converted to methane in this study derives from the cellulose and hemicellulose fractions of the CMF-treated substrates. Rather than breaking down lignin into low molecular weight compounds, Fenton oxidation likely enhances the accessibility of sugars for microbial conversion. The delignification observed with CMF treatment is more likely attributed to a reduction in aromaticity rather than depolymerization of the lignin itself.
Methanoculleus and Methanosarcina were the dominant methanogens across all samples. Methanoculleus sp. are hydrogenotrophic methanogens that utilize H2/CO2 and formate to produce methane and are frequently reported as dominant taxa in anaerobic digestors and biogas systems due to their adaptability [46]. Methanosarcina sp. are metabolically versatile, capable of performing all three methanogenesis pathways––hydrogenotrophic, acetoclastic, and methylotrophic––enabling them to adapt to a wide range of environmental conditions [51]. Notably, Methanosarcina sp. increased in relative abundance from the beginning to the end of digestion in both treated and untreated SD and PL samples (Fig. 7B), suggesting a role in recovering methanogenic activity following the initial stages of substrate breakdown. This observation aligns with findings by Illmer et al., who reported Methanosarcina as a key player in fermenter sludge digestion, particularly in overcoming stagnation phases associated with acid accumulation and pH drop [52]. However, Methanoculleus maintained higher overall relative abundance in most samples, indicating that hydrogenotrophic methanogenesis may have been the dominant methane production pathway under the tested conditions. Understanding the interplay between Methanoculleus and Methanosarcina, whether cooperative or competitive, could provide valuable insights for tailoring inoculum compositions to maximize biomethane yields from CMF-treated substrates.
Conclusion
This study demonstrated the effectiveness of CMF post-treatment in enhancing biomethane yields from two lignocellulosic substrates: SD and PL. Key factors for high performance included delignification and DOC, indicating the importance of chemical and structural transformations. Microbial community analysis linked the increased BMP with Inoculum B to higher abundances of cellulolytic organisms such as Ruminiclostridium sp. and Defluviitalea sp., suggesting that CMF treatment enhances substrate accessibility. The inoculum-dependent response indicated that further improvements may be achieved through inoculum engineering or selective enrichment via adaptation. Future research will focus on elucidating metabolic pathways, characterizing CMF-derived reaction products, and exploring cross-feeding mechanisms among enriched microbial taxa. Techno-economic assessments will evaluate the scalability and sustainability of this novel application of CMF treatment in AD systems.
Data availability
16S rRNA sequencing data are available in NCBI under BioProject accession no. PRJNA1257006. Additional data are provided in the supplementary information files.
References
-
Piadeh F, et al. A critical review for the impact of anaerobic digestion on the sustainable development goals. J Environ Manage. 2024;349: 119458.
-
Kalita S, et al. Energy performance of compressed biomethane gas production from co-digestion of Salix and dairy manure: factoring differences between Salix varieties. Biotechnol Biofuels Bioproducts. 2023;16(1):165.
-
Dubey P, Schulte LA, Mba Wright M. The economic and environmental case for cattle manure and prairie grass-derived sustainable aviation fuel. Energy Fuels. 2024;38(21):20721–31.
-
Bube S, et al. Kerosene production from power-based syngas—a technical comparison of the Fischer-Tropsch and methanol pathway. Fuel. 2024;366: 131269.
-
Olatunji KO, Ahmed NA, Ogunkunle O. Optimization of biogas yield from lignocellulosic materials with different pretreatment methods: a review. Biotechnol Biofuels. 2021;14(1):159.
-
Wang W, Lee D-J. Valorization of anaerobic digestion digestate: a prospect review. Biores Technol. 2021;323: 124626.
-
Li Y, et al. Factors affecting gaseous emissions, maturity, and energy efficiency in composting of livestock manure digestate. Sci Total Environ. 2020;731: 139157.
-
Cavali M, et al. Biochar and hydrochar in the context of anaerobic digestion for a circular approach: an overview. Sci Total Environ. 2022;822: 153614.
-
Nordell E, et al. Thermal post-treatment of digestate in order to increase biogas production with simultaneous pasteurization. J Biotechnol. 2022;344:32–9.
-
Carrere H, et al. Review of feedstock pretreatment strategies for improved anaerobic digestion: from lab-scale research to full-scale application. Biores Technol. 2016;199:386–97.
-
Usman Khan M, Kiaer Ahring B. Improving the biogas yield of manure: effect of pretreatment on anaerobic digestion of the recalcitrant fraction of manure. Bioresour Technol. 2021;2021(321):124427.
-
Somers MH, et al. Effect of digestate disintegration on anaerobic digestion of organic waste. Biores Technol. 2018;268:568–76.
-
Rajendran K, et al. Updates on the pretreatment of lignocellulosic feedstocks for bioenergy production–a review. Biomass Convers Biorefinery. 2018;8(2):471–83.
-
Wu D, et al. Improved lignocellulose degradation efficiency based on Fenton pretreatment during rice straw composting. Biores Technol. 2019;294: 122132.
-
Hashemi S, et al. Stimulating biogas production from steam-exploded birch wood using Fenton reaction and fungal pretreatment. Biores Technol. 2022;366: 128190.
-
Kato DM, et al. Pretreatment of lignocellulosic biomass using Fenton chemistry. Biores Technol. 2014;162:273–8.
-
Checa-Fernandez A, et al. Application of chelating agents to enhance Fenton process in soil remediation: a review. Catalysts. 2021. https://doi.org/10.3390/catal11060722.
-
Kent MS, et al. Efficient conversion of lignin into a water-soluble polymer by a chelator-mediated Fenton reaction: optimization of H2O2 use and performance as a dispersant. Green Chem. 2018;20(13):3024–37.
-
Martinez DV, et al. Depolymerization of lignin for biological conversion through sulfonation and a chelator-mediated Fenton reaction†. Green Chem. 2022;24(4):1627–43.
-
Martinez DV, et al. Deconstructing poplar lignin from ionic liquid pretreatment for biological conversion through sulfonation and Fenton chemistry. RSC Sustain. 2025.
-
Choudhary H, et al. Funneled depolymerization of ionic liquid-based biorefinery “heterogeneous” lignin into guaiacols over reusable palladium catalyst. Chem Eur J. 2023;29(27):e202300330.
-
Rice EW, et al. Standard methods for the examination of water and wastewater. 2012.
-
Fukushima RS, et al. Comparison of acetyl bromide lignin with acid detergent lignin and Klason lignin and correlation with in vitro forage degradability. Anim Feed Sci Technol. 2015;201:25–37.
-
Yao A, et al. Can multiple ions in an ionic liquid improve the biomass pretreatment efficacy? ACS Sustain Chem Eng. 2021;9(12):4371–6.
-
Sluiter A. National Renewable Energy Laboratory (NREL) Analytical Procedures. 2004.
-
Callahan BJ, et al. DADA2: high-resolution sample inference from Illumina amplicon data. Nat Methods. 2016;13(7):581–3.
-
Quast C, et al. The SILVA ribosomal RNA gene database project: improved data processing and web-based tools. Nucleic Acids Res. 2013;41:D590–6.
-
McMurdie PJ, Holmes S. Phyloseq: a bioconductor package for handling and analysis of high-throughput phylogenetic sequence data. Pac Symp Biocomput, 2012: p. 235–46.
-
Contreras D, et al. Enhanced hydroxyl radical production by dihydroxybenzene-driven Fenton reactions: implications for wood biodegradation. J Biol Inorg Chem. 2007;12(7):1055–61.
-
Cao Z, et al. Hydrothermal carbonization of biogas digestate: effect of digestate origin and process conditions. Waste Manage. 2019;100:138–50.
-
Teater C, et al. Assessing solid digestate from anaerobic digestion as feedstock for ethanol production. Biores Technol. 2011;102(2):1856–62.
-
Bedoić R, et al. Anaerobic digestion of agri-food by-products, in introduction to biosystems engineering. 2020.
-
Li X, et al. New insight into chemical changes of dissolved organic matter during anaerobic digestion of dewatered sewage sludge using EEM-PARAFAC and two-dimensional FTIR correlation spectroscopy. Biores Technol. 2014;159:412–20.
-
Choudhary H, Simmons BA, Gladden JM. Comparative study on the pretreatment of aspen and maple with 1-ethyl-3-methylimidazolium acetate and cholinium lysinate. Front Energy Res. 2022;10:868181. https://doi.org/10.3389/fenrg.2022.868181
-
Mankar AR, et al. Pretreatment of lignocellulosic biomass: a review on recent advances. Biores Technol. 2021;334: 125235.
-
Melin V, et al. Reduction reactivity of catecholamines and their ability to promote a Fenton reaction. Inorg Chim Acta. 2016;453:1–7.
-
Ma X, et al. Comparative study of four polyphenols with enhanced Fe3+/H2O2 fenton-like activity for degrading phenanthrene over a wide initial pH range. ACS ES&T Water. 2025;5(2):713–26.
-
Salgado P, et al. The reactivity and reaction pathway of fenton reactions driven by substituted 1,2-dihydroxybenzenes. Environ Sci Technol. 2017;51(7):3687–93.
-
Hwang J, et al. Highly swellable hydrogels prepared from extensively oxidized lignin. Giant. 2022;10: 100106.
-
Pracht J, et al. Abiotic Fe(III) induced mineralization of phenolic substances. Chemosphere. 2001;44(4):613–9.
-
Mijangos F, Varona F, Villota N. Changes in solution color during phenol oxidation by fenton reagent. Environ Sci Technol. 2006;40(17):5538–43.
-
Gulkaya İ, Surucu GA, Dilek FB. Importance of H2O2/Fe2+ ratio in Fenton’s treatment of a carpet dyeing wastewater. J Hazard Mater. 2006;136(3):763–9.
-
Huang C, et al. The bamboo delignification saturation point in alkaline hydrogen peroxide pretreatment and its association with enzymatic hydrolysis. Biores Technol. 2022;359: 127462.
-
Duesterberg CK, Mylon SE, Waite TD. pH effects on iron-catalyzed oxidation using Fenton’s reagent. Environ Sci Technol. 2008;42(22):8522–7.
-
Hu J, et al. Exploring the molecular composition of dissolved organic matter and its connection to microbial communities in industrial-scale anaerobic digestion of chicken manure. Toxics. 2025. https://doi.org/10.3390/toxics13010049.
-
Oduor WW, et al. Enhancement of anaerobic digestion by co-digesting food waste and water hyacinth in improving treatment of organic waste and bio-methane recovery. Heliyon. 2022;8(9): e10580.
-
Moset V, Al-zohairi N, Møller HB. The impact of inoculum source, inoculum to substrate ratio and sample preservation on methane potential from different substrates. Biomass Bioenerg. 2015;83:474–82.
-
Gul E, et al. Production and use of biochar from lignin and lignin-rich residues (such as digestate and olive stones) for wastewater treatment. J Anal Appl Pyrol. 2021;158: 105263.
-
Kampik C, et al. Handling several sugars at a time: a case study of xyloglucan utilization by Ruminiclostridium cellulolyticum. MBio. 2021;12(6):e0220621.
-
Rettenmaier R, et al. Importance of Defluviitalea raffinosedens for hydrolytic biomass degradation in co-culture with hungateiclostridium thermocellum. Microorganisms. 2020. https://doi.org/10.3390/microorganisms8060915.
-
Smallwood CR, et al. Bioindicator “fingerprints” of methane-emitting thermokarst features in Alaskan soils. Front Microbiol. 2024;15:1462941.
-
Illmer P, Reitschuler C, Wagner AO, Schwarzenauer T, Lins P. Microbial succession during thermophilic digestion: the potential of Methanosarcina sp. PLoS One. 2014;9(2):e86967. https://doi.org/10.1371/journal.pone.0086967
Acknowledgements
We thank members of the Sandia National Laboratories’ Environmental Systems Biology and Bioresource & Environmental Security Departments for their valuable input during this study. We thank Emily Hollister for providing technical guidance and for providing a technical review of this manuscript. We thank Lydia Rachbauer for providing technical guidance on experimental design. We thank Robert Hockaday, the CEO of Tucumcari Bioenergy for supplying the digestate materials and providing technical guidance.
Funding
The author(s) declare financial support was received for the research, authorship, and/or publication of this article. This study was supported by the Energy and Homeland Security Investment Area under Project# 233090 for the Laboratory Directed Research and Development program at Sandia National Laboratories. Sandia National Laboratories is a multi-mission laboratory managed and operated by National Technology & Engineering Solutions of Sandia, LLC (NTESS), a wholly owned subsidiary of Honeywell International Inc., for the U.S. Department of Energy’s National Nuclear Security Administration (DOE/NNSA) under contract DE-NA0003525. This written work is authored by an employee of NTESS. The employee, not NTESS, owns the right, title, and interest in and to the written work and is responsible for its contents. Any subjective views or opinions that might be expressed in the written work do not necessarily represent the views of the U.S. Government. The publisher acknowledges that the U.S. Government retains a non-exclusive, paid-up, irrevocable, world-wide license to publish or reproduce the published form of this written work or allow others to do so, for U.S. Government purposes. The DOE will provide public access to results of federally sponsored research in accordance with the DOE Public Access Plan.
Ethics declarations
Competing interests
The authors declare no competing interests.
Additional information
Publisher’s Note
Springer Nature remains neutral with regard to jurisdictional claims in published maps and institutional affiliations.
Supplementary Information
Rights and permissions
Open Access This article is licensed under a Creative Commons Attribution-NonCommercial-NoDerivatives 4.0 International License, which permits any non-commercial use, sharing, distribution and reproduction in any medium or format, as long as you give appropriate credit to the original author(s) and the source, provide a link to the Creative Commons licence, and indicate if you modified the licensed material. You do not have permission under this licence to share adapted material derived from this article or parts of it. The images or other third party material in this article are included in the article’s Creative Commons licence, unless indicated otherwise in a credit line to the material. If material is not included in the article’s Creative Commons licence and your intended use is not permitted by statutory regulation or exceeds the permitted use, you will need to obtain permission directly from the copyright holder. To view a copy of this licence, visit http://creativecommons.org/licenses/by-nc-nd/4.0/.
About this article

Cite this article
Martinez, D.V., Schambach, J.Y., Davydovich, O. et al. Chelator-mediated Fenton post-treatment enhances methane yield from lignocellulosic residues via microbial community modulation. Biotechnol. Biofuels Bioprod. 18, 73 (2025). https://doi.org/10.1186/s13068-025-02672-z
-
Received:
-
Accepted:
-
Published:
-
DOI: https://doi.org/10.1186/s13068-025-02672-z