
Main
The human genome encodes at least 1,500 RNA-binding proteins (RBPs)1,2, which are fundamental regulators of RNA biology, orchestrating processes such as splicing, localization, translation and degradation of mRNAs and numerous non-coding RNAs. RBPs are indispensable for critical physiological functions, including cellular differentiation, embryonic development, neuronal activity, immune surveillance and aging3,4,5,6,7. Furthermore, disruptions in RBP–RNA interactions are increasingly being implicated in diseases like cancer, neurodegenerative disorders, cardiovascular diseases and metabolic syndromes8, rendering them promising therapeutic targets. For example, G3BP1 is aberrantly expressed in various cancers and has been shown to promote the proliferation and metastasis of cancer cells9,10. To fully understand the regulatory roles of RBPs in both normal and disease conditions, it is essential to characterize dynamic RBP–RNA interactions across diverse contexts with high resolution at both the molecular and cellular levels.
RNA immunoprecipitation (RIP) and cross-linking immunoprecipitation (CLIP) are foundational techniques for studying RNA–protein interactions within cells. These techniques use specific antibodies to pull down an RBP along with its associated RNA targets11,12,13. Advanced CLIP variants, such as iCLIP14 and eCLIP15, have improved the resolution of RBP binding sites, but they remain labor-intensive and prone to non-specific interactions in low-complexity libraries, and require large sample inputs. These limitations impede their use with low-input or rare samples and in large-scale parallel analyses. Recent innovations, such as antibody-directed reverse-transcription-based techniques (for example, RT&Tag16 and ARTR-seq17), have enabled the capture of RBP-interacting transcripts from low-input samples. However, they cannot achieve single-cell resolution or resolve isoform-specific targets. Moreover, none of the above methods allow parallel transcriptome analysis in the same cellular context, making it impossible to directly correlate RBP binding with regulation of gene expression.
Two recently developed techniques, TRIBE18 and STAMP19, employ ectopically expressed ADAR or APOBEC deaminase–RBP fusions to mark RNA targets without enrichment, preserving full transcriptome information. Although these IP-free techniques enable substrate discovery from low-input material, including single cells, their reliance on genetic manipulation limits their use in primary cells and clinical samples. Furthermore, ectopic fusion proteins might introduce artifacts or alter endogenous RBP function, and their lack of temporal resolution hinders the study of dynamic processes. Therefore, a versatile and user-friendly method is urgently needed to profile the transcriptome and RBP–RNA interactome with high temporal resolution, minimal input and compatibility with tissue samples.
In this study, we present MAPIT-seq, an approach that uses an antibody-targeted editing strategy to comprehensively profile the RBP–RNA interactome in situ alongside transcriptome data from the same fixed sample. MAPIT-seq is applicable for studying any RBP with a suitable antibody. We validate MAPIT-seq across RBPs with diverse functions, and reveal the weak RNA-binding abilities of PRC2 components in situ. Additionally, we investigate binding profiles of G3BP1 and define its regulatory role in perinatal neural development using mouse embryonic brain tissues. Furthermore, we optimize MAPIT-seq to achieve single-cell and isoform resolution. The paired single-cell transcriptome data allow us to reveal G3BP1’s cell-cycle-stage-specific function and its opposing regulatory effects on distinct target-gene subsets. In summary, MAPIT-seq is a versatile dual-omics platform, offering a unique opportunity that directly links RBP binding to gene-expression outcomes in tissue sections and single cells.
Results
Design and optimization of MAPIT-seq
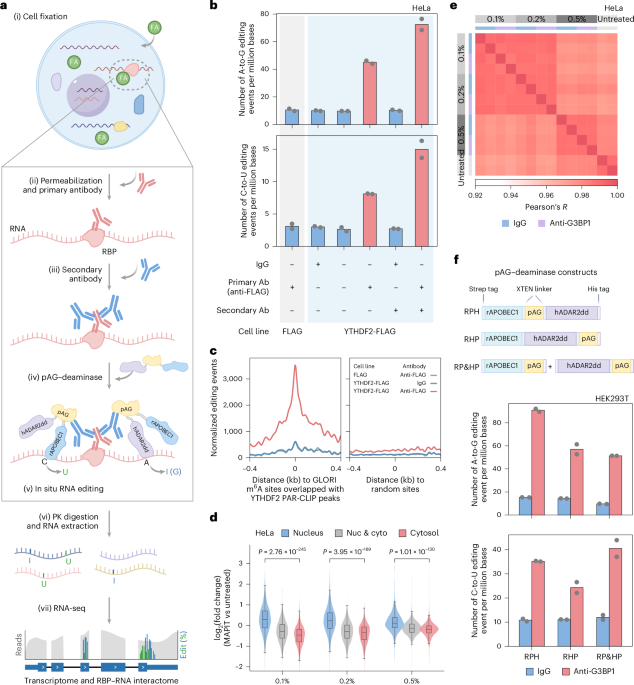
MAPIT-seq utilizes an antibody-directed RNA-editing strategy for in situ investigation of endogenous RBP targets (Fig. 1a). The key reagent of MAPIT-seq is a recombinant protein, produced in insect cells (Methods), that fuses protein A/G (pAG) with two RNA deaminases: the human ADAR2 deaminase domain with the E488Q substitution20 (hADAR2dd) and rat APOBEC1 (ref. 19) (rAPOBEC1). Because hADAR2dd and rAPOBEC1 prefer editing on different RNA substrates, we incorporated both enzymes in MAPIT-seq to enhance the sensitivity and accuracy of target detection.

a, Experimental MAPIT-seq workflow. Created in BioRender (https://BioRender.com/9rvj2i1). PK, proteinase K. b, The number of A-to-G (top) and C-to-U (bottom) editing events per million bases within 800-nt windows flanking YTHDF2 PAR-CLIP peaks for MAPIT-seq performed with various combinations of IgG, anti-FLAG and secondary antibody in HeLa cells expressing FLAG or YTHDF2–FLAG. n = 2 biological replicates. c, Density plot depicting merged A-to-G and C-to-U editing events of IgG and anti-FLAG MAPIT-seq around random sites and YTHDF2-bound m6A sites in YTHDF2–FLAG and control HeLa cells. YTHDF2-bound m6A sites are defined as GLORI sites overlapping YTHDF2 PAR-CLIP peaks. d, Box-violin plots showing the log2(fold change) for RNAs with different subcellular localization preferences in MAPIT-seq of HeLa cells fixed with different formaldehyde (FA) concentrations versus RNA-seq of untreated cells. The RNA location data in HeLa cells were obtained from the LncAtlas database23. RNAs were classified into nucleus RNAs (log2(nucleus/cytosol) ratio > 1, n = 1,286), cytosol RNAs (log2(nucleus/cytosol) ratio < –1, n = 1,858) and Nuc & cyto (intermediate groups, n = 3,169). P values were determined by two-tailed Wilcoxon rank-sum test. Lower and upper hinges represent the first and third quartiles, the center line represents the median and whiskers represent ±1.5× the interquartile range. Nuc, nucleus; cyto, cytosol; vs, versus. e, Heatmap showing the pairwise correlations between transcriptomes derived from samples listed in the x axis and y axis. x and y axes represent the same list of samples arranged in the same order, including IgG (blue) and anti-G3BP1 (purple) MAPIT-seq in HeLa cells, which were fixed with 0.1%, 0.2% and 0.5% formaldehyde, alongside RNA-seq data from untreated cells. Color intensity indicates the Pearson’s correlation coefficient. f, Schematics (top) of pAG–deaminase constructs for MAPIT-seq including rAPOBEC1–pAG–hADAR2dd (RPH), rAPOBEC1–hADAR2dd–pAG (RHP) and single deaminase rAPOBEC1–pAG plus hADAR2dd–pAG (RP&HP). Bar plots (bottom) showing the number of A-to-G (top) and C-to-U (bottom) editing events per million bases within 800-nt windows flanking G3BP1 PAR-CLIP peaks for MAPIT-seq performed with different forms of pAG–deaminases in HEK293T cells. n = 2 biological replicates. Strep, Strep-Tactin binding peptide; His, histidine.
The MAPIT-seq workflow began with the fixation of cells using formaldehyde (FA), preserving dynamic and weak RBP–RNA interactions in their native contexts (Fig. 1a and Methods). Following cell permeabilization, samples were sequentially incubated with a primary antibody specific to the RBP of interest, and a secondary antibody to recruit the rAPOBEC1–pAG–hADAR2dd fusion protein to specific RBP-binding sites on RNA. After washing off the unbound fusion protein, the in situ RNA deamination began with Zn2+-containing buffer. The samples were then directly processed for RNA extraction, library preparation and sequencing. To identify RBP targets, we used an in-house analysis pipeline that includes a two-round unique mapping process, fine-tuning alignments, single-nucleotide variants (SNVs) calling and differential editing analysis (Extended Data Fig. 1a and Methods).
To initially assess the feasibility of MAPIT-seq, we generated HeLa cell lines expressing either FLAG or YTHDF2–FLAG, the latter being a well-characterized N6-methyladenosine (m6A) reader protein. We performed MAPIT-seq in these cells to quantify both A-to-G and C-to-U editing events near YTHDF2 PAR–CLIP peaks21. In YTHDF2–FLAG-expressing cells, a substantial increase of editing events was observed for the anti-FLAG MAPIT compared with the IgG control. By contrast, anti-FLAG-treated control cells exhibited editing levels comparable to those of the IgG control (Fig. 1b). Furthermore, the editing events were specifically enriched around GLORI-identified m6A sites22 that overlapped with PAR–CLIP peaks21, but not in random regions (Fig. 1c). Collectively, these results confirm that MAPIT-seq specifically and efficiently identifies YTHDF2-binding regions, with editing signals dependent on both the target RBP and specific antibody.
Next, we optimized several key parameters of MAPIT-seq in HeLa and HEK293T cells using endogenous G3BP1, an RBP with extensive published RNA-interactome data. We first screened a range of mild formaldehyde-fixation conditions and selected 0.5% formaldehyde for subsequent experiments, because it best preserved the transcriptome features of untreated samples23 (Fig. 1d,e, Extended Data Fig. 1b,c and Supplementary Table 1) while exhibiting markedly higher editing activity than TRIBE-ID24 (Extended Data Fig. 1d). Furthermore, among tested fusion protein configurations, rAPOBEC1–pAG–hADAR2dd was selected on the basis of its robust signals (Fig. 1f). The appropriate concentration range was determined to be 18–36 μg ml−1 for this construct (Extended Data Fig. 1e and Methods). In addition, the inclusion of the secondary antibody was essential for optimal performance (Fig. 1b and Extended Data Fig. 1f). With these optimizations, we detected >80% of all potential editing events across all genes using 10 million reads (Extended Data Fig. 1g). For low-abundance RNAs (bottom third, <8.2 transcripts per million (TPM), average 3.60 TPM), reliable results were achieved at 12 million reads (Extended Data Fig. 1g,h). Biological replicates demonstrated high reproducibility in both transcriptome (R = 0.98) and editing (R = 0.94) profiles, underscoring the method’s robustness for dual-omics profiling (Extended Data Fig. 2a).
Validating MAPIT-seq through comparison with established methods
We then checked editing signals at the gene level and found abundant A-to-G and C-to-U editing events on several known G3BP1 targets identified by PAR-CLIP25 in anti-G3BP1 samples, but not in IgG controls (Fig. 2a). To define G3BP1-interacting RNA targets transcriptome-wide, we applied a set of stringent criteria (Extended Data Fig. 1a, Supplementary Table 2 and Methods). In brief, we considered transcripts as RBP targets based on an editing fold enrichment > 2, MAPIT score > 0.5 and statistical significance. The editing fold enrichment and MAPIT score quantifies the ratio and the difference of the cumulative editing rate of all editing sites in each gene between anti-RBP–MAPIT and IgG–MAPIT samples. To minimize false negatives, we combined A-to-G and C-to-U edits to calculate the MAPIT score for each gene.

a, Genome browser tracks showing G3BP1–MAPIT and IgG–MAPIT editing signals on G3BP1 target genes, alongside PAR-CLIP signals in HEK293T cells. Shown are read counts (left y axis, gray shade) and editing rates (right y axis, colored bars) of MAPIT-seq. Blue bars, A-to-G editing; green bars, C-to-U editing; orange bars, 4SU. b, Venn diagram showing the overlap of G3BP1 targets identified by MAPIT-seq and PAR-CLIP in HEK293T cells. c, Box-violin plots depicting PAR-CLIP score distributions between the intersection of target genes detected by both methods (MAPIT ∩ PAR-CLIP, n = 4,769) and those unique to PAR-CLIP (PAR-CLIP only, n = 5,383). P values were determined by two-tailed Wilcoxon rank-sum test. Lower and upper hinges represent the first and third quartiles, the center line represents the median and whiskers represent ±1.5× the interquartile range. d, Pearson’s correlation of MAPIT score between two experiments using different G3BP1 antibodies. The correlation coefficient R and P value were determined by two-tailed Pearson’s correlation test. e, Venn diagrams showing the overlap of PTBP1, endogenous YTHDF2, SERBP1, RBFOX2 and PUM1 targets detected by CLIP and MAPIT-seq in corresponding cell lines. In b and e, P values were determined by two-tailed Fisher’s exact test. f, Bar plots showing C-to-U editing events around eCLIP peaks for MAPIT-seq (n = 2 biological replicates) and INSCRIBE (n = 3 technical replicates) on RBFOX2 in HEK293T cells. g, Motif enrichment analysis of MAPIT-seq using high-confidence edit clusters determined by FLARE. P values were determined by a two-tailed binomial test in the HOMER suite. h, Density plot showing distribution of the distance between the nearest UGCAUG motif and the high-confidence edit clusters from RBFOX2–MAPIT (red) and IgG–MAPIT (light red, dash line) in HEK293T cells. RBFOX2–STAMP (blue) and APOBEC–STAMP (light blue, dash line) edit clusters and randomly called regions (green, dash line) are included for comparison. i, Genome browser tracks displaying MAPIT-seq editing signals on validated RBFOX2 targets with corresponding eCLIP peaks. High-confidence MAPIT-seq edit clusters (orange rectangle), eCLIP peaks (gray rectangle) and UGCAUG motifs (red arrow) are marked. j, A pie chart illustrating the genomic distribution of high-confidence edit clusters (after IgG subtraction) for RBFOX2 MAPIT-seq in HEK293T cells.
Reassuringly, the targets identified showed significant overlap with G3BP1 PAR–CLIP results25 in HEK293T (Fig. 2b). Moreover, MAPIT-seq preferentially uncovers high-confidence targets (Fig. 2c). Here, the robustness of MAPIT-seq was demonstrated by the nearly identical editing patterns obtained from two distinct anti-G3BP1 antibodies (Fig. 2d and Supplementary Table 2). We also validated that the dual-editor approach substantially increased sensitivity, identifying approximately 20–30% more reported targets than did either single editor alone (Extended Data Fig. 2b,c and Supplementary Table 3). Consistently, the majority of G3BP1 targets measured by the dual editor were cross-validated by multiple independent approaches, including cross-linking and immunoprecipitation sequencing (CLIP-seq) and its variants, RIP-seq and HyperTRIBE24,25,26,27,28 (Extended Data Fig. 2c).
We then compared results from MAPIT-seq and CAP-seq29, a proximity-dependent RNA-labeling method. We found that MAPIT scores were well correlated with fold enrichment determined by G3BP1 CAP-seq in HEK293T cells (Extended Data Fig. 2d). We also performed G3BP1 MAPIT-seq in HeLa cells and observed a significant overlap between the targets identified by our method and those identified by ARTR-seq17 (Extended Data Fig. 2e and Supplementary Table 4).
To validate MAPIT-seq’s specificity, we applied it in G3BP1-knockdown HeLa cells. Editing events around ARTR-seq peaks17 decreased markedly upon G3BP1 knockdown (Extended Data Fig. 2f,g and Supplementary Table 5). Additionally, MAPIT-seq-identified G3BP1 targets were significantly downregulated in G3BP1-knockdown cells compared with their levels in control cells (Extended Data Fig. 2h), suggesting that G3BP1 positively regulates RNA stability in HeLa cells. Altogether, these results highlight the reliability of MAPIT-seq in capturing genuine RBP–RNA interactions.
MAPIT-seq uncovers recognition motifs across multiple RBPs
After benchmarking MAPIT-seq against established methods, we evaluated its general applicability across multiple canonical RBPs, including PTBP1 (ref. 30), SERBP1 (ref. 31), YTHDF2 (ref. 21), RBFOX2 (ref. 15) and PUM1 (refs. 32,33). Consistent with observations for G3BP1, targets identified by MAPIT-seq significantly overlapped with those detected by CLIP-based methods15,21,30,31,32, underscoring its broad applicability (Fig. 2e and Supplementary Tables 6–10). A recently developed method, in situ sensitive capture of RNA–protein interactions in biological environments (INSCRIBE)34, uses an APOBEC1-fused nanobody guided by a primary antibody to label RBP targets. When applied to RBFOX2, MAPIT-seq exhibited substantially higher signal-to-noise ratios (SNRs) of editing events around eCLIP peaks15 than did INSCRIBE34 (Fig. 2f). In addition, MAPIT-seq captured more validated RBFOX2 substrates (Extended Data Fig. 2i) and consistently mirrored the cellular transcriptome contexts (Extended Data Fig. 2j).
Next, we evaluated whether MAPIT-seq could effectively detect RBP binding motifs, focusing on PTBP1, YTHDF2, RBFOX2 and PUM1. We first utilized the flagging areas of RNA-editing enrichment (FLARE)35 pipeline to identify high-confidence ‘edit clusters’ marked by both C-to-U and A-to-G editing events (Methods). Using 43,951 PTBP1–MAPIT edit clusters, motif analysis by HOMER36 revealed significant enrichment of known CU-rich motifs (Fig. 2g; Supplementary Table 11 shows top ten motifs across various lengths). Transcripts containing more CU-rich sequences exhibited higher MAPIT scores (Extended Data Fig. 3a), suggesting that the MAPIT score could potentially quantify RBP–RNA interaction strength. Similarly, we found enrichment of the conserved GGAC motif for the endogenous YTHDF2 (ref. 21), the canonical UGCAUG motif for RBFOX2 (ref. 15) and the pumilio recognition element (PRE) motif UGUANAUA for PUM1 (ref. 32) (Fig. 2g and Supplementary Table 12). Notably, MAPIT-seq edit clusters consistently showed two- to sixfold enrichment of consensus sequences over permuted control clusters in the same genes (Extended Data Fig. 3b–e), comparable to the performance of STAMP or CLIP. These data clearly demonstrate that MAPIT-seq reliably identifies RBP-binding motifs.
We further selected RBFOX2 and PUM1, two RBPs with well-defined recognition sequences, for an in-depth evaluation of MAPIT-seq resolution. Edit clusters of RBFOX2–MAPIT converged into a distinct peak within a 200-nucleotide (nt) window flanking the canonical UGCAUG motif (Fig. 2h), demonstrating a sharper enrichment than that uncovered by STAMP19. Of note, a substantial portion of RBFOX2–MAPIT edit clusters localized closely around the UGCAUG motif and aligned with eCLIP peaks15 (Extended Data Fig. 3f–h). Furthermore, MAPIT-seq edit clusters accurately pinpointed eCLIP-identified RBFOX2-binding regions, centering around canonical motifs on known RBFOX2 targets such as SNX12, HMGA2 and KLHL20 (Fig. 2i). Similar results were observed for PUM1–MAPIT: edit clusters concentrated within 100 nt around either side of the core PRE motif UGUANA, and profiles properly resembled those from CLIP-seq32 (Extended Data Fig. 4a–e). In summary, although single-nucleotide resolution remains unattainable, MAPIT-seq reliably delineates sequence-specific binding regions of RBPs, with performance comparable to that of STAMP19,33 although still below CLIP-seq resolution.
Evaluating functional relevance of MAPIT-seq editing signals
Next, we characterized the genomic distribution of edit clusters from five MAPIT-seq libraries above to capture RBP-specific binding patterns (Supplementary Tables 13–17). As expected for canonical splicing factors RBFOX2 and PTBP1 (ref. 17), MAPIT-seq edit clusters were predominantly enriched in introns (83.5% for RBFOX2 and 88.4% for PTBP1) (Fig. 2j and Extended Data Fig. 5a). We further generated RNA maps by analyzing the distribution of editing signals around exons regulated upon knockdown of these RBPs. For RBFOX2, edits were markedly enriched in introns immediately downstream of exons inactivated upon RBFOX2 knockdown, compared with levels in constitutive exons (Extended Data Fig. 5b). For PTBP1, edits predominantly localized near exons activated upon its knockdown (Extended Data Fig. 5b). These patterns closely align with published CLIP data15,37, supporting their position-dependent regulatory models38,39.
For mRNA-associated RBPs (YTHDF2, PUM1 and SERBP1)17,31,32, MAPIT-seq edit clusters were mainly localized within the 3′ untranslated region (3′ UTR) and coding sequence (CDS) (Extended Data Fig. 5a). Consistent with YTHDF2’s role as an m6A reader, YTHDF2–MAPIT scores strongly correlated with m6A content determined by GLORI22 (Extended Data Fig. 5c). Furthermore, metagene analysis revealed prominent editing enrichment near stop codons, mirroring the reported m6A distribution on mRNAs17 (Extended Data Fig. 5d).
In summary, these analyses demonstrate that MAPIT-seq faithfully captures RBP-binding patterns aligned with known functions, underscoring its capability to reveal functionally relevant RBP–RNA interactions across diverse contexts.
Reevaluating PRC2–RNA interactions using MAPIT-seq
PRC2, a histone methyltransferase catalyzing the trimethylation of histone H3 on lysine 27 (H3K27me3), has been suggested to interact with X inactive specific transcript (XIST) and other long non-coding RNAs (lncRNAs)40, suggesting that these RNAs have a broad role in chromatin regulation. However, a recent study has presented contradictory evidence, challenging the notion of PRC2–RNA binding in cells30. Our MAPIT-seq approach offers an alternative method to address this controversy, because it detects RBP–RNA interactions in situ, minimizing the artifacts typically introduced during cell lysis. We performed MAPIT-seq on three core components41 of PRC2 (EED, EZH2 and SUZ12), along with CHTOP, a chromatin-associated protein with known roles in RNA processing and RNA export42, and PTBP1 (ref. 39). As expected, CHTOP and PTBP1 displayed strong proximity to numerous RNAs (Fig. 3a,b and Supplementary Tables 18–21). By contrast, MAPIT-seq identified only one RNA, XIST, consistently located in proximity to EED, EZH2 and SUZ12 (Fig. 3a,c). These findings suggest that PRC2 components might generally have no RNA-binding abilities in cells; however, certain RNAs, such as XIST, might still interact with PRC2 under specific conditions40,43, potentially serving important biological functions.

a, Scatter plots of editing fold enrichment and adjusted P value for MAPIT-seq on PRC2 components (EED, EZH2 and SUZ12), CHTOP and PTBP1 in HEK293T cells. Transcripts with editing fold enrichment > 2, MAPIT score > 0.5 and adjusted P < 0.05 are defined as a target in the proximity of these proteins. Targets and non-targets are indicated by blue and gray coloring, respectively. P values were determined using a one-tailed Wilcoxon signed-rank test by differential editing analysis (Methods), and adjusted by the Benjamini–Hochberg method. The only common target of PRC2 components, XIST, is marked; XIST adjusted P values were 0.0463 (EED), 1.72 × 10⁻³ (EZH2), 9.94 × 10⁻⁶ (SUZ12), 7.26 × 10⁻⁷ (CHTOP) and 2.65 × 10⁻¹² (PTBP1). b, Venn diagrams showing the overlap of targets determined by MAPIT-seq and CLAP-seq for CHTOP (top) and PTBP1 (bottom) in HEK293T cells. P values were determined by two-tailed Fisher’s exact test. c, Genome browser tracks showing MAPIT-seq editing signals for each PRC2 protein (EED, EZH2 and SUZ12), CHTOP and PTBP1 on the XIST lncRNA. The samples in each panel were pooled from two biological replicates. Shown are read counts (left y axis, gray shade) and editing rates (right y axis, colored bars). Blue bars, A-to-G editing; green bars, C-to-U editing.
Profiling the G3BP1–RNA interactome in embryonic mouse brain
Existing methods for profiling RBP–RNA interactomes are inadequate for studying rare tissues and patient samples, particularly because they fail to capture transcriptome data simultaneously. Here, we tested MAPIT-seq in mouse tissues by conducting G3BP1 MAPIT-seq on both fixed and fresh frozen sections of mouse embryonic day 10.5 (E10.5) embryos, with a slightly modified protocol (Extended Data Fig. 6a, Supplementary Table 22 and Methods). Editing events were enriched in fresh frozen but not fixed frozen tissues (Extended Data Fig. 6b). Additionally, transcriptome and editing profiles derived from fresh frozen samples showed strong correlation between two continuous sections from the same embryo (Extended Data Fig. 6c,d). In accordance, transcriptome profiles generated by MAPIT-seq closely matched RNA sequencing (RNA-seq) results from untreated embryo sections (Extended Data Fig. 6d). On the basis of these findings, we decided to use fresh frozen sections for subsequent experiments.
Although G3BP1 is ubiquitously expressed across the entire embryo44, we were surprised to find that G3BP1-bound RNAs were predominantly related to neuronal growth and organization in E10.5 embryo sections (Fig. 4a and Supplementary Table 23). These results align strongly with previous functional studies in G3bp1−/− mouse embryos44, which showed severe defects in the brain but not other organs. We then extended MAPIT-seq to fresh frozen sections of embryonic mouse brains at E12.5 and E16.5 (Supplementary Table 22). Transcriptome principal component analysis (PCA) of MAPIT-seq demonstrated high reproducibility and clearly separated two developmental stages (Extended Data Fig. 6d). Further gene expression analysis confirmed that the neurogenic-to-gliogenic transition occurred between E12.5 and E16.5 (ref. 45), as the expression of radial glia lineage genes (for example, Shh and Nes) gradually reduced while the expression of oligodendrocyte precursor cell lineage (for example, Oligo1 and Pdgfra), committed OPC lineage (for example, Neu4 and Mag) and glioblast lineage (for example, Tnc and Pla2g7) genes increased from E12.5 to E16.5 (Fig. 4b).

a, Top ten enriched GO terms of G3BP1 targets in mouse E10.5 embryos. b, Heatmap showing the expression of neuronal cell markers in MAPIT-seq of mouse E12.5 and E16.5 embryonic brain tissues. Colors represent z-score-normalized gene expression. OPC, oligodendrocyte precursor cell; COP, committed OPC. c, Bar plots showing the number of editing events per million bases in IgG–MAPIT and G3BP1–MAPIT for mouse E12.5 and E16.5 embryonic brain tissue sections. n = 2 technical replicates (continuous brain tissue sections). d, Genome browser tracks showing MAPIT-seq editing signals of G3BP1 on targets Mapt (top) and Cadm2 (bottom) in mouse embryonic brain tissue sections. e, Venn diagram showing overlap of G3BP1 targets captured in mouse E12.5 and E16.5 embryonic brain tissue sections. The P value was determined by two-tailed Fisher’s exact test. f, GO enrichment analysis of G3BP1 binding transcripts in mouse E12.5 and E16.5 embryonic brain tissue sections. Top neuro-related GO terms were selected to visualize. The dot size represents statistical significance (adjusted P value, −log10) and the color represents enrichment fold (log2). In a and f, P values were determined using the one-tailed hypergeometric test by the clusterProfiler package and adjusted by the Benjamini–Hochberg method.
We then quantified the number of editing events and found enrichment in G3BP1–MAPIT compared with IgG–MAPIT in mouse brain sections (Fig. 4c), albeit with a lower SNR than that in cultured cells (Extended Data Fig. 1e). This discrepancy was presumably due to flash-freezing effects on RBP–RNA interactions or inherent tissue heterogeneity. Moreover, G3BP1–MAPIT uncovered specific edits on previously identified targets microtubule-associated protein tau (Mapt)46 and Cadm2 (ref. 47) (Fig. 4d). Overall, we identified 395 and 925 G3BP1 targets in E12.5 and E16.5 mouse brain sections, with 82 shared genes (Fig. 4e and Supplementary Table 24). These targets also significantly enriched G3BP1-binding motifs determined by HITS–CLIP47 (Extended Data Fig. 6e), confirming that MAPIT-seq retains its specificity for detecting RBP binding in tissue sections.
A previous study on G3bp1−/− mice found that G3BP1 promoted expression of several selected genes at E12.5 but inhibited the expression of the same targets at E15.5 and E17.5 (ref. 44). This raises an intriguing hypothesis that G3BP1 could have distinct roles in regulating mRNA turnover at different developmental stages. Consistent with this hypothesis, targets with stronger G3BP1 binding showed increased RNA abundance at E12.5, whereas the opposite trend was observed at E16.5 (Extended Data Fig. 6f). Furthermore, targets from the E12.5 brain were enriched for terms such as axonogenesis and glial-cell differentiation, whereas those from the E16.5 brain were associated with terms such as dendrite development and neuron projection organization (Fig. 4f and Extended Data Fig. 6g). Notably, pathways related to synapse organization, structure and activity were enriched among G3BP1 targets at both developmental stages, aligning with the synaptic plasticity defects in G3bp1−/− mouse brains48 (Fig. 4f and Extended Data Fig. 6g). Together, these results demonstrate that MAPIT-seq can be effectively applied to tissue sections and uncover the temporal dynamics of RBP function in vivo.
Development and optimization of scMAPIT-seq
Co-profiling of RBP–RNA interactome and the transcriptome at single-cell resolution in non-genetically-engineered systems is highly valuable for dissecting cell-type- and cell-stage-specific RBP regulation under physiologically relevant conditions. However, such a method is still lacking. Here, we assessed whether MAPIT-seq can detect in situ RBP–RNA interactome at the single-cell level. First, G3BP1–MAPIT libraries, generated from 500 to 50,000 HeLa cells, all yielded reliable editing events (Extended Data Fig. 7a). We combined MAPIT-seq with fixed and recovered intact single-cell RNA (FRISCR)49 to perform plate-based scMAPIT-seq of G3BP1. A focused examination of known G3BP1 targets revealed clear editing signals, both in individual cells and in an aggregation of 16 cells (Fig. 5a), demonstrating MAPIT-seq’s ability to identify RBP targets in individual cells. Notably, more edited sites were observed in scMAPIT-seq than in bulk MAPIT-seq (Fig. 5a).

a, Genome browser tracks showing editing signals on ENO1 and GAPDH from bulk MAPIT-seq and FRISCR scMAPIT-seq of HeLa cells, alongside ARTR-seq signals. b, Genome browser tracks showing editing signals on ENO1, GAPDH and PKM from five representative and all aggregated single cells of HeLa from high-throughput scMAPIT-seq. In a and b, read counts (left y axis, gray shade) and editing rates (right y axis, colored bars) are shown. Blue bars, A-to-G editing; green bars, C-to-U editing. c, Density plot depicting editing events of all aggregated single cells from scMAPIT-seq around G3BP1 ARTR peaks and random regions in HeLa cells. d, Venn diagrams showing the overlap of G3BP1 targets detected by high-throughput scMAPIT-seq with those detected by bulk DSP-MAPIT-seq and ARTR-seq in HeLa cells. P values were determined by two-tailed Fisher’s exact test. e, UMAP visualization of single HeLa cells assigned to early and late cell-cycle phases (Methods). f, Venn diagram showing G3BP1 targets detected by high-throughput scMAPIT-seq in G1, S and G2/M phases. g, Histogram showing the distribution of Pearson’s correlation coefficients between gene expression and G3BP1 binding strength through the cell cycle. n = 141 Pos (positively correlated); n = 94 Neg (negatively correlated); n = 2,717 n.s. (not significantly correlated). The correlation coefficient R and P values were determined by two-tailed Pearson’s correlation test. h, Box plots showing log2fold change in G3BP1-knockdown versus control HeLa cells for non-targets and gene groups defined in g. NC, negative control. i, Top ten enriched GO terms for positively correlated genes in g. The bar represents the adjusted P value (–log10) determined by the one-tailed hypergeometric test and adjusted by the Benjamini–Hochberg method. j,k, Box plots comparing ARE (j) and m6A content (k) between non-G3BP1 targets and gene groups defined in g. In h, j and k, n = 12,456 for non-targets, n = 141 for Pos, n = 2,717 for n.s., and n = 94 for Neg. P values were determined by two-tailed Wilcoxon rank-sum test. In box plots, lower and upper hinges represent the first and third quartiles, the center line represents the median and whiskers represent ±1.5× the interquartile range.
A major hurdle in increasing throughput for scMAPIT-seq was the formaldehyde fixation process, which entails a complicated reverse cross-linking step, making it incompatible with most high-throughput single-cell RNA-seq (scRNA-seq) platforms. To overcome this issue, we tested two alternative fixatives compatible with scRNA-seq: methanol and dithiobis (succinimidyl propionate) (DSP). Gene expression profiles from methanol- and DSP-fixed G3BP1–MAPIT libraries showed high correlations with untreated and formaldehyde-fixed samples (Extended Data Fig. 7b). Notably, DSP–MAPIT yielded a substantially higher SNR around PAR–CLIP peaks25 than did both methanol–MAPIT and formaldehyde–MAPIT (Extended Data Fig. 7c). Consistently, G3BP1 targets identified by DSP-MAPIT were similar to those identified by formaldehyde-based MAPIT and PAR-CLIP25 (Extended Data Fig. 7d and Supplementary Table 25). Furthermore, plate-based scMAPIT-seq with DSP fixation successfully preserved transcriptome integrity in single cells (Extended Data Fig. 7e). Encouraged by these results, we chose DSP fixation for high-throughput scMAPIT-seq.
Next, we combined scMAPIT-seq with the 10x Genomics single-cell workflow (Methods). In total, we captured 3,400 G3BP1–MAPIT cells and 3,945 IgG–MAPIT cells after quality control (Supplementary Table 26). These two samples showed no differences in the number of genes and counts, and exhibited highly similar gene expression profiles, yet were completely separated by their editing profiles (Extended Data Fig. 7f,g). Dual editing events were enriched on G3BP1 targets in both the single-cell and the aggregated G3BP1–MAPIT dataset relative to IgG–MAPIT (Fig. 5b,c). Furthermore, aggregating signals across all individual cells revealed that scMAPIT-seq achieved sensitivity comparable to that of bulk MAPIT-seq and specifically marked down G3BP1-binding regions, showing strong concordance with ARTR-seq data17 (Fig. 5c,d and Supplementary Table 27). These data support high-throughput scMAPIT-seq’s ability to effectively uncover RBP targets and profile gene expression concurrently at the single-cell level.
Cell-cycle-phase-specific regulation of G3BP1
Leveraging the dual-omics capability of scMAPIT-seq, we next identified cell-cycle-phase-specific G3BP1 targets. Cells were annotated as being in the G1, S or G2/M phase on the basis of their transcriptomic profiles (Fig. 5e). Despite substantial variations in G3BP1 targets across these phases (Fig. 5f), we observed conserved roles for these targets in essential processes throughout the cell cycle, such as RNA splicing, localization and ribosome biogenesis (Extended Data Fig. 8a).
To further explore the temporal dynamics of G3BP1–RNA interactions, we focused on differential interactions across the cell cycle phases. Targets with differential interactions were categorized into four distinct clusters (Extended Data Fig. 8b). Notably, the majority of these differentially interacting G3BP1 targets (61.1%, 916/1,499) exhibited peak binding during the G2/M phase and were enriched in pathways closely related to mitosis (Extended Data Fig. 8b,c). In addition, targets with the highest G3BP1 binding strength in the G1 and S phases were enriched in pathways potentially associated with corresponding cell cycle progression (Extended Data Fig. 8c).
To understand how G3BP1 regulates its target expression during the cell cycle, we calculated Pearson’s correlation coefficients between G3BP1 binding strength and RNA abundance across different phases (Supplementary Table 28). This analysis identified 141 genes with significant positive correlations and 94 with significant negative correlations between G3BP1 binding strength and target expression throughout the cell cycle (Fig. 5g and Extended Data Fig. 8d). To validate the functional impact of G3BP1 binding, we examined the expression of these targets in G3BP1-knockdown HeLa cells. Positively correlated targets were significantly downregulated, while negatively correlated targets were significantly upregulated following G3BP1 knockdown (Fig. 5h and Extended Data Fig. 2d), supporting a regulatory role for G3BP1 in controlling the expression of these genes during cell cycle progression.
Positively correlated targets were primarily enriched in processes related to mitotic nuclear division and chromosome segregation, exemplified by genes such as CENPA, CENPK, SGO1 and SGO2 (Fig. 5i and Extended Data Fig. 8e–g). Notably, no specific Gene Ontology (GO) terms were associated with negatively correlated targets. To further investigate the mechanisms underlying G3BP1’s differential regulation, we analyzed previously reported regulatory elements, including AU-rich elements (ARE)50 and m6A modifications22. We found that G3BP1 targets exhibited significantly higher ARE content but lower m6A content than did non-targets (Fig. 5j,k). Additionally, positively correlated targets generally showed higher ARE and m6A levels among all G3BP1 targets (Fig. 5j,k). By contrast, there was no evidence linking ARE or m6A content with G3BP1-mediated negative regulation (Fig. 5j,k).
Together, these data demonstrate the value of scMAPIT-seq in uncovering cell-state-specific RBP–RNA interactions in mixed cell populations. Additionally, our results reveal G3BP1’s opposing regulatory roles in distinct target groups, along with insights into potential underlying mechanisms.
Long-read MAPIT-seq reveals isoform-specific G3BP1 binding
Current RBP interactome profiling methods have mostly failed to capture isoform-specific RBP interactions. To bridge this gap, we aimed to enhance the resolution of MAPIT-seq to identify RBP binding specific to individual transcript isoforms. We subjected both formaldehyde- and DSP-fixed MAPIT-seq samples to the PacBio HiFi sequencing platform. DSP-G3BP1-MAPIT samples yielded longer read lengths (Extended Data Fig. 9a) and higher editing signals compared to formaldehyde fixed samples (Extended Data Fig. 9b), leading us to proceed with DSP-MAPIT data for further analysis.
When comparing long-read MAPIT-seq with short-read MAPIT-seq, we observed strong concordance in target gene identification between the two datasets (Fig. 6a, Extended Data Fig. 9c and Supplementary Table 29). A closer examination revealed that G3BP1 exhibited isoform-specific binding across several genes, including YTHDF2, GDAP2 and ING3 (Fig. 6b and Extended Data Fig. 9d). Notably, these isoform-specific interactions were consistently confirmed through RIP–quantitative polymerase chain reaction (qPCR) validation (Fig. 6c).

a, Venn diagram showing the overlap of G3BP1 targets detected by long-read and short-read MAPIT-seq. The P value was determined by two-tailed Fisher’s exact test. b, Genome browser tracks showing long-read MAPIT-seq edits on two isoforms of YTHDF2. Shown above are G3BP1 CLIP-seq signals in HEK293T cells. The common intron regions between two isoforms were shortened for visualization convenience. Shown are counts (left y axis, gray shade) and editing rates (right y axis, colored bars). Blue bars, A-to-G editing; green bars, C-to-U editing. c, RIP–qPCR analysis of isoforms with high and low MAPIT scores. SERBP1 was served as a negative control (gray), of which two isoforms have similar MAPIT scores. Fold change of enrichment (y axis) for each isoform was normalized to IgG control. Shown are mean ± s.d., n = 3 biological replicates. P values were determined by two-tailed unpaired Student’s t-test. d, Cumulative plots showing the distribution of MAPIT scores for different isoform types (n = 1,285 intron retaining, n = 990 non-coding, n = 12,636 protein coding). e,f, Cumulative plots showing the distribution of MAPIT scores for isoforms grouped by overall length (e, n = 3,292 long, n = 3,407 short) and by mRNA component length (f, 5′ UTR: n = 3,153 long, n = 3,328 short; CDS: n = 2,890 long, n = 2,583 short; 3′ UTR: n = 2,912 long, n = 3,098 short). For each gene, isoforms were divided into two groups on the basis of whether their lengths (or component lengths) were longer or shorter than the average of all isoforms of that gene. P values in d–f were determined by two-tailed Wilcoxon rank-sum test.
To understand the mechanisms underlying G3BP1’s differential binding to isoforms of the same gene, we analyzed the molecular characteristics of isoforms with strong versus weak G3BP1 binding. We found that protein-coding isoforms exhibited significantly stronger G3BP1 binding compared with non-coding RNA and intron-retained isoforms (Fig. 6d). Among the protein-coding isoforms, we found a positive correlation between isoform length and G3BP1 binding (Fig. 6e), largely driven by differences in the 3′ UTR and CDS (Fig. 6f). These findings highlight MAPIT-seq’s ability to dissect isoform-specific RBP interactions, shedding light on the molecular features that drive G3BP1’s selective binding to particular isoforms.
Discussion
In this study, we introduce MAPIT-seq, a dual-omics profiling platform, and demonstrate its effectiveness in characterizing a broad range of RBPs in mammalian cells. Compared with existing methods, MAPIT-seq offers several advantages (Extended Data Fig. 10), making it a powerful tool for investigating post-transcriptional regulation across diverse biological contexts. Because MAPIT-seq performs deamination in fixed cells, it enables high temporal resolution, providing detailed insights into dynamic RBP–RNA interactions over time. Its adaptability for small tissue samples, such as mouse embryonic brains, makes it particularly valuable for investigating RBP regulation mechanisms in rare clinic samples. Additionally, its streamlined, time-efficient and scalable protocol supports parallel analysis of multiple RBPs across various samples, paving the way for large-scale investigations in clinical settings.
Investigating the RBP–RNA interactome at single-cell resolution has long been considered a difficult task17, let alone performing concurrent transcriptome profiling. LACE-seq provides single-cell RNA binding data, but it operates at low throughput and does not provide concurrent transcriptome information51. Although STAMP19 and agoTRIBE52 enable high-throughput identification of RBP–RNA interactions at single-cell resolution, both methods rely on ectopic expression of the deaminase–RBP fusion protein, restricting their applicability in primary cells or tissues and limiting temporal resolution. By contrast, MAPIT-seq overcomes these limitations, allowing high-throughput single-cell profiling of in situ RBP targets alongside the transcriptome. By integrating single-cell transcriptome information, scMAPIT-seq can precisely identify RBP-binding preferences across distinct cell subpopulations. This integration further enables the analysis of correlations between RBP binding and RNA abundance during dynamic processes, such as differentiation and stress responses. Future efforts should prioritize the application of scMAPIT-seq to tissue samples, facilitating comprehensive interrogation of cell-type-specific RBP functions during development and disease progression.
A recently published method, INSCRIBE, has also achieved in situ RNA editing in non-genetically-modified cells34. However, MAPIT-seq presents several potential advantages over INSCRIBE. First, it employs two distinct classes of deaminases, thereby minimizing potential substrate biases. Second, it consistently exhibits a higher SNR than does INSCRIBE when targeting the same RBP in the same cell type. Although the exact reasons remain unclear, possible contributing factors include the use of secondary antibodies in MAPIT-seq, potentially increasing local enzyme concentrations, and stringent washing conditions (300 mM salt) that minimize non-specific interactions. Third, MAPIT-seq is compatible with a broad range of commercially available antibodies, whereas INSCRIBE requires customized nanobodies specifically engineered for each antibody34. Fourth, MAPIT-seq features a shorter in vitro deamination step (3 h at 30 °C) than does INSCRIBE (16 h at 37 °C)34, potentially better preserving RNA integrity. Finally, MAPIT-seq successfully enables single-cell resolution and simultaneous co-profiling of the transcriptome and RBP–RNA interactome, which have not yet been achieved by INSCRIBE34.
Collectively, these strengths establish MAPIT-seq as a versatile and robust dual-omics tool capable of integrating post-transcriptional regulation with gene expression at single-cell resolution.
Methods
Ethics statement
All animal experiments were approved by Institutional Animal Care and Use Committee (IACUC) of Peking University, which are accredited by the AAALAC (Association for Assessment and Accreditation of Laboratory Animal Care International).
Plasmid construction
For ectopic expression of FLAG–YTHDF2, the complementary DNA encoding human full-length YTHDF2 was cloned into the piggyBac vector with an amino-terminal triple FLAG-tag (3×FLAG). An empty vector with 3×FLAG was also constructed as a control. For recombinant deaminase expression, genes encoding rAPOBEC1 and eukaryotic codon-optimized protein A/G (pAG) were synthesized by Tsingke. The cDNA for the hADAR2 deaminase domain was cloned and mutated (E488Q) through PCR-based site-directed mutagenesis. These fragments, XTEN linkers, and a 6×His tag were assembled into the pFastbac backbone with an N-terminal twin-strep tag for purification, using the ClonExpress Ultra One Step Cloning Kit (C115, Vazyme). Four constructs were generated by combining pAG with two deaminases: pFastBac-rAPOBEC1-pAG-hADAR2dd, pFastBac-rAPOBEC1-hADAR2dd-pAG, pFastBac-rAPOBEC1-pAG, and pFastBac-hADAR2dd-pAG (sequences in Supplementary Table 30).
Cell culture
HeLa (CCL-2, ATCC) and HEK293T (CRL-3216, ATCC) cells were cultured at 37 °C with 5% CO2 in high-glucose Dulbecco’s modified Eagle’s medium (DMEM, SH30243.01, Hyclone) supplemented with 10% (vol/vol) FBS (900-108, GeminiBio) and 1% (vol/vol) penicillin–streptomycin (15140163, Gibco). The insect cells Spodoptera frugiperda (Sf21, B821-01, Invitrogen) and Trichoplusia ni (Hi5, B855-02, Invitrogen) were cultured in a non-humidified shaker at 27 °C, 110 r.p.m. in SIM-SF (MSF1, Sino Biological) and SIM-HF medium (MHF1, Sino Biological).
Cell transfection
Stable HeLa cell lines expressing 3×FLAG–YTHDF2 or 3×FLAG were generated by transfecting 1 × 10⁵ cells at 60–80% confluency with 0.2 µg pBase and 0.8 µg piggyBac plasmids using jetPRIME transfection reagent (468 PT-114-75, Polyplus-transfection) and culturing for 2 days, followed by 130 µg ml−1 hygromycin B (cat. no. 10843555001, Roche) selection for one week. For G3BP1 knockdown, 2 × 10⁵ HeLa cells were plated in a well of 6-well plate and cultured for 12 h to reach 50% confluency before transfection. Small interfering RNAs (siRNAs) were synthesized by GenePharma. Cells were transfected with 50 nM control (5′-UUCUCCGAACGUGUCACGUTT-3′), which has no homology with mammalian genes, or G3BP1-specific (5′-UCAACAUGGCGAAUCUUGGTG-3′) siRNAs using jetPRIME. Three days after transfection, cells were collected for western blotting and MAPIT-seq experiments. To knock down RBFOX2 and PTBP1, 1 x 10⁵ HEK293T cells were plated in a well of 12-well plate and transfected with siRNAs from Hippobio. The sequence for RBFOX2 siRNA is 5′-CGGGUUCGUAACUUUCGAGAAdTdT-3′. The sequence for PTBP1 siRNA is 5′-GCGUGAAGAUCCUGUUCAAUAdTdT-3′. Cells were collected for RNA-seq 2 days after transfection.
Expression and purification of deaminase–pAG fusion proteins
Deaminase–pAG fusion proteins rAPOBEC1–pAG–hADAR2dd, rAPOBEC1–hADAR2dd-pAG, rAPOBEC1–pAG and hADAR2dd–pAG were expressed and purified using a baculovirus expression system. The recombinant pFastBac plasmids were transformed into DH10Bac (Biomed, BC112) to generate bacmids. Bacmid DNA was transfected into Sf21 cells using X-tremeGENE HP DNA Transfection Reagent (06366236001, Roche) and incubated for 4 days. Low-titer recombinant baculoviruses were collected and amplified in Sf21 cells to produce high-titer viruses. Next, the baculoviruses were used to infect Hi5 cells at a 1:200 ratio and cultured for 48–60 h. Cells were lysed in lysis buffer containing 50 mM Tris-HCl, pH 8.0 and 200 mM NaCl. Lysates were sonicated at 4 °C with SCIENTZ sonicator set to a 7 s on and 5 s off cycle at 300 W for 20 min. After sonication, the lysates were centrifuged at 16,000 g, 4 °C, for 40 min. The deaminase–pAG fusion proteins were then purified using Strep-Tactin beads (SA053, Smart Lifesciences). In brief, the supernatant was incubated with Strep-Tactin beads at 4 °C for 1 h. After washing the beads with 30 volumes of lysis buffer, the deaminase–pAG fusion proteins were eluted with lysis buffer containing 5 mM desthiobiotin. Further purification was performed by a Superdex 200 Increase column (GE Healthcare). Deaminase–pAG fusion proteins were eluted in a buffer containing 25 mM HEPES, pH 7.5, and 150 mM NaCl and then supplemented with 5% glycerol. The aliquots of deaminase–pAG fusion proteins were snap-frozen in liquid nitrogen and stored at –80 °C.
Antibodies
Anti-G3BP1 (1:1,000, 13057-2-AP, Proteintech), anti-GAPDH (1:1,000, ET1601-4, Huabio) antibodies and donkey anti-rabbit IgG secondary antibody (1:10,000, 926–32213, LI-COR) were used for western blot. For MAPIT-seq, the following primary antibodies were used: Anti-Flag (1:100, F1804, Sigma), mouse IgG (1:40, sc-2025, Santa Cruz Biotech), rabbit IgG (1:100, 2729S, CST), anti-G3BP1 (1:100, ab56574, Abcam), anti-G3BP1 (1:100, 13057-2-AP, Proteintech), anti-PTBP1 (1:100, MABE986, Millipore), anti-YTHDF2 (1:50, 24744-1-AP, Proteintech), anti-SERBP1 (1:100, A303-938A, BETHYL), anti-RBFOX2 (1:100, A300-864A, BETHYL), anti-PUM1 (1:40, ab92545, Abcam), anti-EED (1:80, 85322, CST), anti-EZH2 (1:80, 5246, CST), anti-SUZ12 (1:80, 3737, CST) and anti-CHTOP (1:80, Invitrogen, PA544307). The following secondary antibodies were used: rabbit anti-mouse (1:100, ab46450, Abcam) and guinea pig anti-rabbit (1:100, ABIN101961, Antibodies Online). For RIP–qPCR, mouse IgG (1:20, sc-2025, Santa Cruz Biotech) and anti-G3BP1 (1:50, ab56574, Abcam) were used.
Western blotting analysis
For western blot, 5 × 10⁵ HeLa cells transfected with siRNA were collected, and G3BP1 and GAPDH were detected using respective antibodies at 4 °C overnight, with secondary antibodies at room temperature (RT) for 1 h. The membranes were imaged using Odyssey (LI-COR), and relative protein levels were quantified using ImageJ (v1.49).
MAPIT-seq
A full step-by-step protocol for MAPIT-seq has been deposited in the protocols.io repository53.
For cell fixation and ConA-binding, 5×10²–5×10⁵ HeLa or HEK293T cells were trypsinized and washed to create single-cell suspensions. Cells were fixed with 0.5% formaldehyde at RT for 5 min and then quenched with 125 mM glycine at RT for 5 min. Cells underwent three rounds of DPBS washes before cells being centrifuged at 450g and 4 °C for 5 min. Cells were then incubated with 10 μl concanavalin A-coated beads (ConA beads, BP531, Bangs Laboratories) on a roller at RT for 15 min. Samples were then placed on a magnetic stand to remove the supernatant and washed twice. Afterwards, cells were transferred to a 0.2-ml tube prewashed with PBS supplemented with 1% BSA to minimize cell loss.
For cell permeabilization and incubation with antibodies and deaminases, cell-coupled ConA beads were resuspended in 50 μl antibody buffer 1 (1 mM PMSF, 1×protease inhibitor cocktail, 1 U μl−1 RiboLock RNase Inhibitor (EO0382, ThermoFisher), 0.01% Digitonin, 1 mM DTT, 2 mM EDTA and 0.1% BSA in DPBS) pre-mixed with primary antibodies (1:100) and incubated with rotation at 4 °C for 3 h. The beads were washed once with DPBS on a roller at 4 °C for 5 min and incubated with secondary antibody at a 1:100 ratio in 50 μl antibody buffer 2 (1 mM PMSF, 1× protease inhibitor cocktail, 1 U μl−1 RiboLock RNase Inhibitor, 0.01% Digitonin, and 1 mM DTT in DPBS) at 4 °C for 1 h. After a 5-min wash in DPBS, 1 μg pAG–deaminases in 50 μl incubation buffer (20 mM HEPES, 300 mM NaCl, 1 mM PMSF, 1×protease inhibitor cocktail, 1 U/μl RiboLock RNase Inhibitor, 0.01% Digitonin and 1 mM DTT) was added and incubated at 4 °C for 1 h.
For the deamination reaction, the unbound pAG–deaminases were removed by washing beads twice with 100 μl wash buffer (20 mM HEPES, 300 mM NaCl and 0.005% digitonin) on a roller at 4 °C for 5 min each time. The thoroughly washed beads were then resuspended in deamination buffer (15 mM HEPES pH 7.9, 60 mM KCl, 15 mM NaCl, 5% glycerol, 0.5 mM DTT and 0.1 μM ZnCl2, 1 × protease inhibitor cocktail, 1 U μl−1 RiboLock RNase Inhibitor) and incubated at 30 °C for 3 h.
After deamination, the buffer was removed using a magnetic stand for RNA extraction. Samples were resuspended in Proteinase K digestion buffer (10 mM Tris-HCl pH 8.0, 100 mM NaCl, 0.5% SDS, and 1 mM EDTA) with 0.2 mg/ml Proteinase K (AM2546, Invitrogen). The mixture was digested at 56 °C for 1 h. For large samples (> 100,000 cells), total RNA was extracted following the standard TRIzol protocol (Invitrogen). For small samples (≤ 50,000 cells), mRNA was isolated with Oligo d(T)25 Magnetic Beads (S1419S, NEB) and then subjected to Smart-seq2 protocol54, as detailed in plate-based scMAPIT-seq.
Then, 500 ng RNA was used to generate RNA-seq libraries using the VAHTS Universal V6 RNA-seq Library Prep Kit for Illumina (NR604, Vazyme). cDNA libraries were assessed using Qubit and Agilent 2100 Bioanalyzer and then subjected to the Illumina NovaSeq 6000 or DNBSEQ-T7 platform for 150-nt paired-end sequencing (Novogene or GenePlus). This protocol utilizes random hexamer primers for reverse transcription to generate RNA-seq libraries.
MAPIT-seq of tissue sections, single-cell MAPIT-seq and long-read MAPIT-seq were performed with minor modifications. Tissue sections were fixed with 0.2% formaldehyde, and MAPIT-seq was conducted on the slides. For scMAPIT-seq, cells were fixed with 1 mM DSP, collected by centrifugation at 650g and subjected to the Smart-seq2 protocol54 or 10x Genomics Chromium platform after deamination. Long-read MAPIT-seq adopted Kinnex full-length RNA kit (103-072-000, Pacbio) and Pacbio Revio instrument for circular consensus sequencing to generate HiFi full-length reads. 10x Genomics v3.1 and long-read RNA-seq libraries were constructed and sequenced by Annoroad Gene Technology. Details for these MAPIT-seq variants are available in the Supplementary Methods.
Mice and preparation of tissue slides
Animals were bred and maintained under specific-pathogen-free (SPF) conditions at the institutional animal facility at Peking University. They were kept on a 12-h dark–light cycle under a temperature of 20–25 °C and humidity of 30–70%, and were provided with food. C57BL/6J mice were allowed to mate overnight, with embryonic day 0.5 (E0.5) designated by the presence of vaginal plugs the following morning. Pregnant mice were euthanized by cervical dislocation, and embryos at indicated stages were dissected and embedded in optimal cutting temperature compounds (OCT; 4583, Sakura). Intact E10.5 embryos were processed as fixed frozen (4% PFA fixation, sucrose dehydration) or fresh frozen (snap-frozen in liquid nitrogen). E10.5 embryos were sagittally sectioned. Tissues of E12.5 and E16.5 were processed as fresh frozen and coronally sectioned. All tissues were sectioned at 10-μm thickness using a Cryostat (Leica), mounted on poly-l-lysine-coated glass slides (188105 W, Citotest), and stored at –80 °C.
RIP–qPCR analysis
Ultraviolet (UV) cross-linking RIP was performed as described in our previous study55. Specifically, 1×10⁶ HEK293T cells were plated in a 10-cm dish and grown for 3 days. Protein G Dynabeads (cat. no. 10003, Invitrogen) were incubated with mouse IgG or anti-G3BP1 antibody in dilution buffer (50 mM Tris-Cl, pH 7.4, 150 mM NaCl, 1 mM EDTA, 0.1% Triton X-100) at 4 °C overnight. Cells were cross-linked with 254 nm UV (400 mJ cm−2) in a CL-1000 UV Crosslinker (UVP), lysed with lysis buffer (50 mM Tris-HCl, pH 7.4, 150 mM NaCl, 1% TRITON X-100, 5% glycerol, 1 mM DTT, 1 mM PMSF, 1 × protease inhibitor cocktail, 0.4 U μl−1 RiboLock RNase Inhibitor) at 4 °C for 1 h, and centrifuged at 4 °C, 12,000g for 20 min. The supernatant was incubated with the antibody-bound beads at 4 °C for 6 h. Beads were washed five times with 0.5 ml IP200 buffer (20 mM Tris-Cl, pH 7.4, 200 mM NaCl, 1 mM EDTA, 0.3% Triton X-100, 5% glycerol) at 4 °C for 5 min each time, and digested with proteinase K at 55 °C for 1 h before RNA extraction. RNA was reverse transcribed using the HiScript III Q RT SuperMix (Vazyme, R323). qPCR was performed with the SYBR Green Master Mix (Vazyme, Q141) on ABI StepOnePlus Real-Time PCR System (Applied Biosystems). The relative fold enrichment of G3BP1 targets cells was calculated as 2(Ct(input) − Ct(IP)), and normalized to IgG control. qPCR primers were synthesized by Tsingke; sequences are provided in Supplementary Table 31.
MAPIT-seq data processing
For bulk MAPIT-seq, 150-bp paired-end reads were quality-checked by FastQC (v0.11.9), trimmed by Trim Galore (v0.6.7), and filtered to remove abundant RNA types using BWA-MEM56 (v0.7.17). Reads were aligned to the human (hg38) or mouse (mm10) genome using a two-round mapping strategy with HISAT2 (ref. 57) (v2.2.1) and BWA-MEM56, guided by GENCODE annotations. PCR duplicates were removed, exon-junction reads were split, and base quality was recalibrated using GATK58 (v4.5.0.0). RNA editing variants were called using GATK HaplotypeCaller59, excluding known SNPs, and gene expression was quantified by featureCounts60 (v2.0.1) and normalized to TPM. The bulk MAPIT-seq data processing adopted a protocol similar to HyperTRIBE20, TRIBE-ID24 and STAMP19,33.
For 10x Genomics scMAPIT-seq, reads were aligned to the human genome (hg38) using STARsolo61 (v2.7.11b). Low-quality cells were filtered using Scanpy62 (v1.10.1) and Seurat63 (v5.1.0). UMAP was used for dimensionality reduction. Cell cycle phases were assigned through Seurat’s CellCycleScoring, and each phase was subdivided into early and late stages on the basis of UMAP distribution. For editing analysis, reads from selected cells were extracted by pysam (v0.22.1), deduplicated by UMI-tools64 (v1.1.4), and split into per-cell BAMs BAMtools (v2.5.2) using the ‘CB’ tag. In each cell, RNA editing sites were identified by REDItools2 (ref. 65).
For long-read MAPIT-seq, full-length non-chimeric (FLNC) reads were generated using IsoSeq refine (v4.0.0) to remove polyA tails and concatemers. FLNC BAMs were converted to FASTQ using bedtools (v2.31.1), and aligned to the human genome (hg38) with Minimap2 (ref. 66) (v2.28) using splice-aware parameters and GENCODE v40 annotation. IsoQuant67 (v3.4.1) was used to assign reads to isoforms on the basis of exon–exon/intron structures, filter ambiguous mappings and quantify expression. Uniquely assigned reads were annotated with transcript and gene IDs in bam files using pysam (v0.22.1), and split into transcript-level BAMs with BAMtools (v2.5.2). RNA editing was detected for each isoform using REDItools2 (ref. 65). Details for bulk, single-cell and long-read MAPIT-seq can be found in the Supplementary Methods.
Differential editing analysis and target identification
A-to-G and C-to-U editing sites were annotated using bedtools68 (v2.31.1) with GENCODE (Human v40 or Mouse vM25) for the gene annotation and UCSC RepeatMasker69 for the repetitive element annotation, with low-coverage sites (<10 reads) excluded. To quantify editing enrichment for a MAPIT-seq sample, we describe a fraction formula:
$$begin{array}{l}{{rm{Number}};{rm{of}};{rm{editing}};{rm{events}};{rm{per}}; {rm{million}}; {rm{bases}}}\=displaystylefrac{{{rm{Total}};{rm{Editing}};{rm{Events}}}}{{{rm{Total}};{rm{Mapped}};{rm{Bases}}}}times {10}^{6}end{array}$$
Here, ‘total editing events’ represents the number of all C-to-U or A-to-G events detected across the entire sample, and ‘total mapped bases’ is calculated by the SAMtools stat command70 (v1.20), indicating sequencing depth. This metric quantifies the average number of edits normalized to per aligned million bases in the sample, which serves as a coarse-grained measure to compare overall deamination activity between experimental and control groups. The SNR was defined as:
$${{rm{SNR}}}=frac{{{rm{Number}}; {rm{of}}; {rm{editing}}; {rm{events}}; {rm{per}}; {rm{million}}; {rm{bases}}}({{rm{Anti}}}{{mbox{-}}}{rm{{RBP}}})}{{{rm{Number}}; {rm{of}}; {rm{editing}}; {rm{events}}; {rm{per}}; {rm{million}}; {rm{bases}}}({{rm{IgG}}})}$$
At the individual base level, the editing rate is calculated as:
$${{{rm{Editing}}; {rm{Rate}}}}_{i}=frac{{{rm{Depth}}; {rm{of}}}C{{mbox{-}}}{to}{{mbox{-}}}U{{rm{or}}}A{{mbox{-}}}{to}{{mbox{-}}}G{at}{{;{rm{Base}}}}_{i}}{{{rm{Total}}; {rm{depth}}; {rm{at}}}{{;{rm{Base}}}}_{i}}$$
This represents the fraction of reads showing an edit at a specific genomic position i, analogous to allele frequency in variant calling. To evaluate the editing enrichment of each transcript, we defined an editing index as the cumulative editing rates across all bases in a transcript or a given genome window:
$${{rm{Editing}};{rm{Index}}}=mathop{sum }limits_{i=1}^{N}{{{rm{Editing}};{rm{Rate}}}}_{i}$$
where N is the number of mapped bases in a transcript or a given genome window. The MAPIT score was defined as the difference between editing indices of a given transcript in anti-RBP and IgG samples:
$${{rm{MAPIT}}; {rm{score}}}={{rm{Editing}}; {rm{Index}}}left({{rm{RBP}}}right)-{{rm{Editing}}; {rm{Index}}}({{rm{IgG}}})$$
To identify RBP targets, a Wilcoxon signed-rank test was performed on the ‘editing index’ within 50-nt continuous and non-overlapping windows of transcripts between RBP–MAPIT and IgG–MAPIT samples by package scipy (v1.13.0), and the P values were adjusted by Benjamini–Hochberg correction. As a universal default in bulk MAPIT-seq, transcripts with editing fold enrichment > 2, MAPIT score > 0.5, P value < 0.001, and adjusted P < 0.05 were identified as RBP targets. For frozen embryonic sections, a lower threshold (editing fold enrichment > 1.5, MAPIT score > 0.4, P value < 0.05) was used.
In Figs. 1b,f and 2f and Extended Data Fig. 1b, we applied the same ‘number of editing events per million bases’ formula. Both ‘total editing events’ and ‘total mapped bases’ were specifically constrained to RBP binding peaks identified by CLIP, allowing a region-specific assessment of editing enrichment.
Details for CLIP, RIP and CAP-seq data analysis are available in the Supplementary Methods.
Identification of edit clusters and RBP-binding motifs
C-to-U and A-to-G editing sites were identified using the SAILOR workflow19 (https://github.com/YeoLab/FLARE/tree/master/workflow_sailor). High-confidence sites (confidence score > 0.5 (C-to-U) or > 0.9 (A-to-G); editing fraction < 0.7) were used as input to FLARE35 (https://github.com/YeoLab/FLARE) to define edit clusters. Clusters detected in both replicates were intersected, and MAPIT high-confidence clusters were defined as overlapping C-to-U and A-to-G clusters within 100 nt. These clusters were extended to 300 nt by bedtools (v2.31.1) and subjected to de novo motif discovery using HOMER36 (v4.11). For more details, see the Supplementary Methods.
Splicing map analysis
For si-PTBP1 and si-RBFOX2 RNA-seq, trimmed reads were aligned to the human genome (hg38) using STAR (v2.7.11b) with ‘–twopassMode Basic’. Differential alternative splicing (AS) events were identified from the resulting BAM files using rMATS (v4.2.0), with included and excluded exons defined as those with |IncLevelDifference | > 0.1 and FDR < 0.1. CLIP-derived RBP splicing maps were generated using RBP-Maps71 in default ‘Plotting peaks’ mode (–peak). Genomic coordinates of native cassette exons and constitutive exons were obtained from the RBP-Maps GitHub repository. For MAPIT-seq data, splicing-map-like plots were generated by computing the difference in editing rates between RBP–MAPIT and IgG–MAPIT and mapping them to genomic coordinates of included and excluded exons, native cassette exons and constitutive exons using the ‘computeMatrix’ and ‘plotProfile’ functions in deepTools72 (v3.5.6).
Metagene analysis
High-confidence editing sites were identified by modeling A-to-G or C-to-U edits as a Poisson process. Sites were filtered (baseline P < 0.01) on the basis of the proportion of YTHDF2–MAPIT edits significantly exceeding the IgG–MAPIT background. Meta-distributions of editing events were plotted using the R package Guitar (v2.18.0).
Clustering analysis of G3BP1 scMAPIT-seq signals
To track the changing pattern of G3BP1 binding during cell cycle progression, MAPIT scores were used to represent binding strength. Only genes in the top 50% of s.d. of MAPIT scores were considered, and MAPIT scores were scaled by z-score before clustering. Fuzzy c-means clustering was calculated by the ‘mfuzz’ function from the Mfuzz73 package (v.2.62.0) with Euclidean distance as the clustering option.
Differentially expressed genes and function enrichment analysis
Differentially expressed genes (DEGs) were identified by DESeq2 (ref. 74) (v1.36.0) in R software (v4.2.0). Gene ENSEMBL IDs were converted to Entrz IDs with package org.Hs.eg.db (v3.15.0) or org.Mm.eg.db (v3.15.0). GO enrichment analysis was performed using functions ‘enrichGO’ with package clusterProfiler75 (v4.7.1.3). GO terms with adjusted P value < 0.05 were defined as significantly enriched.
Data visualization and statistical analysis
Package Seaborn (v0.13.2) and Matplotlib (v3.9.0) in python (v3.10.14) were used for generation of heatmaps, line plots, scatter plots, box-violin plots, Venn diagrams, genome browser tracks, density plots and box plots. For IGV-like genome browser tracks, the coverage of all bases (left y axis) and the A-to-G and C-to-U editing rates (right y axis) were extracted for visualization. PCA was conducted by package sklearn (v1.5.1). Unless otherwise specified, statistical comparisons between groups were conducted using two-tailed Wilcoxon rank-sum tests, and enrichment significance between RBP target sets was assessed using two-tailed Fisher’s exact test by scipy (v1.13.0). P values and fold enrichments are shown with each Venn diagram.
Reporting summary
Further information on research design is available in the Nature Portfolio Reporting Summary linked to this article.
Data availability
Sequencing data are deposited in the Gene Expression Omnibus under accession code GSE278418. Reads were mapped to the reference genome (hg38 and mm10 for human and mouse samples) downloaded from GENCODE (https://www.gencodegenes.org/human/release_40.html; https://www.gencodegenes.org/mouse/release_M25.html). Previously published data are available under accession numbers GSE168943 (G3BP1 CLIP-seq)26, PRJNA533136 (G3BP1 PAR-CLIP)25, GSE49339 (YTHDF2 PAR-CLIP)21, GSE226161 (G3BP1 ARTR-seq)17, GSE207005 (G3BP1 RIP-seq, HyperTRIBE and TRIBE-ID)24, GSE230717 (G3BP1 eCLIP)27, GSE171008 (G3BP1 iCLIP)28, GSE223295 (G3BP1 CAP-seq)29, GSE156015 (SERBP1 eCLIP)31, GSE77633 (RBFOX2 iCLIP)15, GSE77629 (RBFOX2 eCLIP)15, GSE240014 (RBFOX2 INSCRIBE)34, GSE155649 (RBFOX2 STAMP)19, GSE110519 (PUM1 CLIP)32, GSE216334 (PUM1 STAMP)33, GSE210563 (GLORI in HeLa)22, GSE230846 (PTBP1 iCLIP)37 and GSE253477 (CHTOP and PTBP1 CLAP-seq)30. Source data are provided with this paper.
Code availability
Codes for processing MAPIT-seq data are available in the following GitHub repository: https://github.com/WangLabPKU/MAPIT-seq.
References
-
Gerstberger, S., Hafner, M. & Tuschl, T. A census of human RNA-binding proteins. Nat. Rev. Genet. 15, 829–845 (2014).
-
Hentze, M. W., Castello, A., Schwarzl, T. & Preiss, T. A brave new world of RNA-binding proteins. Nat. Rev. Mol. Cell Biol. 19, 327–341 (2018).
-
Cookson, M. R. Aging—RNA in development and disease. Wiley Interdiscip. Rev. RNA 3, 133–143 (2012).
-
Fu, M. & Blackshear, P. J. RNA-binding proteins in immune regulation: a focus on CCCH zinc finger proteins. Nat. Rev. Immunol. 17, 130–143 (2017).
-
Darnell, R. B. RNA protein interaction in neurons. Annu. Rev. Neurosci. 36, 243–270 (2013).
-
Hao, J., Duan, F. F. & Wang, Y. MicroRNAs and RNA binding protein regulators of microRNAs in the control of pluripotency and reprogramming. Curr. Opin. Genet. Dev. 46, 95–103 (2017).
-
Ye, J. & Blelloch, R. Regulation of pluripotency by RNA binding proteins. Cell Stem Cell 15, 271–280 (2014).
-
Gebauer, F., Schwarzl, T., Valcarcel, J. & Hentze, M. W. RNA-binding proteins in human genetic disease. Nat. Rev. Genet. 22, 185–198 (2021).
-
Dou, N., Chen, J., Yu, S., Gao, Y. & Li, Y. G3BP1 contributes to tumor metastasis via upregulation of Slug expression in hepatocellular carcinoma. Am. J. Cancer Res. 6, 2641–2650 (2016).
-
Wang, Y. et al. G3BP1 promotes tumor progression and metastasis through IL-6/G3BP1/STAT3 signaling axis in renal cell carcinomas. Cell Death Dis. 9, 501 (2018).
-
Gagliardi, M. & Matarazzo, M. R. RIP: RNA immunoprecipitation. Methods Mol. Biol. 1480, 73–86 (2016).
-
Ule, J. et al. CLIP identifies Nova-regulated RNA networks in the brain. Science 302, 1212–1215 (2003).
-
Licatalosi, D. D. et al. HITS-CLIP yields genome-wide insights into brain alternative RNA processing. Nature 456, 464–469 (2008).
-
Konig, J. et al. iCLIP reveals the function of hnRNP particles in splicing at individual nucleotide resolution. Nat. Struct. Mol. Biol. 17, 909–915 (2010).
-
Van Nostrand, E. L. et al. Robust transcriptome-wide discovery of RNA-binding protein binding sites with enhanced CLIP (eCLIP). Nat. Methods 13, 508–514 (2016).
-
Khyzha, N., Henikoff, S. & Ahmad, K. Profiling RNA at chromatin targets in situ by antibody-targeted tagmentation. Nat. Methods 19, 1383–1392 (2022).
-
Xiao, Y. et al. Profiling of RNA-binding protein binding sites by in situ reverse transcription-based sequencing. Nat. Methods 21, 247–258 (2024).
-
McMahon, A. C. et al. TRIBE: hijacking an RNA-editing enzyme to identify cell-specific targets of RNA-binding proteins. Cell 165, 742–753 (2016).
-
Brannan, K. W. et al. Robust single-cell discovery of RNA targets of RNA-binding proteins and ribosomes. Nat. Methods 18, 507–519 (2021).
-
Xu, W., Rahman, R. & Rosbash, M. Mechanistic implications of enhanced editing by a HyperTRIBE RNA-binding protein. RNA 24, 173–182 (2018).
-
Wang, X. et al. N6-methyladenosine-dependent regulation of messenger RNA stability. Nature 505, 117–120 (2014).
-
Liu, C. et al. Absolute quantification of single-base m6A methylation in the mammalian transcriptome using GLORI. Nat. Biotechnol. 41, 355–366 (2023).
-
Mas-Ponte, D. et al. LncATLAS database for subcellular localization of long noncoding RNAs. RNA 23, 1080–1087 (2017).
-
Seo, K. W. & Kleiner, R. E. Profiling dynamic RNA-protein interactions using small-molecule-induced RNA editing. Nat. Chem. Biol. 19, 1361–1371 (2023).
-
Meyer, C., Garzia, A., Morozov, P., Molina, H. & Tuschl, T. The G3BP1-family-USP10 deubiquitinase complex rescues ubiquitinated 40S subunits of ribosomes stalled in translation from lysosomal degradation. Mol. Cell 77, 1193–1205.e5 (2020).
-
He, X., Yuan, J. & Wang, Y. G3BP1 binds to guanine quadruplexes in mRNAs to modulate their stabilities. Nucleic Acids Res. 49, 11323–11336 (2021).
-
Street, L. A. et al. Large-scale map of RNA-binding protein interactomes across the mRNA life cycle. Mol. Cell 84, 3790–3809 (2024).
-
Nabeel-Shah, S. et al. SARS-CoV-2 nucleocapsid protein binds host mRNAs and attenuates stress granules to impair host stress response. iScience 25, 103562 (2022).
-
Ren, Z., Tang, W., Peng, L. & Zou, P. Profiling stress-triggered RNA condensation with photocatalytic proximity labeling. Nat. Commun. 14, 7390 (2023).
-
Guo, J. K. et al. Denaturing purifications demonstrate that PRC2 and other widely reported chromatin proteins do not appear to bind directly to RNA in vivo. Mol. Cell 84, 1271–1289.e12 (2024).
-
Su, H. et al. Photoactive G-quadruplex ligand identifies multiple G-quadruplex-related proteins with extensive sequence tolerance in the cellular environment. J. Am. Chem. Soc. 143, 1917–1923 (2021).
-
Sternburg, E. L., Estep, J. A., Nguyen, D. K., Li, Y. & Karginov, F. V. Antagonistic and cooperative AGO2–PUM interactions in regulating mRNAs. Sci. Rep. 8, 15316 (2018).
-
Lin, Y. et al. RNA molecular recording with an engineered RNA deaminase. Nat. Methods 20, 1887–1899 (2023).
-
Liang, Q. et al. High-sensitivity in situ capture of endogenous RNA–protein interactions in fixed cells and primary tissues. Nat. Commun. 15, 7067 (2024).
-
Kofman, E., Yee, B., Medina-Munoz, H. C. & Yeo, G. W. FLARE: a fast and flexible workflow for identifying RNA editing foci. BMC Bioinformatics 24, 370 (2023).
-
Heinz, S. et al. Simple combinations of lineage-determining transcription factors prime cis-regulatory elements required for macrophage and B cell identities. Mol. Cell 38, 576–589 (2010).
-
Nabeel-Shah, S. et al. C2H2-zinc-finger transcription factors bind RNA and function in diverse post-transcriptional regulatory processes. Mol. Cell 84, 3810–3825 (2024).
-
Yeo, G. W. et al. An RNA code for the FOX2 splicing regulator revealed by mapping RNA–protein interactions in stem cells. Nat. Struct. Mol. Biol. 16, 130–137 (2009).
-
Xue, Y. et al. Genome-wide analysis of PTB–RNA interactions reveals a strategy used by the general splicing repressor to modulate exon inclusion or skipping. Mol. Cell 36, 996–1006 (2009).
-
Zhao, J. et al. Genome-wide identification of polycomb-associated RNAs by RIP-seq. Mol. Cell 40, 939–953 (2010).
-
Almeida, M., Bowness, J. S. & Brockdorff, N. The many faces of Polycomb regulation by RNA. Curr. Opin. Genet. Dev. 61, 53–61 (2020).
-
Viphakone, N. et al. Co-transcriptional loading of RNA export factors shapes the human transcriptome. Mol. Cell 75, 310–323 (2019).
-
Zhao, J., Sun, B. K., Erwin, J. A., Song, J. J. & Lee, J. T. Polycomb proteins targeted by a short repeat RNA to the mouse X chromosome. Science 322, 750–756 (2008).
-
Zekri, L. et al. Control of fetal growth and neonatal survival by the RasGAP-associated endoribonuclease G3BP. Mol. Cell. Biol. 25, 8703–8716 (2005).
-
La Manno, G. et al. Molecular architecture of the developing mouse brain. Nature 596, 92–96 (2021).
-
Atlas, R., Behar, L., Elliott, E. & Ginzburg, I. The insulin-like growth factor mRNA binding-protein IMP-1 and the Ras-regulatory protein G3BP associate with tau mRNA and HuD protein in differentiated P19 neuronal cells. J. Neurochem. 89, 613–626 (2004).
-
Martin, S. et al. Preferential binding of a stable G3BP ribonucleoprotein complex to intron-retaining transcripts in mouse brain and modulation of their expression in the cerebellum. J. Neurochem. 139, 349–368 (2016).
-
Martin, S. et al. Deficiency of G3BP1, the stress granules assembly factor, results in abnormal synaptic plasticity and calcium homeostasis in neurons. J. Neurochem. 125, 175–184 (2013).
-
Thomsen, E. R. et al. Fixed single-cell transcriptomic characterization of human radial glial diversity. Nat. Methods 13, 87–93 (2016).
-
Fallmann, J., Sedlyarov, V., Tanzer, A., Kovarik, P. & Hofacker, I. L. AREsite2: an enhanced database for the comprehensive investigation of AU/GU/U-rich elements. Nucleic Acids Res. 44, D90–D95 (2016).
-
Su, R. et al. Global profiling of RNA-binding protein target sites by LACE-seq. Nat. Cell Biol. 23, 664–675 (2021).
-
Sekar, V. et al. Detection of transcriptome-wide microRNA-target interactions in single cells with agoTRIBE. Nat. Biotechnol. 42, 1296–1302 (2024).
-
Cheng, Q.-X. et al. MAPIT-seq protocol V.1. protocols.io https://doi.org/10.17504/protocols.io.q26g79ekkvwz/v1 (2025).
-
Picelli, S. et al. Full-length RNA-seq from single cells using Smart-seq2. Nat. Protoc. 9, 171–181 (2014).
-
Li, Y.-P. et al. A TRIM71 binding long noncoding RNA Trincr1 represses FGF/ERK signaling in embryonic stem cells. Nat. Commun. 10, 1368 (2019).
-
Li, H. Aligning sequence reads, clone sequences and assembly contigs with BWA-MEM. Preprint at https://arxiv.org/abs/1303.3997 (2013).
-
Kim, D., Paggi, J. M., Park, C., Bennett, C. & Salzberg, S. L. Graph-based genome alignment and genotyping with HISAT2 and HISAT-genotype. Nat. Biotechnol. 37, 907–915 (2019).
-
McKenna, A. et al. The Genome Analysis Toolkit: a MapReduce framework for analyzing next-generation DNA sequencing data. Genome Res. 20, 1297–1303 (2010).
-
Poplin, R. et al. Scaling accurate genetic variant discovery to tens of thousands of samples. Preprint at bioRxiv https://doi.org/10.1101/201178 (2017).
-
Liao, Y., Smyth, G. K. & Shi, W. featureCounts: an efficient general purpose program for assigning sequence reads to genomic features. Bioinformatics 30, 923–930 (2014).
-
Kaminow, B., Yunusov, D. & Dobin, A. STARsolo: accurate, fast and versatile mapping/quantification of single-cell and single-nucleus RNA-seq data. Preprint at bioRxiv https://doi.org/10.1101/2021.05.05.442755 (2021).
-
Wolf, F. A., Angerer, P. & Theis, F. J. SCANPY: large-scale single-cell gene expression data analysis. Genome Biol. 19, 15 (2018).
-
Hao, Y. et al. Dictionary learning for integrative, multimodal and scalable single-cell analysis. Nat. Biotechnol. 42, 293–304 (2024).
-
Srivastava, A., Malik, L., Smith, T., Sudbery, I. & Patro, R. Alevin efficiently estimates accurate gene abundances from dscRNA-seq data. Genome Biol. 20, 65 (2019).
-
Flati, T. et al. HPC-REDItools: a novel HPC-aware tool for improved large scale RNA-editing analysis. BMC Bioinformatics 21, 353 (2020).
-
Li, H. Minimap2: pairwise alignment for nucleotide sequences. Bioinformatics 34, 3094–3100 (2018).
-
Prjibelski, A. D. et al. Accurate isoform discovery with IsoQuant using long reads. Nat. Biotechnol. 41, 915–918 (2023).
-
Quinlan, A. R. & Hall, I. M. BEDTools: a flexible suite of utilities for comparing genomic features. Bioinformatics 26, 841–842 (2010).
-
Fernandes, J. D. et al. The UCSC repeat browser allows discovery and visualization of evolutionary conflict across repeat families. Mob. DNA 11, 13 (2020).
-
Li, H. et al. The sequence alignment/map format and SAMtools. Bioinformatics 25, 2078–2079 (2009).
-
Yee, B. A., Pratt, G. A., Graveley, B. R., Van Nostrand, E. L. & Yeo, G. W. RBP-Maps enables robust generation of splicing regulatory maps. RNA 25, 193–204 (2019).
-
Ramirez, F. et al. deepTools2: a next generation web server for deep-sequencing data analysis. Nucleic Acids Res. 44, W160–W165 (2016).
-
Kumar, L. & Futschik, M. E. Mfuzz: a software package for soft clustering of microarray data. Bioinformation 2, 5–7 (2007).
-
Love, M. I., Huber, W. & Anders, S. Moderated estimation of fold change and dispersion for RNA-seq data with DESeq2. Genome Biol. 15, 550 (2014).
-
Wu, T. et al. clusterProfiler 4.0: a universal enrichment tool for interpreting omics data. Innovation 2, 100141 (2021).
Acknowledgements
We thank all members in Wang laboratory for the critical reading and discussion of the manuscript. We are grateful to the technical assistance in bioinformatics from Q.-C. Zhang and W. Huang at School of Life Sciences (Tsinghua University). We thank A. He at College of Future Technology (Peking University) and C. Yi at School of Life Sciences (Peking University) for technical advice. We thank National Center for Protein Sciences, Beijing (Peking University), for assistance with sorting single cells. We thank the Laboratory Animal Center (Peking University) for technical support. This study was supported by The National Key Research and Development Program of China (2021YFA1100200 to Y.W.) and the National Natural Science Foundation of China (32025007 and 32130017 to Y.W.).
Ethics declarations
Competing interests
Y.W., Q-X.C., G.X., X.Z. and J.X. are the inventors of a patent on protein A–protein G–deaminase fusion proteins and their applications in sequencing (CN2024116327110, patent pending), whose value could be affected by this paper. The other authors declare no competing interests.
Peer review
Peer review information
Nature Methods thanks Faraz Mardakheh, Jernej Ule and the other, anonymous, reviewer(s) for their contribution to the peer review of this work. Peer reviewer reports are available. Primary Handling Editor: Lei Tang, in collaboration with the Nature Methods team.
Additional information
Publisher’s note Springer Nature remains neutral with regard to jurisdictional claims in published maps and institutional affiliations.
Extended data
Extended Data Fig. 1 Optimizing fixation, enzyme concentration, and antibody treatment for MAPIT-seq.
a, Bioinformatics workflow of MAPIT-seq. b, Bar plots showing the number of A-to-G (top) and C-to-U (bottom) editing events per million bases within 800-nt windows flanking G3BP1 PAR-CLIP peaks for MAPIT-seq in HEK293T (left) and HeLa (right) cells fixed with 0.1%, 0.2%, and 0.5% formaldehyde. n = 2 biological replicates. c, Heatmap showing the pairwise correlations between transcriptomes derived from samples listed in the x-axis and y-axis. x- and y-axes represent the same list of samples arranged in the same order, including IgG (blue) and anti-G3BP1 (purple) MAPIT-seq in HEK293T cells, which were fixed with varying concentrations of formaldehyde, alongside RNA-seq data from untreated HEK293T cells. The color intensity indicates Pearson’s correlation coefficient. FA, formaldehyde. d, Bar plots showing quantification of normalized A-to-G editing events detected by MAPIT-seq and TRIBE-ID in HEK293T cells. The reaction time for deamination is indicated. n = 2 biological replicates. e, Bar plots showing quantification of normalized A-to-G (left) and C-to-U (right) editing events of G3BP1 MAPIT-seq performed with different concentrations of rAPOBEC1-pAG-hADAR2dd enzymes in HEK293T cells. f, Density plots showing the distribution of A-to-G (left) and C-to-U (right) editing signals within 800-nt windows flanking G3BP1 PAR-CLIP peaks and random sites for MAPIT-seq with or without secondary antibody treatment in HEK293T cells. g, Saturation curves showing the number of editing events per million bases detected across all genes (top) and lowly expressed genes (bottom, define as the last 33.33% of genes (TPM > 1) ranked by TPM from large to small) for the subsampled G3BP1 MAPIT-seq PE150 library in HEK293T cells. Curves were generated by randomly selecting subsets of raw reads from a 60-million-read MAPIT-seq library and identifying high-confidence editing events (≥10 reads coverage, editing frequency ≥1%). Lines depicting the mean of the number of editing events per million bases from two biological replicate. h, Density plot showing editing events of IgG and anti-G3BP1 MAPIT-seq within 800-nt windows flanking PAR-CLIP peaks across lowly expressed genes in HEK293T cells.
Extended Data Fig. 2 Validation and evaluation of MAPIT-seq.
a, Replicate correlations for gene expression (left) and editing index of transcripts (right) in G3BP1 MAPIT-seq. b, Venn diagram showing the overlap of G3BP1 target genes identified by MAPIT-seq using rAPOBEC1-pAG, pAG-hADAR2, and rAPOBEC1-pAG-hADAR2 in HEK293T cells. c, Comparison of results between dual-enzyme/single-enzyme MAPIT-seq and other methods. Bar plots (top) showing the number of G3BP1 target genes detected by MAPIT-seq using rAPOBEC1-pAG, pAG-hADAR2dd, and rAPOBEC1-pAG-hADAR2dd and other methods. Heatmap (bottom) showing the true positive rate (TPR) by comparing G3BP1 target genes detected by MAPIT-seq and other methods. Color intensity indicates TPR, which was calculated as the number of overlapping detected genes between the x-axis and y-axis methods, divided by the total number of detected genes in the x-axis method. d, Pearson’s correlation between log2foldchange in G3BP1 CAP-seq post- versus pre-enrichment and G3BP1 MAPIT score. The correlation coefficient R and P-values in a,d were determined by two-tailed Pearson’s correlation test. e, Venn diagram showing the overlap of G3BP1 target genes identified in ARTR-seq and MAPIT-seq in HeLa cells. f, Western blot displaying G3BP1 protein levels in control (si-NC) and G3BP1 knockdown (si-G3BP1) HeLa cells. GAPDH was used as an internal control for normalization. g, Density plots for editing events captured by MAPIT-seq of si-NC and si-G3BP1 HeLa cells around ARTR-seq peaks. h, Cumulative and box (inset) plots showing the distribution of log2foldchange for G3BP1 targets (n = 6,976) and non-targets (n = 7,022) in si-G3BP1 versus si-NC HeLa cells. P-value was determined by two-tailed Wilcoxon rank-sum test. Lower and upper hinges represent the first and third quartiles, the center line represents the median, and whiskers represent ±1.5× the interquartile range. i, Venn diagrams showing the overlap of RBFOX2 targets identified by MAPIT-seq, paraformaldehyde (PFA)-fixed and methanol (MeOH)-fixed INSCRIBE, and CLIP in HEK293T cells. In e,i, P-values were determined by two-tailed Fisher’s exact test. j, Scatter plots showing comparison of gene expression determined by RBP-MAPIT, IgG-MAPIT and RNA-seq of untreated cells. Corresponding RBPs are indicated. Data shown are averages of two biological replicates.
Extended Data Fig. 3 Mapping binding motifs by MAPIT-seq.
a, Cumulative and box-violin plots showing the distribution of PTBP1-MAPIT scores per kb for genes, grouped by CU-rich sequence density (n = 4,096 high, n = 4,097 medium, n = 4,096 low). CU-rich sequences are defined as 80-nt-regions with CT content > 70% within protein-coding genes. P-value was determined by two-tailed Wilcoxon rank-sum test. Lower and upper hinges represent the first and third quartiles, the center line represents the median, and whiskers represent ±1.5× the interquartile range. b, Actual fractions of UGCAUG-containing RBFOX2-MAPIT, IgG-MAPIT and RBFOX2-STAMP edit clusters, and RBFOX2-eCLIP peaks (dots) versus permuted clusters of corresponding datasets (box plot, n = 20). z-scores: RBFOX2-MAPIT, 114.90; IgG-MAPIT, 0.49; RBFOX2-STAMP, 22.72; RBFOX2-eCLIP, 124.20. c, Actual fractions of UGUANA-containing PUM1-MAPIT, IgG-MAPIT, and PUM1-STAMP edit clusters, and PUM1-CLIP peaks (dots) versus permuted clusters of corresponding datasets (box plot, n = 20). z-scores: PUM1-MAPIT, 37.82; IgG-MAPIT, 0.30; PUM1-STAMP, 68.15; PUM1-CLIP, 65.64. d, Actual fractions of CU-rich sequence-containing PTBP1-MAPIT and IgG-MAPIT edit clusters, and PTBP1-CLIP peaks (dots) versus permuted clusters of corresponding datasets (box plot, n = 20). z-scores: PTBP1-MAPIT, 211.18; IgG-MAPIT, 5.71; PTBP1-CLIP, 69.04. e, Actual fractions of YTHDF2-bound m6A site-containing YTHDF2-MAPIT and IgG-MAPIT edit clusters (dots) versus permuted clusters of corresponding datasets (box plot, n = 20). YTHDF2-bound m6A sites are GLORI sites overlapping YTHDF2 PAR-CLIP peaks. z-scores: YTHDF2-MAPIT, 60.44; IgG-MAPIT, 0.73. f, Cumulative distribution curves illustrating the proportion of RBFOX2-MAPIT and RBFOX2-STAMP edit cluster centers within increasing genomic distances from the nearest UGCAUG. g, Actual fractions of eCLIP-overlapping RBFOX2-MAPIT, IgG-MAPIT, and RBFOX2-STAMP edit clusters (dots) versus permuted clusters of corresponding datasets (box plot, n = 20). z-scores: RBFOX2-MAPIT, 68.06; IgG-MAPIT, 2.15; RBFOX2-STAMP, 15.72. In b-e,g, box plots illustrate quartiles, whiskers show data range, and the median is indicated by the center line. Enrichment is calculated as the ratio of the actual fraction to the mean permutation-derived fraction. h, Density plot depicting the distribution of the distance between the closest eCLIP peak and edit clusters from RBFOX2-MAPIT (red) and IgG-MAPIT (blue, dash line), or randomly called regions (green, dash line).
Extended Data Fig. 4 Evaluating resolution of MAPIT-seq with PUM1.
a, Density plot showing distribution of the distance between the closest core PRE motifs and high-confidence edit clusters from PUM1-MAPIT (red) and IgG-MAPIT (light red, dash line), PUM1-STAMP edit clusters (blue), APOBEC-STAMP edit clusters (light blue, dash line), randomly called regions (green, dash line) and PUM1 CLIP peaks (orange). b, Cumulative curves illustrating the proportion of PUM1-MAPIT high-confidence edit clusters (red), PUM1-STAMP edit clusters (blue), and CLIP peaks (orange) with their centers within increasing genomic distances from the nearest UGUANA motif. c, Actual fractions of CLIP peaks-overlapping PUM1-MAPIT, IgG-MAPIT, PUM1-STAMP high-confidence edit clusters (dots) versus permuted clusters of corresponding datasets (box plot, n = 20). z-scores: PUM1-MAPIT, 156.75; IgG-MAPIT, 12.21; PUM1-STAMP, 133.25. Box plots illustrate quartiles, whiskers show data range, and the median is indicated by the center line. Enrichment is calculated as the ratio of the actual fraction to the mean permutation-derived fraction. d, Genome browser tracks displaying MAPIT-seq editing signals on PUM1 targets, FGFR1 and MAPKAPK5, along with CLIP signals in the same cell line. Tracks for IgG-MAPIT and PUM1-MAPIT samples include read counts (grey) and editing rates (colored bars). High-confidence MAPIT-seq edit clusters (orange square), CLIP peaks (grey square), and UGUANA motifs (red arrow) are indicated. Blue bars, A-to-G editing; Green bars, C-to-U editing. e, Density plot depicting the distribution of the distance between the closest CLIP peak and high-confidence edit clusters from PUM1-MAPIT (red) and IgG-MAPIT (blue, dash line), or randomly called regions (green, dash line).
Extended Data Fig. 5 MAPIT-seq uncovers functionally relevant RBP binding patterns.
a, Pie charts illustrating the proportions of high-confidence edit clusters (after IgG subtraction), aligning to 3′ UTR, CDS, 5′ UTR, noncoding exons, and introns in MAPIT-seq libraries for PTBP1 and PUM1 in HEK293T cells, and YTHDF2 and SERBP1 in HeLa cells. b, Splicing maps for PTBP1 and RBFOX2 MAPIT-seq (top) showing the editing signals around excluded (red) or included (blue) exons in corresponding RBP knockdown HEK293T cells. Shown are the mean editing rate differences between RBP-MAPIT and IgG-MAPIT for each position. Error bands indicate standard errors. Normalized splicing maps displaying CLIP signals for excluded (red) or included (blue) exons are shown for comparison. c, Cumulative and box-violin (inset) plots showing the distribution of MAPIT scores per kb for transcripts grouped by m6A content measured by GLORI (n = 2,266 high, n = 2,265 medium, n = 2,266 low). P-values were determined by two-tailed Wilcoxon rank-sum test. Lower and upper hinges represent the first and third quartiles, the center line represents the median, and whiskers represent ±1.5× the interquartile range. d, Metagene analysis showing the distribution of high-confidence editing events detected by YTHDF2 MAPIT-seq across all mRNAs in HeLa cells.
Extended Data Fig. 6 MAPIT-seq readily applies on frozen tissue sections.
a, Schematics of MAPIT-seq on the mouse embryonic tissue section. Created in BioRender. Wang, Y. (2025) https://BioRender.com/mfd9smm. b, Bar plots showing the number of editing events per million bases in IgG-MAPIT, G3BP1-MAPIT, and untreated fixed and fresh frozen mouse E10.5 embryo tissue sections. Shown are the average of two continuous tissue sections. c, Correlation of replicates for gene expression (left) and editing index (right) of fresh frozen mouse E10.5 embryo tissue sections. Replicates are from two continuous fresh frozen tissue sections. The correlation coefficient R and P-values were determined by two-tailed Pearson’s correlation test. d, PCA analysis of gene expression in mouse E10.5 embryo and E12.5 and E16.5 embryonic brain tissue sections. e, Box plots showing the distribution of G3BP1 motif content identified by CLIP-seq for G3BP1 targets (n = 395 in E12.5; n = 925 in E16.5) or non-targets (n = 6,823 in E12.5; n = 11,865 in E16.5) determined by MAPIT-seq in mouse E12.5 (left) and E16.5 (right) brain tissue sections. f, Box-violin plots showing the distribution of gene expression (ln(TPM + 1)) for G3BP1 targets with different G3BP1 binding strength. G3BP1 targets were split into three groups based on their MAPIT score. High, top 10% (n = 40 in E12.5; n = 93 in E16.5); low, bottom 10% (n = 40 in E12.5; n = 93 in E16.5); medium, the rest of targets (n = 315 in E12.5; n = 739 in E16.5). In e,f, P-values were determined by two-tailed Wilcoxon rank-sum test. Lower and upper hinges represent the first and third quartiles, the center line represents the median, and whiskers represent ±1.5× the interquartile range. g, Genome browser tracks displaying editing sites of G3BP1-MAPIT on targets Hsp90ab1, Elavl4, Caprin1, and Fmr1 in mouse E12.5 and E16.5 embryonic brain tissue sections. Shown are read counts (left y-axis, grey shade) and editing rates (right y-axis, colored bars). Blue bars, A-to-G editing; Green bars, C-to-U editing.
Extended Data Fig. 7 scMAPIT-seq enables RBP targets and transcriptome co-profiling at single-cell resolution.
a, Density plots depicting editing events around G3BP1 ARTR peaks of MAPIT-seq libraries constructed with decreasing number of HeLa cells. b, Heatmap showing HEK293T transcriptome correlations between MAPIT-seq with different fixation reagents and RNA-seq on untreated cells. The color intensity indicates Pearson’s correlation coefficient. FA, formaldehyde; MeOH, methanol. c, Density plots depicting editing events around G3BP1 PAR-CLIP peaks of MAPIT-seq in HEK293T cells based on formaldehyde (FA), methanol (MeOH), and DSP fixation. d, Venn diagrams showing the overlap of G3BP1 targets detected by DSP-MAPIT-seq with those detected by formaldehyde-MAPIT-seq (top) and PAR-CLIP (bottom) in HEK293T cells. P-values were determined by two-tailed Fisher’s exact test. e, Heatmap showing transcriptome correlations of 5 single-cell RNA-seq data (untreated) and 10 FRISCR DSP-scMAPIT-seq data (anti-G3BP1 and IgG) of HeLa cells. The color intensity indicates Pearson’s correlation coefficient. f, Box-violin plots showing the number of detected genes (left), total UMI counts (middle), the number of editing events per million bases (right), in single cells from high-throughput scMAPIT-seq of anti-G3BP1 (n = 3,400) and IgG (n = 3,945) libraries. P-values were determined by two-tailed Wilcoxon rank-sum test. Lower and upper hinges represent the first and third quartiles, the center line represents the median, and whiskers represent ±1.5× the interquartile range. g, UMAP visualization of single HeLa cells based on gene expression (left) and editing index (right) from high-throughput scMAPIT-seq. IgG and anti-G3BP1 treated cells are labeled with different colors.
Extended Data Fig. 8 scMAPIT-seq reveals cell cycle phase-specific regulation of G3BP1.
a, GO biological process terms associated with G3BP1 targets in G1, S, and G2/M phases defined in Fig. 5f. The dot size represents statistical significance (adjusted P-value, -log10) and the color represents enrichment fold (log2). b, Dynamic change of G3BP1 binding. Heatmap (left) showing dynamic change of binding strength for G3BP1 targets in G1, S, and G2/M phases. G3BP1 targets were ranked from large to small based on the standard deviation of G3BP1 binding strength across different cell cycle phases, and the top 50% RNA targets were clustered into 4 groups by fuzzy c-means. Line plots (right) showing the respective change of G3BP1 binding strength in each cluster. Each line represents one target gene, with the black line being the centroid of the cluster. The color of the line represents membership value, which refers to the degree to which a particular gene belongs to the cluster. c, GO biological process terms associated with genes of 4 clusters defined in b. The top 5 unique GO terms are shown. The dot size represents statistical significance (adjusted P-value, -log10) and the color represents enrichment fold (log2). In a,c, P-values were determined by one-tailed hypergeometric test and adjusted by Benjamini–Hochberg method. d, Histogram showing the distribution of Pearson’s correlation coefficients between gene expression and G3BP1 binding strength during the transition of different cell cycle phases (Supplementary Table 28). e-g, Line plots showing the change of gene expression (left y-axis, blue lines) and G3BP1 binding strength (right y-axis, red lines) across whole cell cycle progression for selected positively (e), negatively (f), and not significantly correlated (g) genes.
Extended Data Fig. 9 Long-read MAPIT-seq uncovers isoform-specific binding of G3BP1.
a, Violin plots showing the distribution of read lengths for formaldehyde and DSP long-read MAPIT-seq. Lower and upper dash lines indicate the first and third quartiles, the center dash lines indicate the median. b, Bar plots showing editing signals of formaldehyde and DSP long-read MAPIT-seq. c, Genome browser tracks showing DSP long-read and short-read MAPIT-seq editing signals on EIF4G2. d, Genome browser tracks showing long-read MAPIT-seq editing signals on two isoforms of GDAP2 (top) and ING3 (middle) with high and low G3BP1 MAPIT scores, and two isoforms of SERBP1 (bottom) with similar MAPIT scores. The common intron regions between two isoforms were shortened for the convenience of visualization. In c,d, shown are counts (left y-axis, grey shade) and editing rates (right y-axis, colored bars). Blue bars, A-to-G editing; Green bars, C-to-U editing.
Extended Data Fig. 10 Comparison of MAPIT-seq with other RBP-RNA interaction characterization methods.
CLIP, TRIBE/STAMP, RT&Tag/ARTR-seq, and MAPIT-seq are compared across key performance metrics. Time, typical duration of the workflow from initial cell treatment to library construction. Genetic manipulation, whether ectopic expression of deaminase is required. Temporal resolution, shortest time window over which RBP-RNA interactions can be resolved. Binding resolution, smallest region size that a method can pinpoint. Transcriptome co-profiling, ability to obtain global gene-expression data in parallel with RBP-binding profiles. Primary cells and clinical samples, feasibility of applying the method directly to primary cells or patient-derived tissues. High throughput single-cell application, suitability for single-cell profiling of RBP-RNA interactome involving large cell numbers. Isoform-specific resolution, capability to resolve RBP-binding events at the level of individual transcript isoforms. In each cell of the matrix, a tick denotes compatibility or strength in that category, while a cross denotes a limitation or lack of support.
Supplementary information
Source data
Rights and permissions
Open Access This article is licensed under a Creative Commons Attribution-NonCommercial-NoDerivatives 4.0 International License, which permits any non-commercial use, sharing, distribution and reproduction in any medium or format, as long as you give appropriate credit to the original author(s) and the source, provide a link to the Creative Commons licence, and indicate if you modified the licensed material. You do not have permission under this licence to share adapted material derived from this article or parts of it. The images or other third party material in this article are included in the article’s Creative Commons licence, unless indicated otherwise in a credit line to the material. If material is not included in the article’s Creative Commons licence and your intended use is not permitted by statutory regulation or exceeds the permitted use, you will need to obtain permission directly from the copyright holder. To view a copy of this licence, visit http://creativecommons.org/licenses/by-nc-nd/4.0/.
About this article

Cite this article
Cheng, QX., Xie, G., Zhang, X. et al. Co-profiling of in situ RNA-protein interactions and transcriptome in single cells and tissues. Nat Methods (2025). https://doi.org/10.1038/s41592-025-02774-4
-
Received:
-
Accepted:
-
Published:
-
DOI: https://doi.org/10.1038/s41592-025-02774-4