Introduction
Sorafenib, a multikinase inhibitor, has been the standard of care for advanced hepatocellular carcinoma (HCC) for more than a decade and is still considered an important first-line therapy along with the combination of atezolizumab and bevacizumab [1, 2]. However, innate resistance to sorafenib may be present, and acquired resistance may develop during treatment; therefore, many researchers have focused on identifying factors linked to the acquisition of sorafenib resistance [1, 3, 4], which is likely related to the unusual expression of certain genes [1]. One of the plausible gene candidates is glucose-regulated protein 78 (GRP78) [5, 6]. The GRP78 protein, also known as BiP and heat shock 70 kDa protein 5 (HSPA5), is a stress-inducible endoplasmic reticulum (ER) chaperone protein that serves as the master regulator of the unfolded protein response (UPR) [7, 8]. The overexpression of GRP78 in many types of human cancer, including hepatocellular carcinoma (HCC), is associated with tumorigenesis, tumor progression, invasion, metastasis, and drug resistance, making it a potential anticancer therapeutic target [9, 10]. In cancer, GRP78 is typically overexpressed and then further induced by chemotherapeutic drugs such as sorafenib or gemcitabine, which have different mechanisms of action [5, 11]. The GRP78 protein protects cells by limiting sorafenib-mediated endoplasmic reticulum (ER) stress; in addition, ER stress induces GRP78 to translocate to the cell surface after exceeding the retention capacity of the KDEL retrieval system in the ER [12, 13]. The relocation of stress-inducible chaperones such as GRP78 to the cell surface may represent a common adaptive mechanism by which cells respond to stress and perturbations in protein homeostasis [14]. Cell surface GRP78 (csGRP78) is highly expressed on both endothelial and malignant cells but is otherwise rarely expressed on normal cells. The active translocation of GRP78 to the surface of tumor cells is correlated with proliferative, malignant, metastatic, apoptotic and drug-resistant cancer cell phenotypes [10], suggesting that csGRP78 is a promising cancer cell-specific biomarker and therapeutic target [15]. However, the exact mechanism by which GRP78 is translocated to the cell surface and is stable on the cell surface is still obscure [11, 14]. Among the GRP78-interacting protein partners, CD44v is known as a client protein that counters the cell surface in tamoxifen-resistant breast cancer cells [9]. CD44, a well-known marker of cancer stem-like cells, contributes to tumor progression by activating ligand-mediated signaling pathways involved in proliferation, adhesion, migration, and invasion through binding to its ligands, such as hyaluronic acid, the most specific ligand for CD44 [16]. Changes in CD44 glycosylation can regulate its binding to several ligands, which are regarded as therapeutic targets [17]. One example of CD44 glycosylation is CD44 fucosylation, which is capable of improving mesenchymal stem cell homing to the injured site after systemic intravenous transplantation [18]. Cell surface GRP78 acts as a multifunctional receptor (for example, by triggering ERK and Akt activation) or as an upstream regulator of the PI3K‒Akt signaling pathway [19]. Intriguingly, GRP78 is also a downstream target of Akt activity [20]. Previously, we reported that TGF-β downregulation partially sensitized resistant HCC to sorafenib by interrupting and weakening the sorafenib-induced survival signaling pathway through Akt inactivation [21]. Rapidly proliferating solid tumors often have insufficient blood supply, resulting in limited oxygen utilization [22]. The hypoxic tumor environment leads to profound cellular stress, with consequent tumor heterogeneity and plasticity progressing to infiltration and therapeutic resistance [23]. Therefore, tumor hypoxia may also be considered a future target of chemotherapy [22, 24]. Hypoxia activates HIF-1α, which increases VEGF production and subsequently enhances angiogenesis, whereas degradation of HIF-1α inhibits the PI3K/Akt pathway and VEGF production [25]. The expression of HIF-1α also induces the progression of various types of tumors, while HIF-1α inhibition slows progression in some tumor types. Sorafenib resistance is associated with increased HIF expression [26]. These findings indicate that HIF-1α is a potential therapeutic target for some malignant tumors, including chemoresistant tumors [27]. Here, we identified the mechanism underlying the initial stage of sorafenib-induced acquired resistance and provided a strategy to overcome acquired sorafenib resistance.
Methods
Cell culture
The human cancer cell lines SNU449 (human hepatocellular carcinoma), SNU398 (human hepatocellular carcinoma), and A549 (human lung carcinoma) were purchased from the Korean Cell Line Bank, and 293A, a subclone of the human embryonic kidney 293 cell line, was purchased from Invitrogen (Carlsbad, CA, USA). All cells except SNU449 were cultured in Dulbecco’s modified Eagle’s medium with 10% fetal bovine serum (HyClone Laboratories, Logan, UT, USA) at 37 °C in a humidified atmosphere containing 5% CO2; SNU449 was cultured in RPMI-1640 under the same conditions.
Reagents
Antibodies against β-actin (Cat#sc-47778), GAPDH (Cat#sc-365062), phospho-SAPK/JNK (Cat#sc-6254), c-Met (Cat#sc-8057), HSP27 (Cat#sc-13132), and GRP78 (Cat#sc-166490) were purchased from Santa Cruz Biotechnology (Santa Cruz, CA, USA). Antibodies against phospho-Akt (Ser473) (Cat#9271 s), JNK (Cat#9252 s), phospho-JNK (Cat#9251 s), p38 (Cat#9212 s), phospho-p38 (Cat#9216 s), phospho-ERK(Cat#9101 s) were purchased from Cell Signaling Technology (Beverly, MA, USA). Antibodies against GRP78 (Cat#11587-1-AP) and CD44(Cat#15675-1-AP) were purchased from Proteintech (Rosemont, IL, USA). An antibody against phospho-IRE1α (Cat#PA1-16927) was purchased from Thermo Fisher Scientific (Waltham, MA, USA). An antibody against phospho-IGF1R (Tyr1161/Tyr1165/Tyr1166) (Cat#PA5-118536) was purchased from Sigma‒Aldrich (St. Louis, MO, USA). Sorafenib (Cat# SML2653) and MG132 (Cat#474787) were purchased from Sigma‒Aldrich, and GRP78 siRNA (Cat#sc-29338) was purchased from Santa Cruz Biotechnology. AEBSF (Cat#A-540) was purchased from Gold Biotechnology (St Louis, MO, USA). Antibodies against secondary Alexa Fluor 488 (Cat#A-11008) and Alexa Fluor 647 (Cat#A-31571) were purchased from Invitrogen (Carlsbad, CA, USA). MKC-3946 (Cat#A-12508) was purchased from AdooQ Bioscience (Irvine, CA, USA). TRIzol™ (Cat#15596018) was purchased from Life Technologies (Carlsbad, CA, USA). All other chemicals were purchased from Sigma‒Aldrich (St. Louis, MO, USA).
Construction of GRP78 (HSPA5) short hairpin RNAs (shRNAs)
First, we designed the target sequence as previously reported—a 2-base shift to the right—5’-GGTTACCCATGCAGTTAC-3’ and made two strands for annealing to produce shRNA. The loop sequence was 5’-TCTC’-3’, and the poly A sequence was 5’-TTTTA-3’. The top strand was 5’-GATCC GGTTACCCATGCAGTTGTTAC TCTC GTAACAACTGCATGGGTAACC TTTTA-3’; and the bottom strand was 5’-AGCTT AAAA GGTTACCCATGCAGTTGTTAC GAGA GTAACAACTGCATGGGTAACC G-3’. To construct more potent human GRP78 shRNAs, we screened five candidate sequences via an algorithm developed by Genolution Pharmaceuticals, Inc. (Seoul, Korea). The GRP78 shRNA candidates for the target sequence were as follows:
(1) 5’-CAAAGACGCUGGAACUAUUGCUCUCGCAAUAGUUCCAGCGUCUUUG UU-3’; (2) 5’-CUAUUGCUGGCCUAAAUGUUAUCUC UAACAUUUAGGCCAGCAAUAGUU-3’; (3) 5’-GCUUAUGGCCUGGAUAAGAGGUCUCCCUCUUAUCCAGGCCAUAAGCUU-3’; (4) 5’-GGUCUAUGAAGGUGAAAGACCUCUC GGUCUUUCACCUUCAUAGACC UU-3’; and (5) 5’-CCAAGAUGCUGACAUUGAAGAUCUC UCUUCAAUGUCAGCAUCUUGGUU-3’. The negative control shRNA provided by Genolution was 5’-CCUCGUGCCGUUCCAUCAGGUAGUCUCCUACCUGAUGGAACGGCACGAGG UU-3’. The final target sequence selected was 5’-CCAAGAUGCUGACAUUGAAGA-3’, which was derived from GRP78 shRNA 5. For expression of human GRP78 shRNA in an adenovirus vector, the top strand sequence was 5’-GATCCCCAAGATGCTGACATTGAAGATCTCTCTCTTCAATGTCAGCATCTTGGTTTTTTA-3’, and the bottom strand sequence was 5’-AGCTTAAAAAA CCAAGATGCTGACATTGAAGA GAGAGA TCTTCAATGTCAGCATCTTGGG-3’. The loop sequence was 5’-TCTCTC-3’, and the poly A sequence was 5’-TTTTTTA-3’. The top and bottom strands were annealed for subcloning into BamHI–HindIII-digested pSP72-ΔE3-H1-shDaxx to generate pSP72-ΔE3-H1-shGRP78.
Construction of vimentin shRNAs
Of the two validated target sequences (5’-GAAGAATGGTACAAATCCAAGTTTG-3’, 5’-TGAAGCTGCTAACTACCAAGACACT-3’) available, the second was selected by western blotting after the shuttle vector (pSP72-ΔE3-shvimentin 1st, 2nd) was transfected into 293A cells. The selected top strand sequence was 5’-GATCC TGAAGCTGCTAACTACCAAGACACT TCTC AGTGTCTTGGTAGTTAGCAGCTTCA TTTT A-3’, and the bottom strand sequence was 5’-AGCTT AAAA TGAAGCTGCTAACTACCAAGACACT GAGA AGTGTCTTGGTAGTTAGCAGCTTCA G-3’. The top and bottom strands were subsequently annealed for subcloning into the BamHI-HindIII-digested pSP72-ΔE3-U6-siGFP to make pSP72-ΔE3-U6-shvimentin (2nd).
Construction of CD44 standard shRNAs
To construct the most potent human CD44 shRNA, we screened four candidate shRNA sequences after subcloning them into BamHI-HindIII-digested pSP72-ΔE3-U6-siGFP to generate pSP72-ΔE3-U6-shCD44s. (1) top strand 5’-GATCC GCAGCACTTCAGGAGGTTACA TCTCTC TGTAACCTCCTGAAGTGCTGC TTTTA -3’ and bottom strand 5’-AGCTT AAAA GCAGCACTTCAGGAGGTTACA GAGAGA TGTAACCTCCTGAAGTGCTGC G-3’; (2) top strand 5’-GATCC GCACTTCAGGAGGTTACATCT TCTCTC AGATGTAACCTCCTGAAGTGC TTTTA -3’ and bottom strand 5’-AGCTT AAAA GCACTTCAGGAGGAGGTTACATCT GAGAGA AGATGTAACCTCCTGAAGTGC G-3’; (3) top strand 5’-GATCC GCTTTGATTCTTGCAGTCAAC TCTCTC GTTGACTGCAAGAATCAACTC TTTTA -3’ and bottom strand 5’- AGCTT AAAA GCTTTGATTCTTGCAGTCAAC GAGAGA GTTGACTGCAAGAATCAAAGC G-3’; (4) top strand 5’-GATCC GGACCAATTACCATAACTATT TCTCTCT AATAGTTATGGTAATTGGTCC TTTTA- 3’ and bottom strand 5’-AGCTT AAAA GGACCAATTACCATAACTATT GAGAGA AATAGTTATGGTAATTGGTCC G-3’. The 4th target sequence (GGACCAATTACCATAACTATT) originated from the 2nd siRNA of CD44 in Hu et al. [28]. Then, the 4th was selected by real-time PCR and western blotting after transfection.
Construction of HIF-1α shRNAs
To construct the most potent human HIF-1α shRNA, we screened six candidate shRNA sequences after subcloning into BamHI-HindIII-digested pSP72-ΔE3-U6-siGFP to generate pSP72-ΔE3-U6-shHIF-1α. (1) top strand 5’-GATCC GCCGAGGAAGAACTATGAACA TCTCTC TGTTCATAGTTCTTCCTCGGC TTTTTT A-3’ and bottom strand 5’-AGCTT AAAAAA GCCGAGGAAGAACTATGAACA GAGAGA TGTTCATAGTTCTTCCTCGGC G-3’; (2) top strand 5’-GATCC GCTGATTTGTGAACCCATTCC TCTCTC GGAATGGGTTCACAAATCAGC TTTTTT A-3’ and bottom strand 5’-AGCTT AAAAAA GCTGATTTGTGAACCCATTCC GAGAGA GGAATGGGTTCACAAATCAGC G-3’; (3) top strand 5’-GATCC GCTGGAGACACAATCATATCT TCTCTC AGATATGATTGTCTCCAGC TTTTTT A-3’ and bottom strand 5’-AGCTT AAAAAA GCTGGAGACACAATCATATCT GAGAGA AGATATGATTGTGTCTCCAGC G-3’; (4) top strand 5’-GATCC GCAGCTACTACATCACTTTCT TCTCTC AGAAAGTGATGTAGTAGCTGC TTTTTT A-3’ and bottom strand 5’-AGCTT AAAAAA GCAGCTACTACATCACTTTCT GAGAGA AGAAAGTGATGTAGTAGCTGC G-3’; (5) top strand 5’-GATCC GCTACTACATCACTTTCTTGG TCTCTC CCAAGAAAGTGATGTAGTAGC TTTTTT A-3’ and bottom strand 5’-AGCTT AAAAAA GCTACTACATCACTTTCTTGG GAGAGA CCAAGAAAGTGATGTAGTAGC G-3’; (6) top strand 5’-GATCC AAGAAACTACTAGTGCCACATCA TCTCTC TGATGTGGCACTAGTAGTTTCTT TTTTTT A-3’ and bottom strand 5’-AGCTT AAAAAA AAGAAACTACTAGTGCCACATCA GAGAGA TGATGTGGCACTAGTAGTTTCTT G-3’. The 6th target sequence (AAGAAACTACTAGTGCCACATCA) was originated from the 5th target sequence of HIF1α in Mizuno et al. [29]. Then, the 6th was selected by real time PCR after transfection.
Construction of a defective adenovirus expressing U6-shTGF-β1-H1-shGRP78
pSP72-ΔE3-U6-shTGF-β1-H1-shGRP78 was constructed by inserting H1-shGRP78-Poly A into HindIII, followed by blunting/KpnI-digested pSP72-ΔE3-U6-shTGF-β1 after the digestion of pSP72-ΔE3-H1-shGRP78 with SphI, followed by blunting/KpnI. pSP72-ΔE3-U6-shTGF-β1-H1-shGRP78 was linearized by XmnI and then cotransformed into E. coli BJ5183, together with a SpeI-digested dl324-IX backbone for homologous recombination.
Construction of a defective adenovirus expressing H1-shHSP27-U6-shTGF-β1
pSP72-ΔE3-H1-shHSP27-U6-shTGF-β1 was constructed by inserting U6-shTGF-β1-Poly A into HindIII, followed by blunting/KpnI-digested pSP72-ΔE3-H1-shHSP27 after digestion of pSP72-ΔE3-U6-shTGF-β1 with SphI, followed by blunting/KpnI. pSP72-ΔE3-H1-shHSP27-U6-shTGF-β1 was linearized by XmnI and then cotransformed into E. coli BJ5183, together with a SpeI-digested dl324-IX backbone for homologous recombination.
Construction of a defective adenovirus expressing U6-shTGF-β1-U6-shvimentin
pSP72-ΔE3-U6-shTGF-β1-U6-shvimentin was constructed by inserting U6-shvimentin-Poly A into Hind III, followed by blunting/KpnI-digested pSP72-ΔE3-U6-shTGF-β1 after the digestion of pSP72-ΔE3-U6-shvimentin with SphI, followed by blunting/KpnI. pSP72-ΔE3-U6-shTGF-β1-U6-shvimentin was linearized by XmnI and then cotransformed into E. coli BJ5183, together with a SpeI-digested dl324-IX backbone for homologous recombination.
Construction of an oncolytic adenovirus expressing HSP27 and TGF-β1 shRNAs
The adenoviral E3 region shuttle vector pSP72-ΔE3-H1-shHSP27-U6-shTGF-β1 was linearized via XmnI digestion, and the adenoviral backbone vector dl324-BstBI was linearized via SpeI digestion. The two linearized vectors were subsequently cotransformed into E. coli BJ5183 competent cells for the first homologous recombination. A second homologous recombination was subsequently performed using dl324-BstBI-H1-shHSP27-U6-shTGF-β1 and the adenoviral shuttle vector pVAX1-3484, which contains an E1 region without E1B55K, to generate an E1B55K-deleted oncolytic adenovirus harboring HSP27 and TGF-β1 shRNAs. The final adenoviral construct, dl324-3484-H1-shHSP27-U6-shTGF-β1, was digested with PacI and transfected into 293A cells to generate a tumor-selective replicative adenovirus. The 293A cells were reinfected with the generated adenovirus, and this procedure was repeated for viral amplification. The infectious titer of the adenovirus was determined by performing a limiting dilution assay in 293A cells after concentration and purification with CsCl gradients.
Construction of an oncolytic adenovirus expressing H1-shHSP27-U6-shTGF-β1-U6-shHIF1α (or U6-shTGF-β1-H1-shGRP78-U6-shHIF1α)
First, the adenoviral E3 region shuttle vector pSP72ΔE3-H1-shHSP27-U6-shTGF-β1-U6-shTGF-1α (or pSP72ΔE3-U6-shTGF-β1-H1-shGRP78-U6-shHIF-1α) was constructed by inserting U6-shHIF-1α-Poly A into HindIII followed by blunting/KpnI-digested pSP72-ΔE3-H1-shHSP27-U6-shTGF-β1 (or pSP72ΔE3-U6-shTGF-β1-H1-shGRP78) after the digestion of pSP72-ΔE3-U6-shHIF-1α with SphI followed by blunting/KpnI. pSP72-ΔE3-H1-shHSP27-U6-shTGF-β1-U6-shHIF-1α was linearized by XmnI and then cotransformed into E. coli BJ5183, together with a SpeI-digested dl324-IX backbone for the first homologous recombination. A second homologous recombination was performed using dl324-BstBI-H1-shHSP27-U6-shTGF-β1-U6-shHIF1α (or dl324-BstBI-U6-shTGF-β1-H1-shGRP78-U6-shHIF1α) and the adenoviral shuttle vector pVAX1-3484, which contains an E1 region without E1B55K, to generate an E1B55K-deleted oncolytic adenovirus harboring HSP27, TGF-β1, and HIF1α shRNAs. The final adenoviral construct, dl324-3484-H1-shHSP27-U6-shTGF-β1-U6-shHIF1α (or dl324-BstBI-U6-shTGF-β1-H1-shGRP78-U6-shHIF1α), was processed for viral production as described in the preceding sentence.
Establishment of sorafenib-resistant cells
The IC50 of sorafenib in HCC cells was initially determined by incubating cells with different concentrations of sorafenib in 96-well plates, and cell viability was measured 24 h later via an MTS viability assay as described in Kang et al. [30]. Two HCC cell lines (SNU449 and SNU398) were cultured in 6-well plates at 1 × 10⁴ cells/well and incubated with sorafenib at concentrations below the IC50 (10 μM and 5 μM, respectively). The sorafenib concentration was progressively increased by 0.5 μmol/L per week. After the IC50 values were reached (15 μM and 7.5 μM, respectively), two sorafenib-resistant HCC cell lines, termed SNU449-SR (less sensitive) and SNU398-SR (more sensitive), were obtained and were continuously maintained by culture in the presence of sorafenib (10 μM and 5 μM, respectively).
MTS assay
The CellTiter® 96 AQueous Assay Kit (Promega, Madison, WI, USA) is composed of solutions containing a novel tetrazolium compound (3-(4,5-dimethylthiazol-2-yl)-5-(3-carboxymethoxyphenyl)-2-(4-sulfophenyl)-2H-tetrazolium, inner salt; MTS) and an electron-coupling reagent (phenazine ethosulfate; PES). The MTS is bioreduced by cells into a formazan product that is soluble in tissue culture media. SNU449, SNU449-SR, SNU398, and SNU398-SR cells were cultured in a six-well plate with adenovirus infection (dl324-IX-ΔE3-U6-shNC, dl324-IX-ΔE3-U6-shTGF-β1, dl324-IX-ΔE3-H1-shHSP27, dl324-IX-ΔE3-H1-shGRP78, dl324-IX-ΔE3-U6-shvimentin, dl324-IX-ΔE3-H1-shHSP27-U6-TGF-β1, or dl324-IX-ΔE3-U6-TGF-β1-H1-shGRP78 at an MOI of 50 for 2 days. Then, 100 μL of trypsinized cell-containing supernatant from each well was transferred into a new well of a 96-well flat-bottom plate. The absorbance of formazan at 490 nm was measured directly from the 96-well assay plates without additional processing. The formazan concentration was directly proportional to the number of living cells in each culture.
Clonogenic assays
The cells were plated into six-well plates at a density of 1 × 10⁵ cells/well. SNU449, SNU449-SR, SNU398, and SNU398-SR cells were subsequently cultured in a 6-well plate with adenovirus infection (dl324-IX-ΔE3-U6-shNC, dl324-IX-ΔE3-U6-shTGF-β1, dl324-IX-ΔE3-H1-shHSP27, dl324-IX-ΔE3-H1-shGRP78, dl324-IX-ΔE3-U6-shvimentin, dl324-IX-ΔE3-H1-shHSP27-U6-TGF-β1, or dl324-IX-ΔE3-U6-TGF-β1-H1-shGRP78) at an MOI of 50 for 2 days. The cells were then trypsinized and plated into six-well plates at densities of 5 × 10³ or 1 × 10⁴ cells/well. The cultures were monitored daily via microscopy. When the cells formed colonies, the surviving cells were fixed with 4% paraformaldehyde and stained with 0.5% crystal violet.
Immunoblot analysis
The cells were lysed in 1× Laemmli lysis buffer (62.5 mM Tris, pH 6.8; 2% sodium dodecyl sulfate; 10% glycerol; 0.02% bromophenol blue). Proteins were separated by SDS‒PAGE and electrotransferred onto polyvinylidene fluoride (PVDF) membranes (Millipore, Billerica, MA, USA). After each membrane (containing 5% nonfat dry milk in TBS-Tween-20 (0.1%, v/v) was blocked at room temperature for 1 h), it was incubated with primary antibody (diluted according to the manufacturer’s instructions) for durations ranging from 2 h to overnight, depending on the antibody. Horseradish peroxidase-conjugated anti-mouse, anti-rabbit or IgG was used as a secondary antibody. Immunoreactive proteins were visualized via chemiluminescence (Thermo Fisher Scientific, Waltham, MA, USA).
Real-time PCR
SNU449, SNU449-SR, SNU398, or SNU398-SR cells were infected with a defective adenovirus expressing human TGF-β1 shRNA, GRP78 shRNA, TGF-β1/GRP78 shRNAs or scrambled shRNA. After 2 days of infection, the cells were lysed with TRIzol™ reagent (Life Technologies), and total RNA was isolated via chloroform extraction. The RNA concentration was determined via a Nanodrop™ 2000 (Thermo Scientific, Fremont, CA, USA). A real-time polymerase chain reaction (PCR) assay was performed using Power SYBR Green PCR Master Mix (Thermo Fisher Scientific, Waltham, MA, USA). The reaction mixture comprised an RT enzyme mixture, reverse transcription (RT)-PCR mixture, forward primer, reverse primer, RNA template, and nuclease-free water. Human GRP78 was amplified with the forward primer 5’-CTTGCCGTTCAAGGTGGTTG-3’ and the reverse primer 5’-GCATGGGTAACCTTCTTTCC-3’. Human β-actin was amplified with the forward primer 5’-ACTCTTCCAGCCTTCCTTC-3’ and the reverse primer 5’-ATCTCCTTCTGCATCCTGTC-3’.
Microarray analyses
The cDNA microarray assay was performed using total RNA isolated from two cancer cell lines 48 h after infection with adenoviruses bearing TGF-β1 shRNA, HSP27 shRNA, GRP78 shRNA, both TGF-β1 shRNA and HSP27 shRNA, or both TGF-β1 shRNA and GRP78 shRNA. Total RNA was extracted and purified via the RNeasy Plus Mini Kit (Qiagen, 74134) according to the manufacturer’s instructions. The results were summarized and normalized via Affymetrix Power Tools (APT). These data were exported for differentially expressed gene (DEG) analysis. The statistical significance of the expression data was determined via the fold-change magnitude. Hierarchical cluster analysis was performed for the DEG set using complete linkage and Euclidean distance as measures of similarity. All the data analyses and visualizations of the DEGs were conducted by Macrogen, Inc. (Korea) via R 3.3.2.
Measurement of cell-surface GRP78 by biotinylation and avidin pulldown
The cell surface expression of the GRP78 protein was measured via a biotinylation and avidin pulldown method as described previously [31]. After the addition of sorafenib for the indicated times, the cells were washed with cold PBS three times. Then, 1 mg/mL EZ-Link Sulfo-NHS-SS-Biotin (Thermo Scientific, Waltham, MA) in PBS was added, and the cells were gently shaken at room temperature for 30 min. To stop the biotinylation reaction, the biotin solution was removed, and the cells were rinsed 3 times with quenching buffer (cold PBS containing 100 mM glycine). Then, the cells were subjected to a radioimmunoprecipitation assay (RIPA). Part of the whole-cell lysate was saved for immunoblotting to measure the total levels of the target proteins. To purify the surface proteins, the remaining lysate was mixed with NeutrAvidin™ agarose resin (Thermo Scientific) at room temperature for 1 h, and the resulting mixture was washed with RIPA buffer and centrifuged at 3000 × g for 1 min 6 times. The cell-surface proteins were released by the addition of 50 μL of 2× SDS‒PAGE sample buffer, followed by heating at 95 °C for 5 min and centrifugation at 6000 × g for 5 min to collect the supernatant to perform immunoblot analyses for the detection of surface proteins.
Confocal microscopy
HCC cell lines (SNU449 and SNU398) were cultured in confocal plates at 1 × 10⁵ cells/well and incubated with sorafenib at concentrations below the IC50 (10 μM and 5 μM, respectively). Then, the cells were fixed in 4% PFA for 15 min at room temperature and incubated with primary antibodies against CD44 (Proteintech 15675-1), HSP27 (Santacruz sc-13132), CD44 (Proteintech 15675-1) and GRP78 (Santacruz sc-166490) at room temperature for 2 h and with Alexa Fluor 488-conjugated anti-rabbit IgG (Invitrogen A-11008) or Alexa Fluor 647-conjugated anti-mouse IgG (Invitrogen A-31571) at room temperature for 1 h. Nuclei were stained with DAPI (Invitrogen D1306) at room temperature for 5 min. Fluorescence images were taken via an LSM700 (Carl Zeiss) confocal microscope.
Capturing Z-stack confocal images
MemBrite® Fix Cell Surface Staining Kits are reactive fluorescent dye stains that react with cell surface proteins (biotium, 30094-T). SNU449 and SNU398 cells were seeded in confocal dishes and treated with sorafenib at concentrations below the IC50 (10 μM and 5 μM, respectively). Then, MemBrite® 543/560 cell surface prestaining solution was added, and the mixture was incubated at 37 °C for 5 min. After that, the MemBrite® solution was incubated at 4 °C for 30 min. The cells were subsequently fixed in the same way as mentioned above. Finally, fluorescence images were taken via an LSM700 (Carl Zeiss) confocal microscope with Z-stack settings.
Establishment of the SNU398/CD44 cell line
A stable SNU398 cell line expressing CD44 was selected with puromycin. SNU398 cells were infected with retrovirus produced by transfecting the retroviral pBabe-puro-CD44s vector (Addgene #19127) into Platinum-A packaging cells (Cell Biolabs, United States), and then, a selection process was performed via puromycin (3 μg/ml). After several clones were selected, CD44 expression was confirmed through western blotting, after which the final clone was selected. As a negative control, SNU398/NC cells were also produced via the pBabe puro empty vector.
Animal study
An animal study was performed in compliance with the ARRIVE guidelines as described below. For the experiment, 5-week-old male BALB/c athymic nude mice weighing approximately 20 g were obtained from OrientBio (Seongnam, Korea). All the mice were housed in individually ventilated cages at 21(pm)2 °C and 50(pm)10% humidity while undergoing a 1-week acclimation period with free access to food (PicoLab Rodent diet 20 5053) and reverse osmosis-purified water. The maximum caging density was five mice per cage, and autoclaved aspen chips were used as bedding. To generate a xenograft tumor model, 2 × ({10}^{6}) SNU398-SR cancer cells in Matrigel™ were injected subcutaneously into the flank region of the mice. When the tumors reached an average size of 70−120 mm³, 5 × 10⁸ plaque-forming units (PFUs) of each adenovirus diluted in 50 μL of PBS or PBS alone were injected intratumorally into the nude mice. Mice with similar average and standard deviation values of tumor size were separated into groups. The adenoviruses used for injection were Ad-NC, Ad-shHSP27-shTGF-β1, or Ad-shTGF-β1-shGRP78. Intratumoral injection was repeated twice every other day. The arrows indicate when the oncolytic adenovirus was administered. The error bars represent the means ± SDs from 3 to 5 mice per group: *P < 0.05. Repression of tumor growth was assessed by measuring the length (L) and width (W) of the tumors. The tumor volume was calculated via the following formula: volume (mm³) = 0.52 × L × W2. Although no formal statistical power analysis was performed, the sample size (n = 3–5 per group) was determined based on prior experience with xenograft models and aimed to balance biological relevance and ethical considerations. No formal randomization method was used. However, mice with comparable baseline tumor volumes were grouped together to minimize allocation bias. No blinding was performed during the experiment or outcome assessment. Tumor volumes were measured using standardized caliper-based methods to reduce observer bias. All animal experiments were conducted in accordance with the institutional guidelines for the care and use of laboratory animals and were approved by the Institutional Animal Care and Use Committee (IACUC) of Yonsei University (approval number: 2022-0111).
Statistical analyses
The results are presented as the mean ± standard deviation (SD) with error bars representing the SD. Differences between groups were examined via Student’s t tests or two-way analysis of variance (ANOVA). P values were calculated via GraphPad Prism 10, and p < 0.05 was considered statistically significant.
Results
Downregulation of both HSP27 and TGFβ1 does not overcome sorafenib resistance in HCC
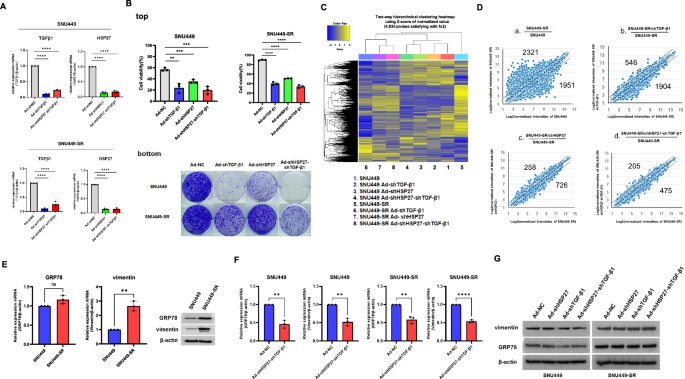
Previously, we showed that TGF-β downregulation induced stress-activated protein kinase (SAPK) activation followed by reactive oxygen species (ROS)-induced cancer cell death, sensitizing HCC to sorafenib [21]. We expected this approach to be capable of sensitizing sorafenib-resistant HCC as well, but it did not fully overcome the acquisition of sorafenib resistance in HCC in terms of short-term and long-term survival potential even after sorafenib treatment followed by TGF-β1 shRNA (Fig. 1A, B). Heat shock protein 27 (HSP27) belongs to the heat shock protein family and forms an approximately 800 kDa oligomer that functions as a molecular chaperone [32]. In addition to its chaperone function, HSP27 is a survival network regulator and a tumor cell survival mediator that, for example, affects drug resistance after gemcitabine treatment [32]. The HSP27 protein is usually overexpressed in doxorubicin-, cisplatin-, or gemcitabine-induced drug-resistant cancer cells and acts as an apoptosis inhibitor [33, 34]. Given the influence of HSP27 on resistance to other drugs, we investigated whether HSP27 is involved in sorafenib-resistant HCC (HCC-SR). The downregulation of HSP27 also reduced the viability and long-term survival of SNU449 but did not reduce the long-term survival of sorafenib-resistant SNU449 (SNU449-SR) (Fig. 1A bottom). Next, we examined whether downregulation of HSP27 and TGF-β1 overcomes sorafenib resistance on the basis of previous findings of versatile tumor cell death following HSP27 and TGF-β1 downregulation [35]. Unexpectedly, we confirmed that shHSP27/shTGF-β1 treatment was not sufficient to overcome acquired sorafenib resistance in SNU449 cells in terms of both short- and long-term survival (Fig. 1A, top right, bottom). We also assessed transcription profiles by comparing HSP27 and TGF-β1 downregulation in SNU449 cells with sorafenib resistance. The microarray results indicated that, unlike SNU449, combined shHSP27/shTGF-β1 treatment did not sufficiently sensitize SNU449-SR cells (Fig. 1B, C). Additionally, the effects of shHSP27/shTGF-β1 treatment on SNU449-SR cells fluctuated less than those of shHSP27 alone or shTGF-β1 alone in the microarray analyses (Fig. 1B and 1C-b, c, d). In other words, in SNU449, the gene expression difference increased with Ad-shTGF-β1 < Ad-shHSP27 < Ad-shHSP27-shTGF-β1; in SNU449-SR, the gene expression difference increased as Ad-shHSP27-shTGF-β1 < Ad-shHSP27< Ad-shTGF-β1. Simultaneous downregulation of both HSP27 and TGF-β1 was effective in SNU449, but shTGF-β1 was not effective in SNU449-SR. This finding was consistent with the results of the clonogenic assay (Fig. 1A, bottom), indicating the urgent need for targets, including a counterpart of shTGF-β1, to overcome sorafenib resistance. The mRNA expression of the heat shock protein GRP78, a potential candidate for the occurrence of sorafenib resistance [6], did not clearly increase in SNU449-SR, but protein expression was increased compared to SNU449, although the expression of both the mRNA and protein of vimentin, which is also a chemotherapeutic target [36], increased (Fig. 1D), suggesting GRP78 protein became more stable during sorafenib resistance without increase of GRP78 transcription. Downregulation of both HSP27 and TGF-β1 mRNA reduced GRP78 mRNA expression by 30–40% in both SNU449 and SNU449-SR cells (Fig. 1E). In contrast, the protein level of GRP78 decreased in SNU449 but not in SNU449-SR (Fig. 1F), suggesting. downregulation of both HSP27 and TGF-β1 mRNA does not overcome sorafenib resistance in HCC.

A Validation of TGF-β1 and HSP27 mRNA downregulation in SNU449 and sorafenib-resistant SNU449 (SNU449-SR)cells was examined by quantitative real-time PCR after 36 h of infection with adenovirus expressing shRNA targeting TGF-β1, shRNA targeting HSP27 or shRNAs targeting HSP27/TGF-β1 at an MOI of 100. B (top) Cell viability of SNU449 and sorafenib-resistant SNU449 (SNU449-SR) cells was examined after 24 h of infection with adenovirus expressing shRNA targeting TGF-β1, shRNA targeting HSP27 or shRNAs targeting HSP27/TGF-β1 at an MOI of 100, followed by sorafenib (15 μM) treatment for 24 h in HCC and sorafenib-resistant HCC. The cells were infected with adenovirus expressing nonsense shRNA as a negative control at an MOI of 100. Cell viability was tested by Trypan blue. The error bars represent the standard errors from three independent experiments. (bottom) Clonogenic assays of SNU449 and SNU449-SR cells were performed after infection with adenovirus expressing shRNA of TGF-β1 or shRNA of HSP27 or shRNAs of HSP27/TGF-β1 followed by sorafenib (15 μM) treatment in HCC and sorafenib-resistant HCC and incubation for an additional 14 days after appropriate dilution of treated samples. MOI multiplicity of infection, NC negative control. C Transcriptome profiling analysis of SNU449 and SNU449-SR through shRNA of HSP27 or shRNA of TGF-β1 or shRNAs of HSP27/TGF-β1. The expression values of the DEGs are shown in a heatmap. Gene expression levels are visualized as row-standardized z-scores ranging from green (−1) to red (+1) across all samples. The rows are organized by hierarchical clustering analysis with complete linkage and Euclidean distance as a measure of similarity from samples of SNU449 and SNU449-SR (shRNA of HSP27 or shRNA of TGF-β1 or shRNAs of HSP27/TGF-β1). D SNU449 or SNU449-SR cells were infected with adenovirus expressing 100 MOI of shRNA of HSP27 or shRNA of TGF-β1 or shRNAs of HSP27/TGF-β1. Scatter plots of the relative probe set intensities after infection were subsequently generated. Normalized probe set intensities of various infections are plotted. The numbers indicate over 2-fold variation in intensities outside of two diagonal lines. E Cellular levels of GRP78 or vimentin mRNA (left) or protein (right) before and after acquired sorafenib resistance in SNU449 cells were examined by real-time PCR or western blotting, respectively. F SNU449 or SNU449-SR cells were infected with adenovirus expressing shRNAs of HSP27/TGF-β1 at 100 MOI, and the endogenous cellular level of GRP78 or vimentin mRNA was subsequently examined via real-time PCR after RNA extraction. The cells were infected with adenovirus expressing nonsense shRNA as a negative control (NC) at an MOI of 100. G SNU449 or SNU449-SR cells were infected with adenovirus expressing shRNA targeting HSP27, shRNA targeting TGF-β1 or shRNAs targeting HSP27/TGF-β1 at an MOI of 100. The cells were infected with adenovirus expressing nonsense shRNA as a negative control at an MOI of 100. After 48 h, the expression levels of vimentin, GRP78 and β-actin were detected via western blot analysis. The statistical significance was determined by Student’s t tests (A, E, F) or two-way analysis of variance (ANOVA)(B). Data are shown as mean values ± SD. **p < 0.01; ***p < 0.001; ****p < 0.0001; ns not significant.
GRP78 is a key mediator of sorafenib resistance
We used GRP78 siRNA to investigate whether GRP78 is an essential mediator of sorafenib resistance. The viability and survival of SNU449 or SNU449-SR cells indicated that GRP78 functions as a critical regulator of sorafenib resistance (Fig. 2A, B). Therefore, GRP78 was selected as a target to overcome sorafenib resistance, although current GRP78 downregulation alone was not yet sufficient to overcome this resistance. Next, we designed a GRP78-shRNA-expressing adenovirus to further investigate GRP78 downregulation. As a result, GRP78 shRNA targeting one of the targets originated from a published paper [5], in which GRP78 was regarded as a novel contributor to the acquisition of resistance to sorafenib in highly sensitive HCC, and the other target sequence was a two-base shift from the first. We found that GRP78 mRNA expression was reduced up to 70% by the two shRNAs derived from the two target sequences (Supplementary Fig. 1; 1st previously reported, 2nd two-base shift from the 1st). However, GRP78 protein expression was almost unchanged (data not shown), which is associated with continued sorafenib resistance. As such, the shRNAs against the target sequences of GRP78 tested in the present study did not reduce the level of the cellular GRP78 protein by up to 60%, and more potent shRNAs are needed to disrupt the homeostatic reactive chain to maintain GRP78 expression. Thus, we searched for additional candidate target sequences capable of sufficient suppression of GRP78 mRNA expression. Among the five candidate shRNA sequences screened with Genolution’s program, we validated and selected a final specific shRNA target sequence with an additional modifying loop sequence and poly A tail that was capable of suppressing GRP78 by 50−80% depending on the cell type (Fig. 2C, top) and confirmed its potency via western blotting (Fig. 2C, bottom). The potency was also confirmed via shuttle vector transfection (Fig. 2D) and viral vector infection with Ad-shGRP78 4th (Fig. 2E). Various sense strand sequences with different promoters and loop/poly A sequences are shown in Table 1. As a result, the fourth shGRP78 (Ad-shGRP78 4th) produced the most effective suppression of survival potential in the clonogenic assay (Fig. 2F). However, as noted above, downregulation of GRP78 mRNA alone, even when a potent shRNA targeting GRP78 was used, was not sufficient to completely overcome acquired sorafenib resistance (Fig. 2F).

A To verify whether GRP78 downregulation is responsible for sorafenib resistance, a siRNA targeting GRP78 was transfected into SNU449 cells or SNU449-SR cells, which were subsequently subjected to sorafenib treatment (15 μM) for 24 h, and viability was examined via MTS assay. B Clonogenic activity of SNU449 or SNU449-SR cells was examined after 24 h of transfection with GRP78 siRNA followed by sorafenib treatment (15 μM) for 24 h, after which the cells were incubated for an additional 14 days after appropriate dilution of the treated samples. C Validation of GRP78 downregulation by screening 5 different newly designed GRP78 shRNAs. Five different synthesized shRNAs were transfected into A549 or SNU449 cells for 48 h, followed by real-time PCR after RNA extraction (top) or western blotting (bottom). D Overall validation of GRP78 downregulation by screening shRNAs via shuttle vector transfection. Shuttle vector plasmid subclones for the expression of 6 different shRNAs were transfected into 293A cells for 48 h, followed by real-time PCR after RNA extraction. E The potency of selected shGRP78 was confirmed after infection of SNU449 with an adenoviral vector expressing the 4th shRNA of GRP78 at various MOIs for 48 h, followed by real-time PCR after RNA extraction (left) or western blotting (right). F Clonogenic assay of SNU449 or SNU449-SR after infection with adenovirus expressing GRP78 2nd or 4th shRNA (MOI of 100) for 48 h and incubation for an additional 14 days after appropriate dilution of the treated samples. The statistical significance was determined by Student’s t tests (C, D, E) or two-way analysis of variance (ANOVA)(A). Data are shown as mean values ± SD. *p < 0.05; **p < 0.01; ***p < 0.001; ****p < 0.0001.
Survival potential of sorafenib-resistant HCC cells is effectively decreased by combination treatment with shTGF-β1/shGRP78 and association of acquired resistance with cell surface GRP78
Next, we assessed the effects of the downregulation of various targets, such as HSP27, vimentin, and GRP78, on the viability and survival of sorafenib-resistant SNU449 cells (Fig. 3A, B). The results again indicated that GRP78 is a more important upstream regulator of the viability and survival of resistant cells than HSP27 or vimentin [5, 6]. To investigate whether acquired sorafenib resistance in SNU449 could be overcome, the combination of shTGF-β1/shGRP78 was examined, and shTGF-β1/shHSP27 was used as a control (as in our recently published paper) [35]. On the basis of the results of both the viability and clonogenic assays (Fig. 3C left, D left), combined TGF-β1/GRP78 downregulation was identified as a plausible mechanism to prevent sorafenib resistance in SNU449. These results were consistent with the results of the microarray transcription profiling, which revealed that the downregulation of both TGF-β1 and GRP78 was more effective at causing fluctuations in gene expression than the downregulation of TGF-β1 and HSP27 in sorafenib-resistant SNU449 (SNU449-SR) (Supplementary Fig. 2). Additionally, in SNU449-SR cells, the difference in gene expression was as follows: Ad-shTGF-β1-shHSP27 < Ad-shGRP78 < Ad-shTGF-β1-shGRP78 (Supplementary Figs. 3 and 4). We also investigated the SNU398 HCC cell line, which is more sensitive to sorafenib since the IC50 was less than that for SNU449 cell line, likely due to more rapid proliferation with higher sensitivity. Unlike the results of the viability assay, which were similar in SNU449 cells (Fig. 3C), the clonogenic assay results strongly related to long-term survival showed a somewhat different pattern, specifically indicating less facilitation of overcoming sorafenib resistance by shTGF-β1/shGRP78 in SNU398-SR than in SNU449-SR (Fig. 3D). Next, we investigated the cell surface expression of GRP78, considering its reported role in resistance to anticancer therapies [11]. As shown in Fig. 3E, F, the acquisition of sorafenib resistance in both SNU449 and SNU398 cells was especially associated with increases in GRP78 at the cell surface. The cell surface GRP78 protein level in SNU449-SRs decreased slightly after PI3K inhibition, but decreased significantly in SNU398-SRs probably owing to the different amount of increased cell surface GRP78 (Fig. 3E, F). The decrease of cell surface GRP78 after PI3K inhibition suggests that the PI3K-Akt signaling cascade maintain GRP78 protein stability at the cell surface [19]. As our previous study revealed that TGF-β1 downregulation decreased the level of phosphorylated Akt [37], we further examined whether TGF-β1 downregulation had an effect on GRP78 at the transcriptional level. Figure 3G shows that downregulation of TGF-β1 and GRP78 strongly inhibited the transcription of GRP78. This combination also had the greatest effect on the decrease in csGRP78 in SNU449-SR cells (Fig. 3H, lane 4), whereas it likely had a weaker effect on downregulating both TGF-β1 and GRP78 on csGRP78 in the case of SNU398-SR cells because of both lower viral infectivity and higher proliferation rate (Fig. 3I, lane 4). These results were consistent with Fig. 3D, implying the association of acquisition of sorafenib resistance with cell surface GRP78.

A The viability of SNU449, sorafenib-resistant SNU449 (SNU449-SR), SNU398 and sorafenib-resistant SNU398 (SNU398-SR) cells was examined after 48 h of infection with adenoviruses expressing shHSP27, shTGF-β1, shGRP78 or shvimentin at an MOI of 100. The cells were infected with adenovirus expressing nonsense shRNA as a negative control at an MOI of 100. Cell viability was tested via the MTS assay. B Clonogenic assays of SNU449, sorafenib-resistant SNU449 (SNU449-SR) (left), SNU398, and sorafenib-resistant SNU398 (SNU398-SR) (right) were performed after 48 h of infection with adenoviruses expressing shHSP27, shTGF-β1, shGRP78, or shvimentin and incubated for an additional 14 days after appropriate dilution of the treated samples. C Cell viability of the SNU449, sorafenib-resistant SNU449 (SNU449-SR), SNU398, and sorafenib-resistant SNU398 (SNU398-SR) strains was examined after 48 h of infection with adenoviruses expressing shTGF-β1, shHSP27/shTGF-β1, or shTGF-β1/shGRP78. The cells were infected with adenovirus expressing nonsense shRNA as a negative control at an MOI of 100. Cell viability was tested via both the Trypan blue assay or the MTS assay (supplementary Fig. 2), respectively. D Clonogenic assays of SNU449, sorafenib-resistant SNU449 (SNU449-SR) (left), SNU398 and sorafenib-resistant SNU398 (SNU398-SR) (right) were performed after 48 h of infection with adenovirus expressing shHSP27/shTGF-β1, shTGF-β1/shvimentin or shTGF-β1/shGRP78, and the cells were incubated for an additional 14 days after appropriate dilution of the treated samples. E The surface GRP78 of SNU449 cells after acquired sorafenib resistance or LY294002 pretreatment (150 μM, 1 h) was measured via biotinylation, followed by the precipitation of avidin-agarose beads and the release of cell surface proteins for the detection of GRP78 on the cell surface via western blotting. F The levels of GRP78 on the SNU398 cell surface after acquired sorafenib resistance or LY294002 pretreatment (150 μM, 1 h) were measured via biotinylation, followed by the precipitation of avidin-agarose beads and the release of cell surface proteins for the detection of GRP78 on the cell surface via western blotting. G GRP78 mRNA levels in SNU449 cells with sorafenib resistance were measured after adenoviral infection with shRNAs expressing TGF-β1, GRP78 or both TGF-β1 and GRP78. H Cell surface GRP78 levels in SNU449 cells after acquired sorafenib resistance were measured after adenoviral infection with shRNAs expressing TGF-β1, GRP78, or both TGF-β1 and GRP78. I Cell surface GRP78 expression in SNU398 cells after acquired sorafenib resistance was measured after adenoviral infection with shRNAs expressing TGF-β1, GRP78, or both TGF-β1 and GRP78. The statistical significance was determined by Student’s t tests. Data are shown as mean values ± SD. **p < 0.01; ***p < 0.001; ****p < 0.0001.

A Phosphorylation of Akt, ERK, JNK, p38, and HSP27, including IRE1α, was examined in SNU449 or SNU398 cells after sorafenib treatment (10 μM and 5 μM, respectively) in a time-dependent manner. The numbers indicate the relative band intensity of various phosphorylated proteins corresponding to their own control proteins after sorafenib treatment in a time-dependent manner. B Total cellular and cell surface levels of GRP78 were examined in SNU449 or SNU398 cells after sorafenib treatment (10 μM and 5 μM, respectively) in a time-dependent manner. After sorafenib treatment, GRP78 in the cell lysate was examined via western blotting, whereas the expression of the cell surface GRP78 (csGRP78) protein was measured after biotintylation, followed by avidin pulldown of the cells. The numbers indicate the relative band intensity csGRP78 corresponding to total GRP78 protein after sorafenib treatment in a time-dependent manner. C The surface of GRP78 was examined in SNU449 or SNU398 cells after treatment with NAC (10 μM, 2 h), a p38 inhibitor (SB203580, 20 μM, 1 h), a PI3K inhibitor (LY294002, 20 μM, 1 h), a JNK inhibitor (SP600125, 20 μM, 1 h), a JNK/p38 activator (AEBSF, 10 μM, 1 h), or an IRE1α inhibitor (20 μM, 1 h) before sorafenib treatment (10 μM, 5 μM for 2 h). The numbers indicate the relative band intensity of various phosphorylated proteins or cell surface proteins corresponding to their own control proteins after sorafenib treatment and/or various inhibitor. Each band intensity was measured using a densitometer. D Phosphorylation of IGF1R, CD44, and cell surface CD44 (csCD44) was examined in SNU449 or SNU398 cells after sorafenib treatment (10 μM or 5 μM) in a time-dependent manner. The numbers indicate the relative band intensity of phosphorylated IGF-1R protein or csCD44 corresponding to its own control protein after sorafenib treatment in a time-dependent manner. Each band intensity was measured using a densitometer. E (top) CD44 involvement in the process of acquired sorafenib resistance was demonstrated by CD44 downregulation during sorafenib treatment (2 h). SNU449 cells (left) or SNU398 cells (right) infected with adenovirus expressing shRNA against CD44 were treated with sorafenib for 2 h. Then, the phosphorylation of IGF1R, Akt, ERK, and CD44 at the cell surface membrane and total cell lysate was detected. The numbers indicate the relative band intensity of various phosphorylated proteins or cell surface proteins corresponding to their own control proteins after sorafenib treatment and/or CD44 downregulation. Each band intensity was measured using a densitometer. (bottom) The viability of SNU449 (left) cells was examined after 48 h of infection with adenovirus expressing shCD44 with or without sorafenib (10 μM, 2 h) via the Trypan blue assay. The viability of SNU398 (right) cells was examined after stable retroviral infection with pBabe-puro-CD44. After 2 days of sorafenib treatment (5 μM), cell viability was tested via the Trypan blue assay. F (top) SNU449 cells (left) or SNU398 cells (right) were lysed after sorafenib treatment for 2 h and subjected to immunoprecipitation with anti-GRP78 antibodies to detect the interaction between GRP78 and IGF1R (bottom). GRP78 mRNA expression was examined after 2 days of sorafenib treatment via real-time PCR after RNA extraction from SNU449 cells or SNU398 cells. The statistical significance was determined by Student’s t tests (E, right) or two-way analysis of variance (ANOVA)(E, left). Data are shown as mean values ± SD. *p < 0.05; ***p < 0.001; ****p < 0.0001.
Sorafenib-induced GRP78 accumulation at the cell surface is triggered by pIRE1α activation
Our initial experiments indicated that cell surface GRP78 (csGRP78) is involved in sorafenib resistance. We next investigated the mechanisms underlying the translocation of ER-resident GRP78 to the cell surface to induce Akt activation [38]. The presence of cell surface-associated GRP78 has primarily been reported in chemotherapy-resistant cancer and in tissues or cells experiencing metabolic stress, including that induced by hypoxia, glucose starvation, or radiation [11, 14]. However, the mechanisms underlying the stress-induced translocation of GRP78 to the cell surface have not been fully elucidated [13]. When GRP78 is overexpressed, a certain fraction can escape motif retention and translocate to the cell surface [12, 14]. Unlike the phospho-Akt/phospho-ERK of SNU398 during sorafenib treatment, those of SNU449 were quickly reactivated upon sorafenib-mediated inhibition of the Akt and ERK signaling pathways and dramatic inactivation of p38 accompanied by a low level of JNK activation (Fig. 4A). In SNU449 cells, the GRP78 protein level at the cell surface increased gradually for 2 h after sorafenib treatment (Fig. 4B). Next, we assessed whether increased csGRP78 was associated with Akt, JNK, or p38 activity or with ROS production. The results exhibited only a minor trend toward increased csGRP78 levels in SNU449 cells pretreated with the antioxidant N-acetyl cysteine (NAC) or p38 inhibitor (Fig. 4C-a,b), while Akt was not involved in the translocation of GRP78 to the cell surface (Fig. 4C-c). In fact, p38 is rapidly dephosphorylated after sorafenib treatment (Fig. 4A) because of its direct binding to p38 [39], suggesting that p38 inactivation is involved in the initial development of resistance to sorafenib [40]. Unexpectedly, the addition of the p38 activator AEBSF indicated that GRP78 translocation to the cell surface was not triggered by p38 inactivation (Fig. 4C-b, e). Instead, JNK activation seems to be more actively involved in GRP78 translocation during sorafenib treatment (Fig. 4C-d, lanes 3 and 4). Additionally, IRE1α, an ER transmembrane sensor [41, 42], was found to be more critically implicated in the sorafenib-induced translocation of GRP78 and CD44 in SNU449 cells (Fig. 4C-f, Left). In contrast to those in SNU449, the translocations of GRP78 and CD44 related to the acquisition of sorafenib resistance were relatively weak, probably due to the low cellular level of CD44 in SNU398 (Fig. 4C-f, Right).
GRP78/CD44-IGF1R signaling circuit at the cell surface is responsible for bypassing the activation of Akt during sorafenib treatment
As noted previously, initial sorafenib-induced ER stress (Fig. 4A) was correlated with GRP78 translocation to the cell surface and coincided with subsequent Akt reactivation (Fig. 4A, B), which was initially stimulated by IRE1 signaling activation. Next, we examined whether other factors are involved in sorafenib-induced GRP78 accumulation at the cell surface followed by Akt reactivation. Similar patterns to those of csGRP78 were also observed for phospho-IGF1R and csCD44 (Fig. 4D, left). However, no other RTKs, such as EGFR or c-Met, were changed (data not shown). These data suggest that the IRE1-csGRP78/csCD44 signaling circuit may play an essential role in sorafenib resistance and the upregulation of alternative pathways through bypass, such as the ability of IGF1R to counteract VEGFR, PDGFR, and c-Kit inhibition by sorafenib [43], which is responsible for parallel further Akt activation. Intriguingly, a small amount of CD44 newly appeared in SNU398 cells after sorafenib treatment, concomitant with a lower level of phosphorylated IGF1R than in SNU449 cells (Fig. 4D, right). The involvement of CD44 in bypass activation during sorafenib treatment was also demonstrated by CD44 downregulation concomitant with decreased phospho-IGF1R, phospho-Akt and cell surface GRP78 levels (Fig. 4E, top left) in addition to sensitization to sorafenib treatment in SNU449 cells (Fig. 4E, bottom left). Owing to the lack of increases in phospho-IGF1R and phospho-Akt despite the additional supply of CD44 (Supplementary Fig. 5), efficient CD44 trafficking to the cellular membrane is still needed. For example, IRE1-dependent additional glycosylation, such as fucosylation to CD44, which is sufficient for CD44 trafficking after sorafenib treatment, is indispensable for rewiring CD44-GRP78-IGF1R signaling in SNU398. However, unexpectedly, by increasing the cellular CD44 level, SNU398 did not increase IGF1R or Akt activity (Fig. 4E, top right), with no recovery of cell viability even after extended sorafenib treatment (Fig. 4E, bottom right). The reason why acquired resistance caused by bypass activation was insignificant in SNU398 is likely that CD44-GRP78-IGF1R signaling was not fully wired due to both low cellular and cell surface levels of CD44 (Fig. 4D, right), which caused oncogenic shock during sorafenib treatment rather than the acquisition of sorafenib resistance [44]. In conclusion, csGRP78 functions as a coreceptor for ligands that signal the activation of the kinase Akt [14] by activating IGF1R after further interaction with IGF1R, resulting in increased amounts of GRP78-IGF1R interaction after sorafenib treatment in SNU449 cells (Fig. 4F, top). These rewiring processes increase GRP78 mRNA expression (Fig. 4F, bottom) and complete a feedback circuit between IGF1R and GRP78 with the help of CD44 [45]. This positive feedback circuit is responsible for the sustained acquisition of sorafenib resistance.
HSP27 dephosphorylation is necessary for the maintenance of cytoplasmic CD44
In addition to the primary role of sorafenib as an RTK inhibitor, it is known to be a specific p38α allosteric binding inhibitor [39], suggesting that the downstream substrate of HSP27 can be efficiently dephosphorylated. As shown in Fig. 4A, phosphorylated p38 in both SNU449 and SNU398 was completely dephosphorylated concomitant with HSP27 dephosphorylation. Interestingly, the CD44 protein in SNU398 cells was almost undetectable after sorafenib treatment (Fig. 4D) and confirmed the repression of the proteasomal degradation of CD44 by sorafenib (Fig. 5A, right), although distinguishing the repression of the proteasomal degradation of CD44 in SNU449 cells was difficult because of the high CD44 level (Fig. 5A, left). Figure 5B (right) shows that the appearance of CD44 after sorafenib treatment was caused by the chaperone activity of HSP27 dephosphorylated by 3 A addition [46], whereas HSP27 downregulation specifically decreased cytosolic and cell surface CD44 (Fig. 5C). On the other hand, GRP78 downregulation appears to reduce the level of CD44 on the cell surface, but there was little to no reduction of CD44 in the cytosol (Fig. 5D), suggesting that the HSP27 functions as a chaperone for CD44 in the cytosol, while GRP78 functions as a chaperone for CD44 at the cell surface.

A SNU449 cells (left) or SNU398 cells were pretreated with MG132 (20 μM, 1 h) before sorafenib treatment (10 μM, 5 μM for 2 h, respectively). GRP78 and CD44 at the cell surface membrane, as well as their total cell lysates, were subsequently examined. B Wild-type HSP27, nonphosphorylatable HSP27(3A) (Serine 15,78,82 alterations to alanine) and phosphomimetic HSP27(3D) (Serine 15,78,82 alterations to aspartic acid) mutant plasmids were transfected into the SNU449 (left) or SNU398 (right) strains. The phosphorylation of IGF1R, Akt, ERK, or HSP27 was subsequently examined. CD44 at the cell surface membrane as well as its total cell lysate were also examined. C SNU449 (left) or SNU398 (right) cells infected with adenovirus expressing HSP27 shRNA were treated with sorafenib for 2 h. Then, the phosphorylation of IGF1R, Akt, ERK, or IRE1α was examined. GRP78 and CD44 at the cell surface membrane, as well as their total cell lysates, were also examined. D SNU449 cells infected with adenovirus expressing shRNA targeting GRP78 were treated with sorafenib for 2 h. Then, the phosphorylation of IGF1R, Akt, GRP78, and CD44 at the cell surface membrane and total cell lysates was also examined. The numbers indicate the relative band intensity of various phosphorylated proteins or cell surface proteins corresponding to their own control proteins after sorafenib treatment and/or GRP78 downregulation. Each band intensity was measured using a densitometer. E SNU449 cells were lysed and subjected to immunoprecipitation with anti-HSP27 (top, left) or anti-GRP78 antibodies (top, right) to detect the interaction between HSP27 and CD44 or between GRP78 and CD44 in total cell lysate before sorafenib treatment (left) or after sorafenib treatment (right). F SNU449 cells were lysed and subjected to immunoprecipitation with anti-HSP27 (left) or anti-GRP78 antibodies (right) to detect the interaction between HSP27 and CD44 or between GRP78 and CD44 after sorafenib treatment in a time-dependent manner. G SNU449 and SNU398 were cultured in confocal plates at 1 × 10⁵ cells/well and incubated with sorafenib at 10 μM and 5 μM, respectively. Then, the cells were fixed in 4% PFA for 15 min at room temperature and incubated with primary antibodies against CD44, HSP27, CD44 or GRP78 at room temperature for 2 h, followed by incubation with Alexa Fluor 488-conjugated anti-rabbit IgG antibody or Alexa Fluor 647-conjugated anti-mouse IgG antibody at room temperature for 1 h to obtain fluorescence images. Nuclei were stained with DAPI at room temperature for 5 min. H SNU449 and SNU398 were cultured in confocal plates at 1 × 10⁵ cells/well and incubated with sorafenib at 10 μM and 5 μM, respectively. Then, the cells were treated with both MemBrite® 543/560 cell surface prestaining solution at 37 °C for 5 min and MemBrite® solution at 4 °C for 30 min to capture Z-stack confocal images.
CD44/GRP78 interaction is increased after sorafenib treatment, followed by membrane trafficking
Overall, we identified protein interactions between HSP27 and CD44, as well as between GRP78 and CD44, before and after sorafenib treatment (Fig. 5E). As shown in Fig. 5E, protein interactions between HSP27 and CD44 or between CD44 and GRP78 were confirmed after sorafenib treatment, and the interaction increased after 2 h of sorafenib treatment (Fig. 5F). As suggested by Gopal et al., masking of the KDEL motif by glycosylation or other modifications to the GRP78 protein sequence adjacent to KDEL can lead to its release from the ER. After escaping from the ER, GRP78-interacting protein partners such as CD44 may facilitate its transport from the ER to the cell surface [14]. To confirm the increased trafficking to the plasma membrane after the interaction of HSP27/CD44 and CD44/GRP78, confocal fluorescence microscopy was also performed. When the cells were treated with sorafenib, GRP78 tended to spread more toward the membrane, and the orange portion that appeared to be colocalized also moved around the nucleus toward the membrane. However, the location of the site was not clear enough to clearly distinguish the degree (Fig. 5G), and it was additionally applied by changing to the 3D imaging method with Z-stacks to check whether it migrated toward the cell surface. 3D imaging revealed a clear CD44 pattern moving into the membrane, as confirmed by MemBrite (Fig. 5H). GRP78 has also been shown to migrate along the membrane during sorafenib treatment (Fig. 5G, H).
Additional glycosylation is responsible for the enhanced acquisition of sorafenib resistance
We postulated that somewhat different patterns of membrane trafficking of GRP78 or CD44 might contribute to increased Akt activation, leading to acquired sorafenib resistance. To test this hypothesis, we examined fucosyltransferase (FUT) isotype expression in HCC cells, given that increased fucosylation is a signature of malignant cell transformation characterized by uncontrolled proliferation, tumor cell invasion, angiogenesis, metastasis, and therapy resistance [47]. Initial investigations into various FUT isotypes, including FUT1, FUT3, and FUT7, following sorafenib treatment revealed the presence of FUT1 and FUT3, whereas FUT7 was not detected (data now shown). To determine whether FUT1, which represents α(1,2)-fucosyltransferase, or FUT3, which represents α(1,3)-fucosyltransferase, is involved in CD44 fucosylation during sorafenib treatment, which is important for mesenchymal stem cell homing to target tissues as well as tumor progression [17, 18], 2-deoxy-D-galactose (2DGal), a specific inhibitor of fucoglycoprotein (α-(1,2) fucosylation) synthesis [48], was used. We confirmed a decrease in the levels of phospho-IGF1R and cell surface CD44/cell surface GRP78 after 2DGal pretreatment followed by sorafenib treatment (Fig. 6A), suggesting that at least FUT-1-mediated CD44 fucosylation or GRP78 fucosylation was mediated by sorafenib-induced IRE1-CD44/GRP78-IGF1R activation (Fig. 6B). CD44 fucosylation by FUT1 after sorafenib treatment was confirmed by the detection of blood group H antigen, a biomarker of FUT1 (Fig. 6C, left), but not the presence of fucosylated GRP78 (data not shown). Intriguingly, owing to the lower cellular level of FUT1 in SNU398 than in SNU449, the series of IGF1R-Akt activation after sorafenib treatment was not completed only by replenishing CD44 (Fig. 6C, Right) but should be preceded by a higher level of FUT1-mediated CD44 fucosylation (Fig. 6A, B, C).

A SNU449 (left) or SNU398 (right) cells were pretreated with 2DGal (10 mM, 12 h) before sorafenib treatment (10 μM, 5 μM for 2 h, respectively). GRP78 and CD44 at the cell surface membrane, as well as their total cell lysates, were subsequently examined. Phosphorylated IGF1R, IGF1R, and FUT1 proteins in cell lysates were also examined. B SNU449 (left) or SNU398 (right) cells were pretreated with 2DGal (10 mM, 12 h) before sorafenib treatment (10 μM, 5 μM for 2 h, respectively). Then, the cells were lysed and subjected to immunoprecipitation with an anti-GRP78 antibody to detect the interaction between GRP78 and CD44 in total cell lysates. C After CD44-overexpressing SNU398 cells were selected via retroviral infection with pBabe-puro-CD44, the selected cells were treated with sorafenib (5 μM, 2 h). Then, the cells were lysed and subjected to immunoprecipitation with an anti-CD44 antibody to detect the interaction between CD44 and fucosylation-related factors and H antigen from total cell lysate (right). (D) Sorafenib-resistant SNU398 (SNU398-SR) tumors were grown in male BALB/c nude mice. Tumors were established via the subcutaneous injection of 2 × 10⁶ cells and were allowed to grow to an average size of 70–120 mm3. PBS and adenoviruses were intratumorally injected twice every other day. Oncolytic adenoviruses coexpressing shHSP27-shTGF-β1 or shTGF-β1-shGRP78, shHSP27-shTGF-β1-shHIF1α or shTGF-β1-shGRP78-shHIF1α were intratumorally injected into SNU398-SR tumors. Tumor growth was measured every 2 days for more than 14 days via calipers. The arrows indicate when the oncolytic adenovirus was administered. The statistical significance was determined by two-way analysis of variance (ANOVA). Data are shown as mean values ± SD. **p < 0.01; ****p < 0.0001; ns not significant.
Downregulation of TGF-β1 and GRP78 suppresses tumor progression in sorafenib-resistant SNU398 HCC cells
Owing to the unexpectedly very low tumorigenic potential of SNU449 and SNU449-SR when they are implanted in BALB/c athymic nude mice, SNU398-SR, which results in less facilitation of overcoming sorafenib resistance by shTGF-β1/shGRP78 than SNU449-SR does (Fig. 3D), was chosen as an alternative. In fact, the downregulation of TGF-β1 and GRP78, as well as that of TGF-β1 and HSP27, was not satisfactory to induce tumor suppression in sorafenib-resistant SNU398 HCC cells (Fig. 6D), despite a previous report of reduced Akt activation due to TGF-β1 downregulation in vitro [21]. These findings suggest the presence of another unidentified target, especially for tumor suppression, in vivo. Tumor cells such as SNU398 cells, which have a relatively high proliferation rate, inevitably confront tumor hypoxia because of an insufficient oxygen supply from the existing vasculature [49]. Hypoxia impedes the replication and spread of adenoviruses in established tumors, potentially limiting their effectiveness in eradicating solid tumors [50]. Therefore, shRNAs targeting HIF-1α were used to downregulate HIF-1α in the hypoxic tumor microenvironment to block neovascularization, which is a key characteristic of the tumor microenvironment [25], but not under in vitro normoxic conditions (Supplementary Fig. 6), and facilitate continued viral replication [50]. As a result, further inhibition of HIF1-α expression with TGF-β1/GRP78 significantly retarded tumor progression in murine models (Fig. 6D).
Discussion
Our results suggest that acquired resistance to anticancer drugs is initiated by changes in the activity patterns of chaperone proteins. Many previous studies have reported that the GRP78 chaperone protein is overexpressed in tumors and is responsible for the development of acquired resistance induced by sorafenib [6, 51]. According to Wang et al. [52], when ER stress occurs, GRP78 is released from ER-transmembrane signaling molecules such as ATF6, IRE1, and PERK. In our study, we postulate that one mechanism of sorafenib resistance involves enhancing the stability of GRP78 at the cell surface through a PI3K/Akt-activated positive feedback loop [53] following sorafenib-induced trafficking to the cell surface. A reduction in GRP78 protein expression at the cellular level, especially at the surface membrane, is required to overcome sorafenib resistance. However, in SNU449 cells (Fig. 1B, Top), neither TGF-β1 downregulation nor shTGF-β1/shHSP27 (both of which are able to kill various tumor cell types [35]) could overcome sorafenib resistance (Fig. 1B, Top, Bottom). Targeting PI3K/Akt signaling alone is not sufficient to overcome acquired sorafenib resistance arising from ER stress-induced accumulation of GRP78 mRNA and cell surface expression [53]. Single treatment with a replication-incompetent adenovirus expressing shRNA for HSP27, GRP78, or TGF-β1 in sorafenib-resistant HCC cells was not able to overcome sorafenib resistance, even though such treatment was effective in HCC cells without sorafenib resistance. To date, no clinically useful biomarker that can predict the reversal of the acquisition of sorafenib resistance has been identified, with the exception of one report that assessed the effects of a combination of MK2206 (an Akt inhibitor) and capmatinib (a c-Met inhibitor) on sorafenib-resistant HCC. The study suggested that sorafenib resistance was overcome only when both Akt and ERK were inhibited [54]. Interestingly, SNU449 strongly induced sorafenib resistance by bypassing the activation of both Akt/ERK, whereas SNU398, which has increased Akt and ERK phosphorylation, was easily dephosphorylated by sorafenib treatment, which was concomitant with decreased acquired resistance. A reduction in Akt and ERK phosphorylation following sorafenib treatment was clearly observed in SNU398 cells. SNU398 has a faster proliferation rate and concomitantly greater Akt/ERK phosphorylation (also referred to as kinase hyperactivation) but is easily disrupted by sorafenib. Intriguingly, the main difference between SNU398 and SNU449 is that there is a general deterioration in survival signals closely related to cancer progression, particularly lower endogenous levels of CD44 and FUT1 in SNU398, and IGF1R also rewires with CD44-GRP78, similar to SNU449. However, acquired resistance signaling is slowly reinstated after typical sorafenib inhibition of VEGFR, PDGFR, and c-Kit. CD44 expression in SNU398 cells was barely detectable after sorafenib treatment, and the inhibition of proteasomal degradation or lysosomal degradation mediated by phosphorylated HSP27 was revealed. In other words, following sorafenib treatment, dephosphorylated HSP27 becomes a chaperone of CD44 in the cytosol to increase its stability, and subsequently, fucosylated CD44 then functions as a chaperone of GRP78 at the surface membrane to maintain survival signaling pathways (Fig. 4E, left). In addition to being a cancer progression marker according to our previously published paper of Fig. 1B, SNU398 [35], gene fluctuations caused by HSP27 downregulation were most strongly affected in SNU398, indicating that HSP27 downregulation effectively induced long-term cell death (Fig. 3D, right).
On the other hand, the rapid recovery of Akt and ERK activity in SNU449 cells after sorafenib treatment (Fig. 4A, left) is likely due to a signal redundancy mechanism through bypass activation [43], which leads to greater acquisition of sorafenib resistance than SNU398 does. Unlike SNU398, SNU449 has additional survival options through the IGF1R-RAS-ERK and IGF1R-PI3K-Akt pathways, which render the SNU449 HCC subtype superior to SNU398 in terms of adaptation and resistance to sorafenib. In brief, the difference between these two HCC subtypes is that the acquisition of sorafenib resistance in SNU449 is initiated by the activation of IRE1-induced relief of GRP78 followed by concomitant CD44 trafficking to the membrane without timely lapse and, as a result, bypasses the activation of immediate protective mechanisms through Akt and ERK, whereas insufficient acquired resistance results from oncogenic shock in SNU398, with the suppression of both proliferation and survival after the inhibition of targets responsible for oncogene addiction [44, 55]. More interesting questions are how GRP78 reaches the cell surface after sorafenib treatment and how cells can sense and respond to sorafenib treatment to increase Akt activity compared with that in the resting state, at which point GRP78 and CD44 are also detected at the cell surface and how ERK is activated. Relatively weaker survival signaling activation is related to the trafficking of GRP78 and CD44 in the resting state without interactions between them. One specific initial process during sorafenib treatment is the interaction of CD44 and GRP78 (Fig. 5E, F), but an earlier reaction than the previous interaction involves IRE1-dependent FUT1 fucosyltransferase activation related to CD44 fucosylation, leading to GRP78 trafficking (Fig. 6B, C). During the stabilization process, GRP78 phosphorylated by JNK or ERK begins to interact with fucosylated CD44 in the cytosol. Without CD44, especially fucosylated CD44, released and/or phosphorylated GRP78 from the ER cannot move efficiently to the membrane. On the basis of our experimental results, SNU449 already establishes its own network circuit for compensatory resistance triggered by increased trafficking of CD44-GRP78. However, as shown in Fig. 4A, B, the SNU398 cell line was more sensitive to sorafenib, with less GRP78 translocation and no Akt reactivation. The greater sensitivity of SNU398 cells to sorafenib was associated with sustained Akt/ERK dephosphorylation, which possibly originated from a weaker CD44-IGF1R-PI3K signaling circuit. To increase sorafenib resistance, the first step in the development of sorafenib resistance is IRE1-mediated fucosylation of CD44 and trafficking of CD44-GRP78 to the membrane. The second step is the rewiring of the IGF1R circuit through CD44-GRP78, which is translocated to the surface membrane to maintain IGF1R activation [56]. No feedback reactivation was observed in SNU398 without GRP78 trafficking owing to the very low level of CD44 compared with that in SNU449. Figure 7 shows a comparative schematic diagram of how two HCC cell lines differentially develop sorafenib resistance depending on their cellular context such as CD44.

A SNU449 cells are less sensitive to sorafenib and maintain a high level of CD44. Upon sorafenib treatment of SNU449, rapid p38 inactivation occurs, resulting in decreased Akt/ERK activity due to inactivation of PDGFR, VEGFR, and c-Kit. Independent of the induction of decreased cell viability, sorafenib-induced ER stress activates IRE1α along with apoptosis. The activation of IRE1α is associated with an increase in CD44 fucosylation and JNK phosphorylation, which leads to an increase in the binding of CD44 and GRP78, followed by an increase in these complexes in the cell membrane concomitant with efficient rewiring of the GRP78-IGF1R-PI3K-Akt signaling cascade to provide strong survival potential as well as a continuous positive feedback loop, resulting in sustained strong sorafenib resistance. B SNU398 is associated with increased sensitivity to sorafenib. Compared with SNU449 cells, SNU398 cells presented lower baseline CD44 expression and weaker survival signaling pathways. Upon sorafenib treatment, the inhibition of Akt and ERK phosphorylation is more sustained, leading to a weaker acquisition of resistance. Unlike in SNU449, the CD44‒GRP78 interaction is less prominent because of the reduced expression of CD44, and lower fucosylation activation leads to lower activation of the IGF1R‒PI3K‒Akt signaling cascade, which makes SNU398 less capable of sustaining resistance after sorafenib treatment.
Conclusions
We demonstrated that the efficient rewiring of the GRP78-IGF1R-PI3K-Akt signaling cascade after sorafenib treatment provided strong survival potential as well as a continuous positive feedback loop, resulting in sustained strong sorafenib resistance. These findings will potentially lead to a great advancement in strategies for cancer therapies aimed at overcoming the development of anticancer drug resistance.
Data availability
The authors confirm that the data supporting the findings of this study are available within the article and its Supplementary Figures. The microarray data have been deposited in the NCBI GEO database (GSE294038). Raw data that support the findings of this study are available from the corresponding author (JJS), upon reasonable request.
References
-
Fan G, Wei X, Xu X. Is the era of sorafenib over? A review of the literature. Ther Adv Med Oncol. 2020;12:1758835920927602.
-
Finn RS, Qin S, Ikeda M, Galle PR, Ducreux M, Kim T-Y, et al. Atezolizumab plus bevacizumab in unresectable hepatocellular carcinoma. N Engl J Med. 2020;382:1894–905.
-
Méndez-Blanco C, Fondevila F, García-Palomo A, González-Gallego J, Mauriz JL. Sorafenib resistance in hepatocarcinoma: role of hypoxia-inducible factors. Exp Mol Med. 2018;50:1–9.
-
Wang S, Wang Y, Xun X, Zhang C, Xiang X, Cheng Q, et al. Hedgehog signaling promotes sorafenib resistance in hepatocellular carcinoma patient-derived organoids. J Exp Clin Cancer Res. 2020;39:22.
-
Chiou JF, Tai CJ, Huang MT, Wei PL, Wang YH, An J, et al. Glucose-regulated protein 78 is a novel contributor to acquisition of resistance to sorafenib in hepatocellular carcinoma. Ann Surg Oncol. 2010;17:603–12.
-
Feng YH, Tung CL, Su YC, Tsao CJ, Wu TF. Proteomic profile of sorafenib resistance in hepatocellular carcinoma; GRP78 expression is associated with inferior response to sorafenib. Cancer Genom Proteom. 2019;16:569–76.
-
Conner C, Lager TW, Guldner IH, Wu MZ, Hishida Y, Hishida T, et al. Cell surface GRP78 promotes stemness in normal and neoplastic cells. Sci Rep. 2020;10:3474.
-
Gifford JB, Huang W, Zeleniak AE, Hindoyan A, Wu H, Donahue TR, et al. Expression of GRP78, master regulator of the unfolded protein response, increases chemoresistance in pancreatic ductal adenocarcinoma. Mol Cancer Ther. 2016;15:1043–52.
-
Tseng CC, Stanciauskas R, Zhang P, Woo D, Wu K, Kelly K, et al. GRP78 regulates CD44v membrane homeostasis and cell spreading in tamoxifen-resistant breast cancer. Life Sci Alliance. 2019;2:e201900377.
-
Zhang XX, Li HD, Zhao S, Zhao L, Song HJ, Wang G, et al. The cell surface GRP78 facilitates the invasion of hepatocellular carcinoma cells. Biomed Res Int. 2013;2013:917296.
-
Amaresan R, Gopal U. Cell surface GRP78: a potential mechanism of therapeutic resistant tumors. Cancer Cell Int. 2023;23:100.
-
Ibrahim IM, Abdelmalek DH, Elfiky AA. GRP78: a cell’s response to stress. Life Sci. 2019;226:156–63.
-
Tsai Y-L, Lee AS Cell surface GRP78: anchoring and translocation mechanisms and therapeutic potential in cancer. In: Cell surface GRP78, a new paradigm in signal transduction biology. Elsevier; 2018, p. 41–62.
-
Gopal U, Pizzo SV. The endoplasmic reticulum chaperone GRP78 also functions as a cell surface signaling receptor. In: Cell surface GRP78, a new paradigm in signal transduction biology. Elsevier; 2018, p. 9–40.
-
Farshbaf M, Khosroushahi AY, Mojarad-Jabali S, Zarebkohan A, Valizadeh H, Walker PR. Cell surface GRP78: An emerging imaging marker and therapeutic target for cancer. J Control Release. 2020;328:932–41.
-
Chen C, Zhao S, Karnad A, Freeman JW. The biology and role of CD44 in cancer progression: therapeutic implications. J Hematol Oncol. 2018;11:64.
-
Liao C, Wang Q, An J, Chen J, Li X, Long Q, et al. CD44 glycosylation as a therapeutic target in oncology. Front Oncol. 2022;12:883831.
-
Shi H, Jiang C, Yao H, Zhang Y, Zhang Q, Hou X, et al. CD44 fucosylation on bone marrow-derived mesenchymal stem cells enhances homing and promotes enteric nervous system remodeling in diabetic mice. Cell Biosci. 2021;11:118.
-
Liu R, Li X, Gao W, Zhou Y, Wey S, Mitra SK, et al. Monoclonal antibody against cell surface GRP78 as a novel agent in suppressing PI3K/AKT signaling, tumor growth, and metastasis. Clin Cancer Res. 2013;19:6802–11.
-
Gray MJ, Mhawech-Fauceglia P, Yoo E, Yang W, Wu E, Lee AS, et al. AKT inhibition mitigates GRP78 (glucose-regulated protein) expression and contribution to chemoresistance in endometrial cancers. Int J Cancer. 2013;133:21–30.
-
Han Z, Kang D, Joo Y, Lee J, Oh GH, Choi S, et al. TGF-beta downregulation-induced cancer cell death is finely regulated by the SAPK signaling cascade. Exp Mol Med. 2018;50:1–19.
-
Jing X, Yang F, Shao C, Wei K, Xie M, Shen H, et al. Role of hypoxia in cancer therapy by regulating the tumor microenvironment. Mol Cancer. 2019;18:1–15.
-
Wang B, Zhao Q, Zhang Y, Liu Z, Zheng Z, Liu S, et al. Targeting hypoxia in the tumor microenvironment: a potential strategy to improve cancer immunotherapy. J Exp Clin Cancer Res. 2021;40:24.
-
Zhao Y, Xing C, Deng Y, Ye C, Peng H. HIF-1alpha signaling: essential roles in tumorigenesis and implications in targeted therapies. Genes Dis. 2024;11:234–51.
-
Zhang J, Xu J, Dong Y, Huang B. Down-regulation of HIF-1α inhibits the proliferation, migration, and invasion of gastric cancer by inhibiting PI3K/AKT pathway and VEGF expression. Biosci Rep. 2018;38:BSR20180741.
-
Zeng Z, Lu Q, Liu Y, Zhao J, Zhang Q, Hu L, et al. Effect of the hypoxia inducible factor on sorafenib resistance of hepatocellular carcinoma. Front Oncol. 2021;11:641522.
-
Nakayoshi T, Adachi H, Ohbu-Murayama K, Enomono M, Fukami A, Kumagai E, et al. Plasma heat shock protein 27 is increased in renal dysfunction and habitual smoking in a Japanese general population. J Cardiol. 2016;67:110–4.
-
Hu B, Ma Y, Yang Y, Zhang L, Han H, Chen J. CD44 promotes cell proliferation in non-small cell lung cancer. Oncology Lett. 2018;15:5627–33.
-
Mizuno T, Nagao M, Yamada Y, Narikiyo M, Ueno M, Miyagishi M, et al. Small interfering RNA expression vector targeting hypoxia-inducible factor 1 alpha inhibits tumor growth in hepatobiliary and pancreatic cancers. Cancer Gene Ther. 2006;13:131–40.
-
Kang D, Han Z, Oh G-H, Joo Y, Choi HJ, Song JJ. Down-regulation of TGF-β expression sensitizes the resistance of hepatocellular carcinoma cells to sorafenib. Yonsei Med J. 2017;58:899–909.
-
Tsai Y-L, Zhang Y, Tseng C-C, Stanciauskas R, Pinaud F, Lee AS. Characterization and mechanism of stress-induced translocation of 78-kilodalton glucose-regulated protein (GRP78) to the cell surface. J Biol Chem. 2015;290:8049–64.
-
Kang D, Choi HJ, Kang S, Kim SY, Hwang YS, Je S, et al. Ratio of phosphorylated HSP27 to nonphosphorylated HSP27 biphasically acts as a determinant of cellular fate in gemcitabine-resistant pancreatic cancer cells. Cell Signal. 2015;27:807–17.
-
Kuramitsu Y, Wang Y, Taba K, Suenaga S, Ryozawa S, Kaino S, et al. Heat-shock protein 27 plays the key role in gemcitabine-resistance of pancreatic cancer cells. Anticancer Res. 2012;32:2295–9.
-
Acunzo J, Andrieu C, Baylot V, So A, Rocchi P. Hsp27 as a therapeutic target in cancers. Curr Drug Targets. 2014;15:423–31.
-
Choi S, Hong JA, Choi HJ, Song JJ. Enhanced tumor targeting and timely viral release of mesenchymal stem cells/oncolytic virus complex due to GRP78 and inducible E1B55K expressions greatly increase the antitumor effect of systemic treatment. Mol Ther Oncolytics. 2022;27:26–47.
-
Makol A, Kaur H, Sharma S, Kanthaje S, Kaur R, Chakraborti A. Vimentin as a potential therapeutic target in sorafenib resistant HepG2, a HCC model cell line. Clin Mol Hepatol. 2020;26:45.
-
Han Z, Kang D, Joo Y, Lee J, Oh G-H, Choi S, et al. TGF-β downregulation-induced cancer cell death is finely regulated by the SAPK signaling cascade. Exp Mol Med. 2018;50:1–19.
-
Zhang Y, Liu R, Ni M, Gill P, Lee AS. Cell surface relocalization of the endoplasmic reticulum chaperone and unfolded protein response regulator GRP78/BiP. J Biol Chem. 2010;285:15065–75.
-
Yang Y, Shen Y, Liu H, Yao X. Molecular dynamics simulation and free energy calculation studies of the binding mechanism of allosteric inhibitors with p38α MAP kinase. J Chem Inf Model. 2011;51:3235–46.
-
Vasilevskaya I, O’Dwyer PJ. Role of Jun and Jun kinase in resistance of cancer cells to therapy. Drug Resist Updates. 2003;6:147–56.
-
Chen Y, Brandizzi F. IRE1: ER stress sensor and cell fate executor. Trends cell Biol. 2013;23:547–55.
-
Kopp MC, Larburu N, Durairaj V, Adams CJ, Ali MM. UPR proteins IRE1 and PERK switch BiP from chaperone to ER stress sensor. Nat Struct Mol Biol. 2019;26:1053–62.
-
Chandarlapaty S, Sawai A, Scaltriti M, Rodrik-Outmezguine V, Grbovic-Huezo O, Serra V, et al. AKT inhibition relieves feedback suppression of receptor tyrosine kinase expression and activity. Cancer cell. 2011;19:58–71.
-
Pagliarini R, Shao W, Sellers WR. Oncogene addiction: pathways of therapeutic response, resistance, and road maps toward a cure. EMBO Rep. 2015;16:280–96.
-
Yin Y, Chen C, Chen J, Zhan R, Zhang Q, Xu X, et al. Cell surface GRP78 facilitates hepatoma cells proliferation and migration by activating IGF-IR. Cell Signal. 2017;35:154–62.
-
Hayes D, Napoli V, Mazurkie A, Stafford WF, Graceffa P. Phosphorylation dependence of hsp27 multimeric size and molecular chaperone function. J Biol Chem. 2009;284:18801–7.
-
Shan M, Yang D, Dou H, Zhang L. Fucosylation in cancer biology and its clinical applications. Prog Mol Biol Transl Sci. 2019;162:93–119.
-
Loong JH, Wong TL, Tong M, Sharma R, Zhou L, Ng KY, et al. Glucose deprivation-induced aberrant FUT1-mediated fucosylation drives cancer stemness in hepatocellular carcinoma. J Clin Investig. 2021;131:e143377.
-
Rashid M, Zadeh LR, Baradaran B, Molavi O, Ghesmati Z, Sabzichi M, et al. Up-down regulation of HIF-1alpha in cancer progression. Gene. 2021;798:145796.
-
Pipiya T, Sauthoff H, Huang YQ, Chang B, Cheng J, Heitner S, et al. Hypoxia reduces adenoviral replication in cancer cells by downregulation of viral protein expression. Gene Ther. 2005;12:911–7.
-
Tang W, Chen Z, Zhang W, Cheng Y, Zhang B, Wu F, et al. The mechanisms of sorafenib resistance in hepatocellular carcinoma: theoretical basis and therapeutic aspects. Signal Transduct Target Ther. 2020;5:87.
-
Wang M, Wey S, Zhang Y, Ye R, Lee AS. Role of the unfolded protein response regulator GRP78/BiP in development, cancer, and neurological disorders. Antioxid Redox Signal. 2009;11:2307–16.
-
Dai RY, Chen SK, Yan DM, Chen R, Lui YP, Duan CY, et al. PI3K/Akt promotes GRP78 accumulation and inhibits endoplasmic reticulum stress-induced apoptosis in HEK293 cells. Folia Biol. 2010;56:37–46.
-
Xiang Q-F, Zhan M-X, Li Y, Liang H, Hu C, Huang Y-M, et al. Activation of MET promotes resistance to sorafenib in hepatocellular carcinoma cells via the AKT/ERK1/2-EGR1 pathway. Artif Cells Nanomed Biotechnol. 2019;47:83–89.
-
Sharma SV, Fischbach MA, Haber DA, Settleman J. Oncogenic shock”: explaining oncogene addiction through differential signal attenuation. Clin Cancer Res. 2006;12:4392s–4395s.
-
Wang F, Bank T, Malnassy G, Arteaga M, Shang N, Dalheim A, et al. Inhibition of insulin-like growth factor 1 receptor enhances the efficacy of sorafenib in inhibiting hepatocellular carcinoma cell growth and survival. Hepatol Commun. 2018;2:732–46.
Acknowledgements
We appreciate MID (Medical Illustration & Design), as a member of the Medical Research Support Services of Yonsei University College of Medicine, for providing excellent support with medical illustration.
Funding
This research was supported by a National Research Foundation of Korea (NRF) grants funded by the Korea government (MSIT) (2020R1A2C1005245, 2021M3A9G1015618). This research was also supported by the Korea Drug Development Fund funded by the Ministry of Science and ICT; the Ministry of Trade, Industry, and Energy; and the Ministry of Health and Welfare (RS-2021-DD120840 (HN21C0960), Republic of Korea). Finally, this study was also supported by a faculty research grant from Yonsei University College of Medicine (6-2024-0111).
Ethics declarations
Competing interests
The authors declare no competing interests.
Ethics approval and consent to participate
Animal studies were conducted following an approved protocol (2022-0111) established by Yonsei University Health System’s Institutional Animal Care and Use Committee (IACUC) in accordance with the guidelines of the Animal Welfare Act and the Guide for the Care and Use of Laboratory Animals.
Additional information
Publisher’s note Springer Nature remains neutral with regard to jurisdictional claims in published maps and institutional affiliations.
Supplementary information
Rights and permissions
Open Access This article is licensed under a Creative Commons Attribution-NonCommercial-NoDerivatives 4.0 International License, which permits any non-commercial use, sharing, distribution and reproduction in any medium or format, as long as you give appropriate credit to the original author(s) and the source, provide a link to the Creative Commons licence, and indicate if you modified the licensed material. You do not have permission under this licence to share adapted material derived from this article or parts of it. The images or other third party material in this article are included in the article’s Creative Commons licence, unless indicated otherwise in a credit line to the material. If material is not included in the article’s Creative Commons licence and your intended use is not permitted by statutory regulation or exceeds the permitted use, you will need to obtain permission directly from the copyright holder. To view a copy of this licence, visit http://creativecommons.org/licenses/by-nc-nd/4.0/.
About this article

Cite this article
Li, S., Oh, GH., Hong, J.A. et al. Combined downregulation of TGF-β1 and GRP78 is responsible for overcoming acquired sorafenib resistance, which is initiated by rewiring the cell surface CD44-GRP78-IGF-1R signaling circuit. Cancer Gene Ther (2025). https://doi.org/10.1038/s41417-025-00937-1
-
Received:
-
Revised:
-
Accepted:
-
Published:
-
DOI: https://doi.org/10.1038/s41417-025-00937-1