
Introduction
The 5′-terminus of eukaryotic mRNA is characterized by a prevalent cap structure composed of 5′,5′-triphosphate-linked 7-methylguanosine (m7G). This canonical capping exerts profound impacts on modulating various functions of mRNA species, such as stability, splicing, polyadenylation, and translation1,2. Recent studies have revealed that nucleotide-containing metabolites, including nicotinamide adenine dinucleotide (NAD), flavin adenine dinucleotide (FAD), 3′-dephospho-coenzyme A (dpCoA), uridine diphosphate glucose (UDP-Glc), uridine diphosphate N-acetyl glucosamine (UDP-GlcNAc), and dinucleoside polyphosphates, can be incorporated into the RNA 5′-terminus as noncanonical initiating nucleotides (NCIN), resulting in NCIN-RNA3,4,5,6,7. Since the first discovery of NAD-capped RNA in bacteria8, NAD-RNAs have been reported in all kingdoms of life9,10,11,12,13,14,15,16. Although studies have indicated the presence of FAD, dpCoA, UDP-Glc/GlcNAc, dinucleoside polyphosphate caps across different phyla13,17,18,19,20, comprehensive profiling of NCIN-RNAs at the epitranscriptome level is only beginning to be revealed.
The current profiling strategies are limited to detecting specific metabolite caps9,18,21,22,23,24,25,26. NAD captureSeq9, along with our recently developed methods, ONE-seq24 and DO-seq26, employ chemo-enzymatic reactions to label NAD-capped RNAs with biotin, catalyzed by adenosine diphosphate-ribosyl cyclase. These biotinylated RNAs are then captured by streptavidin beads and subjected to high-throughput sequencing to identify NAD-RNAs. Yet, these methods only reflect the relative enrichment for a specific type of metabolite-capped transcript and cannot quantify the ratio between metabolite-capped and m7G-capped forms. Decapping-based strategies, such as CapZyme-seq27, utilize processing enzymes like NudC to target NCIN-capped RNAs, yielding RNAs with a 5′-monophosphate. Subsequently, barcoded RNA adapters are ligated to the 5′-end of these RNAs, followed by adapter-specific PCR enrichment and high-throughput sequencing. However, a notable limitation of applying CapZyme-seq in eukaryotes arises from contaminating signals of m7G, the dominant cap type28. Furthermore, currently available methods lack the ability, including experimental and computational procedures, for the epitranscriptome-wide percentage assessment of NCIN capping at the transcript resolution.
Aging is characterized by physiological declines accompanied with metabolic and transcriptional alterations29,30, but how these processes are integrated into the regulation of aging remains elusive. Studies in rodents and humans have shown that the levels of NAD and FAD decline with age in multiple tissues, including the liver31,32,33. Additionally, our recent findings reveal prominent age-associated alterations in NAD capping in mouse liver and human peripheral blood24,34, highlighting the potential role of metabolite-modified RNAs during aging. Cellular metabolism and gene expression are fundamental biological processes, making it crucial to explore how metabolite-modified RNAs, which coordinate metabolic and transcriptional regulation, are modulated during the adult life cycle and consequently, their physiological impact on the progression of aging. However, the absence of quantitative methods to determine epitranscriptome-wide NCIN caps with stoichiometric information impedes investigations into the contribution of NCIN capping to a broad spectrum of biological processes.
In the present study, we demonstrate that the CompasSeq analytical platform, combined with experimental and computational procedures, enables a comprehensive and quantitative assessment of NCIN capping levels in eukaryotes. We further devise an orthogonal and independent approach, the quantitative exoribonuclease reduction assay, to validate newly identified NCIN-RNAs and their capping ratios. Utilizing CompasSeq, we uncover previously unknown features of metabolite-modified RNAs in adult and aging mouse livers.
Results
The workflow of CompasSeq
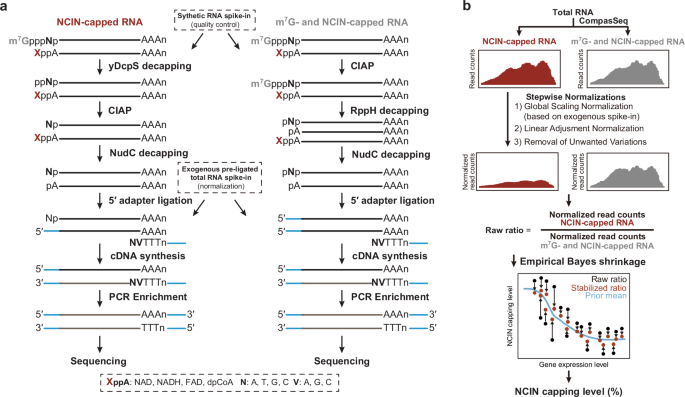
We designed the CompasSeq method for Comprehensive percentage assessment of NCIN-RNAs through enzymatic decapping followed by 5′-end adapter ligation and high-throughput Sequencing, an analytical platform that integrated both experimental and computational frameworks (Fig. 1).

a CompasSeq implements a parallel experimental pipeline to simultaneously capture NCIN-capped RNAs and all-capped RNAs (NCIN- and m7G-capped RNAs). Meanwhile, CompasSeq implements a dual spike-in strategy to quantify NCIN-capped RNAs. A set of synthetic NCIN-RNAs with known capping ratios, is introduced at the beginning to serve as internal controls. Adapter-pre-ligated Drosophila RNA, is added at the step of cDNA library construction for subsequent computational analysis. b Diagram illustrating the workflow of CompassAnalyzer. CompassAnalyzer first applies stepwise normalizations to recover the intrinsic RNA abundance distribution between NCIN-capped and all-capped RNAs from sequencing data. It then employs empirical Bayes shrinkage to enable quantification of NCIN capping ratios at the transcript level.
First, we subjected total RNA transcripts to cap-specific enzymes. To selectively capture NCIN-capped RNAs, we began with yDcpS, a decapping enzyme that hydrolyzes m7G-capped mRNA, followed by CIAP treatment to eliminate 5′-phosphate residues. We then introduced the bacterial RNA-decapping enzyme NudC, which hydrolyzes the diphosphate group in the cap structures of NAD, NADH, FAD, and dpCoA, ensuring that only NCIN-RNA yields 5′-monophosphate ready for ligation. To capture both NCIN- and m7G-capped RNAs, we initially treated total RNA with CIAP to remove pre-existing 5′-phosphate moieties. We then applied RppH, a pyrophosphatase, to hydrolyze pyrophosphate from the 5′ end of triphosphorylated RNA, together with NudC, to generate 5′-monophosphate RNAs from all-capped transcript forms. Second, we performed ligation between 5′ oligoribonucleotide adapters and 5′-monophosphate RNAs derived from either NCIN- or all-capped transcripts, followed by polyA-selected reverse transcription and high-throughput sequencing. Of note, we deliberately introduced an exogenous RNA spike-in as an internal control essential for subsequent computational analysis (Fig. 1a). Third, we proceeded with a computational framework composed of stepwise normalizations and empirical Bayes shrinkage. Stepwise normalizations, including global scaling using exogenous RNA spike-ins, linear adjustment, and the RUV strategy35, were applied to recover the intrinsic RNA abundance distribution between NCIN-capped and all-capped RNAs from sequencing data. Empirical Bayes shrinkage was then employed to enable quantification of NCIN capping ratios at transcript resolution (Fig. 1b).
Development of CompasSeq experimental procedures
We generated 38 nt RNA spike-ins via in vitro transcription, using adenine exclusively as the initial nucleotide in the DNA template to synthesize NAD, dpCoA, and FAD-capped RNAs (Fig. 2a). As anticipated, capped RNAs (NAD and dpCoA) exhibited higher molecular weight than uncapped forms (ppp-RNA) as observed by UREA-PAGE gel electrophoresis (Fig. 2a). Consistent with previous reports22,36, two RNA species for FAD-RNA were observed, with upper band being intact FAD-capped RNA and the lower band resulting from the loss of the flavin moiety together with one phosphate group (Fig. 2a). To corroborate the quality of the RNA spike-ins, we employed boronate affinity electrophoresis. Boronyl groups from boric acid form relatively stable complexes with vicinal diols, naturally occurring in the m7G of the m7G cap and the nicotinamide riboside of the NAD cap, leading to gel retardation during electrophoresis37. Indeed, only RNA with m7G and NAD caps, but not ppp-RNA, exhibited electrophoretic mobilities, indicating the presence of these specific caps in the RNA spike-ins (Fig. 2b).

a In vitro transcription with ATP, m7GpppA, NAD, FAD, or dpCoA as the initiating nucleotide. Sequence of the DNA template with the T7 promoter (Top). The “A” in red was the transcription start site and the coding sequence has been underlined. In vitro-transcribed RNAs with different 5′ end caps were resolved in an 8% PAGE gel (Bottom). The arrows indicated the intact FAD-capped species. b Boronate affinity electrophoresis showing in vitro-transcribed 38 nt RNA, including ppp-, m7G-, and NAD-capped RNAs. c UREA-PAGE gels showing products of processing of NAD- and m7G-RNA 5′-ends by NudC, dRai1, RppH, and yDcpS. d UREA-PAGE gel showing products of processing of FAD- and dpCoA-RNA 5′-ends by NudC. e Analysis of the effect of RNA secondary structure on yDcpS decapping. All m7G-capped RNA hairpins and linear 30-mers (1 µg each) were treated by 9 µM yDcpS for 1 h and then resolved in a 12% PAGE gel. f After NudC treatment, NCIN-RNA, such as NAD-RNA (38 nt), could be ligated with the 5′-adapter (27 nt), as shown by the shift of an upper band in the UREA-PAGE gel (left). m7G-capped RNA (38 nt) after being processed by yDcpS and CIAP, could not be ligated with the 5′-adapter (middle). RppH-processed m7G-RNA, on the other hand, contained a 5′-phosphate group for adapter ligation (right). Source data are provided as a Source Data file.
Assisted by 38 nt RNA spike-ins, we examined the specificity of decapping enzymes (Fig. 2c). NudC, known for its ability to hydrolyze diphosphate but not triphosphate linkages, effectively removed the NAD cap but also exhibited non-specific cleavage of the m7G cap upon extended treatment (Fig. 2c, d). We also evaluated exoribonucleases from the DXO/Rai1 family, known for their decapping activity27,38. We purified the dRai1 protein, a Drosophila homolog of Rai1, and found that it selectively degraded NAD-capped RNA while leaving m7G-capped RNA intact (Fig. 2c). However, dRai1 also caused additional nucleotides removal due to its exoribonuclease activity (Fig. 2c). In contrast, yDcpS specifically targeted m7G cap, while RppH removed both m7G and NAD caps, lacking specificity (Fig. 2c). It has been reported that RNA secondary structure would hinder the activity of yDcpS39. We generated m7G-capped RNAs with polymorphic hairpins and 3′ or 5′ overhangs to test whether excess yDcpS (~9 µM) would overcome this issue. Our results showed that excess yDcpS completely removed the m7G cap from RNAs regardless of their linear or secondary structures (Fig. 2e). Above experiments established the careful design of the CompasSeq workflow, including the choice and order of decapping enzyme treatments. The workflow started with a cascade of enzymatic reactions, followed by adapter ligation (Fig. 1a). To test the efficacy of adapter ligation, we subjected 38 nt NAD-RNA and m7G-RNA to CompasSeq. As evidenced by the accumulation of an upper band (Fig. 2f), we demonstrated the specificity of cap-processing enzymes in combination with adapter ligation for NAD- and m7G-capped forms, respectively.
The feasibility of CompasSeq analytical platform
To evaluate the feasibility of the CompasSeq analytical platform, encompassing both experimental and computational frameworks, we undertook several validation steps. First, we synthesized long RNA spike-ins (500 nt) with different sequences and cap structures, including NAD, FAD, dpCoA, m7G, and pppA. We mixed 20 µg of total RNA from mouse livers with 1 ng of each spike-in and subjected this mixture to the CompasSeq experiment, followed by qPCR analysis (Fig. 3a). Our results indicated that only NCIN, and not m7G- and ppp-RNAs, were enriched in the epitranscriptome-capturing group, whereas both NCIN- and m7G-RNAs were significantly enriched in the transcriptome-capturing group (Fig. 3b). Second, we aimed to measure the percentage of NCIN-capped RNA spike-ins. We excluded FAD-RNA spike-in from this and subsequent experiments due to its spontaneous decapping, which might confound calculations. Instead, we synthesized paired RNA spike-ins with identical sequences (500 nt) but different cap structures, including NCIN (NAD and dpCoA) or canonical m7G cap—each followed by a polyadenylated tail. It is likely that native transcripts exist in both NCIN- and m7G-capped versions, with proportions varying by gene. This experimental setup was intended to mimic endogenous transcripts that have 5% NCIN-capped modification (mixed with 95% m7G-RNA) or 0% NCIN-capped modification (i.e., 100% m7G-RNA) spike-in representing genes with no NCIN capping, thereby allowing us to assess the specificity of CompasSeq. We mixed 20 µg of total RNA from 2-month mouse livers with 0.014 ng of synthetic spike-in RNAs and subjected this mixture to the CompasSeq experiment, followed by polyA-selected RNA sequencing.

a Schematic workflow of gene-specific assessment of NCIN modification with CompasSeq platform by qPCR. Total RNAs from 2-month-old mouse livers were mixed with polyadenylated spike-in RNAs (500 nt), followed by enzymatic reactions of CompasSeq for qPCR analysis. ppp-RNA (500 nt) was included as a baseline control. b qPCR analysis showed that synthetic RNAs (500 nt) containing NCIN caps, including NAD, FAD, and dpCoA, could be significantly and selectively enriched by the procedure designed for capturing NCIN-RNAs, whereas ppp- and m7G-RNA did not exhibit such enrichment (left). In the procedure designed for capturing m7G- and NCIN-RNAs, all RNAs, except ppp-RNA, were significantly enriched (right). Data were shown in mean ± s.e.m. (n = 3 independent experiments). Two-tailed Welch′s t-tests were used to infer p values. n.s. denoted not significant. c RNA-seq experiment of spike-in RNAs determined the specificity of CompasSeq. A total of three different spike-in RNAs with different capped forms were mixed with total RNAs from 2-month-old mouse liver, and the mixture of RNAs was subjected to CompasSeq. For each capped form, two polyadenylated spike-in RNAs with identical sequences (500 nt) but have either NCIN (NAD or dpCoA) or m7G cap, were used to mimic endogenous NCIN-capped transcript with different capped forms. As shown in the bar chart, NCIN-RNAs, but not m7G-RNA, were significantly and selectively enriched with NCIN capping levels close to their expected ratio. Data were shown in mean ± s.e.m. (n = 3 independent experiments). d RNA-seq experiment of spike-in RNAs determined the sensitivity of CompasSeq. A total of five different polyadenylated spike-in RNAs (500 nt) with different proportions of NAD-RNA were mixed with total RNAs from 2-month-old mouse livers, and the mixture of RNAs was subjected to CompasSeq. Two spike-in RNAs with identical sequences but have either NAD or m7G cap, were used to mimic endogenous NCIN-capped transcript with different NCIN capping levels. Scatter plot showing the concordance between expected and observed NCIN capping levels from spike-in RNAs. The Pearson correlation coefficient and the associated two-sided p value were shown in the top right corner. Data were shown in mean ± s.e.m. (n = 3 independent experiments). Exact p values and source data are provided as a Source Data file.
Importantly, we added pre-treated total RNA from Drosophila at a mass ratio of 50:1 for each sample, serving as a baseline control after adapter ligation, a critical procedure for downstream computational analysis (Supplementary Fig. 2a). We reasoned that exogenous Drosophila RNA spike-ins could be utilized to reflect and correct unwanted variations introduced by experimental procedures. In principle, Drosophila spike-ins, when added equally to each sample, should maintain a constant proportion across samples, capturing either NCIN- or all-capped forms. Given the fact that NCIN-capped RNAs constituted only a small proportion of the total RNA pool, read counts from the NCIN-capped library should be lower than those from the all-capped library. In practice, we observed that the proportion of reads from the Drosophila genome was higher in samples capturing NCIN-capped than all-capped forms (Supplementary Fig. 2b). Therefore, we employed a stepwise normalization procedure to address these variations, to enable the recovery of the theoretical distribution of NCIN-capped RNAs. We found that raw read counts displayed similar distributions between NCIN-capped RNA and all-capped RNA libraries (Supplementary Fig. 2c). Upon normalizations, gene measurements from all-capped forms exhibited higher values compared to those from NCIN-capped libraries, reflecting the intrinsic distribution of NCIN-capped transcripts (Supplementary Fig. 2c). Correlation analysis revealed that normalized gene measurements exhibited improved reproducibility compared to the raw read counts (Supplementary Fig. 2d). However, NCIN capping estimated from genes with relatively low expression exhibited higher variation compared to highly expressed genes, an observation potentially caused by genes with low read counts that tend to suffer from high variability40. To address this issue, we introduced the empirical Bayes shrinkage strategy. As shown in Supplementary Fig. 2e, CompassAnalyzer could significantly mitigate such variations. Comparatively, exogenous total RNA spike-ins added at the beginning step failed to correct PCR amplification biases, as shown by the poor performance of NCIN-capped RNA proportions (Supplementary Fig. 2f).
Using CompassAnalyzer, we were able to analyze synthetic RNA spike-ins with known ratios, revealing that this platform not only captured metabolite-modified RNAs but also their relative ratios for the 5% of NCIN-capped spike-in (Fig. 3c). Background enrichment for the 100% m7G-RNA spike-in was significantly lower (less than 2%) compared to the 5% NCIN-capped spike-in (Fig. 3c), reflective of the specificity. We further employed spike-in RNAs with ascending ratios of NAD-capped forms: 0% (i.e., 100% m7G-capped), 1% (i.e., 99% m7G-capped), 5% (i.e., 95% m7G-capped), 10% (i.e., 90% m7G-capped), and 20% (i.e., 80% m7G-capped) (Supplementary Fig. 2g). The CompasSeq method, with its streamlined experimental and computational procedures, could reach coherent results between observed and expected NCIN capping levels (Pearson′s r = 0.998, Fig. 3d), thus illustrating the feasibility of this method in capturing and quantitatively measuring endogenous metabolite-modified RNAs.
NCIN-RNA epitranscriptome
With the CompasSeq analytical platform, we characterized NCIN-RNAs from young (2-month) and aged (18-month) mouse liver tissues. Following standard quality filtering procedures, each of the three independent biological replicates yielded an average of ~21.29 million high-quality reads that uniquely aligned to the reference genome (Supplementary Fig. 3a). PCA showed that the biological replicates of each sample type clustered together, indicating high reproducibility (Supplementary Fig. 3b). Dataset assessments corroborated that sequencing saturation has been reached (Supplementary Fig. 3c). Based on the background enrichment signal detected by 100% m7G-RNA spike-in, which was less than 2% (Supplementary Fig. 3d), we chose 2% ratio as the cutoff. This criterion led us to identify a total of 5680 highly reproducible NCIN-RNAs (Supplementary Data 2; Pearson′s r = 0.895 of the three biological replicates, Supplementary Fig. 3e), accounting for ~47.2% of the mRNA transcripts expressed in young mouse liver tissues. Besides RNA-seq, we also applied RT-qPCR. By analysis of three randomly selected genes, Ndufb10, Fkbp8, and Fads1, we calculated the relative abundance between NCIN-capped and all-capped groups (Supplementary Fig. 4a). The results obtained by RT-qPCR were in good congruence with those from high-throughput sequencing (Supplementary Fig. 4b), suggesting that CompasSeq can also be used for gene-specific assessment. Furthermore, comparison between the NCIN-RNAs, including, but not limited to, NAD-capped RNAs, identified in the current study with NAD-capped RNAs identified by our recently published ONE-seq method24 revealed a significant overlap (Supplementary Fig. 4c). For those NAD-RNAs uniquely identified by ONE-seq, their expression levels were significantly low (Supplementary Fig. 4d).
We briefly analyzed the NCIN-capped epitranscriptome from young mouse livers. By computing NCIN capping levels, we observed that most genes producing NCIN caps had modification ratios between 5% and 30%, with some genes exhibiting exceptionally high levels, such as Rnr1 (91.1%) (Fig. 4a). NCIN capping predominantly occurred on protein-coding genes, but also extended to pseudogenes and noncoding RNAs (Fig. 4b). NCIN-RNAs were derived from genes located on autosomes, the X chromosome, and the mitochondrial genome, but not from the Y chromosome (Fig. 4c). Based on the extent of modification, we divided NCIN-RNAs into three categories: high (30–100%, e.g., Fads1), medium (12.5–30%, e.g., Fkbp8), and modest levels (2–12.5%, e.g., Ndufb10) (Fig. 4d and Supplementary Fig. 4e). To inspect biological function, we performed pathway enrichment analysis and found that genes with modest NCIN capping were mainly involved in mitochondria-related events and energy metabolism, whereas genes with medium and high NICN capping levels were enriched in macroautophagy, vesicle-related processes, and cellular responses (Fig. 4e and Supplementary Data 3).

a The distribution of NCIN capping levels of each gene from 2-month-old mouse livers (n = 5462). Box plot represented the median (center line), the first and third quartiles (box limits), and the whiskers extended to 1.5 times the interquartile range. Data points beyond the whiskers were shown as outliers. b Pie chart showing the gene types of identified NCIN-RNAs. c Bar chart showing the chromosome distribution of identified NCIN-RNAs. d The distribution of NCIN capping levels of genes with modest (2–12.5%), medium (12.5–30%), and high (30–100%) NCIN capping levels. e Pathway enrichment analysis of genes with modest, medium, and high NCIN capping levels. Numbers represented the count of NCIN-RNA enriched in each pathway. Multiple testing corrections were performed using gprofiler2’s built-in “g_SCS” method. The gray dashed line indicated the cutoff of 0.05 adjusted p value. Exact p values and source data are provided as a Source Data file.
Validation of CompasSeq by an orthogonal method
To validate the CompasSeq platform by an orthogonal approach, we introduced two 5′−3′ exoribonucleases: dRai1 and Xrn1. Our rationale was based on the above observation that dRai1 specifically decaps NCIN-, but not m7G-capped RNAs, leading to 5′-to-3′ cleavage (Fig. 2b). This effect could be further enhanced by Xrn1 towards degradation, whereas m7G-capped transcripts would largely remain intact (Fig. 5a). We first validated the decapping activity of dRai1 on FAD- and dpCoA-RNAs (see Fig. 2b for NAD-RNA) by observing the appearance of lower bands on the UREA-PAGE gel electrophoresis (Fig. 5b). Second, we subjected 106 nt NAD-RNA and m7G-RNA spike-ins to dRai1 and Xrn1 treatment, which showed selective degradation of NAD-, but not m7G-capped, RNA (Fig. 5c). Prompted by this evidence, we hypothesized that the relative level of NCIN-capped transcripts could be determined by the reduction in abundance after treatment with dRai1 and Xrn1, compared to a mock treatment that includes both NCIN- and m7G-capped forms. We named this method the quantitative exoribonuclease reduction assay (Fig. 5d). We subjected 1 μg of total RNA from mouse livers mixed with 0.1 ng of synthetic RNA spike-ins (500 nt), including m7G, NAD, FAD, dpCoA, and pppA, to the assay. Consistently, only NCIN-RNAs exhibited significant degradation, while m7G-RNA remained unchanged (Fig. 5e). To assess whether the assay could measure NCIN capping levels, we mixed 1 μg of total RNA with 500 nt spike-in RNAs containing ascending ratios of NAD relative to m7G-capped forms: 0%, 10%, 30%, 50%, 70%, and 90%. We observed that relative capping levels measured by the assay corresponded to their expected levels (Fig. 5f). Furthermore, we successfully validated the NCIN capping levels of five randomly selected genes: Idh1, F13b, Ssr3, Rnr2, and Rnr1, as identified and quantified by CompasSeq (Fig. 5g, h). As a control experiment, we confirmed the absence of NCIN capping in five genes not identified by CompasSeq (Apom, Cox6a1, Dbi, Ddt, and Lrg1) (Supplementary Fig. 5). Taken together, our results using quantitative exoribonuclease reduction assay strongly supported the reliability of CompasSeq for the identification and ratio quantification of NCIN-RNAs.

a The validation strategy for the treatment with dRai1 and Xrn1. b UREA-PAGE gel showing products of processing of 38 nt FAD- and dpCoA-RNA 5′-ends by dRai1. c UREA-PAGE gel showing products of processing of 106 nt NAD- and m7G-RNA by dRai1 and Xrn1. d Schematic workflow of gene-specific assessment of NCIN modification with quantitative exoribonuclease reduction assay. e Synthetic RNAs (500 nt) containing NCIN caps (NAD, FAD, and dpCoA) could be significantly and selectively degraded by dRai1 and Xrn1, whereas m7G-RNA did not exhibit such degradation. Data were shown in mean ± s.e.m. (n = 3 independent experiments). Two-tailed Welch′s t-tests were used to infer p values. n.s. denoted not significant. f Synthetic RNAs (500 nt) with ascending ratios of NAD-capped forms: 0% (i.e., 100% m7G-capped), 10%, 30%, 50%, 70%, and 90% were used for the quantitative exoribonuclease reduction assay. The red and blue numbers represented the expected and observed NCIN capping levels, respectively. The observed NCIN capping levels were calculated as the difference between 1 and the relative levels from enzymatic treatment measured using the assay. Data were shown in mean ± s.e.m. (n = 3 independent experiments). g Five endogenous genes from mouse liver were assessed by the quantitative exoribonuclease reduction assay. Data were shown in mean ± s.e.m. (n = 3 samples). h Comparison between the result obtained by quantitative exoribonuclease reduction assay and CompasSeq. The red bars represented NCIN capping levels obtained from CompasSeq (left axis), while the blue bars illustrated NCIN capping levels calculated from the assay (right axis). Data were shown in mean ± s.e.m. (n = 3 samples). Two-tailed Welch′s t-tests were used to infer p values. n.s. denoted not significant. Exact p values and source data are provided as a Source Data file.
Characterization of metabolite-capped RNA at the transcript resolution
We proceeded to characterize newly identified NCIN-RNAs at the transcript resolution. Eukaryotic genomes feature transcript isoforms that can be derived from common gene loci. In-depth analysis revealed that, for most NCIN-RNAs (98.5%), their isoforms, if transcribed, all contained NCIN caps, e.g., Serpinf2, although the actual capping level varied among individual isoforms. Only 1.5% of NCIN-RNAs had select isoforms being modified, e.g., Zfp36 (Supplementary Fig. 6a, b and Supplementary Data 4). This observation prompted us to explore the link between NCIN capping and gene transcription, including transcript abundance, gene length, number of introns, alternative transcription start sites (ATSS)41, alternative splicing (AS)42, and alternative polyadenylation (APA)43. First, by dividing NCIN-RNAs into 10 deciles based on their NCIN capping levels, we observed that transcript abundance was negatively correlated with NCIN capping levels, while transcript length and number of introns were positively correlated (Supplementary Fig. 6c). Second, we found that RNAs with high levels of NCIN capping tended to possess ATSS (Supplementary Fig. 6d). Third, we noted that NCIN capping was negatively associated with AS events, including exon skipping, alternative 5′ donor and 3′ acceptor sites, mutually exclusive exons, and intron retention (Supplementary Fig. 6e). Fourth, we assessed the extent of APA by the percentage of distal poly(A) site usage index (PDUI). This analysis illustrated that transcripts containing NCIN caps were more likely to have APA compared to RNAs without NCIN modification. Consistently, NCIN capping levels positively correlated with distal poly(A) site usage (Supplementary Fig. 6f). NCIN capping represents an evolutionarily conserved RNA modification5,12,27,44,45. To explore the potential impact of sequence conservation, we utilized PhastCons scores, which measure conservation based on sequence similarity46, to calculate the conservation score of each isoform. Our findings indicated that transcripts with low sequence conservation exhibited less metabolite capping, whereas transcripts with high sequence conservation tended to be highly modified (Supplementary Fig. 7a). Prior research has indicated that proximal RNA secondary structures can affect RNA capping47. Therefore, we analyzed sequence features within 100 bp downstream of the transcription start site (TSS), assessing potential structural influences based on minimum free energy (MFE)48. Our analysis revealed that RNAs with NCIN caps tended to adopt predicted structures with lower MFE than those with m7G caps. Furthermore, RNAs with higher NCIN capping exhibited even lower MFE levels (Supplementary Fig. 7b, c).
NCIN capping on transcript stability and translation efficiency
To investigate how NCIN capping affects RNA stability, we generated Genome-wide Mapping of Uncapped and Cleaved Transcripts (GMUCT)49 datasets to assess mRNA degradation in mouse livers. All GMUCT libraries exhibited read enrichment at the 3′ end of mRNAs (Supplementary Fig. 7d), and GMUCT read abundance per transcript was positively correlated with mRNA levels quantified by RNA-seq (Supplementary Fig. 7e), which aligned with previously reported degradome sequencing patterns50. Using the GMUCT and RNA-seq data, we assessed transcript stability using the “proportion uncapped” metric (log2[GMUCT/RNA-seq]), where higher values suggest lower stability. We analyzed the stability of RNA transcripts with and without NAD24 and NCIN caps (CompasSeq data from the current study), respectively. Our analysis revealed that NAD-capped RNAs in mouse liver exhibited a higher proportion of 5′ degradation intermediates, suggesting greater instability compared to RNAs without NAD modification (Supplementary Fig. 7f). These observations were in line with findings in Arabidopsis, where NAD capping was found to be associated with reduced RNA stability51. In a sharp contrast, NCIN-capped RNAs from CompasSeq data showed a significantly lower proportion of degradation intermediates (Supplementary Fig. 7g). These data suggested that NCIN caps, as the compendium of NAD, FAD, dpCoA caps, etc., tended to occur at transcripts with higher stability. To examine the impact of NCIN capping on translational efficiency, we calculated ribosome occupancy (RO) using available Ribo-seq and RNA-seq data from mouse liver (GEO: GSE12398152). RO, an estimate of the translation efficiency, was computed as the log-ratio of Ribo-Seq and RNA-Seq read counts. Our analysis indicated that NCIN capping was positively correlated with translation efficiency (Supplementary Fig. 7h). Together, these findings suggested that NCIN caps were linked with transcripts exhibiting greater stability and higher translation efficiency.
NCIN capping dynamics during aging
The number of genes harboring NCIN caps and their relative capping levels exhibited a significant decrease during aging (Fig. 6a). Moreover, we quantified the usage of metabolite caps by calculating the weighted sum of NCIN capping levels normalized to transcript abundance. Additionally, metabolite-capped RNA constituted ~8.3% of the mRNA transcriptome in young animals, and this proportion declined to 6.5% in aged mice, though the difference was not statistically significant (Fig. 6b).

a Violin plot showing the global dynamics of NCIN-RNAs during aging. Box plots represented the median (center line), the mean (red dots), the first and third quartiles (box limits), and the whiskers extended to 1.5 times the interquartile range. Data points beyond the whiskers were shown as outliers. Statistical analysis was performed using the nonparametric Mann–Whitney rank test (two-sided). b Pie chart showing the percentile usage of RNA caps (NCIN caps and non-NCIN cap) between young and old mouse livers. Statistical analysis was performed using a chi-squared test (p = 0.83, two-sided). c Scatterplot showing NCIN capping levels in young and old mouse livers. Differentially modified genes were defined as absolute fold change of NCIN capping levels ≥ 1.5 in old compared to young samples. d Scatterplot showing log2-transformed normalized gene expression levels in young and aged mouse livers. Differentially expressed genes were defined as absolute fold change of normalized read counts ≥ 1.5 and adjusted p values < 0.05 in old compared to young animals. e Upset plot showing the number of intersections between differentially modified genes and differentially expressed genes. The size of each set was shown in the left bottom corner. f Heatmap showing the log2-transformed normalized gene expression levels and NCIN capping levels of selected genes. Genes with age-decreased NCIN capping were colored in blue, while the gene with age-increased NCIN capping was colored in red. g Circular lollipop chart showing the transcriptomic and epitranscriptomic pathway score of each pathway. The pathway score was defined as the log2-transformed average of fold change between normalized read counts or NCIN capping levels derived from transcriptome or epitranscriptome profiles from old and young animals, respectively. Statistical analyses were performed using the nonparametric Mann–Whitney rank test (two-sided). Pathways with significant alterations during aging (p < 0.05) were marked with red asterisk. h Box plot showing the log2-transformed normalized gene expression levels and NCIN capping levels of pathways with significant alterations during aging (n = 3 samples). Box plots represented the median (center line), the first and third quartiles (box limits), and the whiskers extended to 1.5 times the interquartile range. Data points beyond the whiskers were shown as outliers. Statistical analyses were performed using the nonparametric Mann–Whitney rank test (two-sided). Exact p values and source data are provided as a Source Data file.
We further investigated the impact of age on NCIN capping. Our analysis revealed that 23.3% of genes producing NCIN-capped isoforms exhibited a uniform decrease in capping levels with age (e.g., Bri3), while only 0.5% showed a consistent increase (e.g., Ghitm; Supplementary Fig. 8a). Additionally, 5.8% of genes with NCIN-capped isoforms conferred discordant changes with age, with some isoforms increasing while others decreasing in capping levels (e.g., Spryd7; Supplementary Fig. 8a, b). Notably, specific isoforms could even lose their metabolite caps with age (e.g., Comt; Supplementary Fig. 8b).
We conducted a comparative analysis between the epitranscriptome and transcriptome (Fig. 6c, d and Supplementary Data 5). Strikingly, most genes that exhibited altered NCIN capping with age remained unchanged at the RNA level (Fig. 6e). We further devised a scheme to filter NCIN-RNAs based on low variation, high modification, and high dynamics (Supplementary Fig. 9a). This approach allowed us to pinpoint five NCIN-capped genes that had the most significant changes during aging. Four genes showed decreased NCIN capping, including those involved in diphosphate hydrolysis (Nudt5), the cAMP-dependent pathway to Golgi (Pde4dip), lipid transport (Stoml1), and cytosolic sulfonation (Sult1c2), while one gene, associated with selenoprotein production (Selenot), exhibited an increase in NCIN capping (Fig. 6f).
To inspect the potential impact of metabolite capping during aging, we performed pathway enrichment analysis and found that genes with decreased modification were involved in translation, ribosome-related, and mitochondrion-related events (Supplementary Fig. 9b and Supplementary Data 6). Notably, transcriptome analysis showed that genes with increased expression during aging were also involved in translation and ribosome-related events, while genes with decreased expression were enriched in lipid, glucose, steroid, and amino acid metabolism (Supplementary Fig. 9b). These results reflected that genes involved in basic cellular events conferred opposite changes in transcriptome and NCIN-capped epitranscriptome during aging. We further examined how the transcriptome and NCIN-capped epitranscriptome impinged on aging pathways. Hallmarks of aging, including inflammation, mitochondrion, proteostasis, cellular senescence, cell communication, and transcription regulation, showed discordant trends between the transcriptome and epitranscriptome with age (Fig. 6g). Specifically, genes involved in immune system process, translation, peptide metabolism, cell communication, and signal transduction had a marked increase in expression during aging, while exhibiting a significant decline in NCIN capping (Fig. 6h).
To investigate the impact of NCIN capping on RNA stability during aging, we applied GMUCT datasets from young and aged mouse livers and grouped the transcripts based on their modification status. Using NAD-RNA data, a late-onset increase of NAD capping was significantly associated with a larger proportion of uncapped transcripts in old compared to young animals (Supplementary Fig. 9c). This finding suggested a link between elevated NAD capping during aging with increased RNA degradation. In contrast, we did not observe a significant correlation between age-associated changes in NCIN capping and RNA degradation (Supplementary Fig. 9d), consistent with RNA expression data shown in Fig. 6e. Similarly, we analyzed Ribo-seq datasets (GEO: GSE123981) with NCIN capping and noted that transcripts with altered modification of metabolite in aged mouse livers were found to be associated with reduced translation efficiency (Supplementary Fig. 9e).
In summary, we introduce CompasSeq, a strategy for the comprehensive and quantitative ratio assessment of NCIN-capped RNAs in eukaryotic organisms. Using CompasSeq, we elucidate the NCIN-capped epitranscriptome, encompassing not only the types of RNAs capped by NCIN but also their relative capping levels, from adult aging mouse livers. We unveil distinct features between the transcriptome and NCIN-capped epitranscriptome, suggesting that metabolite capping may serve as a hidden layer of gene regulation that occurs with age.
Discussion
Nucleotide-containing metabolites, including NAD, NADH, FAD, and dpCoA, can be incorporated at the 5′ terminus of RNAs, resulting in NCIN-capped RNAs. Currently available methods are limited to the identification of specific metabolite-modified RNAs, e.g., NAD-RNA9,22,24, FAD-RNA19 and dpCoA-RNA18,53,54, and lack quantitative assessment of the ratio between m7G-capped and metabolite-capped transcripts. The CapZyme-seq method has been used to identify NCIN-RNAs in prokaryotes27; however, due to the prevalence of the m7G cap in eukaryotic transcriptomes and the absence of specifically designed spike-ins as well as computational solutions, this method and others are not applicable for investigating eukaryotic NCIN-RNAs, especially their capping ratios. In this study, we present CompasSeq, an analytical platform that integrates both experimental and computational frameworks to simultaneously capture and quantify NCIN capping levels at the epitranscriptome level in eukaryotes.
For the experimental part, we meticulously design enzymatic reactions, selecting cap-specific enzymes and ordering treatments to generate a monophosphate moiety at the 5′-end of NCIN-capped and all-capped RNAs, respectively, followed by adapter ligation and PCR enrichment. To minimize biases introduced during PCR amplification, we devise a spike-in normalization strategy. Pre-treated exogenous RNAs are added proportionally to adapter-ligated samples, departing from traditional methods like ERCC in which spike-ins are added at the beginning of the experiment55. This approach ensures an unbiased representation of NCIN-capped RNAs that represent a minor subset of the total RNA pool. Adding exogenous RNA spike-ins after enzymatic treatments but prior to library construction captures discrepancies in spike-in proportions between all-capped and NCIN-capped libraries, revealing PCR-induced biases. For the computational part, we develop CompassAnalyzer, an R package that applies stepwise normalization and empirical Bayes shrinkage to accurately recover NCIN- and all-capped RNA. The CompasSeq analytical platform enables quantitative assessment of the NCIN-capped epitranscriptome, identifying not only the types of RNAs capped by NCIN but also their relative capping levels. Moreover, we devise an orthogonal method, the quantitative exoribonuclease reduction assay, to independently validate CompasSeq. By harnessing the decapping activity of dRai1 and the 5′–3′ exonuclease activity of Xrn1, this assay allows gene-specific quantification of NCIN capping levels. However, this assay is not yet feasible for sequencing-based epitranscriptome-wide assessment, due to the lack of appropriate spike-ins to normalize unwanted variation from enzymatic treatment. Altogether, we provide compelling evidence to support the notion that CompasSeq is a reliable approach for the identification and quantification of NCIN-RNAs at the epitranscriptome level.
With CompasSeq, we reveal insight into NCIN-capped epitranscriptome. First, we identify that over 45% of the transcripts from mouse liver are modified with metabolite caps, with most displaying capping ratios between 5 and 30%. Second, we determine that metabolite caps constitute between 6 and 8% of mRNA pool from adult mouse liver tissues, representing a significant type of RNA modification. A previous analysis using mass spectrometry has estimated that NAD and FAD combined make up ~0.8% in the mRNA transcriptome, rising to 3.7% when including NAD, FAD, UDP-Glc and UDP-GlcNAc caps13. Our current measurements, based on a weighted sum of a near-complete spectrum of NCIN caps normalized to gene abundance, provide an improved overview of metabolite usage as caps in the mRNA transcriptome. Third, we observe that select genes, such as Rnr1 and Rnr2 with 85.4% and 91.1% of NCIN capping, respectively (see Fig. 4a), display significant NCIN compared to m7G capping. Particularly, these two genes are ribosomal RNAs encoded and localized in mitochondria. It has been reported that nucleotide-containing metabolites, e.g., NAD56 and FAD57, are highly abundant in mitochondria and that RNA polymerase in mitochondria exhibits more efficiency for NCIN capping compared to its counterpart in cytoplasm44. Hence, it is tempting to predict that such high NCIN modification of Rnr1 and Rnr2 may have a functional relevance. Fourth, in young mouse livers, we demonstrate that the combined effect of NCIN capping, despite negative regulation of NAD cap, would promote RNA stability. Similarly, NCIN capping positively correlates with translation efficiency, though the contribution of specific metabolite caps warrants further investigation. Fifth, we delineate the dynamics of NCIN-capped epitranscriptome during aging, revealing a significant decrease at both global and transcript levels. Though a majority of transcripts with altered NCIN capping remain unchanged at the transcriptome level, we observe a discordant trend between RNA expression and NCIN capping on genes linked to aging hallmarks, e.g., inflammation, mitochondrial function, proteostasis, cellular senescence, and intercellular communication30. Moreover, in aged mouse livers, NCIN capping appears to have confounding effects on RNA stability and translation efficiency. It is possible that different types of metabolite caps, when combined with their dynamic changes with alterations in cellular machineries of RNA transcription and protein synthesis that occur with age, may exert distinct outcomes on RNA stability and translation. Taken together, CompasSeq reveals features of the NCIN-capped epitranscriptome, suggesting a yet-to-be-discovered regulatory mechanism.
Finally, we raise important issues and potential limitations of our current study. First, synthetic NCIN-RNAs by in vitro transcription, such as NAD-RNA, FAD-RNA, and dpCoA-RNA, are difficult to achieve 100% purity, a phenomenon that has been seen in the current study (see Fig. 2a, b) as well as by others22,36,58, such that these synthetic NCIN-RNA spike-ins can be useful as internal quality controls, but they are not appropriate for normalization procedures. Consequently, CompassAnalyzer, the computational procedures of CompasSeq, solely rely on exogenous Drosophila total RNAs for stepwise normalizations. While our strategy effectively corrects PCR amplification bias, it does not control for variability introduced at the earlier steps. Thus, the CompasSeq platform provides an approximate, but not absolute, ratio assessment of NCIN-RNAs. Second, we apply stringent filtering criteria for quality data; however, this may exclude genes with low expression. Third, CompasSeq can detect transcript with very low modification, such as those equal to or lower than 1% capping by metabolite, but their measurement of exact ratio usually exhibits high variation (see Fig. 3d). Fourth, we leverage the magnitude of fold change in NCIN capping levels between young and aged animals; yet quantitative assessment of age-associated alterations in NCIN-capped epitranscriptome is only beginning to be revealed. Future studies that focus on developing statistical methods for differential analysis of NCIN-RNA sequencing data would facilitate the robustness of detecting differential NCIN-RNAs in response to physiological and even pathological conditions. Fifth, although the use of pyrophosphatase, such as NudC, is effective in identifying bulk NCIN-RNAs, it cannot distinguish specific types of metabolite caps. Future advancements, such as employing specific RNA decapping enzymes like AtNUDX23, which selectively cleaves FAD caps19, will enable ratio analysis for specific metabolite caps. Nevertheless, the CompasSeq analytical platform provides a foundational framework for the quantification and ratio assessment of metabolite-capped RNAs in eukaryotes.
Methods
Ethics statement
All animal procedures have been reviewed and approved by the Institutional Animal Care and Use Committee at the Chinese Academy of Sciences and were in accordance with the Guide for the Care and Use of Laboratory Animals of the Chinese Academy of Sciences. All efforts were made to minimize the suffering of the animals.
Animal experimentation
C57BL/6 male mice were housed in an environmentally controlled room under a 12:12 h light/dark cycle at 23 °C and were provided commercial mouse chow food and water ad libitum. To profile the NCIN-capped epitranscriptome, livers were dissected from both 2-month and 18-month-old C57BL/6 male mice and immediately frozen in liquid nitrogen. To avoid confounding issues related to sex-specific gene expression, we exclusively used male mice throughout the study. For the collection of 3-day-old fly samples as exogenous spike-ins, newly emerged male Drosophila melanogaster (BDSC #5905) were gathered and aged for 72 h, after which all samples were promptly frozen in liquid nitrogen.
In vitro transcription of NCIN-RNAs, and m7G-RNA
RNA spike-ins were synthesized by T7 polymerase as previously described24. The DNA templates were synthesized by Genewiz (Supplementary Data 1). Importantly, adenine was used exclusively as the initial nucleotide, with no additional adenine present in the DNA template sequence. Initiating adenosine allowed the incorporation of adenine-containing metabolites, e.g., NAD, FAD, and dpCoA, at the +1 position to form an NCIN cap. For the synthesis of NCIN- and m7G-capped RNAs, ATP was excluded from the transcription reaction cocktail. For annealing oligonucleotides, 10 μM DNA oligonucleotides were combined in 50 μL of 1× Cut Smart buffer (NEB, catalog: B7204S) and annealed by heating to 95 °C for 5 min. The reaction mixture was then cooled down to 4 °C at a ramp rate of 0.1 °C/s in a thermocycler (Eppendorf, Germany). For in vitro transcription,10 μM of double-stranded DNA templates were combined in 100 μL 1× transcription buffer (Thermo Fisher Scientific, catalog: AM1334), along with 1 mM each of GTP, CTP and UTP, and 1 mM ATP for ppp-RNA. For other capped RNA forms, the reaction included 4 mM NAD (Macklin, catalog: N814818, for NAD-RNA), 4 mM FAD (Sigma-Aldrich, catalog: F6625, for FAD-RNA), 4 mM dpCoA (Sigma-Aldrich, catalog: D3385, for dpCoA-RNA) or 4 mM m7GpppA (NEB, catalog: S1406S, for m7GpppA-RNA). Additionally, 10 μL of T7 RNA polymerase (Thermo Fisher Scientific, catalog: AM1334), 5% DMSO, 5 mM DTT and 20 U of RNaseOUT (Takara Bio, catalog: 2313B) were added to the mixture, which was then incubated at 37 °C for 4 h. Following transcription, the reaction mixture was treated with 10 U of DNase I (Thermo Fisher Scientific, catalog: AM1334) at 37 °C for 30 min to remove the DNA template. The RNA was then purified using RNAiso Plus (Takara Bio, catalog: 9108) and precipitated with isopropanol and 0.3 M sodium acetate (Thermo Fisher Scientific, catalog: AM9740) at −80 °C overnight. The RNA pellet was washed twice with 75% ethanol, air-dried, and redissolved in DEPC-treated H2O. The 500 nt IVT RNA molecules were subjected to polyadenylation for poly(A) tail elongation, in accordance with the manufacturer′s instructions (E. coli Poly(A) Polymerase, TransGen, catalog: LA101-01). The quality of the in vitro-transcribed 38 nt RNAs was further analyzed by boronate affinity electrophoresis with an 8 M urea, 1× TBE, 12% polyacrylamide gel supplemented with 0.3% 3-acrylamidophenylboronic acid37.
Purification of Drosophila dRai1 protein
The coding sequence of Drosophila dRai1 gene was inserted into the pET28a expression vector, fused with a hexa-His tag at the C-terminus. The plasmid was transformed into the E. coli BL21 (DE3) strain (TransGen, catalog: CD601-02). Bacteria were cultured at 37 °C until the OD600 reached 0.8, after which protein expression was induced with 0.5 mM IPTG and at 18 °C for 18 h. The recombinant proteins were purified using a Ni Focurose FF (IMAC) column (Huiyan Bio, catalog: HQ060312001L). The purified protein was stored in a buffer containing 20% (v/v) glycerol and 2 mM DTT at −80 °C (Supplementary Fig. 1).
NudC, dRai1, RppH, and yDcpS enzymatic reactions
For assays shown in Fig. 2c–e, 1 µg of either NCIN- or m7G-RNA (38 nt) spike-ins was used. 10 pmol of NudC (NEB, catalog: M0607S) was mixed with RNA in 40 μL of NEBuffer r3.1 at 37 °C for 1 h in the presence of 20 U of RNaseOUT and 200 mM DTT. For assays shown in Figs. 2c, 5b, 0.5 µL of purified dRai1 (final concentration: 340 nM) was incubated with RNAs in 20 μL of NEBuffer r3.1 at 37 °C for 1 h in the presence of 10 U of RNaseOUT. The RppH reaction was performed by adding 5 U of RppH (NEB, catalog: M0356) to RNAs, resuspended in 50 μL of 1× ThermoPol Reaction Buffer (NEB, catalog: B9004S) and incubated at 37 °C for 1 h in the presence of 20 U of RNaseOUT. Excess yDcpS enzyme (400 U, NEB, catalog: M0463S) was incubated with RNAs in 50 μL of 1× yDcpS reaction buffer at 37 °C for 1 h in the presence of 20 U of RNaseOUT. The products were purified with RNAiso Plus and analyzed by 12% polyacrylamide UREA-PAGE gels. Gels were stained by SYBR Gold (Invitrogen, catalog: S11494) and fluorescence was detected by the Fusion Solo S imaging system (Vilber).
Enzymatic treatment and adapter ligation of NAD-RNA (38 nt) and m7G-RNA (38 nt)
To assess the capturing specificity for assays shown in Fig. 2f, 1 µg of NAD-RNA (38 nt) was decapped with 10 pmol of NudC as described above. The products were purified using RNAiso Plus and then ligated with 100 pmol of 5′ adapter oligo (27 nt, Supplementary Data 1, synthesized by Genewiz), in the presence of 20 U of T4 RNA ligase 1 (NEB, catalog: M0202), 15% of PEG8000, 10% DMSO, 1 mM ATP and 20 U of RNaseOUT in 40 μl of 1× T4 RNA ligase buffer at 16 °C for 16 h. Decapping of 1 µg of m7G-RNA (38 nt) was carried out using an excess of yDcpS enzyme as described above. Products were purified with RNAiso Plus and further incubated with 10 U of CIAP (Thermo Fisher Scientific, catalog: 18009019) in the presence of 20 U of RNaseOUT in 1× Dephosphorylation Buffer at 37 °C for 1 h to remove the 5′-terminal phosphate from yDcpS-treated RNAs. After purification with RNAiso Plus, the CIAP-treated RNAs were ligated with 100 pmol of 5′ adapter oligo (27 nt) as described above.
Decapping of 1 µg of m7G-RNA (38 nt) was performed using 10 U of RppH in the presence of 20 U of RNaseOUT in 50 μL of 1× ThermoPol Reaction Buffer at 37 °C for 90 min. Following purification with RNAiso Plus, the RppH-treated RNAs were ligated with 100 pmol of 5′ adapter oligos (27 nt) as described above. The ligation products were then purified with RNAiso Plus and analyzed using 8% polyacrylamide UREA-PAGE gels.
qPCR analysis of NCIN-RNAs (500 nt) and m7G-RNA (500 nt)
For assays shown in Fig. 3a, b, polyadenylated spike-in RNAs were generated from different sequence templates, including 1 ng each of NAD-, FAD-, dpCoA-, m7G-, and ppp-RNA (500 nt). These spike-ins were mixed with 20 μg of total RNAs from 2-month C57BL/6 mouse livers (n = 3) and then subjected to CompasSeq enzymatic reactions. For procedures capturing NCIN-RNAs, RNAs were incubated with excess yDcpS enzyme (400 U) in the presence of 20 U of RNaseOUT in 50 μL of 1× yDcpS reaction buffer at 37 °C for 1 h. The products were purified using RNAiso Plus and subsequently incubated with 10 U of CIAP as described above. For procedures capturing all-capped RNAs, RNAs were incubated with 10 U of CIAP to remove pre-existing 5′-phosphate moieties. The purified products were then incubated with 10 U of RppH in the presence of 20 U of RNaseOUT in 50 μL of 1× ThermoPol Reaction Buffer at 37 °C for 90 min.
Purified products from two procedures were incubated with 10 pmol NudC in the presence of 20 U of RNaseOUT and 200 mM DTT in 40 μL of NEBuffer r3.1 at 37 °C for 90 min. Products were purified with RNAiso Plus and subsequently ligated with 100 pmol 5′ adapter oligo (38 nt, Supplementary Data 1, synthesized at Genewiz), in the presence of 20 U of T4 RNA ligase 1, 15% of PEG8000, 10% DMSO, 1 mM ATP, and 20 U of RNaseOUT in 40 μL of 1× T4 RNA ligase buffer at 16 °C for 16 h. Following purification, products were re-dissolved in 20 μl of DEPC-treated H2O. Reverse transcription was performed using designed primers listed in Supplementary Data 1 with the ABScript II cDNA First-Strand Synthesis Kit (ABclonal, catalog: RK20400). 5 μL of the products were diluted to 100 μL and served as input. Meanwhile, 5 μL of reverse-transcribed products were further amplified by PCR using adapter-specific primers listed in Supplementary Data 1, in accordance with the manufacturer′s instructions (Phanta® Max Super-Fidelity DNA Polymerase, Vazyme, catalog: P505-d1). The PCR program included an initial denaturation step of 3 min at 95 °C, followed by 18 cycles of amplification (denaturation for 15 s at 95 °C, annealing for 15 s at 60 °C, and extension for 6 min at 72 °C), and a final extension for 5 min at 72 °C. The ppp-RNA (500 nt) was used as the baseline control. qPCR was conducted using SYBR Green Fast qPCR Mix (ABclonal, catalog: RK21203) in accordance with the manufacturer′s protocol with primers listed in Supplementary Data 1. To calculate the enrichment from qPCR data, the Ct value of the target gene was first normalized to the Ct value of the ppp-RNA (baseline). Next, the normalized PCR+ fraction value (ΔCt of the target gene normalized to the ppp-RNA) was normalized to the background (ΔCt calculation for the gene in the input) to yield the ΔΔCt value. The linear conversion of this ΔΔCt resulted in the fold enrichment. Statistical significance was assessed using Student′s t test.
CompasSeq protocol
RNA extraction and spike-in addition
For the assays shown in Fig. 3c, total RNAs (20 μg) from 2-month C57BL/6 mouse liver (n = 3) were mixed with 0.014 ng of 3′-end polyadenylated spike-in RNA (500 nt) containing 100% m7G-RNA, 5% NAD-RNA/95% m7G-RNA, and 5% dpCoA-RNA/95% m7G-RNA, respectively. For the assays shown in Fig. 3d, total RNAs (20 μg) from 2-month C57BL/6 mouse liver (n = 3) were mixed with 0.014 ng of 3′-end polyadenylated spike-in RNA (500 nt) that had 0% NAD-RNA/100% m7G-RNA, 5% NAD-RNA/95% m7G-RNA, 10% NAD-RNA/90% m7G-RNA, 15% NAD-RNA/85% m7G-RNA, and 20% NAD-RNA/80% m7G-RNA, respectively. For the assays shown in Figs. 4 and 6, total RNAs were extracted from three biological replicates of 2-month and 18-month-old C57BL/6 mouse samples. A total of 20 μg of RNA was mixed with 0.014 ng of 3′-end polyadenylated spike-in RNA (500 nt) containing 0% NAD-RNA/100% m7G-RNA, 1% NAD-RNA/99% m7G-RNA, 5% NAD-RNA/95% m7G-RNA, and 20% NAD-RNA/80% m7G-RNA, respectively.
Enzymatic treatments and adapter ligation
The mixture of total RNAs and spike-in RNA (500 nt) underwent CompasSeq sequential enzymatic reactions following the protocols as described in “qPCR analysis of NCIN-RNAs (500 nt) and m7G-RNA (500 nt)” part. We incubated the RNAs at 65 °C for 5 min before ligation to prevent RNA secondary structure interference. To capture PCR amplification bias, barcoded adapters were first introduced into the 5′-end of spike-in total RNA from Drosophila using the enzymatic procedures for capturing all-capped RNAs. Subsequently, the adapter-ligated Drosophila spike-in RNAs were then added to each sample at a mass ratio of 50:1. The mixed RNA was subjected to reverse transcription followed by PCR amplification.
Reverse transcription and amplification
Reverse transcription was performed following the protocols as described in “qPCR analysis of NCIN-RNAs (500 nt) and m7G-RNA (500 nt)” part. The PCR program included an initial denaturation step at 95 °C for 3 min, followed by 16 cycles of denaturation at 95 °C for 15 s, annealing at 60 °C for 15 s, and extension at 72 °C for 6 min, with a final extension at 72 °C for 5 min.
Library preparation and sequencing
The purified PCR products were used for NGS library construction following the manufacturer′s instructions (AFTMag NGS DNA Clean Beads, Abclonal, catalog: RK20257; TruePrep® DNA Library Prep Kit V2 for Illumina, Vazyme, catalog: TD501). Library quality was assessed by the Bioanalyzer 2100 (Agilent, United States), and quantification was performed by RT-qPCR with reference to a standard library. Libraries were pooled in equimolar amounts to a final concentration of 2 nM and denatured with 0.1 M NaOH (Sigma, catalog: 72068). Sequencing was performed on the Illumina NovaSeq 6000 system (paired-end, 150 bp).
High-throughput sequencing data analysis
All sequencing reads were processed using Trim Galore (v0.6.6)59 with the parameters “–nextseq 30 –paired” to remove the adapter sequences (AGATCGGAAGAGC) from NovaSeq platforms. Reads longer than 20 bp were retained. Quality-controlled reads were then mapped to the combined genome of Mus musculus (GRCm39) and Drosophila melanogaster (dmel-all-chromosome-r6.36) using STAR (v2.7.6a)60 with default parameters, respectively. Uniquely mapped read pairs were counted against merged annotations from Mus musculus (Ensembl: GRCm39.104) and Drosophila melanogaster (Flybase: dmel-all-r6.36) using featureCounts (v2.0.1)61 with parameters “-p -B -C” and summarized as gene-level counts. Transcript abundance was calculated based on the transcript FASTA files downloaded from Ensembl release-104 (Mus_musculus.GRCm39.cdna.all.fa.gz and Drosophila_melanogaster.BDGP6.32.cdna.all.fa.gz) using Salmon (v1.10.2)62 with default parameters. Sequencing saturation was assessed by randomly subsampling the original libraries and examining the corresponding changes in the number of mouse genome-derived genes with more than 10 read counts. Read alignments were converted to bigwig files by bamCoverage63 and visualized at selected genomic regions by IGV (v2.16.0)64. Gene annotation information, such as chromosome, gene types, and gene lengths, was retrieved from Ensembl annotations (GRCm39.104). Visualization of the data was performed using various R packages: violin plots, boxplots, bar plots, line charts, the density plot, and scatter plots were generated with ggplot2 (v3.4.2)65; the upset plot was created with UpSetR (v1.4.0)66; and the heatmap was plotted using ComplexHeatmap (v2.14.0)67.
CompassAnalyzer
CompassAnalyzer was implemented in R and is publicly available at GitHub (https://github.com/thereallda/compassanalyzer). The workflow comprised three main steps: (1) quality control, (2) stepwise normalizations, and (3) NCIN capping level quantification. The detailed steps were outlined below.
Quality control
The objective of quality control was to eliminate problematic or noisy observations from downstream analysis. In this study, we used gene filtering to ensure data quality. To keep well-detected genes across samples, mouse genes with more than 29 counts in all sequencing libraries were retained for subsequent analysis. Drosophila transcripts with more than 29 counts in all sequencing libraries were kept for normalization procedures. All ribosomal RNA-encoded genes and TEC genes were excluded.
Stepwise normalizations
CompassAnalyzer implemented stepwise normalizations to adjust for unwanted variations, enabling the quantitative assessment of the NCIN capping level of individual transcripts. The goal of stepwise normalizations was to recover the ratio of RNA abundance between samples capturing NCIN-capped and all-capped RNAs. CompassAnalyzer first employed global scaling normalization to adjust gene-level read counts by library-wise scaling factors. Since equal amounts of Drosophila RNAs were added as spike-ins to samples after adapter ligation, subsequent amplification bias could be represented by the discordance of spike-in counts. Library-wise scaling factors (f) were generated based on read counts from spike-in using the trimmed mean of M-values (TMM) normalization method from the R package edgeR (v3.40.2)68. Particularly, CompassAnalyzer adjusted the library-wise scaling factors based on the relative proportion of spike-in read counts ({p}_{k}^{*}). The proportion of spike-in read counts was defined as ({p}_{k}=frac{{Y}_{{spike}-{in},k}}{{Y}_{{sample},k}}), and the relative proportion of spike-in read counts of all-capped RNA and NCIN-capped RNA libraries was defined as ({p}_{{in},k}^{*}=frac{{p}_{{in},k}}{{bar{p}}_{{in}}}) and ({p}_{{en},k}^{*}=frac{{p}_{{en},k}}{{bar{p}}_{{en}}}), respectively. Here, ({Y}_{{spike}-{in},k}) was the sum of spike-in read counts in library (k) and ({Y}_{{sample},k}) was the sum of sample read counts in library (k), ({bar{p}}_{{in}}) and ({bar{p}}_{{en}}) were the average proportion of spike-in read counts for all-capped RNA and NCIN-capped RNA libraries, respectively. Therefore, the scaled read counts ({Y}_{{gk}}^{*}) for gene (g) in library (k) can be defined by ({Y}_{{gk}}^{*}={Y}_{{gk}}/({f}_{k}*{p}_{k}^{*})), where ({Y}_{{gk}}) was the raw read counts for gene (g) in library (k). Next, CompassAnalyzer introduces the adjustment factors to adjust gene-level read counts. Genes with ({Y}_{{en},{gk}}^{*}/{Y}_{{in},{g}{k}^{{prime} }}^{*}) exceeding 1 in at least one sample were denoted as the gene set ({Gc}) by default. For each sample (j), the adjustment factors can be estimated as ({r}_{j}=frac{1}{{N}_{{Gc}}}*sum ({log }_{2}{Y}_{{en},{Gck}}^{*}-{log }_{2}{Y}_{{in},{Gc}{k}^{{prime} }}^{*})), where ({N}_{{Gc}}) is the number of genes in gene set Gc, ({Y}_{{en},k}^{*}) and ({Y}_{{in},,{k}^{{prime} }}^{*}) were the scaled read counts from the paired NCIN-capped RNA library (k) and all-capped RNA library ({k}^{{prime} }), respectively.
To further reduce the unwanted variation, CompassAnalyzer implemented an RUV strategy for unwanted variation estimation. Briefly, genes from spike-in that have constant expression between NCIN-capped RNA libraries and all-capped RNA libraries were used to derive the unwanted variations. RUV was then applied to estimate the unwanted factors matrix W and its associated nuisance parameters α as previously described34,35. Finally, for a chosen k (1 ≤ k ≤ j), the normalized read counts can be defined by (Z={Y}^{*}-{hat{W}}^{left(kright)}{hat{alpha }}^{left(kright)}-{2}^{{r}_{j}}).
NCIN capping level quantification
The NCIN capping level ((Q)) of gene (g) in sample (j) could be calculated as: ({Q}_{{gj}}=,frac{{Z}_{{en},{gk}}}{{Z}_{{en},{gk}{prime} }}). Genes with low read counts tend to suffer from a high variability, which lead to inflated estimates of NCIN capping ratios. To obtain stabilized NCIN capping estimates, CompassAnalyzer incorporated empirical Bayes shrinkage of NCIN capping ratio using ashr R package69. For subsequent analysis, only NCIN-RNAs with a coefficient of variation below 0.3 were retained.
Gene-specific quantification of NCIN capping level by qPCR
Following CompasSeq enzymatic reactions, reverse transcription, and PCR enrichment, the resulting PCR products were used for gene-specific quantification of NCIN capping levels via qPCR. The qPCR was conducted using primers listed in Supplementary Data 1. GAPDH1 from Drosophila was used as the baseline internal control. To calculate the relative enrichment from RT-qPCR data, the Ct value of the target gene was first normalized to the Ct of the GAPDH1. The normalized value from the epitranscriptome capture procedure (ΔCt of the target gene normalized to GAPDH1) was then normalized to the background (ΔCt calculation for the gene in the transcriptome capturing procedure), yielding the ΔΔCt value. The linear conversion of this ΔΔCt resulted in the fold enrichment.
Quantitative exoribonuclease reduction assay
For assays depicted in Fig. 5c, reactions with dRai1 and Xrn1 were performed by adding 0.5 µL of dRai1 (final concentration: 340 nM) and 2 U of Xrn1 (NEB, catalog: M0338) to 1 µg of either NAD- or m7G-RNA (106 nt), resuspended in 20 μL of 1× NEBuffer r3.1 and incubated at 37 °C for 1 h with 10 U of RNaseOUT. Products were analyzed by a 12% polyacrylamide UREA-PAGE gel. For assays shown in Fig. 5e, 500 nt spike-in RNAs generated from different sequence templates, including 1 ng each of NAD-, FAD-, dpCoA-, m7G-, and ppp-RNA, were mixed with 1 μg of total RNAs from 2-month C57BL/6 mouse livers (n = 3), followed by treatment with dRai1 and Xrn1 or mock treatment. RT-qPCR was performed as described above, using primers listed in Supplementary Data 1. ppp-RNA was used as the baseline internal control. To calculate the relative levels, the Ct value of the target gene was first normalized to the Ct of the ppp-RNA. The normalized value from the treatment with dRai1 and Xrn1 (ΔCt of the target gene normalized to the ppp-RNA) was then normalized to the background (ΔCt calculation for mock treatment), yielding the ΔΔCt value. For assays shown in Fig. 5f, 500 nt spike-in RNAs generated from different sequence templates, including 1 ng each of 0% NAD-RNA/100% m7G-RNA, 10% NAD-RNA/90% m7G-RNA, 30% NAD-RNA/70% m7G-RNA, 50% NAD-RNA/50% m7G-RNA, 70% NAD-RNA/30% m7G-RNA, 90% NAD-RNA/10% m7G-RNA, and ppp-RNA, were mixed with 1 μg of total RNAs from 2-month C57BL/6 mouse livers (n = 3), followed by dRai1 and Xrn1 or mock treatment.
RNA alternative TSS, splicing, and polyadenylation analysis
TSS information of RNAs was extracted using the refTSS dataset (refTSS_v4.1_mouse_coordinate.mm39.bed.gz)70. Genes with multiple TSSs were classified as exhibiting alternative TSS usage. AS events were identified using rMATS (v4.1.2)71 with BAM files from transcriptome-capturing samples. Event counts included reads spanning junctions defined by rMATS and reads not crossing an exon boundary. Splicing events were filtered based on coverage, retaining only those with more than zero read counts. For APS analysis, DaPars272 was applied to transcriptome-capturing samples to calculate the percentage of distal PDUI for individual NCIN-capped RNA. Transcripts with a PDUI greater than 0.3 were retained for further analysis.
Analysis of conserved sequences and RNA secondary structure
Conservation analysis was performed using PhastCons scores (phastCons35way.UCSC.mm39) obtained from the R package GenomicScores (v2.10.0)46. The conservation score for each NCIN-capped isoform was calculated by averaging the PhastCons scores across the 5′ untranslated region (UTR) of the transcript. For each transcript with 5′ UTR, the sequence of 100 bp region downstream of TSS was used to calculate RNA MFE by ViennaRNA with default parameters48. To generate a background distribution of MFE, transcripts not containing NCIN caps were randomly sampled 1000 times from the whole transcriptome (after subtracting NCIN-RNAs) with a similar size (n = 5000) to transcripts containing NCIN caps (n = 5462).
GMUCT
GMUCT libraries were constructed and sequenced for 2-month-old and 18-month-old mouse livers as described by Endres M et al.49, with the following modifications: In brief, poly(A) + RNA was first isolated from total RNA, followed by 5′ adapter ligation to capture uncapped RNA molecules. The ligated RNA was then reverse transcribed, and PCR amplification was performed using primers complementary to the adapter sequences. The resulting cDNA was fragmented and used for final library construction. The resulting libraries were sequenced on the Illumina NovaSeq 6000 system (paired-end, 150 bp). Raw reads on each gene were counted by featureCounts and normalized using the TMM normalization method from the edgeR package. “Proportion uncapped” for each gene was calculated as the log-ratio of TMM-normalized read counts between GMUCT and RNA-seq. To further investigate the impact of NCIN-capping on RNA stability during aging, we grouped the transcripts based on age-related changes in their modification status.
Ribosome profiling data analysis
Raw counts from GSE12398152 were normalized using the TMM normalization method implemented in the edgeR package. RO for each gene was calculated as the log-ratio of TMM-normalized read counts between Ribo-seq and RNA-seq. To investigate the correlation between RO and NCIN capping during aging, we calculated the fold change in RO between the 20-month-old and 3-month-old samples and grouped the transcripts based on age-related changes in their modification status.
Pathway enrichment analysis
Pathway enrichment analysis was performed using the R package gprofiler2 (v0.2.1)73. Pathways were defined based on the molecular pathways of Reactome, the biological process of GO, and the Kyoto Encyclopedia of Genes and Genomes database. Enriched gene sets were constrained to sizes ranging between 5 and 350 genes. Multiple testing corrections were performed using gprofiler2’s built-in “g_SCS” method, with terms having an adjusted p value of less than 0.05 considered significantly enriched. The top terms were ranked by the smallest adjusted p values in each set and were selected for visualization.
Analyses of differentially expressed genes and differential NCIN capping genes and isoforms
Differentially expressed genes were analyzed from datasets of all-capped RNAs between 2-month-old (young) and 18-month-old (old) mouse livers using the edgeR package. The significance of logarithmic fold changes was determined by a likelihood ratio test to approximate p values, with genes adjusted for multiple testing using the Bonferroni procedure to yield a false discovery rate (FDR). Differential expression genes were defined as those with an absolute fold change in normalized read count ≥ 1.5 and FDR < 0.05 in old compared to young samples (Supplementary Data 5). Differential NCIN capping genes were defined as those with an absolute fold change in NCIN capping ≥ 1.5 in old compared to young samples. Differential NCIN-capped isoforms were defined as those with an absolute fold change in NCIN capping ≥ 1.25 in old compared to young samples.
Statistics and reproducibility
No statistical methods were used to predetermine sample size. All data were included in the analyses. The experiments were not randomized, and investigators were not blinded to group allocation. RNA-seq experiments were performed with three biological replicates. Unless otherwise specified, p values were calculated using two-sided nonparametric Mann–Whitney tests. All gel blots were independently repeated at least twice with similar results.
Reporting summary
Further information on research design is available in the Nature Portfolio Reporting Summary linked to this article.
Data availability
Source data used for the generation of Figures are provided as a Source Data file. All high-throughput RNA sequencing data as well as transcript quantifications have been deposited at the Gene Expression Omnibus under accession code GSE253549. Source data are provided with this paper.
Code availability
CompassAnalyzer is available as an R package on GitHub (https://github.com/thereallda/compassanalyzer) under the MIT license and archived at Zenodo at https://doi.org/10.5281/zenodo.15396748 (ref. 74).
References
-
Topisirovic, I., Svitkin, Y. V., Sonenberg, N. & Shatkin, A. J. Cap and cap-binding proteins in the control of gene expression. Wiley Interdiscip. Rev. RNA 2, 277–298 (2011).
-
Ramanathan, A., Robb, G. B. & Chan, S. H. mRNA capping: biological functions and applications. Nucleic Acids Res. 44, 7511–7526 (2016).
-
Malygin, A. G. & Shemyakin, M. F. Adenosine, NAD and FAD can initiate template-dependent RNA a synthesis catalyzed by Escherichia coli RNA polymerase. FEBS Lett. 102, 51–54 (1979).
-
Huang, F. Efficient incorporation of CoA, NAD and FAD into RNA by in vitro transcription. Nucleic Acids Res. 31, e8 (2003).
-
Bird, J. G. et al. The mechanism of RNA 5′ capping with NAD+, NADH and desphospho-CoA. Nature 535, 444–447 (2016).
-
Julius, C. & Yuzenkova, Y. Bacterial RNA polymerase caps RNA with various cofactors and cell wall precursors. Nucleic Acids Res. 45, 8282–8290 (2017).
-
Luciano, D. J., Levenson-Palmer, R. & Belasco, J. G. Stresses that raise Np4A levels induce protective nucleoside tetraphosphate capping of bacterial RNA. Mol. Cell 75, 957–966.e8 (2019).
-
Chen, Y. G., Kowtoniuk, W. E., Agarwal, I., Shen, Y. & Liu, D. R. LC/MS analysis of cellular RNA reveals NAD-linked RNA. Nat. Chem. Biol. 5, 879–881 (2009).
-
Cahová, H., Winz, M. L., Höfer, K., Nübel, G. & Jäschke, A. NAD captureSeq indicates NAD as a bacterial cap for a subset of regulatory RNAs. Nature 519, 374–377 (2015).
-
Walters, R. W. et al. Identification of NAD+ capped mRNAs in Saccharomyces cerevisiae. Proc. Natl. Acad. Sci. USA 114, 480–485 (2017).
-
Jiao, X. et al. 5′ End nicotinamide adenine dinucleotide cap in human cells promotes RNA decay through DXO-mediated deNADding. Cell 168, 1015–1027.e10 (2017).
-
Frindert, J. et al. Identification, biosynthesis, and decapping of NAD-capped RNAs in B. subtilis. Cell Rep. 24, 1890–1901.e8 (2018).
-
Wang, J. et al. Quantifying the RNA cap epitranscriptome reveals novel caps in cellular and viral RNA. Nucleic Acids Res. 47, e130–e130 (2019).
-
Wang, Y. et al. NAD+-capped RNAs are widespread in the Arabidopsis transcriptome and can probably be translated. Proc. Natl. Acad. Sci. USA 116, 12094–12102 (2019).
-
Morales-Filloy, H. G. et al. The 5′ NAD cap of RNAIII modulates toxin production in Staphylococcus aureus isolates. J Bacteriol 202, e00591–19 (2020).
-
Gomes-Filho, J. V. et al. Identification of NAD-RNA species and ADPR-RNA decapping in Archaea. Nat. Commun. 14, 1–12 (2023).
-
Hudeček, O. et al. Dinucleoside polyphosphates act as 5′-RNA caps in bacteria. Nat. Commun. 11, 1–11 (2020).
-
Shao, X. et al. DpCoA tagSeq: barcoding dpCoA-capped rna for direct nanopore sequencing via maleimide-thiol reaction. Anal. Chem. 95, 11124–11131 (2023).
-
Sherwood, A. V. et al. Hepatitis C virus RNA is 5′-capped with flavin adenine dinucleotide. Nature 619, 811–818 (2023).
-
František Potužník, J. et al. Diadenosine tetraphosphate (Ap4A) serves as a 5′ RNA cap in mammalian cells. Angew. Chem. Int. Ed. 63, e202314951 (2024).
-
Shao, X. et al. NAD tagSeq for transcriptome-wide identification and characterization of NAD+-capped RNAs. Nat. Protoc. 15, 2813–2836 (2020).
-
Hu, H. et al. SPAAC-NAD-seq, a sensitive and accurate method to profile NAD+-capped transcripts. Proc. Natl. Acad. Sci. USA 118, (2021).
-
Zhang, H. et al. Use of NAD tagSeq II to identify growth phase-dependent alterations in E. coli RNA NAD+ capping. Proc. Natl. Acad. Sci. USA 118, e2026183118 (2021).
-
Niu, K. et al. ONE-seq: epitranscriptome and gene-specific profiling of NAD-capped RNA. Nucleic Acids Res. 51, E12 (2023).
-
Sharma, S., Yang, J., Favate, J., Shah, P. & Kiledjian, M. NADcapPro and circNC: methods for accurate profiling of NAD and non-canonical RNA caps in eukaryotes. Commun. Biol. 6, 406 (2023).
-
Ge, S. et al. Hidden features of NAD-RNA epitranscriptome in Drosophila life cycle. iScience 27, 108618 (2024).
-
Vvedenskaya, I. O. et al. CapZyme-seq comprehensively defines promoter-sequence determinants for RNA 5′ capping with NAD+. Mol. Cell 70, 553–564.e9 (2018).
-
Grudzien-Nogalska, E. et al. Structural and mechanistic basis of mammalian Nudt12 RNA deNADding. Nat. Chem. Biol. 15, 575–582 (2019).
-
López-Otín, C., Galluzzi, L., Freije, J. M. P., Madeo, F. & Kroemer, G. Metabolic Control of longevity. Cell 166, 802–821 (2016).
-
López-Otín, C., Blasco, M. A., Partridge, L., Serrano, M. & Kroemer, G. Hallmarks of aging: an expanding universe. Cell 186, 243–278 (2023).
-
Yoshino, J., Mills, K. F., Yoon, M. J. & Imai, S. I. Nicotinamide mononucleotide, a key NAD+ intermediate, treats the pathophysiology of diet- and age-induced diabetes in mice. Cell Metab. 14, 528–536 (2011).
-
Yoshino, J., Baur, J. A. & Imai, S. I. NAD+ Intermediates: the biology and therapeutic potential of NMN and NR. Cell Metab. 27, 513–528 (2018).
-
Tang, C. M. et al. Multi-omics reveals aging-related pathway in natural aging mouse liver. Heliyon 9, e21011 (2023).
-
Li, D. et al. Epitranscriptome analysis of NAD-capped RNA by spike-in-based normalization and prediction of chronological age. iScience 26, 108558 (2023).
-
Risso, D., Ngai, J., Speed, T. P. & Dudoit, S. Normalization of RNA-seq data using factor analysis of control genes or samples. Nat. Biotechnol. 32, 896–902 (2014).
-
Schweibenz, B. D., Solotchi, M., Hanpude, P., Devarkar, S. C. & Patel, S. S. RIG-I recognizes metabolite-capped RNAs as signaling ligands. Nucleic Acids Res. 51, 8102–8114 (2023).
-
Nübel, G., Sorgenfrei, F. A. & Jäschke, A. Boronate affinity electrophoresis for the purification and analysis of cofactor-modified RNAs. Methods 117, 14–20 (2017).
-
Doamekpor, S. K. et al. DXO/Rai1 enzymes remove 5′-end FAD and dephospho-CoA caps on RNAs. Nucleic Acids Res. 48, 6136–6148 (2020).
-
Wulf, M. G. et al. The yeast scavenger decapping enzyme DcpS and its application for in vitro RNA recapping. Sci. Rep. 9, 1–9 (2019).
-
Love, M. I., Huber, W. & Anders, S. Moderated estimation of fold change and dispersion for RNA-seq data with DESeq2. Genome Biol. 15, 1–21 (2014).
-
Alfonso-Gonzalez, C. et al. Sites of transcription initiation drive mRNA isoform selection. Cell 186, 2438–2455.e22 (2023).
-
Keren, H., Lev-Maor, G. & Ast, G. Alternative splicing and evolution: diversification, exon definition and function. Nat. Rev. Genet. 11, 345–355 (2010).
-
Tian, B. & Manley, J. L. Alternative polyadenylation of mRNA precursors. Nat. Rev. Mol. Cell Biol. 18, 18–30 (2016).
-
Bird, J. G. et al. Highly efficient 5’ capping of mitochondrial RNA with NAD + and NADH by yeast and human mitochondrial RNA polymerase. Elife 7, e42179 (2018).
-
Zhang, Y. et al. Extensive 5′-surveillance guards against non-canonical NAD-caps of nuclear mRNAs in yeast. Nat. Commun. 11, 1–17 (2020).
-
Siepel, A. et al. Evolutionarily conserved elements in vertebrate, insect, worm, and yeast genomes. Genome Res. 15, 1034–1050 (2005).
-
Ohno, M., Sakamoto, H. & Shimura, Y. Preferential excision of the 5’ proximal intron from mRNA precursors with two introns as mediated by the cap structure. Proc. Natl. Acad. Sci. USA 84, 5187–5191 (1987).
-
Gruber, A. R., Lorenz, R., Bernhart, S. H., Neuböck, R. & Hofacker, I. L. The Vienna RNA websuite. Nucleic Acids Res. 36, W70–W74 (2008).
-
Endres, M. W., Cook, R. T. & Gregory, B. D. A high-throughput sequencing-based methodology to identify all uncapped and cleaved RNA molecules in eukaryotic genomes. Methods Mol. Biol. 732, 209–223 (2011).
-
Willmann, M. R., Berkowitz, N. D. & Gregory, B. D. Improved genome-wide mapping of uncapped and cleaved transcripts in eukaryotes—GMUCT 2.0. Methods 67, 64–73 (2014).
-
Yu, X. et al. Messenger RNA 5′ NAD+ capping is a dynamic regulatory epitranscriptome mark that is required for proper response to abscisic acid in Arabidopsis. Dev. Cell 56, 125–140.e6 (2021).
-
Anisimova, A. S. et al. Multifaceted deregulation of gene expression and protein synthesis with age. Proc. Natl. Acad. Sci. USA 117, 15581–15590 (2020).
-
Vinther, J. Comment on “DpCoA tagSeq: barcoding dpCoA-capped RNA for direct nanopore sequencing via maleimide-thiol reaction. Anal. Chem. 96, 606–609 (2024).
-
Shao, X. et al. Response to the comment on “DpCoA tagSeq: barcoding dpCoA-capped RNA for direct nanopore sequencing via maleimide-thiol reaction. Anal. Chem. 96, 610–613 (2024).
-
Baker, S. C. et al. The external RNA controls consortium: a progress report. Nat. Methods 2, 731–734 (2005).
-
Cambronne, X. A. et al. Biosensor reveals multiple sources for mitochondrial NAD+. Science 352, 1474–1477 (2016).
-
Heikal, A. A. Intracellular coenzymes as natural biomarkers for metabolic activities and mitochondrial anomalies. Biomark. Med. 4, 241–263 (2010).
-
Wang, X. et al. Toll/interleukin-1 receptor (TIR) domain-containing proteins have NAD-RNA decapping activity. Nat. Commun. 15, 1–14 (2024).
-
Krueger, F. Trim galore. A wrapper tool around Cutadapt and FastQC to consistently apply quality and adapter trimming to FastQ Files, with extra functionality for RRBS data. 516–517 (2015).
-
Dobin, A. et al. STAR: ultrafast universal RNA-seq aligner. Bioinformatics 29, 15–21 (2013).
-
Liao, Y., Smyth, G. K. & Shi, W. featureCounts: an efficient general purpose program for assigning sequence reads to genomic features. Bioinformatics 30, 923–930 (2014).
-
Patro, R., Duggal, G., Love, M. I., Irizarry, R. A. & Kingsford, C. Salmon provides fast and bias-aware quantification of transcript expression. Nat. Method 14, 417–419 (2017).
-
Ramírez, F. et al. deepTools2: a next generation web server for deep-sequencing data analysis. Nucleic Acids Res. 44, W160–W165 (2016).
-
Thorvaldsdóttir, H., Robinson, J. T. & Mesirov, J. P. Integrative genomics viewer (IGV): high-performance genomics data visualization and exploration. Brief. Bioinform. 14, 178–192 (2013).
-
Wickham, H. ggplot2. Wiley Interdiscip. Rev. Comput. Stat. 3, 180–185 (2011).
-
Lex, A., Gehlenborg, N., Strobelt, H., Vuillemot, R. & Pfister, H. UpSet: visualization of intersecting sets. IEEE Trans. Vis. Comput. Graph 20, 1983–1992 (2014).
-
Gu, Z., Eils, R. & Schlesner, M. Complex heatmaps reveal patterns and correlations in multidimensional genomic data. Bioinformatics 32, 2847–2849 (2016).
-
Robinson, M. D., McCarthy, D. J. & Smyth, G. K. edgeR: a bioconductor package for differential expression analysis of digital gene expression data. Bioinformatics 26, 139–140 (2010).
-
Stephens, M. False discovery rates: a new deal. Biostatistics 18, 275–294 (2017).
-
Abugessaisa, I. et al. refTSS: a reference data set for human and mouse transcription start sites. J. Mol. Biol. 431, 2407–2422 (2019).
-
Shen, S. et al. rMATS: robust and flexible detection of differential alternative splicing from replicate RNA-Seq data. Proc. Natl. Acad. Sci. USA 111, E5593–E5601 (2014).
-
Li, L. et al. An atlas of alternative polyadenylation quantitative trait loci contributing to complex trait and disease heritability. Nat. Genet. 53, 994–1005 (2021).
-
Kolberg, L. et al. g:Profiler—interoperable web service for functional enrichment analysis and gene identifier mapping (2023 update). Nucleic Acids Res. 51, W207–W212 (2023).
-
Li, D. thereallda/compassanalyzer: v0.1.1-zenodo. https://doi.org/10.5281/ZENODO.15396749.
Acknowledgments
This work was supported by grants from the National Natural Science Foundation of China to N.L. (32470616) L.Q. (8237020490), Shanghai Key Laboratory of Aging Studies (19DZ2260400) to N.L., Outstanding Academic/Technical Leaders Program of Shanghai Municipal Commission of Science and Technology (20XD1404900) to L.Q., special project of Shanghai Municipal Health Commission on aging and maternal and child health (2020YJZX0125) to L.Q., innovative clinical research project of the Second Affiliated Hospital of the Naval Military Medical University (2020YLCYJ-Z09) to L.Q., clinical research projects initiated by researchers in demonstration research wards (2023YJBF-FH04) to L.Q.
Ethics declarations
Competing interests
The authors declare no competing interests.
Peer review
Peer review information
Nature Communications thanks Zhen Wei and the other, anonymous, reviewer(s) for their contribution to the peer review of this work. A peer review file is available.
Additional information
Publisher’s note Springer Nature remains neutral with regard to jurisdictional claims in published maps and institutional affiliations.
Supplementary information
Source data
Rights and permissions
Open Access This article is licensed under a Creative Commons Attribution-NonCommercial-NoDerivatives 4.0 International License, which permits any non-commercial use, sharing, distribution and reproduction in any medium or format, as long as you give appropriate credit to the original author(s) and the source, provide a link to the Creative Commons licence, and indicate if you modified the licensed material. You do not have permission under this licence to share adapted material derived from this article or parts of it. The images or other third party material in this article are included in the article’s Creative Commons licence, unless indicated otherwise in a credit line to the material. If material is not included in the article’s Creative Commons licence and your intended use is not permitted by statutory regulation or exceeds the permitted use, you will need to obtain permission directly from the copyright holder. To view a copy of this licence, visit http://creativecommons.org/licenses/by-nc-nd/4.0/.
About this article

Cite this article
Liu, Y., Li, D., Wang, X. et al. CompasSeq: epitranscriptome-wide percentage assessment of metabolite-capped RNA at the transcript resolution. Nat Commun 16, 6676 (2025). https://doi.org/10.1038/s41467-025-61697-y
-
Received:
-
Accepted:
-
Published:
-
DOI: https://doi.org/10.1038/s41467-025-61697-y