
Main
Cells obtain pyrimidine nucleotides for DNA and RNA synthesis either by de novo biosynthesis or by salvage of preformed bases1. Dihydroorotate dehydrogenase (DHODH) catalyses the fourth step of the biosynthetic pathway: oxidation of dihydroorotate (DHO) to orotate. In most eukaryotes, DHODH is bound to the external surface of the inner mitochondrial membrane, where it uses ubiquinone (UQ) as an electron acceptor. Once UQ is reduced by DHODH, it is re-oxidized by respiratory complex III. Therefore, DHODH activity couples pyrimidine biosynthesis with the mitochondrial electron transport chain (mETC)2. The biochemical consequence of this coupling is that de novo pyrimidine biosynthesis is not possible in the absence of mitochondrial electron transport: the failure to re-oxidize UQH2 to UQ causes a build-up in the UQH2/UQ ratio, depleting the pool of UQ that DHODH requires to function. This explains why cells lacking mitochondrial DNA (mtDNA) or treated with mitochondrial inhibitors affecting complexes III or IV benefit from exogenous uridine supplementation to grow3,4,5,6.
Organisms that are capable of growing in the absence of oxygen must produce orotate through a different mechanism. Here, DHODH is either linked to an alternative ETC or is a cytosolic enzyme that uses either NAD+ or fumarate as electron acceptors7,8,9. In these organisms, pyrimidine biosynthesis can thus proceed independently of cellular respiration. In yeast, the distribution of DHODH isoenzymes across various species appears to mirror their growth preferences: aerobic species harbour a mitochondrial DHODH, whereas facultative anaerobes possess a cytosolic DHODH10. Anaerobic yeasts seem to have acquired the cytosolic DHODH gene by horizontal transfer from a bacterial source and to subsequently have lost their eukaryotic gene11. Oxygen-independent pyrimidine biosynthesis is therefore one of the main adaptations that enabled anaerobic growth12.
The reason why evolution favoured the coupling of pyrimidine biosynthesis with the mETC remains unknown. In this work, we asked whether it is possible to uncouple these two processes in mammalian cells by expressing the gene encoding cytosolic DHODH.
Results
Expression of Saccharomyces cerevisiae URA1 gene in mammalian cells
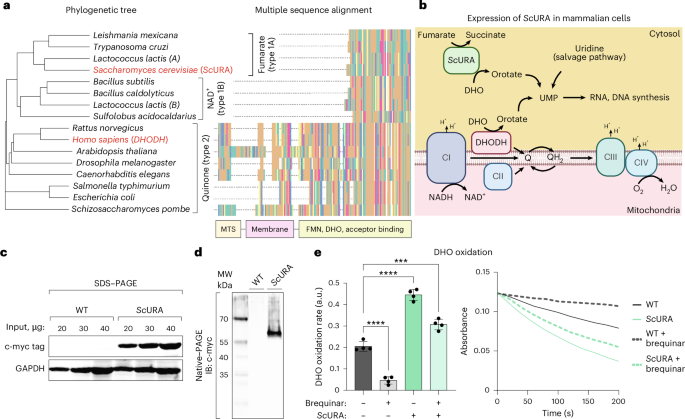
In aerobic eukaryotes, DHODH shuttles electrons through UQ to complex III and functions as a respiratory enzyme13. Other unicellular organisms have evolved different versions of DHODH, which use either fumarate or NAD+ as electron acceptors to oxidize DHO. These isoenzymes typically lack a mitochondrial import signal and a transmembrane domain, residing instead in the cytosol (Fig. 1a).

a, Phylogenetic tree (left) and corresponding sequence alignment (right) built from the amino acid sequences of DHODH isoforms from various phyla. H. sapiens and S. cerevisiae are highlighted in red. The functional domains are shown at the bottom of the multiple sequence alignment, highlighting the lack of the MTS and of the transmembrane domain in type 1A and type 1B DHODHs. In the sequence alignment, only the first 200 amino acids are shown. FMN, flavin mononucleotide. b, Scheme showing the uridine monophosphate (UMP) production pathways by either mitochondrial DHODH, cytosolic ScURA or exogenous uridine. c, Immunoblot showing the expression of the myc-tagged ScURA protein in ScURA–expressing 143B cells. d, The same sample as in c was run in native conditions, without SDS. The resulting immunoblot shows the myc-tagged ScURA dimer. Data in c and d are representative of two independent experiments each. e, DHODH-dependent DHO oxidation rate, measured as the reduction of DCPIP, of cell homogenates from ScURA–expressing or control 143B cells. The DCPIP reduction rates per minute (left; Methods) and linear slopes of light absorbance at 600 nm from the first 200 s (right panel) are shown. a.u., arbitrary units. n = 4 independent biological replicates. Data are represented as means; error bars, s.d. Ordinary one-way ANOVA, Šidák’s multiple comparison test (WT versus WT + brequinar and WT versus ScURA, P < 0.0001; WT versus ScURA + brequinar, P = 0.0001). ****P < 0.0001; ***P < 0.001. Panel b created in BioRender; Enriquez, J. https://biorender.com/l7jbv83 (2026).
To enable mETC-independent de novo pyrimidine biosynthesis, we ectopically expressed Saccharomyces cerevisiae URA1 gene (ScURA) in mammalian cells (Fig. 1b). The yeast gene’s cDNA was codon-optimized for mammalian expression, and a myc tag was added at the carboxyl terminus through a flexible (GGS)3 linker to prevent steric interference between the tag and the enzyme (Supplementary Data). The gene was cloned into a lentiviral vector, and an empty vector was used as the control for all subsequent experiments. In human 143B cells, we were able to detect ScURA expression by western blot (Fig. 1c). Previous studies have shown that S. cerevisiae URA1 is a cytosolic protein that forms homodimers14. Accordingly, when 143B homogenates were separated by native, non-denaturing polyacrylamide gel electrophoresis (PAGE), we observed that ScURA migrated more slowly than expected for its monomeric mass (36 kDa) and toward the expected size of the homodimer (Fig. 1d). When we tested DHODH enzymatic activity in cell homogenates, we found that ScURA-expressing cells possessed 2.25 times more activity than controls (Fig. 1e). Approximately two-thirds of this activity was insensitive to brequinar inhibition, as brequinar targets the UQ binding site of human DHODH, which is not present in ScURA15. Therefore, ScURA expression provides an alternative pathway for DHO dehydrogenation in human cells.
ScURA provides an alternative pathway for de novo pyrimidine biosynthesis
Under normal cell culture conditions, DHODH activity is not a rate-limiting factor for cell proliferation, and exogenous uridine supplementation is unnecessary (Fig. 2a). Consistently, expression of ScURA did not affect cell proliferation or mitochondrial function and morphology in 143B cells (Fig. 2b–d and Extended Data Fig. 1). To test whether ScURA could replace the endogenous DHODH activity in proliferating cells, we treated 143B cells with brequinar and rescued pyrimidine biosynthesis inhibition by supplementing uridine in the growth medium. Brequinar suppressed cell proliferation in control cells, which was fully restored upon uridine supplementation (Fig. 2e). On the other hand, in ScURA–expressing cells, brequinar had no discernible effect on cell proliferation. We next used CRISPR–Cas9 to generate DHODH knockout (KO) 143B cells (Fig. 2f). As expected, these cells required exogenous uridine to proliferate (Fig. 2g). We then reintroduced ScURA, human DHODH (hDHODH) or hDHODH lacking its mitochondrial targeting sequence (MTS) and the transmembrane domain (hDHODH-ΔMTS) using a lentiviral vector. Re-expression of either hDHODH or ScURA was sufficient to restore uridine-independent cell proliferation, while the hDHODH-ΔMTS variant failed to rescue the phenotype. Furthermore, uridine supplementation offered no additional growth advantage to cells expressing ScURA, demonstrating that it fully compensates for the loss of mitochondrial DHODH. To directly measure the flux through de novo pyrimidine synthesis, we cultured wild-type (WT) and ScURA–expressing cells with [α-15N]glutamine (Fig. 2h), whose nitrogen specifically labels the pyrimidine rings on pyrimidine nucleotides such as uridine triphosphate (UTP) and cytidine triphosphate (CTP). We observed similar rates of UTP and CTP labelling in both cell lines under basal conditions (Fig. 2i,j). Chemical inhibition of DHODH (with brequinar) or of the mETC (with antimycin and myxothiazol) ablated labelling in WT cells. By contrast, ScURA–expressing cells maintained UTP and CTP synthesis in both conditions. These results demonstrate that ScURA enables brequinar-insensitive de novo pyrimidine biosynthesis in human cells by bypassing mitochondrial DHODH.

a, Cell doublings of ScURA–expressing and control 143B cells grown in normal culture media; n = 6 independent biological replicates, two-sided Welch’s t-test; ns, not significant. b, Oxygen consumption rate (OCR) of 143B cells expressing ScURA permeabilized with digitonin and incubated with ADP (basal) plus substrates for complex I (G/M, glutamate/malate) and complex II (Succ, succinate)-dependent respiration; n = 8 (WT) and n = 7 (ScURA) independent biological replicates. Rot, rotenone; AmA, antimycin A. Data are means; error bars, s.d. c, ATP production rate in isolated mitochondria determined by a luciferase-dependent assay; data are normalized on total protein. Data are means; error bars, s.d. d, Confocal microscopy analysis of total mitochondria count in 143B cells; each dot represents an individual cell. Two-sided Welch’s t-test. e, Cell doublings of ScURA–expressing and control 143B cells treated with brequinar and/or supplemented with uridine (WT versus WT + brequinar and WT + brequinar versus WT + brequinar + uridine, P < 0.0001). f, Immunoblot showing DHODH KO in 143B cells and re-expression of DHODH or ScURA. g, Cell doublings of 143B-DHODHKO cells cultured with or without exogenous uridine (DHODHKO −uridine versus +uridine and DHODHKO + hDHODH-ΔMTS −uridine versus +uridine, P < 0.0001). h, [α-15N]glutamine tracing strategy. The heavy nitrogen atom from the α-amine of glutamine is passed to aspartate via glutamate. Some intermediate reactions have been omitted for simplicity. i, Percentage of labelled UTP and CTP in WT and ScURA–expressing cells treated with brequinar or antimycin/myxothiazol (anti/myxo), n = 3 biological replicates per condition (UTP: WT versus WT + brequinar and WT versus WT + anti/myxo, P < 0.0001; CTP: WT versus WT + brequinar and WT versus WT + anti/myxo, P < 0.0001; WT versus ScURA, P = 0.0138). j, Mass isotopologue distribution of aspartate, UTP and CTP from [α-15N]glutamine tracing. The total levels of aspartate for each condition are shown in Extended Data Fig. 2a. Data are means of n = 3 independent biological replicates per condition; error bars, s.d. For c, e, g and i, ordinary one-way ANOVA, Šidák’s multiple comparison test, ****P < 0.0001; *P < 0.05.
ScURA restores pyrimidine biosynthesis in cells with disrupted mETC
The dependency of pyrimidine biosynthesis on the mETC was first discovered in chick embryo cells treated with chloramphenicol, which were found to be auxotrophic for uridine5. Chloramphenicol, a mitochondrial ribosome inhibitor, impedes the assembly of respiratory complexes and the ATP synthase, blocking the electron flux through the mETC. Therefore, we investigated whether ScURA expression could restore pyrimidine biosynthesis and rescue cell proliferation in cells treated with chloramphenicol. To this end, we cultured 143B cells in chloramphenicol and uridine for 1 week before assessing their ability to grow without uridine. Although uridine supplementation was essential to maintain proliferation in WT cells, ScURA–expressing cells were able to grow at the same rate in the absence of uridine (Fig. 3a). We next sought to investigate whether ScURA could rescue cell proliferation when ubiquinol oxidation by complex III was disrupted. We treated cells with both antimycin A and myxothiazol to completely block electron flow through complex III16,17,18, rendering cells auxotrophic for uridine3 (Fig. 3b,c). Under these conditions, ScURA expression was able to maintain cell proliferation at the same level as uridine supplementation (Fig. 3b). WT cells treated with antimycin A and myxothiazol could not be maintained past a single passage, in contrast to cells supplemented with uridine or carrying ScURA, which could be kept under complex III inhibition indefinitely. We next used semi-targeted metabolomics to address how ScURA–driven metabolic changes may support proliferation in 143B cells (Fig. 3d,e). ScURA–expressing cells displayed a decrease in DHO and an increase in orotate, which are the substrate and the product of the ScURA reaction, respectively (Fig. 3e,f). Although mETC inhibition in WT cells caused a massive (>600-fold) accumulation of DHO, this metabolite remained below the limit of detection in ScURA–expressing cells under the same conditions (Fig. 3f). The pools of free pyrimidines were decreased when cells expressed ScURA in basal conditions; however, ScURA expression was able to rescue the loss of UTP and CTP caused by mETC inhibition (Fig. 3f). Therefore, ScURA allows mETC-independent de novo pyrimidine biosynthesis in human cells. We also observed accumulation of flavin mononucleotide, the cofactor of ScURA, and a shift in urea cycle intermediates towards arginine synthesis, which is coupled with the production of fumarate, the substrate of ScURA (Fig. 3g). In conclusion, these results support the notion that ScURA restores proliferation upon ETC inhibition largely by supplying pyrimidines.

a, Cell doublings of ScURA–expressing and control 143B cells treated with chloramphenicol (chlor) and rescued with exogenous uridine supplementation (all significant comparisons, P < 0.0001). b, Cell doublings of ScURA–expressing and control 143B cells treated with antimycin and myxothiazol and rescued with exogenous uridine supplementation (all significant comparisons, P < 0.0001). c, Scheme showing the UMP production pathways upon respiratory complex III inhibition by antimycin A and myxothiazol. d, Volcano plots showing differential metabolite abundance in 143B cells expressing ScURA treated with either antimycin/myxothiazol or vehicle (ethanol). Metabolites involved in the ScURA reaction are shown in red, and other metabolites of interest are in blue. Adjusted P values were calculated using two-sided Student’s t-test. e, Heatmap showing unsupervised sample clustering based on z-score-scaled intensity values of de novo pyrimidine biosynthesis metabolites. f,g, Normalized intensity values of metabolites relative to 143B WT cells (DHO: all significant comparisons, P < 0.0001; orotate, WT versus ScURA, P = 0.0068; WT + anti/myxo versus ScURA + anti/myxo, P = 0.0113; UTP: WT versus ScURA and WT versus WT + anti/myxo, P < 0.0001; WT + anti/myxo versus ScURA + anti/myxo, P = 0.0001; CTP: WT versus ScURA, P = 0.0001; WT versus WT + anti/myxo, P < 0.0001; WT + anti/myxo versus ScURA + anti/myxo, P = 0.0013 (f); FMN: WT versus ScURA, P < 0.0001; WT + anti/myxo versus ScURA + anti/myxo, P < 0.0001; arginine: WT versus ScURA, P = 0.0072; WT + anti/myxo versus ScURA + anti/myxo, P = 0.0009 (g)). Data are presented as means of n = 3 independent biological replicates; error bars, s.d. Ordinary one-way ANOVA, Šidák’s multiple comparison test, ****P < 0.0001; ***P < 0.001; **P < 0.01; *P < 0.05. Panel c created in BioRender; Enriquez, J. https://biorender.com/yxlqkqw (2026).
Glutamine tracing reveals metabolic rewiring upon ScURA expression
ScURA takes reducing equivalents from DHO and deposits them onto fumarate instead of UQ, generating succinate, which in turn can then feed the tricarboxylic acid (TCA) cycle. Therefore, we investigated the impact of this metabolic shift by stable isotope tracing of [U-13C]glutamine (Fig. 4a), which allowed us to track the fate of TCA cycle metabolites. We compared metabolite abundance and labelling patterns between WT and ScURA–expressing cells, both in control conditions and upon acute mETC inhibition. In control conditions, we did not observe any accumulation of succinate in ScURA–expressing cells, probably because succinate can re-enter the TCA cycle and be converted to fumarate by succinate dehydrogenase (SDH) (Fig. 4b). However, the pools of other TCA cycle intermediates changed: α-ketoglutarate, malate and acetyl-CoA increased while citrate decreased, with a consequent increase of the α-ketoglutarate/citrate ratio (Fig. 4b,c and Extended Data Fig. 2a,b), a known determinant of reductive carboxylation19. Accordingly, the labelling pattern of citrate, aspartate and malate changed when ScURA was expressed, indicating reductive carboxylation metabolism (Fig. 4d,e). The above observations fit a model in which de novo pyrimidine biosynthesis is sustained by ScURA by creating a cycle of fumarate and succinate between the cytosol and the mitochondria (Fig. 4a). Given that the ScURA reaction causes a substantial flux of succinate into the TCA cycle, α-ketoglutarate accumulates, increasing the α-ketoglutarate/citrate ratio and driving reductive carboxylation.

a, Model for [U-13C]glutamine oxidation in WT cells (top), in cells expressing ScURA (middle) and in cells expressing ScURA with acute inhibition of the mETC (bottom). Some intermediate reactions have been omitted from the scheme for simplicity. b, Normalized intensity values of succinate and α-ketoglutarate relative to 143B WT cells (ordinary one-way ANOVA, Sidak’s multiple comparison test. Succinate: WT versus ScURA, P < 0.0001; WT + anti/myxo versus ScURA + anti/myxo, P = 0.0023; α-ketoglutarate: WT versus ScURA, P = 0.0031; WT versus WT + anti/myxo, P = 0.0385). c, Ratio of normalized intensity values of α-ketoglutarate to citrate, relative to 143B WT cells (ordinary one-way ANOVA, Dunnett’s multiple comparison test, WT versus ScURA, P = 0.0037; WT versus WT + anti/myxo, P = 0.0091; WT versus ScURA + anti/myxo, P < 0.0001). d, Mass isotopologue distribution of citrate, aspartate, malate, S-(2-succino)-cysteine (2-SC) and succinate from [U-13C]glutamine tracing in 143B cells. e, Percentage of labelled citrate, aspartate and malate relative to WT 143B cells (citrate, P < 0.0001; aspartate, P = 0.0475; malate, P < 0.0001). f, M+3 and m+4 labelling intensity of succinate in 143B WT and ScURA–expressing cells treated with anti/myxo (P = 0.0003). g, Scheme of generation and labelling of 2–SC from fumarate. h, M+3 and m+4 labelling intensity of 2-SC in 143B WT and ScURA–expressing cells treated with anti/myxo (P < 0.0001). In e, f and h: ordinary two-way ANOVA, Šidák’s multiple comparison test. Data are presented as means of n = 3 independent biological replicates; error bars, s.d. ****P < 0.0001; ***P < 0.001; **P < 0.01; *P < 0.05.
Blocking UQH2 oxidation prevents cells from oxidizing succinate, causing it to accumulate. This accumulation may be further increased by SDH reverse activity20,21,22. Here, ScURA expression modified the way succinate is produced: instead of being derived from α-ketoglutarate oxidation as in WT cells ([13C4]succinate or (m+4)), an important fraction of succinate was labelled as [13C3]succinate (m+3), with the labelling characteristic of reductive carboxylation (Fig. 4f). Citrate, malate and aspartate labelling also followed the same pattern. Therefore, the rate of oxidative carboxylation is enhanced in cells expressing ScURA and provides fumarate as an electron acceptor for DHO oxidation. We could not directly quantify fumarate with our metabolomic experiment. Therefore, we used S-(2-succino)-cysteine (2-SC), the product of the reaction between fumarate and cysteine, as a proxy for fumarate labelling (Fig. 4g). The m+3 labelling of 2-SC is consistent with fumarate being produced by reductive carboxylation and becoming the electron acceptor of the reaction catalysed by ScURA (Fig. 4h). ScURA was also able to restore the growth defect caused by mETC inhibition in two cell lines lacking SDH, excluding that ScURA activity depends on fumarate reduction through reverse SDH reaction20 (143B and U2OS SDHAKO; Extended Data Fig. 3). These results demonstrate that cells adjust their TCA flux to compensate for succinate production by ScURA.
We next asked whether ScURA expression leads to changes in gene expression by RNA sequencing. We found that 113 genes were differentially expressed between ScURA and WT cells in basal conditions (adjusted P < 0.05 and absolute log2(fold change) > 1; Extended Data Fig. 4a,b). Gene set enrichment analysis revealed an enrichment for pathways related to interferon production, hypoxia and cellular responses to oxygen levels (Extended Data Fig. 4c). To identify the regulators driving these changes, we inferred transcription factor activity using decoupleR23. This analysis revealed HIF1α as the most differentially active transcription factor, with a corresponding elevation in a group of its known target genes (Extended Data Fig. 4d,e). This observation is consistent with the finding that cytosolic succinate can stabilize HIF1α24.
The transcriptional impact of ScURA was far more pronounced upon mETC inhibition. In both 143B WT and ScURA–expressing cells, the integrated stress response was activated, with ATF4 being the top induced transcription factor, consistent with previous reports25 (Extended Data Fig. 5a–c), and ScURA–expressing cells activated genes involved in the integrated stress response similarly to WT cells (Extended Data Fig. 5b). We also noted that although the inferred transcriptional activity of MYC was blunted in both lines, the effect was less severe in ScURA–expressing cells, reflecting their sustained proliferation during mETC inhibition. When we analysed differentially expressed genes by gene set enrichment analysis in these conditions, the gene set that clearly stood out was cytoplasmic translation (Extended Data Fig. 5d). Indeed, complex III inhibition led to a profound downregulation of ribosomal protein mRNAs in WT cells. ScURA expression completely rescued this phenotype (Extended Data Fig. 5e). Ribosomal protein downregulation is a recognized consequence of mitochondrial dysfunction25. In the absence of a functional mETC, the shortage of CTP and UTP limits the transcription of genes encoding ribosomal proteins, while ScURA allows ribosomal protein mRNA synthesis by providing an alternative source of pyrimidines.
ScURA expression restores pyrimidine biosynthesis in disease models
We next sought to use ScURA in cellular models of mitochondrial diseases. Cells depleted of mtDNA, known as ρ0 cells, are dependent on uridine and pyruvate for growth4. We therefore asked whether we could revert the uridine auxotrophy in ρ0 cells with ScURA. Transduction of two ρ0 cell lines, mouse L929 ρ0 and human 143B ρ0, with the ScURA gene allowed growth in the absence of uridine, while maintaining their pyruvate dependence (Fig. 5a,b and Extended Data Fig. 6a,b). In 143B ρ0 cells, ScURA was able to drive DHO oxidation and synthesis of UTP and CTP (Fig. 5c–e). Mitochondrial diseases are a heterogeneous group of maladies with extremely variable clinical manifestations; they are poorly predictable and often lack an effective treatment. Cell lines derived from patients suffering from defects in respiratory complexes benefit from uridine supplementation26. Expression of the alternative oxidase (AOX) from Ciona intestinalis in human 293T cells confers cyanide resistance to cells27. Equally, expression of AOX from Emericella nidulans in mouse L929 ρ0 cells rescues uridine auxotrophy28. In mouse and human cells deficient for complex III or complex IV, AOX can also rescue uridine auxotrophy, ameliorating their metabolic phenotype29,30. In these scenarios, AOX restores the electron flux through the mETC, bypassing respiratory complex III and complex IV, allowing pyrimidine biosynthesis. To examine the implications of ScURA expression in cellular models of mitochondrial diseases, we expressed ScURA in Mt-Cybmut cells, which lack respiratory complex III because of a point mutation in the mtDNA cyb gene3, and in Cox10KO cells, which cannot assemble respiratory complex IV because of the absence of the COX10 assembly factor31 (Extended Data Fig. 6c). ScURA expression enabled the growth of both cell lines in the absence of uridine (Fig. 5f,g and Extended Data Fig. 6d,e). We concluded that the growth defects caused by pathological mutations in mitochondrial genes can be alleviated by ScURA.

a, Cell doublings of ScURA–expressing and control 143B ρ0 cells. Exogenous uridine and/or pyruvate were added to the growth media as indicated. b, Same experiment as in a, but with ScURA–expressing and control mouse L929 ρ0 cells. c, Volcano plot showing differential metabolite abundance in 143B ρ0 cells expressing either ScURA or an empty construct. Adjusted P values were calculated using two-sided Student’s t-test. d, Normalized intensity values of dihydroorotate relative to 143B WT mtDNA-positive cells (P < 0.0001). e, Normalized intensity values of metabolites relative to 143B WT mtDNA-positive cells (UTP: ρ0 versus ρ0 + ScURA, P = 0.0006; all other significant comparisons, P < 0.0001). f, Cell doublings of ScURA–expressing, AOX-expressing and control Mt-Cybmut cells (+ScURA versus +AOX, P = 0.0001; all other significant comparisons, P < 0.0001). g, Cell doublings of ScURA–expressing, AOX-expressing and control Cox10KO cells (−uridine versus +uridine, P = 0.0007; −uridine versus +ScURA, P < 0.0001). Panels a, b and d are all significant comparisons (P < 0.0001). Ordinary one-way ANOVA, Tukey’s multiple comparison test. Data are presented as means of n = 3 independent biological replicates; error bars, s.d. ****P < 0.0001; ***P < 0.001.
Discussion
The ectopic expression of enzyme orthologs from other phyla has been a valuable tool for investigation of the mETC. For example, Lactobacillus brevis NADH oxidase generates NAD+, bypassing complex I, and has been used extensively both in cellular and animal models32,33. C. intestinalis AOX, which substitutes complex III and IV27, and S. cerevisiae NDI1, which substitutes complex I34, are being explored as therapeutic approaches for mitochondrial diseases5,35. We have extended this genetic toolkit with ScURA, which provides a mETC-independent pathway for orotate production.
The reason why most eukaryotes rely on a mitochondrial DHODH is unknown. The connection between DHODH and mitochondrial electron transport could help to fine-tune key metabolic processes such as DNA and RNA synthesis with oxygen and nutrient availability. When oxygen supply is limited, a reduction in complex III and IV activity would deplete the UQ pool, slowing down pyrimidine biosynthesis and cell growth36. Decreased pyrimidine levels might, in turn, stimulate respiratory supercomplex assembly by ether phospholipid accumulation37. A mitochondrial DHODH might therefore support proliferation only in favourable environments.
Oxidation of DHO is a fundamental reaction for living beings and requires a suitable electron acceptor. In eukaryotes, this process is accomplished mainly by three alternative strategies. Aerobes use oxygen as the terminal electron acceptor, which is reduced by DHODH through the mETC9. In anaerobic eukaryotes, there are two alternative modes of DHO oxidation, both of which use fumarate as the terminal electron acceptor. Many multicellular organisms that inhabit hypoxic environments oxidize DHO by a membrane DHODH, which transfers electrons to rhodoquinone and a membrane-associated fumarate reductase8. Some yeasts, instead, acquired a bacterial DHODH through horizontal gene transfer, which can directly reduce fumarate10. Recently, rhodoquinone has been found in some mammalian tissues, where it can allow mitochondrial electron transport from ubiquinol to fumarate independently of oxygen38. Experiments that combine the expression of ScURA and the induction of rhodoquinone synthesis could shed light on why eukaryotes have maintained membrane-associated reactions throughout evolution, instead of adopting soluble and more direct enzymatic workarounds.
It has been shown that during hypoxia, ubiquinol can be oxidized by reverse SDH activity, allowing DHODH catalysis independently of complex III function20. This pathway can contribute to pyrimidine biosynthesis when complex III is inhibited if exogenous aspartate (or an exogenous electron acceptor such as pyruvate) is given to overcome the deficit in aspartate biosynthesis20,39,40. Given that our experiments were conducted in media complemented with dialysed serum and lacking exogenous aspartate or pyruvate, aspartate deficiency may explain why neither ScURA expression nor uridine supplementation could fully restore cell proliferation to control levels. Further investigation is required to address how nutrient availability constrains the efficacy of metabolic adaptations to respiratory deficiency.
ScURA allowed us to evaluate the contribution of de novo pyrimidine biosynthesis to cellular growth independently of cellular respiration. In recent years, genetically engineered mouse models have enabled the study of a wide spectrum of cell-type-specific functions. With this approach, the integrity of the mETC has been shown to be essential for haematopoiesis41, angiogenesis42, regulatory and natural killer T cells functions43 and many more. Such dependence is often assayed by genetic disruption and pharmacologic inhibition of single mitochondrial respiratory complexes. By this approach, the activity of all UQ-dependent dehydrogenases is blocked, raising the question of which mETC-dependent process is responsible for the observed phenotype. The relative contribution of each UQ-dependent pathway can be assessed only by ectopic expression of UQ-independent dehydrogenases in vivo33,42. In this way, the development of effective and precise pharmacological intervention strategies can be undertaken following a precise mechanistic rationale. We designed ScURA following this same logic.
One key issue that we think ScURA will help to disentangle is the metabolic requirements of tumour growth. Human tumour cells in which the integrity of mETC is disrupted cannot form tumours when injected subcutaneously into immunocompromised mice44. However, it has been shown in syngeneic models that tumour cells are able to uptake mtDNA from the host, and pyrimidine biosynthesis has been suggested to be the main limiting factor for their growth45. Interestingly, as it happened with the expression of AOX25, ρ0 cells expressing ScURA still needed pyruvate supplementation to grow, stressing that some activity of the mETC, probably respiratory complex I, is essential. ScURA expression in respiratory-deficient tumour cells will provide a straightforward model to directly test this and other hypotheses in vivo.
A promising future area for the application of ScURA and other ectopic enzymes is in the treatment of mitochondrial diseases through adeno-associated virus gene therapy. For example, expression of NDI1 and AOX has been shown to improve the survival of pre-clinical models of complex I and III deficiencies, respectively35,46. ScURA gene delivery could also be beneficial in patients suffering from Miller’s syndrome, a rare genetic disease characterized by mutations in DHODH47.
Methods
Cell culture
Cells were grown in complete DMEM medium (D5796, containing 4,500 mg l−1 glucose, 2 mM L-glutamine) supplemented with dialysed 10% FBS (Sigma-Aldrich, F7524), 1% penicillin–streptomycin (PenStrep, Lonza), at 37 °C in an atmosphere of 5% CO2 and 95% air. Where indicated, 50 μg ml−1 uridine and/or 1 mM sodium pyruvate (Sigma-Aldrich) were added to the growing media. Inhibitors were purchased from Sigma-Aldrich and used as follows: brequinar (2 μM); antimycin A and myxothiazol (20 μM each); and chloramphenicol (40 μg ml−1). Cells were pre-treated with chloramphenicol for 1 week in the presence of uridine to deplete them of respiratory complexes48. Control cells were treated with the appropriate vehicle (ethanol or dimethylsulfoxide (DMSO)). The origin of cell lines was: ρ0 cells49, Mt-Cybmut and Cox10KO AOX-expressing cells29.
Generation of ScURA-expressing cells
The coding sequence of ScURA was obtained from a previous publication50 and modified as follows. A myc tag was added at the C terminus through a (GGS)3 linker, and at both ends, restriction enzyme sites were inserted. Codon-optimization and oligonucleotide synthesis were performed by Genewiz. The gene was cloned into the pWXLd lentiviral vector (modified from Trono’s lab with a puromycin resistance gene, Addgene). Lentivirus production was carried out by the Viral Vector unit at Centro Nacional de Investigaciones Cardiovasculares (CNIC). Viral supernatants were filtered and added to cells with 8 μg ml−1 polybrene overnight. Then, 2 days after transduction, ScURA–expressing cells were selected with puromycin 0.5 μg ml−1 for approximately 1 week until non-transduced cells in a control plate were dead. For each cell line, a cell line transduced with an empty vector was used as a control.
Growth curve and cell doubling time
On day 0, a total of 40,000 cells were plated into six-well plates. For each condition, three wells were incubated for 6 h (to allow the cells adhere to the plate), collected and counted. This count was recorded as the number of cells at day 0. For 3–4 days, fresh media and the appropriate treatments were added to each well every day. On the last day, three wells per condition were collected and counted. The number of doublings pre day was calculated as 24 / ((T × (ln2)) / (ln(nf / n0))), where T is time in hours, nf is the number of cells on the final day and n0 is the number of cells at day 0.
Whole-cell homogenate and mitochondria isolation
Cells from two to ten 150 mm plates were collected with trypsin, washed in PBS and resuspended in cold sucrose buffer (0.32 M sucrose, 1 mM EDTA, 10 mM Tris-HCl pH 7.4). Cells were then homogenized in a Teflon potter-type tissue homogenizer with 20–40 ‘pops’. The homogenate was centrifuged at 1,000g for 5 min, the nuclear pellet was discarded and the post-nuclear whole-cell homogenate was stored at −80 °C. When mitochondria were isolated, the whole-cell homogenate obtained was further centrifuged at 10,000g for 10 min. The pellet obtained was resuspended in sucrose buffer and stored at −80 °C.
Spectrophotometric DHODH activity
DHODH activity was measured following a previously published method51, with some modifications: 100 µg of whole-cell homogenates were used for each reaction in a final volume of 200 µl. Each biological replicate was split into three technical replicates. DHODH-dependent reduction of 2,6-dichloroindophenol (DCPIP) was measured with a UV-visible spectrophotometer equipped with a 96-well plate reader. Samples were resuspended in reaction buffer (50 mM Tris-HCl, 150 mM KCl, 3 mM KCN, 0.05 mM DCPIP, 0.25 mM decylubiquinone, pH 7.5) and incubated for 2 min at 37 °C. The reaction was started by the addition of 1 mM DHO. The first 3 min of the reaction were linear and were used for the analysis. The rate of background (DHODH-independent) DCPIP reduction was measured in parallel by omitting DHO from the reaction mixture and was subtracted from the DHO-dependent rate for each sample. Brequinar was added where indicated at 0.05 mM; controls were treated with the same volume of DMSO.
Gel electrophoresis
All gels were prepared in-house with Tris-HCl buffer and acrylamide/bis. Protein samples were quantified and loaded on the gel, and electrophoresis was performed in Tris-glycine solution. For denaturing electrophoresis, 0.1% SDS was added to the gels and protein samples were incubated for 1 min at 95 °C in loading buffer (50 mM Tris-HCl, pH 6.8, 2% SDS, 10% glycerol, 1% β-mercaptoethanol, 0.02% bromophenol blue) before loading. For non-denaturing native gels, SDS was not added to the gel, whole-cell homogenates were not boiled and the loading buffer used did not contain SDS or β-mercaptoethanol.
Immunoblotting
Proteins were transferred to PVDF membrane (Immobilon-FL, 0.45 μm) by transfer in BioRad Mini Trans-Blot Cell or Trans-Blot Cell systems, in 48 mM Tris, 39 mM glycine and 20% methanol transfer solution overnight at 30 V. The membrane was then blocked in 0.1% PBS-Tween, 5% BSA solution for 1 h at room temperature (22 °C) and incubated with primary antibody overnight at 4 °C. After that, the membrane was incubated with secondary antibody for 1 h at room temperature. Membrane development was performed using fluorescent secondary antibody and revealed with the Odyssey imaging system (LI-COR Biosciences). Antibodies used included anti-hemoagglutinin-tag (1:5,000; Sigma-Aldrich, sAB 4300603), anti-betaActin (1:10,000; Sigma-Aldrich, A2066), anti-GAPDH (1:5,000; Abcam, AB8245) and anti-SDHA (1:5,000; Invitrogen, 459200 or Proteintech, 14865-1-AP).
Blue native–PAGE and complex I in-gel activity
The procedure was carried out as detailed previously48. In brief, 100 μg of mitochondria were incubated with 400 μg of digitonin for 5 min in 50 mM NaCl buffer, 50 mM imidazole, 5 mM aminocaproic acid at a final concentration of 10 μg μl−1. Electrophoresis was performed in a cold chamber and developed for 30 min at 90 V with cathode buffer A. Then, the cathode buffer was exchanged for cathode buffer B, and electrophoresis continued for approximately 1 h more at 300 V. Measurement of NADH dehydrogenase activity of complex I was determined on the same gel after blue native–PAGE electrophoresis by incubating the gel in 0.1 M Tris-HCl, pH 7.4, 0.14 mM NADH and 1 mg ml−1 NitroBlue tetrazolium solution at room temperature.
ATP synthesis
ATP synthesis was assessed as previously described52. In brief, 1.5 billion cells were permeabilized with digitonin and ATP synthesis was assayed using glutamate plus malate or succinate as fuels in the presence of adenosine 5′-diphosphate and diadenosine pentaphosphate (to inhibit the adenylyl kinase) by a kinetic luminescence assay using the luciferin–luciferase reaction.
Oxygen consumption rate
A total of 10,000 cells were plated in a Seahorse XF96 microplate the day before the assay. Cells were washed in MAS medium (70 mM sucrose, 220 mM mannitol, 5 mM KH2PO4, 5 mM MgCl2, 1 mM EGTA, 2 mM HEPES pH 7.4) containing 0.2% w/v free fatty acid BSA and then placed in MAS media containing ADP and digitonin (4 mM and 10 µg ml−1 final concentrations, respectively), incubated for 3 min at 37 °C and then loaded in the instrument. Substrate injection was as follows: glutamate + malate (5 mM each, port A); rotenone (2 µM, port B); succinate (5 mM, port C); antimycin A (1 µM, port D). These conditions allow for the determination of the respiratory capacity of mitochondria through complex I and complex II. For measuring activities of mitochondrial complexes, frozen–thawed cells were used as previously detailed53.
Phylogenetic tree construction
The amino acid sequence of DHODH from various species was retrieved from UniProt. The R packages msa54, ape55 and ggmsa56 were used for multiple sequence alignment, phylogenetic tree construction and generation.
Immunocytochemistry
In total, 20,000 cells were seeded per well on a 12-well plate containing previously sterilized precision cover glasses (Marienfeld, 0117520) and left incubating at 37 °C and 5% CO2 in their corresponding medium. After 48 h, cells were fixed for 15 min at 37 °C in pre-warmed 4% paraformaldehyde (ThermoFisher, 043368.9M) diluted in 1× PBS, followed by three washes in 1× PBS. Fixed cells were permeabilized with 0.1% Triton-X100 in 1× PBS for 10 min at room temperature. Cells were blocked in 2% BSA (w/v) in 1× PBS, then incubated with a Tomm20-CL488 antibody (1:500) (Proteintech, 30235116) diluted in blocking buffer. Cells were then incubated in Alexa Fluor 405 N-hydroxysuccinimide (NHS) ester (1:5,000) (ThermoFisher, A30000) diluted in 1× PBS. All incubation steps were performed for 40 min at room temperature and followed by three 5 min washes in 1× PBS-Tween 0.1%. Samples were finally mounted on microscopy slides using ProLong Gold Antifade Reagent (Invitrogen, P36934).
Microscopy image acquisition
All microscopy images were collected on a Leica SP5 inverted confocal microscope equipped with a HCX PL APO λ blue ×63, 1.40 NA oil objective. Z-stacks containing 10 planes (with a step size of 0.34 µm) were acquired in a sequential line scanning mode using LAS-AF (v.2.6.0) software (Leica Microsystems) at a digital zoom of ×2, pixel size of 60 nm, scanner speed of 200 Hz and 3 line averages, with a pinhole size of 1 AU. The Tomm20 signal was excited using the Argon 488 laser line at 10% intensity, and the corresponding 505–555 nm emission was collected using a PMT detector set at 800 V gain and −0.1% offset. The NHS405 signal was excited using the UV diode 405 laser line at 2% intensity, and 420–485 nm emission was collected using a PMT detector at 900 V gain and −1% offset.
Microscopy image analysis
Image analysis was mainly performed in FIJI 1.53t. Z-stacks were first projected into a single plane using the maximum intensity method. For mitochondria, the signal of Ch2 (NHS405) was subtracted to that of Ch1 (Tomm20-CL488) and the resulting image was then thresholded with the Mitochondria Analyzer plugin57 using the following parameters: remove particles (size, ≤0.1 µm2), subtract background (rolling, 2.0), sigma filter plus (radius, 2.0), enhance local contrast (max slope, 3.0), weighted mean threshold (block size, 1.45; C-value, 5.0) and despeckle and remove outliers (pixels, 4.0). Individual networks were isolated from whole thresholded images, and morphology parameters of mitochondria were calculated on a per-cell basis. For analysis of cell morphology, the NHS405 channel was first pre-processed in FIJI by applying CLAHE (block, 500; bin, 256; slope, 10) and a Gaussian blur (radius, 0.3 µm). The objects were then thresholded and their morphology analysed in Cellprofiler (v.4.2.8)58 using an adaptive Otsu method with three classes.
CRISPR–CAS9-mediated generation of SDHAKO cell lines
U2OS (ATCC, HTB-96) and 143B (ATCC, CRL-8303) SDHAKO clonal cell lines were generated through nucleofection (Neon transfection system, Invitrogen) of ribonucleoprotein complexes prepared by incubating 2 µg of TrueCut Cas9 Protein v2 (Invitrogen, A36499) and 2 µg of a pair of single guide RNAs (sgRNAs) (sgRNA 1 target sequence at intron 1, AACCCTGAAGGCAGCCCAAG; sgRNA 2 target sequence at exon 4, GGGCCTGCTCCGTCATGTAG). DNA oligonucleotides used for sgRNA synthesis were designed using the CRISPOR algorithm (http://crispor.tefor.net), and sgRNAs were synthesized using the GeneArt Precision gRNA Synthesis Kit (Invitrogen, A29377). Nucleofection was carried out at 1230 V or 1300 V (four pulses of 10 ms) for U2OS or 143B cells, respectively. Following nucleofection, cells were seeded into six-well plates and allowed to recover for 48 h. For single-cell clone isolation, cells were sorted using a spectral cell sorter (Cytek Aurora CS). Genomic DNA was extracted, and a pair of primers (primer 1A, GAGTGTGCATCCGACATCCTC; primer 2A, CTCATCACCATTCTTTTGGCTG) flanking SDHA-targeted regions was used to perform PCR screening. Clones were considered positive for gene editing when the amplified product was 551 bp, indicating deletion of the whole DNA fragment between targeted regions. The absence of SDHA protein was confirmed by western blot against SDHA (Santa Cruz, sc-166909), performed following separation of total cell protein extracts on 10% SDS–PAGE gels. Positive clones were further validated by Sanger sequencing of the SDHA gene.
CRISPR–CAS9-mediated generation of DHODHKO cell line
A clonal 143B-DHODHKO cell line was generated by following a previously published protocol59, with slight modifications. Each pair of gene-specific sgRNAs (pair 1, CCGCGGAGGACTACGCAGAA; pair 2, ATAGAAACGCTCATCTCCCG) targeting different regions of the gene was cloned into a TCLV2 plasmid (Addgene, 87360)60. Lentiviral particles were made in the Viral Vectors Unit at CNIC. All 143B cells were seeded on six-well plates, and at 80% confluency, they were transduced with lentiviral particles in DMEM supplemented with only 2% FBS, which was changed the following day for fresh complete medium. After 48 h, infected cells were selected by treatment with 1 µg ml−1 puromycin in complete DMEM. After 48 h, surviving cells were treated with 2 µg ml−1 doxycycline to induce Cas9-2A-eGFP expression and were then sorted into a 96-well plate at one cell per well using a FACSAria cell sorter. Final clones were selected by observing cell death in medium lacking uridine and confirmed by running total cell protein extracts on a 12.5% SDS–PAGE gel and performing a western blot against DHODH (1:1,000) (Santa Cruz, sc166348).
Re-expression of DHODH and ScURA in DHODHKO cell line
The 143B-DHODHKO cells were used to re-express a WT version of hDHODH, a version of the protein lacking the mitochondria peptide signal and the transmembrane alpha helix (hDHODHΔMTS) and codon-optimized ScURA protein fused to a c-Myc tag (ScURA–myc). The vectors used were constructed and packaged by VectorBuilder, and the lentiviral particles were generated by the Viral Vectors Unit at CNIC. 143B-DHODHKO cells were seeded on six-well plates, and at 80% confluency, they were transduced with lentiviral particles in DMEM supplemented with 2% FBS, which was changed the following day for fresh complete medium containing uridine. Infected cells were selected by treatment with 400 µg ml−1 hygromycin B for at least 4 days. Re-expression of the proteins was confirmed by running total cell protein extracts on a 12.5% SDS–PAGE gel and performing a western blot against DHODH (1:1,000) (Santa Cruz, sc166348) and c-myc (1:5,000).
Metabolite extraction from cultured cells
For each condition, cells were seeded in six-well plates (with one plate kept aside for cell counting) in DMEM + 10% dialysed FBS, no uridine. The day after seeding, media containing inhibitors (1 μM each antimycin and myxothiazol, 2 μM brequinar) and radio-labelled tracers (2 mM [α-15N]glutamine or [U-13C]glutamine; Cambridge Isotope Laboratories) were added. After 24 h of incubation, metabolites were extracted in metabolite extraction buffer (50% methanol, 30% acetonitrile, 20% water (all liquid chromatography–mass spectrometry grade), 5 µM valine-d8, CK isotopes and DLM-488). Cells were washed with PBS, and 500 μl of cold metabolite extraction buffer per million cells was added to the wells; the plate was then immediately placed at −80 °C for 20 min. The cell lysate–extraction buffer solution mixture was shaken at maximum speed for 15 min at 4 °C, centrifuged at 13,000g for 30 min at 4 °C and the supernatant was collected in a HPLC vial. A pooled sample was prepared by taking 15 μl from each individual sample.
Liquid chromatography–mass spectrometry analysis
Metabolites were separated on a Millipore SeQuant ZIC-pHILIC analytical column (5 µm, 2.1 × 150 mm) coupled to a guard column (2.1 × 20 mm, 5 µm). The mobile phase consisted of solvent A (20 mM ammonium carbonate with 2.5 µM medronic acid, adjusted to pH 9.7 with ammonium hydroxide) and solvent B (acetonitrile in water, 95:5, v/v). The column oven was maintained at 40 °C, and the autosampler was kept at 4 °C. Chromatography was performed at a flow rate of 0.20 ml min−1 with the following gradient programme: 0–2 min, 85% B; 2–14 min, linear decrease to 30% B; 14–15 min, isocratic at 30% B; 15–17.1 min, re-equilibration to 85% B; and 17.1–23 min, hold at 85% B.
Metabolite quantification was performed on a Vanquish Horizon UHPLC system coupled to an Orbitrap Exploris 120/240 mass spectrometer (Thermo Fisher Scientific) equipped with a heated electrospray ionization source. Ionization parameters were set to +3.5 kV for positive mode and −2.8 kV for negative mode, with an RF lens setting of 70, a heated capillary temperature of 320 °C and an auxiliary gas heater temperature of 280 °C. Sheath gas flow was set to 40, auxiliary gas to 15 and sweep gas was disabled. For MS1 acquisition, data were collected in full scan mode over a mass range of m/z = 70–900, using a standard automatic gain control target with an automatically determined maximum injection time. Data were acquired with polarity switching at an Orbitrap resolution of 120,000. Untargeted metabolite profiling was performed using the AcquireX Deep Scan workflow with iterative data-dependent acquisition on pooled samples. Full scans were acquired at a resolution of 60,000, with tandem mass spectrometry fragmentation at 30,000 resolution and a minimum intensity threshold of 5.0 × 10³. Dynamic exclusion was triggered after a single event (10 s, ±5 ppm), and precursors were isolated with a 1.2 m/z window. Stepped higher-energy collisional dissociation energies of 30, 50 and 150 were applied, with mild trapping enabled to improve signal quality.
Metabolite identification was performed using Compound Discoverer (v.3.2; Thermo Fisher Scientific). Compounds were assigned based on precursor m/z values within 5 ppm of the theoretical mass, fragment ion matches within 5 ppm to an internal spectral library of authentic standards analysed under identical data-dependent tandem mass spectrometry conditions (minimum match score of ≥70), and retention times within 5% of those of purified standards under the same chromatographic conditions. Peak area integration and chromatogram evaluation were carried out in TraceFinder (v.5.1; Thermo Fisher Scientific), and isotopologue distributions were corrected for natural isotope abundance using the AccuCor package61.
Semi-targeted metabolomics data analysis
Features were filtered using the 80% modified rule62, followed by exclusion of metabolites with a coefficient of variation of >30% in pooled quality control samples63. These filtering steps retain stable metabolites consistently detected in the samples, thereby preserving only robust and reproducible features. Intensities were normalized to the valine-d8 internal standard to correct for sample-to-sample technical variations, followed by LOESS signal correction to account for a systematic run order-dependent drift. Missing values were imputed with the group mean, while features entirely absent in a group were substituted with half of the minimum detected intensity in the dataset. Subsequently, data were log2-transformed to stabilize variance and improve normality before statistical analysis. Principal component analysis was performed using the prcomp function from the R stats package64, and Hotelling’s T2 test was applied to identify sample outliers using the qcc package65. Sample group differential abundance was assessed using two-sided Student’s t-tests, and P values were adjusted for multiple testing using the Benjamini–Hochberg method from the R base stats package. Finally, readxl66 and tidyverse were used for general scripting67.
Transcriptomic analysis
RNA sequencing was performed by the CNIC Genomics Unit team. RNA libraries were produced using the Illumina TruSeq RNASeq kit and sequenced in an Illumina HiSeq 2500 Sequencer. Downstream analysis was performed using the nf-core/rnaseq analysis pipeline68 using Nextflow (v.24.10.5). In brief, following quality control with FastQC, adaptor sequences were removed using Trim Galore! The cleaned reads were then aligned to the Homo sapiens reference genome (GRCh38, Ensembl release 104) using the STAR aligner. Transcript-level abundances were quantified with Salmon, and gene-level read counts were generated using featureCounts. Raw counts were normalized using the variance stabilizing transformation function, and differential gene expression analysis was performed within the DESeq2 package69. P values were adjusted for multiple testing using the Benjamini–Hochberg procedure. Pathway enrichment analysis was performed using clusterProfiler70 with statistics obtained from DESeq2. Transcription factor activity was inferred with decoupleR23 (univariate linear model), with DoRothEA regulons71. We filtered for regulons with a high level of confidence (‘A’). Generation of heatmaps and figures was done in R using the pheatmap package.
Statistics and reproducibility
Data are presented as mean ± s.d. Statistical analyses were performed using GraphPad Prism 10. The statistical tests used, sample size and post hoc corrections are indicated in the figure legends. All statistical tests were two-tailed and had an alpha of 0.05 as the significance threshold. *P < 0.05. No data were excluded.
Reporting summary
Further information on research design is available in the Nature Portfolio Reporting Summary linked to this article.
Data availability
RNA-seq data have been deposited in the Gene Expression Omnibus database under accession number GSE314127. Metabolomics data have been deposited in the Metabolomics Workbench repository with the study IDs ST004411 (radioisotopes tracing data) and ST004410 (semi-targeted data). Source data are provided with this paper.
References
-
Ali, E. S. & Ben-Sahra, I. Regulation of nucleotide metabolism in cancers and immune disorders. Trends Cell Biol. 33, 950–966 (2023).
-
Banerjee, R., Purhonen, J. & Kallijärvi, J. The mitochondrial coenzyme Q junction and complex III: biochemistry and pathophysiology. FEBS J. 289, 6936–6958 (2022).
-
Acı́n-Pérez, R. et al. Respiratory complex III is required to maintain complex I in mammalian mitochondria. Mol. Cell 13, 805–815 (2004).
-
King, M. P. & Attardi, G. Human cells lacking mtDNA: repopulation with exogenous mitochondria by complementation. Science 246, 500–503 (1989).
-
Grégoire, M., Morais, R., Quilliam, M. A. & Gravel, D. On auxotrophy for pyrimidines of respiration-deficient chick embryo cells. Eur. J. Biochem. 142, 49–55 (1984).
-
Löffler, M. Towards a further understanding of the growth-inhibiting action of oxygen deficiency. Evaluation of the effect of antimycin on proliferating Ehrlich ascites tumour cells. Exp. Cell. Res. 157, 195–206 (1985).
-
Björnberg, O., Rowland, P., Larsen, S. & Jensen, K. F. Active site of dihydroorotate dehydrogenase A from Lactococcus lactis investigated by chemical modification and mutagenesis. Biochemistry 36, 16197–16205 (1997).
-
Müller, M. et al. Biochemistry and evolution of anaerobic energy metabolism in eukaryotes. Microbiol. Mol. Biol. Rev. 76, 444–495 (2012).
-
Nagy, M., Lacroute, F. & Thomas, D. Divergent evolution of pyrimidine biosynthesis between anaerobic and aerobic yeasts. Proc. Natl Acad. Sci. USA 89, 8966–8970 (1992).
-
Gojković, Z. et al. Horizontal gene transfer promoted evolution of the ability to propagate under anaerobic conditions in yeasts. Mol. Genet. Genomics 271, 387–393 (2004).
-
Hall, C., Brachat, S. & Dietrich, F. S. Contribution of horizontal gene transfer to the evolution of Saccharomyces cerevisiae. Eukaryot. Cell 4, 1102–1115 (2005).
-
Ishtar Snoek, I. S. & Yde Steensma, H. Factors involved in anaerobic growth of Saccharomyces cerevisiae. Yeast 24, 1–10 (2007).
-
Forman, H. J. & Kennedy, J. Superoxide production and electron transport in mitochondrial oxidation of dihydroorotic acid. J. Biol. Chem. 250, 4322–4326 (1975).
-
Zameitat, E., Pierik, A. J., Zocher, K. & Löffler, M. Dihydroorotate dehydrogenase from Saccharomyces cerevisiae: spectroscopic investigations with the recombinant enzyme throw light on catalytic properties and metabolism of fumarate analogues. FEMS Yeast Res. 7, 897–904 (2007).
-
McLean, J. E., Neidhardt, E. A., Grossman, T. H. & Hedstrom, L. Multiple inhibitor analysis of the brequinar and leflunomide binding sites on human dihydroorotate dehydrogenase. Biochemistry 40, 2194–2200 (2001).
-
Jagow, G. V. & Engel, W. D. Complete inhibition of electron transfer from ubiquinol to cytochrome b by the combined action of antimycin and myxothiazol. FEBS Lett. 136, 19–24 (1981).
-
von Jagow, G., Ljungdahl, P. O., Graf, P., Ohnishi, T. & Trumpower, B. L. An inhibitor of mitochondrial respiration which binds to cytochrome b and displaces quinone from the iron-sulfur protein of the cytochrome bc1 complex. J. Biol. Chem. 259, 6318–6326 (1984).
-
Turrens, J. F., Alexandre, A. & Lehninger, A. L. Ubisemiquinone is the electron donor for superoxide formation by complex III of heart mitochondria. Arch. Biochem. Biophys. 237, 408–414 (1985).
-
Fendt, S.-M. et al. Reductive glutamine metabolism is a function of the α-ketoglutarate to citrate ratio in cells. Nat. Commun. 4, 2236 (2013).
-
Spinelli, J. B. et al. Fumarate is a terminal electron acceptor in the mammalian electron transport chain. Science 374, 1227–1237 (2021).
-
Mullen, A. R. et al. Reductive carboxylation supports growth in tumour cells with defective mitochondria. Nature 481, 385–388 (2011).
-
Chouchani, E. T. et al. Ischaemic accumulation of succinate controls reperfusion injury through mitochondrial ROS. Nature 515, 431–435 (2014).
-
Badia-I-Mompel, P. et al. decoupleR: ensemble of computational methods to infer biological activities from omics data. Bioinform. Adv. 2, vbac016 (2022).
-
Selak, M. A. et al. Succinate links TCA cycle dysfunction to oncogenesis by inhibiting HIF-α prolyl hydroxylase. Cancer Cell 7, 77–85 (2005).
-
Quirós, P. M. et al. Multi-omics analysis identifies ATF4 as a key regulator of the mitochondrial stress response in mammals. J. Cell Biol. 216, 2027–2045 (2017).
-
Adant, I. et al. Pyruvate and uridine rescue the metabolic profile of OXPHOS dysfunction. Mol. Metab. 63, 101537 (2022).
-
Hakkaart, G. A. J., Dassa, E. P., Jacobs, H. T. & Rustin, P. Allotopic expression of a mitochondrial alternative oxidase confers cyanide resistance to human cell respiration. EMBO Rep. 7, 341–345 (2006).
-
Perales-Clemente, E. et al. Restoration of electron transport without proton pumping in mammalian mitochondria. Proc. Natl Acad. Sci. USA 105, 18735–18739 (2008).
-
Guarás, A. et al. The CoQH2/CoQ ratio serves as a sensor of respiratory chain efficiency. Cell Rep. 15, 197–209 (2016).
-
Dassa, E. P. et al. Expression of the alternative oxidase complements cytochrome c oxidase deficiency in human cells. EMBO Mol. Med. 1, 30–36 (2009).
-
Diaz, F., Thomas, C. K., Garcia, S., Hernandez, D. & Moraes, C. T. Mice lacking COX10 in skeletal muscle recapitulate the phenotype of progressive mitochondrial myopathies associated with cytochrome c oxidase deficiency. Hum. Mol. Genet. 14, 2737–2748 (2005).
-
Titov, D. V. et al. Complementation of mitochondrial electron transport chain by manipulation of the NAD+/NADH ratio. Science 352, 231–235 (2016).
-
Goodman, R. P. et al. Hepatic NADH reductive stress underlies common variation in metabolic traits. Nature 583, 122–126 (2020).
-
Seo, B. B., Matsuno-Yagi, A. & Yagi, T. Modulation of oxidative phosphorylation of human kidney 293 cells by transfection with the internal rotenone-insensitive NADH-quinone oxidoreductase (NDI1) gene of Saccharomyces cerevisiae. Biochim. Biophys. Acta 1412, 56–65 (1999).
-
Rajendran, J. et al. Alternative oxidase-mediated respiration prevents lethal mitochondrial cardiomyopathy. EMBO Mol. Med. 11, e9456 (2019).
-
Löffler, M. The biosynthetic pathway of pyrimidine (deoxy)nucleotides: a sensor of oxygen tension necessary for maintaining cell proliferation? Exp. Cell. Res. 182, 673–680 (1989).
-
Bennett, C. F. et al. Peroxisomal-derived ether phospholipids link nucleotides to respirasome assembly. Nat. Chem. Biol. 17, 703–710 (2021).
-
Valeros, J. et al. Rhodoquinone carries electrons in the mammalian electron transport chain. Cell 188, 1084–1099.e27 (2025).
-
Sullivan, L. B. et al. Supporting aspartate biosynthesis is an essential function of respiration in proliferating cells. Cell 162, 552–563 (2015).
-
Birsoy, K. et al. An essential role of the mitochondrial electron transport chain in cell proliferation is to enable aspartate synthesis. Cell 162, 540–551 (2015).
-
Ansó, E. et al. The mitochondrial respiratory chain is essential for haematopoietic stem cell function. Nat. Cell Biol. 19, 614–625 (2017).
-
Diebold, L. P. et al. Mitochondrial complex III is necessary for endothelial cell proliferation during angiogenesis. Nat. Metab. 1, 158–171 (2019).
-
Weng, X. et al. Mitochondrial metabolism is essential for invariant natural killer T cell development and function. Proc. Natl Acad. Sci. USA 118, e2021385118 (2021).
-
Martínez-Reyes, I. et al. Mitochondrial ubiquinol oxidation is necessary for tumor growth. Nature 585, 288–292 (2020).
-
Bajzikova, M. et al. Reactivation of dihydroorotate dehydrogenase-driven pyrimidine biosynthesis restores tumor growth of respiration-deficient cancer cells. Cell Metab. 29, 399–416.e10 (2019).
-
McElroy, G. S. et al. NAD+ regeneration rescues lifespan but not ataxia in a mouse model of brain mitochondrial complex I dysfunction. Cell Metab. 32, 301–308.e6 (2020).
-
Ng, S. B. et al. Exome sequencing identifies the cause of a Mendelian disorder. Nat. Genet. 42, 30–35 (2010).
-
Curtabbi, A. et al. Regulation of respiratory complex I assembly by FMN cofactor targeting. Redox Biol. 69, 103001 (2024).
-
Acín-Pérez, R., Fernández-Silva, P., Peleato, M. L., Pérez-Martos, A. & Enriquez, J. A. Respiratory active mitochondrial supercomplexes. Mol. Cell 32, 529–539 (2008).
-
Roy, A. Nucleotide sequence of the URA1 gene of Saccharomyces cerevisiae. Gene 118, 149–150 (1992).
-
Knecht, W., Altekruse, D., Rotgeri, A., Gonski, S. & Löffler, M. Rat dihydroorotate dehydrogenase: isolation of the recombinant enzyme from mitochondria of insect cells. Protein Expr. Purif. 10, 89–99 (1997).
-
Vives-Bauza, C., Yang, L. & Manfredi, G. Assay of mitochondrial ATP synthesis in animal cells and tissues. Methods Cell Biol. 80, 155–171 (2007).
-
Acin-Perez, R. et al. A novel approach to measure mitochondrial respiration in frozen biological samples. EMBO J. 39, e104073 (2020).
-
Bodenhofer, U., Bonatesta, E., Horejš-Kainrath, C. & Hochreiter, S. msa: an R package for multiple sequence alignment. Bioinformatics 31, 3997–3999 (2015).
-
Paradis, E. & Schliep, K. ape 5.0: an environment for modern phylogenetics and evolutionary analyses in R. Bioinformatics 35, 526–528 (2019).
-
Zhou, L. et al. ggmsa: a visual exploration tool for multiple sequence alignment and associated data. Briefings Bioinform. 23, bbac222 (2022).
-
Chaudhry, A., Shi, R. & Luciani, D. S. A pipeline for multidimensional confocal analysis of mitochondrial morphology, function, and dynamics in pancreatic β-cells. Am. J. Physiol. Endocrinol. Metab. 318, E87–E101 (2020).
-
Stirling, D. R. et al. CellProfiler 4: improvements in speed, utility and usability. BMC Bioinformatics 22, 433 (2021).
-
Ran, F. A. et al. Genome engineering using the CRISPR–Cas9 system. Nat. Protoc. 8, 2281–2308 (2013).
-
Barger, C. J., Branick, C., Chee, L. & Karpf, A. R. Pan-cancer analyses reveal genomic features of FOXM1 overexpression in cancer. Cancers 11, 251 (2019).
-
Su, X., Lu, W. & Rabinowitz, J. D. Metabolite spectral accuracy on orbitraps. Anal. Chem. 89, 5940–5948 (2017).
-
Yang, J., Zhao, X., Lu, X., Lin, X. & Xu, G. A data preprocessing strategy for metabolomics to reduce the mask effect in data analysis. Front. Mol. Biosci. 2, 4 (2015).
-
Wen, B., Mei, Z., Zeng, C. & Liu, S. metaX: a flexible and comprehensive software for processing metabolomics data. BMC Bioinformatics 18, 183 (2017).
-
R Core Team R: A Language and Environment for Statistical Computing (R Foundation for Statistical Computing, 2025).
-
Scrucca, L. qcc: an R package for quality control charting and statistical process control. GitHub https://github.com/luca-scr/qcc (2026).
-
Wickham, H. & Bryan, J. Readxl: read Excel files. readxl https://readxl.tidyverse.org (2025).
-
Wickham, H. et al. Welcome to the tidyverse. J. Open Source Softw. 4, 1686 (2019).
-
Patel, H. et al. nf-core/rnaseq: nf-core/rnaseq v3.20.0—Iridium Impala. Zenodo https://doi.org/10.5281/zenodo.16892755 (2025).
-
Love, M. I., Huber, W. & Anders, S. Moderated estimation of fold change and dispersion for RNA-seq data with DESeq2. Genome Biol. 15, 550 (2014).
-
Xu, S. et al. Using clusterProfiler to characterize multiomics data. Nat. Protoc. 19, 3292–3320 (2024).
-
Garcia-Alonso, L., Holland, C. H., Ibrahim, M. M., Turei, D. & Saez-Rodriguez, J. Benchmark and integration of resources for the estimation of human transcription factor activities. Genome Res. 29, 1363–1375 (2019).
Acknowledgements
We are thankful to all GENOXPHOS group members for their scientific discussions contributing to this paper. We thank members of the CNIC facilities (Microscopy, Cell culture and Viral vectors) for their technical assistance. We thank A. Sokol for help with the metabolomics analyses. This study was supported by grants from Ministerio de Ciencia e Innovación (grants PID2021-127988OB-I00 and TED2021-131611B-100), Human Frontier Science Program (grant RGP0016/2018), Fundación Leducq (17CVD04) and Instituto de Salud Carlos III CIBERFES (CB16/10/00282) to J.A.E., as well as the European Union’s Horizon 2020 research and innovation program under the Marie Skłodowska-Curie grant agreement no. 713,673 to A.C. The CNIC is supported by the Instituto de Salud Carlos III (ISCIII), the Ministerio de Ciencia, Innovación y Universidades (MICIU) and the Pro CNIC Foundation and is a Severo Ochoa Center of Excellence (grant CEX2020-001041-S funded by MICIU/AEI/10.13039/501100011033). C.F. is funded by the Alexander-von-Humboldt professorship awarded to C. Frezza and by the Deutsche Forschungsgemeinschaft (DFG, German Research Foundation) under Germany’s Excellence Strategy—EXC 2030—390661388. M.A.d.l.F. and M.J.E.-A. are supported by Agencia Estatal de Investigación (grant no. PID2023-150506OB-I00).
Ethics declarations
Competing interests
The authors declare no competing interests.
Peer review
Peer review information
Nature Metabolism thanks the anonymous reviewers for their contribution to the peer review of this work. Primary Handling Editor: Alfredo Gimenez-Cassina, in collaboration with the Nature Metabolism team.
Additional information
Publisher’s note Springer Nature remains neutral with regard to jurisdictional claims in published maps and institutional affiliations.
Extended data
Extended Data Fig. 1 Characterization of mitchondria structure and function in ScURA-expressing cells.
a, Coupled oxygen consumption rate of 143B cells expressing ScURA permeabilized with digitonin and incubated with ADP (basal) plus substrates for complex I (glutamate/malate, G/M) and complex II (succinate, Succ)-dependent respiration. For each replicate only the last measurement is shown. Rot=rotenone, Ama=antimycin A. Ordinary one-way ANOVA, Sidak’s multiple comparison test, n = 8(WT), 7(ScURA) biological replicates per condition. b, Respiratory complexes activities measured in freeze-thawed mitochondrial membranes with a Seahorse analyzer, n = 8 independent biological replicates per condition. c, Blue-Native gel electrophoresis and immunoblot analysis of respiratory complexes assembly in 143B cells, antibodies used are SDHA for complex II and UQCRC2 for complex III and supercomplex I + III. d, Blue-Native gel electrophoresis and in-gel complex I activity in 143B cells. Data in panels c and d are representative of two independent experiments each. e, Representative confocal microscopy pictures of 143B cells stained with an antibody against TOMM20 and 405 NHS ester fluorescent dye. f, Confocal microscopy analysis of cell morphology parameters of 143B cells. Data are presented as floating bars representing the range (minimum to maximum values), with the center line indicating the median. g, Violin plots showing confocal microscopy analysis of mitochondria size and morphology parameters in 143B cells. In f and g, each dot represents an individual cell. Data are mean ± SD, two-sided Welch’s t test, n = 3 independent biological replicates per condition, unless otherwise noted, *P < 0.05.
Extended Data Fig. 2 ScURA rewires TCA cycle metabolites in 143B cells.
a, Heatmap showing unsupervised sample clustering based on z-score scaled intensity values of TCA cycle metabolites and aspartate. Missing TCA cycle intermediates were not detected, n = 3 independent biological replicates. b, Normalized intensity values of TCA cycle intermediates relative to 143B WT cells (citrate: WT vs ScURA: P = 0.0267, WT vs WT+anti/myxo: P = 0.0134; malate: WT vs ScURA: P = 0.0055, ScURA vs ScURA+anti/myxo: P = 0.005, WT+anti/myxo vs ScURA+anti/myxo: P = 0.0304; aspartate: WT vs WT+anti/myxo and ScURA vs ScURA+anti/myxo: P = 0.0003; acetyl-CoA: WT vs ScURA: P = 0.0007, WT+anti/myxo vs ScURA+anti/myxo: P = 0.0068). Data are mean ± SD. Ordinary one-way ANOVA, Sidak’s multiple comparison test, *** P < 0.001, **P < 0.01, *P < 0.05.
Extended Data Fig. 3 ScURA restores cell proliferation in SDHA knockout cells upon mETC inhibition.
a, Left, immunoblot showing SDHA knock out in 143B WT cells and re-expression of ScURA. Right, average number of doublings per day of 143B SDHAKO cells treated with antimycin/myxothiazol or vehicle, with or without exogenous uridine supplementation. b, Left, immunoblot showing SDHA knock out in U2OS cells and re-expression of ScURA. Right, average number of doublings per day of U2OS SDHAKO cells treated with antimycin/myxothiazol or vehicle, with or without exogenous uridine supplementation. Data are mean ± SD, n = 3 independent biological replicates. Ordinary one-way ANOVA, Sidak’s multiple comparison test, ****P < 0.0001, **P < 0.01, *P < 0.05.
Extended Data Fig. 4 Transcriptomic response to ScURA expression.
a, Principal component analysis of gene expression data from 143B cells treated with ethanol vehicle or antimycin/myxothiazol (anti/myxo). b, Volcano plots showing differentially expressed genes from ScURA vs. WT 143B cells, antimycin/myxothiazol vs. vehicle in WT cells, and antimycin/myxothiazol vs. vehicle in ScURA–expressing cells; n = 4 independent biological replicates. c, Dot plot showing the top 10 significantly enriched GO biological process terms from a GSEA of ScURA vs. WT cells. Significance was determined using a permutation-based weighted Kolmogorov-Smirnov test (one-sided). P-values were adjusted using the Benjamini-Hochberg method. d, Bar plot of the top 5 most significant upregulated and downregulated transcription factors. The activity of each transcription factor was inferred using decoupleR based on gene expression data from ScURA vs. WT cells. Scores represent the t-statistic from the uniariate linear model (Wald t-test, two-sided). e, Volcano plot showing differentially expressed genes from 143B ScURA vs. WT cells. Dots corresponding to genes whose transcription is activated by HIF1α are highlighted in red (log2FC > 0) or blue (log2FC < 0). Statistical analysis was performed using the DESeq2 R package. For panels b and e significance was determined using the Wald test (two-sided). P-values were adjusted for multiple comparisons using the Benjamini-Hochberg procedure to calculate adjusted p-values.
Extended Data Fig. 5 ScURA restores ribosomal gene expression upon mETC inhibition.
a, As in Extended Data Fig. 4d, but transcription factor activity was inferred from gene expression data from WT cells treated with antimycin/myxothiazol vs. vehicle. b, Fold change in gene expression of integrated stress response genes, relative to 143B WT cells treated with vehicle. Data are mean ± SD. Ordinary one-way ANOVA, Sidak’s multiple comparison test; P-values refer to the comparison to WT vehicle-treated cells. n = 4 independent biological replicates (CEBPB: WT vs WT+anti/myxo: P = 0.0002; ATF3: WT vs ScURA +anti/myxo: P = 0.0004; all other significant comparisons P < 0.0001). c, As in (a), but transcription factor activity was inferred from gene expression data from ScURA–expressing cells treated with antimycin/myxothiazol vs. vehicle. d, Dot plot showing the top 10 significantly enriched GO biological process terms from a GSEA of ScURA vs. WT cells, both treated with antimycin/myxothiazol. Significance was determined using a permutation-based weighted Kolmogorov-Smirnov test (one-sided). P-values were adjusted using the Benjamini-Hochberg method. e, Heatmap showing unsupervised sample clustering based on z-score scaled gene expression data of ribosomal protein and elongation factor genes. For panels a and c, scores represent the t-statistic from the uniariate linear model (Wald t-test, two-sided). ****P < 0.0001, ***P < 0.001.
Extended Data Fig. 6 Expression of ScURA enables the growth of cellular models of mitochondrial disease in the absence of uridine.
a, Growth curves of ScURA–expressing and control 143 ρ0 cells. b, Same experiment as panel (a) but with mouse L929 ρ0 cells. c, Immunoblot showing ScURA (c-myc tagged) and E. nidulans AOX (hemagglutinin-tagged, HA) expression in Mt-Cybmut and Cox10KO cells. Antibodies against the two tags were used, estimated molecular weight is indicated next to the expressed proteins. d, Growth curves of ScURA–expressing, AOX-expressing and control Mt-Cybmut cells. e, Same experiment as panel (d) but with mouse Cox10KO cells. Data are mean ± SD, n = 3 independent biological replicates (last day counts).
Supplementary information
Source data
Rights and permissions
Open Access This article is licensed under a Creative Commons Attribution-NonCommercial-NoDerivatives 4.0 International License, which permits any non-commercial use, sharing, distribution and reproduction in any medium or format, as long as you give appropriate credit to the original author(s) and the source, provide a link to the Creative Commons licence, and indicate if you modified the licensed material. You do not have permission under this licence to share adapted material derived from this article or parts of it. The images or other third party material in this article are included in the article’s Creative Commons licence, unless indicated otherwise in a credit line to the material. If material is not included in the article’s Creative Commons licence and your intended use is not permitted by statutory regulation or exceeds the permitted use, you will need to obtain permission directly from the copyright holder. To view a copy of this licence, visit http://creativecommons.org/licenses/by-nc-nd/4.0/.
About this article

Cite this article
Curtabbi, A., Jaroszewicz, S.N., Sanz-Cortés, R. et al. Ectopic expression of cytosolic DHODH uncouples de novo pyrimidine biosynthesis from mitochondrial electron transport. Nat Metab (2026). https://doi.org/10.1038/s42255-026-01454-7
-
Received:
-
Accepted:
-
Published:
-
Version of record:
-
DOI: https://doi.org/10.1038/s42255-026-01454-7