
Introduction
Tea is among the most favored and economically accessible beverages globally, second only to water1. Prepared from the tender leaves of the Camellia sinensis plant, tea leaves underwent complex processing before being brewed with hot water. Tea infusion contains diverse metabolites, including polyphenols, flavonoids, methylxanthines, and organic acids, each contributing to its unique attributes2. Among these compounds, polyphenols play a prominent role in influencing tea characteristics because they enhance antioxidant capacity, provide health benefits, and contribute to the nuanced aroma and color of the infusion3. The transformation of tender tea leaves through a series of processing steps resulted in various tea types, with each type exhibiting unique flavor profiles shaped by distinct manufacturing techniques.
Tea is primarily classified into three categories based on the extent of fermentation after processing: unfermented tea (green tea), semifermented tea (oolong tea), and fully fermented tea (black tea)4. These tea types displayed notable differences in aroma, taste, and color. Fermentation plays a pivotal role in tea processing and is catalyzed by polyphenol oxidase (PPO), which converts phenolic compounds in tea into catechin and gallic acid polymers. Fermentation yielded compounds such as theaflavins, theaflavinic acids (oxidized derivatives of theaflavins with benzotropolone structures), thearubigins, and theasinensis (complex polyphenolic compounds contributing significantly to tea bitterness)5,6. Among these compounds, theaflavin, a deoxydimer, resulted from the PPO-catalyzed coupling of two catechin monomers. The structure of theaflavin varied depending on the composition of catechins, resulting in the formation of key compounds such as theaflavin-3-gallate, theaflavin-3′-gallate, and theaflavin-3-3′-digallate. In addition, thearubigin, a diverse polymer, resulted from the combination of two or more catechins and theaflavins. As the extent of fermentation increased, the contents of theaflavins and thearubigins gradually increased within the tea infusion, ultimately affecting the chemical composition of black tea7.
Tea infusion was the result of the dissolution of soluble components of tea in water. Variations in the production procedures and chemical composition of tea material contributed to differences in the color, aroma, and taste of tea. Among these attributes, color was a crucial criterion when evaluating tea quality, particularly black tea. Tea pigments encompassed both fat- and water-soluble types. Fat-soluble pigments, such as chlorophyll, lutein, and carotenoids, had minimal impact on tea color due to their insolubility in water. Water-soluble pigments, including anthocyanins and oxidized tea polyphenol polymers, primarily affected tea color8. During black tea production, the cell walls of leaves were disrupted, releasing tea polyphenols contained within vacuoles; these polyphenols interacted with PPO9. Phenolic compounds, such as catechins, underwent oxidative dehydrogenation and polymerization, yielding larger soluble molecules, specifically theaflavin and thearubigin. Theaflavin and thearubigin, two color pigments, exhibited yellow and red hues, respectively, considerably affecting the brilliance and coloration of black tea10,11. The fermentation step was absent in green tea processing, resulting in tea color being predominantly influenced by the chlorophyll content. The ratio of chlorophyll a to chlorophyll b within tea leaves determined the final color of green tea12. The color of semifermented oolong tea ranged from light yellow to dark brown depending upon the extent of fermentation. Oxidation products of enzymes, including theaflavins, flavonoids, and their glycoside derivatives, played a pivotal role in giving the oolong tea infusion its yellow hue. The infusion of lightly fermented oolong tea exhibited a yellow hue, primarily due to chlorophyll with a minor contribution from theaflavins. By contrast, highly fermented or roasted oolong tea yielded a tea infusion rich in oxidized polymers, such as thearubigins and theabrownin, which provided the characteristic dark color to dark tea13. The outlined mechanism underscored the substantial effect of diverse manufacturing processes on the color of tea infusion. However, detailed exploration of the composition and color changes in each processing step was yet to be conducted.
In addition to the manufacturing process, the choice of tea cultivars substantially affected the composition of tea leaves. Tea plants were predominantly categorized into two varieties in Taiwan: small-leaf variety (such as C. sinensis var. sinensis) and large-leaf variety (such as C. sinensis var. assamica). In addition to visual distinctions, these varieties exhibited divergent chemical compositions in their leaves. Small-leaf varieties typically possessed lower flavanol contents than large-leaf varieties, with the production of nonfermented green tea from small-leaf varieties and fully fermented black tea from large-leaf varieties14. In recent years, a novel trend emerged in Taiwan, where the small-leaf cultivar “Chin-shin” was employed to obtain black tea through full fermentation. The color and flavor of this small-leaf black tea differed from those of traditional large-leaf black tea. Small-leaf black tea became increasingly popular among consumers. However, scientific exploration of black tea derived from these two varieties remained limited.
Although numerous studies explored the chemical reactions occurring during tea production, the specific conditions applied in diverse manufacturing processes and environmental factors varied significantly, affecting the quality of tea fermentation. In addition, differences in the composition of tea leaves among cultivars lead to variations in the characteristics of tea products. The conditions of processing and the original composition of tea leaves are two crucial factors influencing tea quality.
This study hypothesizes that tea cultivar composition (catechins and PPO activity) significantly influences infusion color during processing. Additionally, processing methods (semi-fermentation and full fermentation) modulate enzyme activity and catechin transformation, thereby altering tea infusion color and chemical composition. Previous studies have predominantly focused on either tea cultivars or manufacturing methods independently, with limited research exploring their combined effects on tea infusion color. This study aims to bridge the gap by examining the combined influence of these two factors—particularly how variations in catechin, flavonoid, and polyphenol oxidase levels in different cultivars interact with the tea manufacturing processes. By exploring the effects of semi-fermented oolong and fully fermented black tea processing on large-leaf Taiwan Tea Experiment Station (TTES) No. 18 and small-leaf Chin-shin cultivars, we offer a more nuanced understanding of how these factors together influence tea infusion color and quality. This comparative approach, focusing on both chemical composition and visual outcomes, provides insights that could help optimize tea production practices across different cultivars.
Results
Comparing the effect of different processing conditions on tea infusion color
Impact of fixation on enzyme activity and tea infusion color stability in oolong tea processing
Tea processing involves a series of techniques that alter the chemical composition and sensory attributes of the final product. Here, we employed the large-leaf cultivar TTES No. 18 to investigate the effects of semi-fermented oolong tea and fully fermented black tea processing on infusion color (Fig. 1). Tea infusions were brewed and allowed to stand at room temperature for 0, 4, 8, and 12 h to assess temporal color dynamics, with measurements focusing on changes occurring during the initial 0–4 h period. In oolong tea processing, infusions from young leaves (YL), sunlight withering (SW), and indoor withering (IW) stages showed significant color changes during the 0–4 h period (p < 0.05), whereas those from fixation (Fix), rolling (R), and final tea (T) stages remained stable throughout the monitoring period (Fig. 2a,b). Optical density at 460 nm (OD460), a validated metric for theaflavin absorbance, revealed notable increases during the 0–4 h window in YL (from 0.12 to 0.31, p < 0.05), SW (from 0.15 to 0.28, p < 0.05), and IW stages (from 0.18 ± to 0.35, p < 0.05). Fix, R, and T stages showed no significant change between 0 and 4 h (p > 0.05) (Fig. 2c). In contrast, black tea infusions exhibited progressive color intensification across all stages during the monitoring period (Fig. 2d).

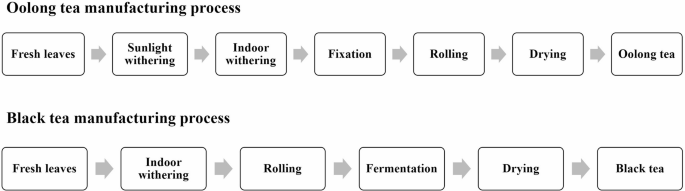
The general making processes of black tea and oolong tea.

Variation in tea color, theaflavin contents, and PPO activity during oolong and black tea production processes. (a,b) Tea infusions at different stages of oolong and black tea production, with brewing times of 0, 4, 8, and 12 h denoted as 0, 4, 8, and 12 h, respectively, indicating the duration during which tea liquid remained at room temperature after brewing. (c,d) Assessment of tea infusion color for each production step at 0 and 4 h using optical density measurements at 460 nm. (e,f) Quantification of theaflavin contents for each production step at 0 and 4 h utilizing the flavonost method. The theaflavin contents were determined by measuring absorbance at 625 nm. (g,h) Evaluation of PPO activity for each production step at 0 and 4 h. The enzyme assay employed catechol as substrate, and one unit of PPO activity was defined as the amount of enzyme required to convert catechol into a μmol benzoquinone per minute. Values represent the mean ± standard deviation from three independent experiments. * denotes a statistically significant difference from the 0-h sample (p < 0.05; Student’s t test). YL: young leaf, IW: indoor withering, R: rolling, Fer: fermentation, and T: tea product.
Theaflavin content measurements demonstrated significant increases during the 0–4 h period in YL, SW, and IW stages of oolong tea (p < 0.05), with YL stage showing a 3.2-fold increase (from 2.1 to 6.8 mg/g, p < 0.001), while black tea showed elevated TF levels in YL, IW, rolling (R), and fermentation (Fer) stages (Fig. 2e,f). PPO activity measurements showed a sharp decline post-fixation in oolong tea (Fig. 2g; p < 0.05), while black tea maintained stable PPO activity from YL to T (Fig. 2h).
Catechin depletion in black tea processing driven by fermentation
Catechins, key polyphenolic substrates for PPO, were quantified to elucidate their role in color development (Fig. 3; Table 1, 2). In oolong tea, levels of epicatechin (EC), epigallocatechin (EGC), epicatechin gallate (ECG), epigallocatechin gallate (EGCG), and total catechins decreased progressively, yet the final product retained ~ 60% of initial YL catechin content (Table 1). Black tea processing, however, induced a severe reduction, with EC, EGC, ECG, EGCG, and total catechins dropping to ~ 10% of YL levels by the T stage (Table 2; p < 0.05). This depletion was most pronounced during rolling and fermentation, with non-ester catechins (EC, EGC) diminishing primarily in the R stage and ester-type catechins (ECG, EGCG) declining sharply during Fer (Fig. 3b). Notably, TF content peaked during fermentation but decreased in the final T stage (Figs. 2f, 5d), suggesting further oxidative transformation.

Caffeine and catechin contents of TTES no. 18 in different tea-making steps. (a) Oolong Tea Process. (b) Black Tea Process. Quantification of compound contents through HPLC. The values for each step were determined relative to the YL step, representing the content after processing compared with that in the young leaf. Values represent the mean ± standard deviation from three independent experiments. * denotes a significant difference from the 0-h sample (p < 0.05; Student’s t test). EC: epicatechin, EGC: epigallocatechin, ECG: epicatechin gallate, EGCG: epigallocatechin gallate, total catechin: sum of EC, EGC, ECG, and EGCG.
Processing effects on antioxidant capacity
Antioxidant capacity was assessed using DPPH and ORAC assays. DPPH results showed a decline in free radical scavenging capacity throughout both processes, with oolong tea retaining ~ 40% of YL activity and black tea falling to ~ 10% by the T stage (Fig. 4a; p < 0.05). ORAC assays indicated that oolong tea’s antioxidant capacity remained statistically indistinguishable from YL (Fig. 4b), while black tea exhibited a significant reduction (p < 0.05). These contrasting profiles highlight oolong tea’s superior retention of antioxidant properties, likely tied to its higher residual catechin content.

Antioxidant capacity of tea liquid in different tea-making steps. (a) DPPH radical scavenging assay results of tea liquid in different tea manufacturing teps. (b) Oxygen radical absorbance capacity assay (ORAC) results of tea liquid in different tea manufacturing steps. Results are presented as micromole Trolox equivalents per gram of fresh weight. Values represent the mean ± standard deviation from three independent experiments. * indicates a significant difference from the YL sample (p < 0.05; Student’s t test). YL: young leaf, SW: sun withering, IW: indoor withering, Fix: fixation, R: rolling, Fer: fermentation, T: tea product.
Investigation on the effect of selected variety on the tea infusion color
Cultivar-specific differences in black tea infusion color, catechin content, and antioxidant capacity
We processed Chin-shin and TTES No. 18 using the black tea protocol to assess varietal effects. TTES No. 18 infusions showed a deeper yellow-orange color across YL, IW, R, Fer, and T stages compared to Chin-shin, most evident in T (Fig. 5a,b). OD460 values confirmed higher color intensity in TTES No. 18 T (Fig. 5c; p < 0.05). TF content was consistently greater in TTES No. 18 during R, Fer, and T (Fig. 5d; p < 0.05), peaking at Fer, while PPO activity remained similar between cultivars across all stages (Fig. 5e).

Comparison of tea soup color, theaflavins content and PPO activity of different tea varieties at different production steps. (a) Visual comparison of tea infusions prepared from Chin-shin and TTES No. 18 at each stage: young leaf (YL), indoor withering (IW), rolling (R), fermentation (Fer), and final tea product (T). (b) Quantitative measurement of tea liquid color at each step, expressed as optical density at 460 nm (OD460, unitless). (c) Theaflavin content (µmol/g) at each processing stage, determined by the Flavognost method and calculated from absorbance at 625 nm. (d) Polyphenol oxidase (PPO) activity at each stage, measured using catechol as substrate; one unit of PPO activity is defined as the amount of enzyme required to convert catechol to 1 μmol benzoquinone per minute. All values are presented as mean ± standard deviation from three independent experiments. * indicates a statistically significant difference from the YL sample (p < 0.05; Student’s t test). Abbreviations: YL, young leaf; IW, indoor withering; R, rolling; Fer, fermentation; T, tea product.
HPLC analysis revealed higher caffeine and catechin levels in TTES No. 18 YL. Both saw near-complete catechin loss by T, but TTES No. 18’s initial abundance likely drove its TF increase. Caffeine in TTES No. 18 dropped from 1186.8 ± 143(μg/ml) in YL to 723.7 ± 113(μg/ml) in T, with no significant T-stage difference vs. Chin-shin (Fig. 6).

Distinct caffeine and catechin content profiles in black tea infusions from Chin-shin and TTES No. 18 cultivars. Caffeine and individual catechin contents—including epicatechin (EC), epigallocatechin (EGC), epicatechin gallate (ECG), and epigallocatechin gallate (EGCG)—as well as total catechin (sum of EC, EGC, ECG, and EGCG), were quantified in black tea products prepared from Chin-shin and TTES No. 18 cultivars. Quantification was performed using HPLC, with results expressed in micrograms per milliliter (μg/mL). Data is presented as mean ± standard deviation from three independent biological replicates. An asterisk (*) indicates a statistically significant difference between Chin-shin and TTES No. 18 samples (p < 0.05; Student’s t test). Abbreviations: EC, epicatechin; EGC, epigallocatechin; ECG, epicatechin gallate; EGCG, epigallocatechin gallate.
Antioxidant capacity via DPPH showed TTES No. 18 YL outperforming Chin-shin (Fig. 7a; p < 0.05), with T retaining higher activity (~ 10 to 15% vs. Chin-shin’s lower residual; p < 0.05). ORAC echoed this, with TTES No. 18 T maintaining an edge despite declines in both (Fig. 7b; p < 0.05), reflecting its catechin-driven advantage.

Antioxidant capacity of black tea infusion from different tea cultivars. (a) Results of the DPPH radical scavenging assay for tea liquid prepared using Chin-shin and TTES No. 18 cultivars. (b) Results of the oxygen radical absorbance capacity assay (ORAC) for tea liquid prepared using two cultivars. Antioxidant capacity is presented as the micromole Trolox equivalent per gram of fresh weight. Values are presented as the mean ± standard deviation from three biologically independent experiments. * indicates a significant difference between cultivars (p < 0.05; Student’s t test). YL: young leaf, IW: indoor withering, R: rolling, Fer: fermentation, and T: tea product.
Discussion
The distinct color stability in oolong tea after fixation arises from the high-temperature inactivation of PPO, a defining feature of semi-fermented tea production15. This process sharply reduces PPO activity (Fig. 2g), limiting the formation of theaflavins and maintaining a lighter infusion color even after 12 h of resting (Fig. 2a,c). In contrast, black tea production, which omits fixation, allows PPO activity to persist throughout (Fig. 2h), driving a gradual shift from light yellow to deeper yellow-orange hues as fermentation progresses (Fig. 2b,d)16. Our data also show that the initial withering step—sunlight withering for oolong tea and slower indoor withering for black tea—reduces water content and prepares leaves for subsequent stages. However, no significant differences in infusion color or PPO activity emerged between the two withering methods post-withering (Fig. 2), indicating that fixation and fermentation, rather than withering, are the primary drivers of color development in these teas.
Catechin dynamics provide further insight into these processing effects. In oolong tea, fixation preserves approximately 60–70% of the initial catechin content by thermally deactivating enzymes (Fig. 3a)17. Black tea, however, loses nearly 90% of its catechins during rolling and fermentation (Fig. 3b), as PPO converts them into TF (Fig. 2f). Specifically, non-galloyl catechins like EC and EGC decrease earlier during the rolling stage, while galloyl catechins such as ECG and EGCG decline more substantially during fermentation (Fig. 3b). This staged reduction aligns with PPO’s reported preference for EGC, which has a lower Km value, followed by EGCG and EC18,19. In black tea’s final step, the observed drop in TF content (Figs. 2f, 5d) likely reflects its polymerization into thearubigins, a process that darkens the infusion to an orange-brown shade20. These patterns are supported by moderate correlations between OD460 and TF (r = 0.69) and PPO activity and TF (r = 0.58) (Fig. S1), highlighting the enzymatic basis of color changes across both tea types.
Antioxidant capacity reflects these catechin shifts. Oolong tea’s retention of catechins sustains an ORAC performance comparable to fresh leaves (Fig. 4b), underscoring catechins’ role as the primary antioxidants in tea21. The superior antioxidant retention in oolong tea aligns with previous findings by Wang et al.22, which demonstrated that processing methods significantly influence the preservation of bioactive compounds in tea. In black tea, the extensive catechin loss reduces DPPH capacity to about 10% of initial levels (Fig. 4a), though TF and thearubigins contribute some residual antioxidant activity, as seen in the ORAC results (Fig. 4b)22. The strong correlations between catechin content and antioxidant capacity (ORAC r = 0.86, DPPH r = 0.67; Fig. S1) corroborate the findings of Chen et al.23, who established a direct relationship between polyphenolic content and the functional properties of different tea varieties, confirming that processing directly influences these functional properties alongside sensory characteristics. These findings illustrate a clear distinction: oolong tea prioritizes antioxidant retention, while black tea trades it for enhanced color and flavor complexity.
Cultivar differences add another layer to these observations. TTES No. 18, a large-leaf variety, contains significantly higher catechin levels in its young leaves compared to the small-leaf Chin-shin (Fig. 6), a trait consistent with large-leaf varieties’ greater flavonoid accumulation24,25. However, limited studies have examined how these compositional differences translate into processing outcomes and final product characteristics. Our research demonstrates that TTES No. 18’s higher initial catechin content (particularly EGCG and ECG) directly correlates with enhanced theaflavin formation during black tea processing, resulting in deeper infusion colors compared to Chin-shin26. This cultivar-processing interaction has been underexplored in previous literature. This higher substrate availability of TTES No. 18 leads to darker infusions color (Fig. 5b,c), despite similar PPO activity between the two cultivars (Fig. 5e). Chin-shin, traditionally used for oolong tea, produces lighter black tea infusions, aligning with its lower catechin baseline. However, its emerging use in black tea production23 and TTES No. 18’s superior antioxidant capacity (Fig. 7) demonstrates that both cultivars offer flexibility in processing outcomes. These compositional differences highlight how cultivar-specific leaf chemistry can influence the final tea product beyond enzymatic action alone.
While tea color has been studied using various methodologies26,27, most research has predominantly focused on static measurements rather than examining the dynamic changes in color over time. Our study provides evidence that different processing methods may create distinct patterns of color development, with oolong tea appearing to maintain relatively stable color following fixation while black tea shows continued color development, potentially due to ongoing enzymatic activity28. This examination of dynamic color changes during processing offers additional insights into the relationship between manufacturing methods and tea quality characteristics.
Collectively, our results show that tea infusion color and antioxidant properties are shaped by the interplay of processing techniques and cultivar characteristics. Fixation in oolong tea and fermentation in black tea, alongside catechin content variations between TTES No. 18 and Chin-shin, emerge as critical factors. Supported by our data (Figs. 2, 3, 4, 6, 7) and consistent with prior studies, these findings clarify how withering, enzyme activity, and leaf composition contribute to tea quality. Further investigation into enzyme–substrate interactions or varietal metabolic profiles could build on this work to optimize tea production strategies effectively.
Conclusion
This study examined the combined effects of processing methods and tea cultivars on infusion color, comparing semi-fermented oolong and fully fermented black tea production across small-leaf Chin-shin and large-leaf TTES No. 18 varieties. Processing conditions emerged as a pivotal determinant of color, modulating PPO activity to either preserve lightness in oolong tea or deepen hues in black tea through sustained fermentation. Equally critical was the marked variation in catechin content between cultivars, with TTES No. 18’s higher levels driving darker black tea infusions compared to Chin-shin. These factors—processing and variety—fundamentally shape tea quality, influencing chemical composition, enzyme dynamics, and sensory attributes like color, aroma, and flavor. By elucidating these interactions, our findings offer actionable insights for optimizing tea production and highlight avenues for future research, such as enzymatic kinetics or cultivar-specific metabolomics, to further enhance tea’s sensory and functional properties.
Materials and methods
Plant material
The plant material used in the experiment consisted of two cultivars: the small-leaf cultivar Chin-shin (Camellia sinensis var. sinensis) and the large-leaf cultivar TTES No. 18 (Camellia sinensis var. assamica). These tea samples were harvested from tea gardens located in Nantou, Taiwan. After the tea leaves were plucked from the tea plant, the tea leaf samples underwent a series of manufacturing processes. Samples were collected at each stage of the process and promptly stored in liquid nitrogen for subsequent analyses.
Tea-making processes and conditions
The experiment encompassed two tea-making processes: the semifermented oolong tea process and the fully fermented black tea process (Fig. 1). The manufacturing steps were as follows:
Oolong tea process
-
Young Leaf (YL): One-tip two-leaf samples of Chin-shin were plucked from the tea plant.
-
Sunlight Withering (SW): The main purpose of sunlight withering is to use the heat of the sun to start the physical and chemical changes in the tea leaves. This step can promote the activation of enzymes in the tea leaves, cause initial oxidation reactions, and begin to reduce the moisture content of the tea leaves. Fresh leaves were exposed to sunlight at approximately 32 °C for 20 min.
-
Indoor Withering (IW): Subsequently, the leaves were stored indoors at a temperature of 25 °C for 6 h. The purpose is to further control the water loss and enzyme reaction of the tea leaves. In this process, the tea leaves become soft and elastic, preparing for the subsequent rolling process.
-
Fixation (F): Fixation is a decisive step in controlling the degree of fermentation. Its core purpose is to use high temperature to destroy the activity of oxidative enzymes in tea leaves and prevent further fermentation reactions. Tea samples were subjected to high-temperature fixation (250 °C) in an oven for 1–1.5 min to prevent further fermentation by deactivating enzyme activity within the tea leaves .
-
Rolling (R): The main purpose of rolling is to destroy the cell tissue of tea leaves, so that the tea juice is released and adheres to the surface of the leaves. The oolong tea samples underwent a 30-min rolling process by using a rolling machine. The machine’s operation was intermittently paused every 3 to 5 min to unravel the leaves. In this process, the cell walls of tea leaves are crushed, and the tea juice is quickly exposed to oxygen, which promotes the oxidation reaction.
-
Tea product (T): The tea samples were carefully dried using hot air at 120 °C for 2 h to remove excess moisture from the leaves, thereby preventing mold formation. The resultant dried tea constituted the oolong tea product that was suitable for brewing and consumption.
Black tea process
-
Young Leaf (YL): One-tip two-leaf samples of TTES No. 18 were plucked from the tea plant.
-
Indoor Withering (IW): Indoor withering is a key step in the black tea production process. Its main purpose is to promote physical and biochemical changes in tea leaves by controlling environmental conditions. Indoor withering reduces cell moisture, increases cell membrane permeability, and indirectly promotes the reaction of oxidases, producing physical and chemical components such as aroma and flavor. The temperature was maintained at 25 °C for 16 h during indoor withering.
-
Rolling (R): During the rolling process, the cell walls of the tea leaves are compressed, the tea juice encounters oxygen, and the enzyme oxidation reaction is initiated. This is particularly important for black tea because it is conducive to the subsequent fermentation. The black tea samples underwent an hour-long rolling process using a rolling machine. The rolling machine’s operation was paused every 5 min to gently unravel the leaves, preventing the tea leaves from breaking too much and maintaining the proper temperature.
-
Fermentation (Fer): Fermentation is the most important stage in the formation of black tea quality. The purpose is to promote polyphenol oxidase to catalyze the oxidation and polymerization of catechins into theaflavins and theaflavins, which directly affect the brightness, freshness and richness of black tea soup. This environment was favorable for catalyzing the formation of numerous compounds within the tea leaves, resulting in transformative color and aroma changes. The temperature was maintained at 28 °C for 2.5 h.
-
Tea product (T): The tea leaves were subjected to high-temperature baking (120 °C for 15 min) to arrest the enzymatic reaction, thereby preserving the quality of the tea leaves. Concurrently, excess water was evaporated, reducing the volume and stabilizing the appearance of the tea product. After the drying process, black tea products were obtained.
Determination of tea infusion color
The tea samples from each process were subjected to grinding and homogenization in liquid nitrogen. Subsequently, 1 g of the fresh samples was brewed with 50 mL of boiling water for 3 min. The resulting mixture was filtered through a filter paper to eliminate any residual tea debris, yielding pristine tea infusion samples. Tea infusion color was examined following the approach of Obanda et al.29. The absorbance of the samples at 460 nm was quantified using an enzyme-linked immunosorbent assay (ELISA) reader (Beckman DU 650, USA). To determine the tea infusion color, we employed the following ensuing equation:
$${text{Tea}},{text{infusion}},{text{color}} = {text{A}}_{460} /{text{DM}}$$
where A460 indicates absorbance at 460 nm, and DM indicates the dry mass of the measured tea sample.
Measurement of Theaflavin content using the Flavognost method
The Flavognost method is a colorimetric assay commonly used to quantify theaflavin content in black tea. This method is valued for its specificity in detecting theaflavins, which are important for tea color and quality. Theaflavin content was measured using the Flavognost method outlined by Obanda et al.29 with minor modifications. The fresh tea samples (100 mg) were meticulously ground into a fine powder and subjected to extraction with 1 mL of H2O at 100 °C for 10 min. Subsequently, the mixture was centrifuged at 10,000 g for 5 min, and the supernatant was collected. Upon cooling of the infusion to room temperature, 500 μL of isobutylmethylketone (4-methylpentan-2-one, IBMK) was combined with 500 μL of the supernatant, followed by vigorous shaking for 10 min. This mixture was allowed to settle until distinct layers formed.
Next, 250 μL of the upper layer was transferred to a test tube; subsequently, 500 μL of EtOH and 250 μL of Flavognost reagent (comprising 2 g of diphenylboric acid-2-aminoethyl ester dissolved in 100 mL of ethanol) were added. The contents were meticulously mixed, and the mixture was incubated for 15 min for color development. Subsequently, absorbance at 625 nm was measured against an IBMK/ethanol (1:1 v/v) blank.
The theaflavin content was measured using the following equation:
$$TF (upmu{text{mol/g}} )=frac{{A}_{625 }times 47.9times 100}{DM}$$
where A625 represents absorbance at 625 nm, 47.9 denotes the molar conversion factor of theaflavins30, and DM indicates the weight of dry matter content (g).
PPO enzyme activity assay
The PPO enzyme activity assay was performed following a previous methodology with minor modifications18,31. To prepare the enzyme extract, 100 mg of homogenized fresh tea samples was mixed and stirred with 1 mL of sodium phosphate buffer (pH 7.0). Following extraction at 4 °C for 30 minutes and subsequent centrifugation, we collected the resulting supernatant as the enzyme extract. To initiate the enzyme reaction, in a 96-well ELISA plate, we added 25 μL of the enzyme extract, 150 μL of phosphate buffer (50 mM, pH 7.0), and 25 μL of 50 mM catechol solution.
The absorbance of the samples was measured at 420 nm, and PPO enzyme activity was determined using the following formula:
$$PPO, activity ,left(unitright)=frac{Delta {A}_{420}}{Delta t}times frac{V}{Ktimes v}$$
where A420 denotes the absorbance measured at 420 nm, t represents the reaction time in minutes, V indicates the total volume of the reaction medium in milliliters, K (with a value of 3400 μM−1 cm−1) is the micromolar coefficient of catechol, and v denotes the volume of the PPO-containing sample in milliliters.
The activity of PPO was quantified as one unit equivalent to a micromole of benzoquinone produced per minute.
Measurements of caffeine and catechin contents
High-pressure liquid chromatography (Hitachi L-7100 HPLC Pump, Japan) was used to determine the catechin content in the tea samples. A C18 reverse-phase column (LiChrospher 100 RP-18 [5 μm] LiChroCART 250–4) with an inner diameter of 250 × 4 mm was utilized. Prior to analysis, all solvents underwent filtration through a 0.22-μm polyvinylidene difluoride (PVDF) membrane filter (Pall Corporation, Glen Cove, NY).
Each sample was prepared by extracting 100 mg of freeze-dried tea powder with 1 mL of ethanol at 4 °C for 30 min. The resulting extracts were centrifuged at 10,000×g for 10 min, and the supernatants were filtered through a 0.45-μm membrane before injection.
A gradient elution method was adopted, with the mobile phase consisting of mobile phase A, 0.5% acetic acid solution, mobile phase B, and acetonitrile. The linear gradient commenced from 8% B and progressed to 25% B over 30 min. The column was maintained at ambient temperature, with an injection volume of 10 μL at a flow rate of 1.0 mL/min. UV absorbance was detected at a wavelength of 280 nm.
Antioxidant capacity assay
The antioxidant activity of tea infusions was examined using the 1,1-diphenyl-2-picrylhydrazyl (DPPH) free radical assay and the oxygen radical absorbance capacity (ORAC) assay.
In the DPPH assay, 100 mg of freeze-dried tea sample was extracted utilizing 1 mL of ethanol at 4 °C for 30 min. The resulting mixture was centrifuged at 1,000g for 10 min, and the supernatant was collected. The extracts were diluted 100-fold, and 60 μL of the diluted tea extract was added into a designated well in a 96-well ELISA plate. Subsequently, 140 μL of DPPH ethanol solution (75 ppm) was added. Following a 30-min incubation period, free radical scavenging activity was examined by measuring absorbance at 521 nm for both DPPH alone and the mixture of DPPH and the sample.
Free radical scavenging activity was determined using the subsequent formula:
$${text{Scavenging}},{text{activity}},(% ) = ({text{A}}_{{{text{blank}}}} {-}{text{ A}}_{{{text{sample}}}} )/{text{A}}_{{{text{blank}}}} times 100$$
where Ablank is the absorbance value recorded for the blank well at 521 nm, whereas Asample denotes the absorbance of the samples measured at the same wavelength.
The ORAC assay is a widely used method for measuring the antioxidant capacity of biological samples, including tea. The assay evaluates how well antioxidants in a sample can protect a fluorescent molecule (such as fluorescein) from oxidative damage caused by peroxyl radicals generated by an azo-initiator (AAPH). The decay of fluorescence is monitored over time; antioxidants slow this decay, and the protective effect is quantified by comparing the area under the fluorescence decay curve to that of a standard antioxidant (Trolox, a vitamin E analogue). The ORAC assay protocol was adopted from the study of Gillespie et al.32. A total of 50 mg of freeze-dried tea samples was boiled with 1 mL of H2O for 10 min, and subsequent dilution of 500 times was performed for the activity assay. Fluorescein and 2,2-azobis (2-amidinopropane) hydrochloride (AAPH) were diluted using sodium phosphate buffer (75 mM, pH 7.0). The reaction was conducted in a 96-well ELISA plate, and 150 μL of fluorescein (0.08 μM), 25 μL of the sample extract, and 25 μL of AAPH (12 mM) were added to each well of the plate. Fluorescence kinetics were monitored at excitation and emission wavelengths of 485 and 530 nm, respectively, at every minute over an hour. A standard Trolox (6-hydroxy-2,5,7,8-tetramethylchroman-2-carboxylic acid) curve was plotted for calculating ORAC activity as Trolox equivalents. The ORAC activity of each sample was determined by subtracting the area under the blank curve from the corresponding sample curve, yielding the net area under the curve (net AUC). In the blank control, the sample extract was replaced with phosphate buffer.
The AUC was calculated as follows:
$$AUC= 1+sum _{i=1}^{60}frac{{f}_{i}}{{f}_{0}}$$
where f0 represents the initial fluorescence reading at 0 min, and fi corresponds to the fluorescence reading at time point i. The net AUC specific to the sample was determined by subtracting the AUC value of the blank control.
Statistical analysis
The statistical analysis was conducted using Statistical Analysis System (SAS) software version 9.4. Analysis of variance, followed by the least significant difference (LSD) post hoc test, was employed for multiple comparisons between samples. Student’s t-test was utilized to assess the significance between samples under various experimental designs at a 5% significance level, with ‘*’ indicating significant differences (p < 0.05).
Data availability
The datasets used and/or analysed during the current study available from the corresponding author on reasonable request.
References
-
Hicks, A. Current status and future development of global tea production and tea products. Au. Jt. 12, 251–264. https://doi.org/10.1016/0091-7435(92)90041-F (2009).
-
Graham, H. N. Green tea composition, consumption, and polyphenol chemistry. Prev. Med. 21, 334–350. https://doi.org/10.1016/0091-7435(92)90041-f (1992).
-
Ho, C. T., Zheng, X. & Li, S. Tea aroma formation. Food Sci. Hum. Wellness 4, 9–27. https://doi.org/10.1016/j.fshw.2015.04.001 (2015).
-
Chen, Q., Liu, A., Zhao, J. & Ouyang, Q. Classification of tea category using a portable electronic nose based on an odor imaging sensor array. J. Pharm. Biomed. Analy. 84, 77–83. https://doi.org/10.1016/j.jpba.2013.05.046 (2013).
-
Koch, W. Theaflavins, thearubigins, and theasinensins. In Handbook of Dietary Phytochemicals, 975–1003. https://doi.org/10.1007/978-981-13-1745-3_20-1 (2021).
-
Rothenberg, D. O. N., Zhou, C. & Zhang, L. A review on the weight-loss effects of oxidized tea polyphenols. Molecules 23, 1176. https://doi.org/10.3390/molecules23051176 (2018).
-
Zhu, M. Z. et al. Microbial bioconversion of the chemical components in dark tea. Food Chem. 312, 126043. https://doi.org/10.1016/j.foodchem.2019.126043 (2020).
-
Xiong, Y., Zhang, P., Johnson, S., Luo, J. & Fang, Z. Comparison of the phenolic contents, antioxidant activity and volatile compounds of different sorghum varieties during tea processing. J. Sci. Food Agric. 100, 978–985. https://doi.org/10.1002/jsfa.10090 (2020).
-
Deka, H., Sarmah, P. P., Devi, A., Tamuly, P. & Karak, T. Changes in major catechins, caffeine, and antioxidant activity during CTC processing of black tea from North East India. RSC Adv. 11, 11457–11467. https://doi.org/10.1039/d0ra09529j (2021).
-
Dong, C. et al. Prediction of congou black tea fermentation quality indices from color features using non-linear regression methods. Sci. Rep. 8, 10535. https://doi.org/10.1038/s41598-018-28767-2 (2018).
-
Mao, Y. L. et al. Effect of chemical composition of black tea infusion on the color of milky tea. Food Res. Int. 139, 109945. https://doi.org/10.1016/j.foodres.2020.109945 (2021).
-
Donlao, N. & Ogawa, Y. The influence of processing conditions on catechin, caffeine and chlorophyll contents of green tea (Camelia sinensis) leaves and infusions. LWT 116, 108567. https://doi.org/10.1016/j.lwt.2019.108567 (2019).
-
Cheng, L. et al. Integration of non-targeted metabolomics and E-tongue evaluation reveals the chemical variation and taste characteristics of five typical dark teas. LWT 150, 111875. https://doi.org/10.1016/j.lwt.2021.111875 (2021).
-
Peterson, J. et al. Tea variety and brewing techniques influence flavonoid content of black tea. J. Food Composit. Anal. 17, 397–405. https://doi.org/10.1016/j.jfca.2004.03.022 (2004).
-
Zhang, L. et al. Chemistry and biological activities of processed Camellia sinensis teas: A comprehensive review. Compreh. Rev. Food Sci. Food Safe. 18, 1474–1495. https://doi.org/10.1111/1541-4337.12479 (2019).
-
Abudureheman, B., Yu, X., Fang, D. & Zhang, H. Enzymatic oxidation of tea catechins and its mechanism. Molecules 27, 942. https://doi.org/10.3390/molecules27030942 (2022).
-
Li, N., Taylor, L. S., Ferruzzi, M. G. & Mauer, L. J. Kinetic study of catechin stability: effects of pH, concentration, and temperature. J. Agric. Food Chem. 60, 12531–12539. https://doi.org/10.1021/jf304116s (2012).
-
Teng, J. et al. Purification, characterization and enzymatic synthesis of theaflavins of polyphenol oxidase isozymes from tea leaf (Camellia sinensis). LWT 84, 263–270. https://doi.org/10.1016/j.lwt.2017.05.065 (2017).
-
Muthumani, T. & Kumar, R. S. S. Influence of fermentation time on the development of compounds responsible for quality in black tea. Food Chem. 101, 98–102. https://doi.org/10.1016/j.foodchem.2006.01.008 (2007).
-
Hua, J. et al. Influence of enzyme source and catechins on theaflavins formation during in vitro liquid-state fermentation. LWT 139, 110291. https://doi.org/10.1016/j.lwt.2020.110291 (2021).
-
Sharma, N. et al. Black tea polyphenol theaflavin as promising antioxidant and potential copper chelator. J. Sci. Food Agric. 100, 3126–3135. https://doi.org/10.1002/jsfa.10347 (2020).
-
Wang, W. et al. Effects of key components on the antioxidant activity of black tea. Foods 12, 3134. https://doi.org/10.3390/foods12163134 (2023).
-
Chen, C. T., Yang, C. Y. & Tzen, J. T. Molecular characterization of polyphenol oxidase between small and large leaf tea cultivars. Sci. Rep. 12, 12870. https://doi.org/10.1038/s41598-022-18490-4 (2022).
-
Pereira, V., Knor, F., Vellosa, J. & Beltrame, F. Determination of phenolic compounds and antioxidant activity of green, black and white teas of Camellia sinensis (L.) Kuntze, Theaceae. Revista Brasileira de Plantas Medicinais 16, 490–498. https://doi.org/10.1590/1983-084X/13_061 (2014).
-
Yu, X. et al. Metabolite signatures of diverse Camellia sinensis tea populations. Nat. Commun. 11, 5586. https://doi.org/10.1038/s41467-020-19441-1 (2020).
-
Zhong, N. et al. Characterization of the sensory properties and quality components of huangjin green tea based on molecular sensory-omics. Foods 12, 3234. https://doi.org/10.3390/foods12173234 (2023).
-
Jin, S. et al. Study on the correlation between color and taste of beauty tea infusion and the pivotal contributing compounds based on UV-visible spectroscopy, taste equivalent quantification and metabolite analysis. Food Chem. X 21, 101192. https://doi.org/10.1016/j.fochx.2024.101192 (2024).
-
Zou, H., Lan, T., Jiang, Y., Yu, X.-L. & Yuan, H. Research on rapid detection methods of tea pigments content during rolling of black tea based on machine vision technology. Foods 13, 3718. https://doi.org/10.3390/foods13233718 (2024).
-
Obanda, M., Owuor, P., Mang’oka, R. & Kavoi, M. Changes in thearubigin fractions and theaflavin levels due to variations in processing conditions and their influence on black tea liquor brightness and total colour. Food Chem. 85, 163–173. https://doi.org/10.1016/S0308-8146(02)00183-8 (2004).
-
Spiro, M. & Price, W. E. Determination of theaflavins in tea solution using the flavognost complexation method. Analyst 111, 331–333. https://doi.org/10.1039/AN9861100331 (1986).
-
Almeida, S. L. D. et al. Polyphenol oxidase and peroxidase enzyme assays in sweet potato cultivars harvested at different times. Rev. Caatinga 32, 537–542. https://doi.org/10.1590/1983-21252019v32n226rc (2019).
-
Gillespie, K. M., Chae, J. M. & Ainsworth, E. A. Rapid measurement of total antioxidant capacity in plants. Nat. Protocols 2, 867–870. https://doi.org/10.1038/nprot.2007.100 (2007).
-
Kidist, T. Effect of tea processing methods on biochemical composition and sensory quality of black tea (Camellia sinensis (L.) O. Kuntze): A review. J. Horticult. Forest. 11, 84–95. https://doi.org/10.5897/JHF2019.0588 (2019).
Acknowledgements
We express our sincere gratitude to the late Dr. Jason T. C. Tzen, who made significant contributions to this research before his untimely passing. His expertise and collaboration were invaluable to the completion of this study. The loss of our esteemed colleague deeply saddens us, and we will always remember him for his lasting impact on this work. Our thoughts are with his family during this difficult time. This work was financially part supported by the “Innovation and Development Center of Sustainable Agriculture” from The Featured Areas Research Center Program within the framework of the Higher Education Sprout Project by the Ministry of Education (MOE) in Taiwan.
Ethics declarations
Competing interests
The authors declare no competing interests.
Additional information
Publisher’s note
Springer Nature remains neutral with regard to jurisdictional claims in published maps and institutional affiliations.
Supplementary Information
Rights and permissions
Open Access This article is licensed under a Creative Commons Attribution-NonCommercial-NoDerivatives 4.0 International License, which permits any non-commercial use, sharing, distribution and reproduction in any medium or format, as long as you give appropriate credit to the original author(s) and the source, provide a link to the Creative Commons licence, and indicate if you modified the licensed material. You do not have permission under this licence to share adapted material derived from this article or parts of it. The images or other third party material in this article are included in the article’s Creative Commons licence, unless indicated otherwise in a credit line to the material. If material is not included in the article’s Creative Commons licence and your intended use is not permitted by statutory regulation or exceeds the permitted use, you will need to obtain permission directly from the copyright holder. To view a copy of this licence, visit http://creativecommons.org/licenses/by-nc-nd/4.0/.
About this article

Cite this article
Chen, C., Yang, CY. & Tzen, J.T.C. Effect of tea manufacturing processes and cultivars on tea infusion color. Sci Rep 15, 29855 (2025). https://doi.org/10.1038/s41598-025-14852-w
-
Received:
-
Accepted:
-
Published:
-
DOI: https://doi.org/10.1038/s41598-025-14852-w

