Introduction
Developments in computer-aided design and computer-aided manufacturing (CAD/CAM) have led to considerable advancements in 3D printing including properties of various 3D-printing resin materials. 3D-printing technology such as digital light processing (DLP) and stereolithography (SLA) drives innovations in the fabrication of dental products, especially crowns and bridges1. DLP provides considerable advantages in both manufacturing and clinical settings by allowing entire resin layers to be cured at one time. This allows for faster production and easy customization, making it ideal for complex biomedical and dental restorations1,2,3.
3D-printing resin has broad applications in the production of complex dental restorations, with filler playing a key role in both cross-linking polymerization and the formation of a network structure. Inorganic fillers such as silicon dioxide (SiO2; henceforth silica) nanoparticles, glass fibers, and zirconium-dioxide nanoparticles4,5 have demonstrated great potential since they can markedly improve the surface, mechanical, and printing-trueness properties of resin composites.
Silica fillers are widely used in various dental resins due to their ease of processing, high biocompatibility, and cost-effectiveness6,7. Silica particles have various sizes, each exhibiting unique characteristics that can potentially affect their printing performance. The synthesis of size-controlled silica was first reported by Stöber et al. in 19688, and subsequent research classified these into silica nanoparticles and microparticles. Silica nanoparticles (40–400 nm) could produce smoother and more-durable resin surfaces9. However, the absorptivity of these surfaces could lead to agglomeration, uneven microstructures, and suboptimal mechanical properties in clinical restorations10. In contrast, silica microparticles could improve the strength of resin composites and provide diagnosis benefits due to its X-ray radiopacity11. There are still concerns about the durability and surface roughness of microparticles, as well as the larger particles and their irregular shapes posing a risk of light scattering reducing light penetration into deeper layers and thereby hindering resin curing10. Although there has been abundant longitudinal research into both silica nanoparticles and microparticles, comparisons between them are urgently needed to characterize how varying the particle size affects the properties of 3D-printing resin.
The silica concentration is also an important factor affecting the performance of 3D-printing resin, and is influenced by material property requirements, dispersibility, resin formulation design, and economics. In commercial 3D-printing resins, the silica concentration varies within the range of 0.25–5 wt% to ensure acceptable dispersion2,12,13. Most commercial 3D-printing resins are composite formulations containing silica, with filler concentrations often reaching up to 30 wt%14,15. Many manufacturers now offer adjustable formulations, especially with the silica concentration being tailored to the specific requirements of different crown restorations16,17. The complexity of filler systems has resulted in both their size and concentration being modified simultaneously17. However, the effects of particle size are not yet fully understood at a single concentration12,18. Therefore, comparative studies of the effects of silica particle size are essential for optimizing the performance of dental resins.
This study aimed to determine the multidimensional effects of particle size on resin properties by comparing the effects of incorporating silica nanoparticles and microparticles. Groups of both types of silica particles at concentrations of 1 wt% and 2 wt% were established to ensure the same experimental conditions and minimize confounding factors. Systematically analyzing two particle sizes—in terms of mechanical, surface, and printing-trueness properties of the resulting 3D-printed resin—allowed filler selection to be optimized and has yielded provides practical guidance for formula refining in resin-based applications.
The null hypothesis of this study is as follows: the particle size of silica (nanoparticles versus microparticles) does not significantly affect the surface, mechanical, or printing-trueness properties of 3D-printing resin.
Results
Characterization of silica particles
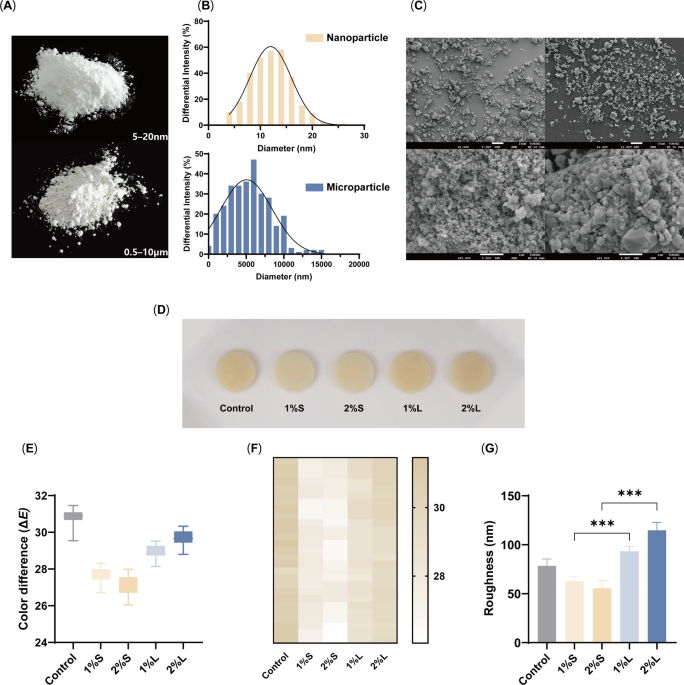
The silica nanoparticles and microparticles were white crystalline powders of uniform texture and odorless (Fig. 1A). For clarity and consistency, size values and figure within quantitative particle size analysis are expressed in nanometers (Fig. 1B). The mean diameter of the nanoparticles was 11.99 nm with a standard deviation of 3.85 nm. Approximately 94% of the particles fell within the size range of 5–20 nm. The mean diameter of the microparticles was 5468.30 nm, with a standard deviation of 2893.06 nm. Notably, 95% of the particles were distributed within the size range corresponding to 0.5–10 μm (500–10,000 nm). SEM at the high magnification of 1000× and 20,000× revealed their mesoporous morphology in both particle types, while only the microparticles exhibited a crystalline structure (Fig. 1C).

(A) Photographs of nanoparticle (upper) and microparticle (lower) powders, (B) frequency distribution of particle diameters, (C) SEM of nanoparticles (left) and microparticles (right) at magnifications of 1000× (upper) and 20,000× (lower), (D) color overview (E) color difference, (F) color heat map, and (G) Ra. ***, P < 0.001.
Surface characterization of printed composites
Representative photographs of 3D-printed specimens from the five study groups on a white calibration-standard board are shown in Fig. 1D. As shown on Fig. 1E, adding silica powder to the resin had a clear whitening effect on color compared with the control group (P < 0.001). The whitening effect was stronger in the small-particle groups than in the large-particle groups, and was dose dependent (P < 0.001), with the color of the 2%S group being closest to the white calibration board (27.15 ± 0.60). The results of visual heat-map processing in 135 color tests are shown in Fig. 1F.
The findings for surface roughness are summarized in Table 1; Fig. 1G and Supplementary Figure S1. Relative to the control group, the addition of small and large silica particles produced opposite effects on the surface roughness. The incorporation of small silica particles significantly reduced Ra, with the reduction being greatest in the 2%S group (55.60 ± 7.91 nm). In contrast, the addition of large silica particles increased the surface roughness, which Ra peaking in the 2%L group (114.73 ± 8.19 nm). In general, the size-based differences increased with particle concentration.

SEM and EDS images showing the silica distribution and elemental compositions of the disc surfaces at 1000× magnification. The red dots represent silicon (Si), while the green dots indicate carbon (C).
Figure 2 shows SEM images of disc surfaces obtained at a magnification of 1000×. Samples in the control group generally displayed a nearly smooth, clear surface with little residue. The surface was rougher for 3D-printed resin discs incorporating larger silica particles than for the control group and the groups with small silica particles at both concentrations. In the large-particle silica groups, the surface roughness increased with the concentration, even exhibiting a slight wave-like morphology. Compared with the control group, the small-particle groups showed no apparent differences in surface roughness in SEM.
The composition of 3D-printed resin disc reinforced with silica was analyzed using EDS. The SEM images and EDS element mapping images are also shown in Fig. 2. The EDS spectra and corresponding elemental compositions in atomic and weight percentages are presented in the Supplementary Material. The red rots in the images in Fig. 2 indicate the presence of silica elements on the surface. The density of these dots increased with the concentration of added silica. The small and large particles were distributed relatively uniformly in the resin, and the degree of agglomeration was within the acceptable range. Partial agglomeration was more obvious and isolated for large particles, and often accompanied by localized defects in resin curing, even forming pit-like sites.

(A) Degree of conversion, (B) Flexural strength, (C) Vickers hardness and (D) Relative cell viability. ***, P < 0.001; **, P < 0.01; ns, P > 0.05.
Degree of conversion
The 95% confidence interval was calculated for the nine samples in each group during the testing. The mean ± standard deviation values of the DC, flexural strength and Vickers hardness in the five study groups are summarized in Table 1; Fig. 3. To clearly signify the effects of particle sizes, asterisks are only used to indicate significant differences for particles at the same concentration.
The addition of small silica particles showed a significant enhancement effect relative to the baseline (control vs. 1%S: P = 0.0144; control vs. 2%S: P < 0.001), which increased progressively with the weight% (Fig. 3A; Table 1; Supplementary Table S1). In contrast, the large silica particles did not demonstrate a dose-dependent enhancement (control vs. 1%L: P = 0.9938; control vs. 2%L: P > 0.9999). Consequently, the differences between the different particle sizes at the same concentration widened as the weight% increased (P < 0.001).
Mechanical properties
ANOVA of the flexural strength revealed significant differences between the groups (P = 0.0097, Fig. 3B). The flexural strength was 126.96 ± 5.70 MPa in the control group, representing a stable baseline, while the groups with small silica particles at 1 wt%, small silica particles at 2 wt%, large silica particles at 1 wt%, and large silica particles at 2 wt% (groups 1%S, 2%S, 1%L, and 2%L, respectively) showed varying degrees of opposite effects relative to the baseline. Although both the 1%S and 1%L groups showed slight increases in flexural strength relative to the control group numerically, no significant differences were observed among the three groups (control vs. 1%S, P = 0.8313; control vs. 1%L, P = 0.7327; 1%S vs. 1%L, P = 0.9997). However, notable changes emerged when the concentration was increased: adding 2 wt% small silica particles decreased the mean flexural strength by 3.162 MPa, to 123.79 ± 7.06 MPa. In contrast, the strengthening effect of 2 wt% large silica particles persisted, reaching 134.03 ± 4.65 MPa, with a significant difference observed between the 2%S and 2%L groups (P = 0.0057).
The Vickers hardness values are summarized in Table 1; Fig. 3C. For the baseline group, the effects of adding fillers showed similar trends but different results. At the lower particle concentration of 1 wt%, the hardness-reducing effect was prominent in both groups (P < 0.001). However, when the concentration was increased to 2 wt%, the large-particle group exhibited a notable increase in Vickers hardness (17.12 ± 0.19 HV), exceeding the values in both the small-particle group (16.49 ± 0.15 HV) and the baseline (16.60 ± 0.36 HV).
Relative cell viability
Figure 3D indicated that relative cell viability of human gingival fibroblasts remained unchanged among seven groups after both 24 and 72 h incubation. All silica-containing extracts—regardless of loading (1 wt % or 2 wt %) or particle size—displayed viability values comparable to the negative control and control resin (all bars share the same superscript a, P > 0.05).

Results of the customized crown evaluations, a dentiform model (D85DP-500B.1, Nissin, Kyoto, Japan) prepared by a co-author, scanned by a tabletop scanner (Identica T500, Medit, Seoul, Korea) and modified using CAD software (Meshmixer, version 3.5.474; Autodesk, Rafael, CA, USA; https://meshmixer.com/). (A) trueness superimposition and (B) SEM images of the layer structure of the crown margins at 50× and 100× magnifications.
Evaluations of customized crown margins by digital superimposition and SEM
There were significant differences in the alignment surface among control, small-particle, and large-particle groups (Table 2, Supplementary Table S1). The RMS value of the calibration cube was 33.52 μm, indicating the most-stable surface. One-way ANOVA revealed significant differences in trueness between the groups (P < 0.001). The RMS value of the control group was 71.40 ± 8.97 μm. The groups containing 2 wt% silica showed increasing RMS values (2%S, 108.94 ± 4.14 μm; 2%L, 105.38 ± 7.27 μm), suggesting the presence of outliers or special condition effects. The RMS values were generally very high, indicating that adding silica at high concentrations would reduce the printing trueness both overall and especially in the fine margin in Fig. 4A.
Figure 4B shows SEM images of each group at 50× and 100× magnifications. Visual inspections and SEM observations revealed thinner margin regions of the crown with printing interruptions. Adding particles of different sizes and concentrations resulted on differing effects on defects on the material surface. As the concentration increased, the extent of damage became progressively more severe. Figure 4 shows that the surface structure remained relatively intact in the control group, with clear layered structures. The surface structure exhibited an increase in the number and size of holes in the 1%S group, which became more pronounced in the 2%S group, with the layered structure being extensively disrupted. By comparison, groups with larger particles showed major damage to the layered structure, with defects larger than those observed in the 1%S and 2%S groups. In the 2%L group, the walls surrounding the defect had fractured and disappeared.
Discussion
Silica is also known for its high biocompatibility6, supporting its use in biomedical and dental application. Evaluating the effects of particle diameter and weight% on silica-incorporated resins is essential to achieving superior performance and long-term use in dental restorations. The aim of this study was to systematically determine how the size of silica particles affects resin properties in order to meet diverse application requirements. The findings indicated partial rejection of the null hypothesis. Particle size produced significant differences in most properties – larger silica yielded higher flexural strength and hardness but rougher surfaces, while nano-sized silica improved degree of conversion and smoother surfaces with a pronounced whitening effect – yet printing trueness showed no significant size-dependent difference (accuracy was similarly reduced for both nano and micro fillers at 2% wt). This indicates that although silica size clearly influences mechanical and surface outcomes, it does not appreciably affect printing accuracy, warranting a partial rather than full rejection of the null hypothesis.
This study compared the effects of adding small particles (5–20 nm) and large particles (0.5–10 μm) at concentrations of 1 wt% and 2 wt%. It has been reported that ground quartz micropowder (10–50 μm) and ground glass micropowder (0.6–10 μm) from crystallized silica significantly improved the strength of resins11. Lankoff et al.19,20 found that the size of silica particles directly affected the filler loading capacity and test performance by comparing 12-nm and 40-nm particles. Such small spheres, which differ from those with micron dimensions, can act as a lubricant to allow the material to flow freely and exert a small effect on viscosity. Two types of particles were selected with sizes differed by at least 25-fold to cover both nanoscale and microscale ranges, ensuring that significant results with broad applicability. Silica concentration is another key determinant of resin performance. Previous studies have shown that silica particles can be incorporated with a uniform distribution in a resin matrix at concentrations of up to 4 wt%, whereas aggregation tends to occur above 6 wt%18. Notably, at concentrations of ≤4 wt%, such particles are able to remain dispersed and exhibit stable properties10. Gangil et al. reported a 15–30% reduction in tensile strength when silica content was increased from 2 wt% to ≥ 3 wt% in hemp–sisal epoxy composites21. Importantly, our results and earlier studies show that even at this ~ 2 wt% loading, silica addition already had either a strengthening or deteriorating effect on the resin system (Table 1)21. Considering the need for a uniform distribution and that silica is predominantly used in filler systems with two or more composite formulations, this study set the maximum concentration at 2 wt%. Although industrial composite systems can achieve silica loadings of ~ 30 wt % or even higher by using engineer under high shear mixing to suppress aggregation and control rheology14,15, our study at 1–2 wt % establishes a clear and indispensable baseline for isolating intrinsic size effects and guiding the design of future hybrid or high silica loading formulations4,22. To overcome the narrow range limitation and fully characterize the sensitive results, future work will explore higher or intermediate levels with broader concentration gradients (0.5, 1.5, 3.0, and even 4.0 wt% for one size) even hybrid silica to identify the optimal balance between flexural strength, degree of conversion, surface roughness, and trueness.
This study found that when considering silica as a coloring agent, there was a slight difference in the white colors of the two powders, and that the whitening effect increased progressively in increments of 1.0% (P < 0.001). The silica particles appeared as a loose, dry, pure-white powder, with the larger microparticles showing a visible decrease in brightness to the naked eye as well as having a slightly gritty texture (Fig. 1A). These observations are consistent with a previous study finding that adding 10% glass silica to a resin resulted in a noticeable whitening effect23. Additionally, NextDent C&B is a commercial resin whose color is similar to that of teeth, which would surely be changed by the addition of white-powder fillers (Fig. 1F). Alshamrani et al. provided a representative overview of the findings for their test bars, describing that the bar with 20% white-powder glass-silica filler appeared brighter in color, although no quantitative color measurements were made4. Furthermore, Lim et al.24 emphasized that the quantitative lightness was strongly correlated with that of resin composites containing 10–70 wt% glass filler. The diameters of the two glass fillers in the study of Lim et al. were similar (0.77 μm and 0.50 μm), which may explain why they found no correlation between color lightness and particle diameter. This contrasts with our study investigating particles with a 25-fold difference in the diameter ranges (5–20 nm vs. 0.5–10 μm), which may change the color due to its effects on light scattering25, facilitating the ability to characterize any correlation between color lightness and particle diameter. Clinically, ΔE*ab value above approximately 3.3 is considered the 50:50% acceptability threshold for dental restoration26. The 2%S group (ΔE = 27.15 ± 0.60) exceeded acceptable limits and thus raised concern about a perceptible whitening effect. The color differences between specimens may also vary with the heat-treatment methods27, oxygen inhibition, and the colorants23. Moreover, higher filler content may cause surface deterioration during the postprocessing and particles precipitation during storage27,28. The pronounced whitening effect may be clinically beneficial in cases such as anterior temporization or long-span provisional where increased brightness is preferred. Considering of these factors above, careful adjustment of filler size and concentration along with the use of pigment or opaquer when necessary is recommended to mitigate excessive whitening and ensure aesthetic harmony in dental restorations22.
The surface roughness (which was quantified as the Ra in this study) of resin-based composites significantly effects their aesthetic and biological properties, contributing to discoloration23, increased wear29, biofilm accumulation30, and cytotoxicity31. Since manually polished composites exhibit greater instability than unpolished surfaces, the original surfaces were retained for the Ra measurements. The Ra values in the experimental groups demonstrated a distinct smoothing effect after the addition of nanoparticles and a roughening effect after adding microparticles, both of which were strongly correlated with the particle concentration (Fig. 1G). Similarly, Rodríguez et al.14 compared the roughness between two types of silica particles (silica–zirconion-dioxide nanoclusters and silica nanoclusters), and concluded that the surface was smoother for the smaller particles. The surface area and pore structure of mesoporous silica allow it to be uniformly dispersed in a resin matrix, filling in microscopic defects and thus reducing the surface roughness32,33. This beneficial effect was even more obvious in our 2%S group, in which the Ra reduced to 55.60 ± 7.91 nm (Table 1). Ra values exceeding 0.2 μm has been reported to increase biological concerns regarding plaque deposition34,35. In the present study, the highest Ra observed for 2 wt% silica microparticles remained below 0.2 μm (Fig. 1G; Table 1), thereby minimizing these risks. Thus, maintaining the microparticles at a concentration at or below 2% is recommended for controlling roughness and for reducing oral hygiene risks when using resin-based restorations.
Figure 2 demonstrates that no distinct fluorescent spots indicating the agglomeration of silica nanoparticles were found in the SEM images or EDS mapping. The silicon signals observed in the control group’s EDS mapping can be attributed to instrumental artifacts, including scattered X-rays from silicon-based components within the SEM chamber (such as detector windows and sample stages) and inherent background noise from the X-ray spectrometer system itself, as silicon was confirmed to be absent from both the resin formulation and post-processing procedures. The control group appeared relatively clean, whereas the surfaces of the groups with silica nanoparticles had a granular appearance. In contrast, the microparticle groups exhibited pit-like voids or even a wavy appearance. There is usually fairly good consistency between Ra values and SEM findings, as found by Aytac et al.36. The Ra value of the discs in our 2%L group was 114.73 ± 8.19 nm, which is consistent with the gritty, wavy surface evident in the SEM images. The finishing and postprocessing steps would only remove residual monomer and unintegrated silica, resulting in other particles either remaining embedded on the surface or detaching from it. The smaller nanoparticles—with their larger surface area—are more likely to remain embedded, while the larger microparticles tend to detach more easily from the surface. Similar exposed filler particles and voids resulting from filler loss were observed by Aytac et al.36 and Aljabo et al.37. SEM images obtained in other studies38,39 revealed silica-filler-induced voids at fracture sites deep inside the resin. Although our study did not observe the degradation of mechanical properties due to internal voids, these observations suggest that further evaluations of factors such as abrasion and fractures are necessary to evaluate the distribution of internal fillers.
The presence of nanoparticles demonstrated a distinct enhancement effect as well as a concentration-dependent improvement in the DC (Fig. 3A). It could be inferred that smaller nanoparticles cause increased light scattering, which leads to a higher DC40. The ultimate DC in all groups in the present study typically fell within the range from 50 to 80%, which is consistent with reported values for most commercial dental resins41. Therefore, future studies should investigate the effects of higher concentrations of particles with clinically relevant standard deviations in order to further elucidate the effects on DC.
The mechanical properties of a resin crucially affect the long-term performance of a dental prosthesis. Adequate flexural strength is essential for ensuring that temporary crowns and bridges can withstand chewing forces before the final restoration is fabricated. According to ISO 4049:2019, Type 2 polymer-based restorative materials must exhibit a minimum flexural strength of 50 MPa. All tested groups in the present study comfortably exceed this requirement, with flexural strength values not falling below 116.73 MPa (Table 1). This study found that the flexural strength was significantly lower in the 2%S group than in the control group, widening the gaps with the group with larger silica particles at the same concentration and with the baseline resin (Fig. 3B). Conversely, Khan et al.42 observed improved flexural strength in nanofillers with a particle diameter of 20 nm. The larger surface area of nanoparticles will increase their interactions with polymer chains13. This allows more polymer segments to be adsorbed on the particle surface but also has the potential to cause aggregation at higher concentrations that will create areas of stress concentration that can induce crack initiation.
Previous studies have found that incorporating 3-µm microparticles increases the hardness of dental composites more effectively than when using 30-nm nanoparticles at 2.5% or 5.0%15. Moreover, Rodríguez et al.14 concluded that the mechanical properties are influenced more by the filler concentration than by the particle size. By comprehensively investigating both of these factors, our study revealed a clear hardening effect with silica microparticles, which appeared greater when the concentration raised up to 2 wt% (Fig. 3C). This suggests that voids present in the resin are gradually filled by crystalline silica rather than the monomer, leading to an increase in hardness as the filler content increases40,43. In the present study, mechanical properties were measured according to the size and concentration of silica particles, which were found to influence the agglomeration effect, crystalline substance resistance, and light scattering. The results support the importance of considering particle size to achieving the optimal trade-off between mechanical properties and filler characterization.
The surface geometry of a DLP provisional crown is limited by the layer-by-layer printing pattern44, which appears step-like when the crown is placed horizontally (Figs. 4A and 6B). The lower trueness of the marginal areas across all groups as indicated in Fig. 4A non-green surrounding collar area, may attribute to inherent distortions from vertical printing pattern45. Since crown margins are very thin, inaccuracies caused by the step-like morphology and layer discontinuities would be particularly significant, especially in geometry aligned with the projection axis. Additionally, the regions highlighted in red (Fig. 4A) indicate a localized clustering of elevated RMS values, which also correspond to concave and convex distortions induced by the layer-by-layer printing and orientation. However, the localized deviations have disproportionately influenced the overall values by group-level, contributing unevenly to RMS values. This study analyzed overall intaglio surface for better comparison. It is recommended to consider region-wise segmentation or direction-specific assessment in clinically contoured crown models to enable more precise evaluation of printing parameters. Besides, layer thickness is demonstrated to play a key role influencing trueness. Specifically, groups with a 30-µm layer thickness showed higher trueness than the 50-µm groups in several studies46,47. Given that the design of the present study included the incorporation of silica particles, a regular layer thickness of 50 μm was selected to improve comparability between other 3D-printing studies. The obtained trueness values were relatively high (calibration cube, 33.52 ± 7.81 μm; control, 71.40 ± 8.97 μm); in contrast, Son et al.48 reported a trueness of only 29.5 ± 3.3 μm when using a 25-µm printing-layer thickness in their crown-investigation study. In clinical cases or other different scenarios where high precision of the crown margins is required, it is recommended that the printing layer thickness be reduced, or different parameters be used than for conventional crown manufacturing processes.
Previous research suggested that the trueness of the intaglio surface trueness should be between 50 and 100 μm for it to be used in fixed dental prostheses48,49,50,51. This study measured RMS values of up to 108.94 μm in 2%S. The increase in RMS at 2% loading may compromise the marginal and internal fit of prosthetic restorations, potentially affecting clinical performance. But considering the comparison purpose, the methodology compromised via adoption of a 50 μm layer thickness and tailored changes in crown morphology, resulting in larger RMS values and greater distinction between the groups included. Prior studies showed that reducing layer thickness to 20–30 μm markedly improves trueness and margin quality46,47, which would generally narrow the spread of RMS values between experimental groups. As shown in Fig. 4B, a thinner area was delineated to target and compare holes and walls at the same location when designing the crown STL file. In the control group, margins were intact, and the interlayer microstructure was clearly similar to the ideal side surface with a natural gradient45,52. However, the same area exhibited scattered holes in the 1%S group, while these holes started to emerge in the 2%S group to form larger defects with pronounced disruption of the layered structure. In contrast, groups with larger added particles showed major damage to the printing continuity and thin wall retainability. Becker et al.53 suggested that the overall layer structure of nanocomposites comprises a blend of intercalated and exfoliated structures. It is generally believed that the phase boundary is the weakest point of layered materials, and where destruction in the form of delayering begins54,55. In our study, interlayer disruption may have resulted from poor bonding of the silica particles to the resin matrix, which was also concentration dependent. Smaller particles intercalated into one or two 50‑µm layers producing minute air voids Fig. 4B. Larger particles are more prone to embedding and exfoliation within several layers (50 μm) to form rigid zones that created stress‑concentrated spots, triggering cracks and edge discontinuities. Therefore, silica particle size dictated the defect mechanisms while the 50 μm layer thickness emerged as a significant confounder, exaggerating interlayer damage. Using thinner layer below 50 μm would certainly improve RMS trueness and margin quality46, but residual differences from particle size or concentration would likely shrink. Thus, it is recommended to carefully select layer thickness or other parameters like printing orientation, segmental accuracy analysis based on specific goals or clinical use, to balance trueness, marginal continuity and structural integrity.
This study had some Limitations. Firstly, only one commercial 3D-printing resin product was evaluated, which might be highly specific to the unique resin chemistry of NextDent C&B. In other formulation systems with Bis-GMA, UDMA-, TEGDMA or bis-acrylic matrices, silica incorporation can influence viscosity, polymerization shrinkage and mechanical behavior in ways that differ from those observed in NextDent C&B56,57. Other resin systems need to be explored in future work. Secondly, more detailed gradients should be investigated, with appropriate increases in silica concentration, as well as attempts to create more complex formulations by varying the sizes of the silica particles. It has also been reported that a glass-silica-based system improved the resin properties4. The long-term evaluations including of color stability, water sorption, residual monomer release and wear resistance58 are planned in future material studies. To fully characterize biosafety, sub chronic and chronic assessments beyond 72‑hour cytotoxicity tests are planned in follow-up research.
Methods
The overall workflow of the experiments is shown in Fig. 5.

Workflow for the incorporation of silica particles and specimen design, printing, and testing.
Specimen preparation
Universal CAD software (Rhinoceros version 5, Robert McNeel & Associates, Seattle, WA, USA) was used to design the testing specimens, and Meshmixer software (version 3.5.474, Autodesk, San Rafael, CA, USA) was used to design the customized crowns59.

(A) Platform of the tested specimens. (B) Perspective views of a customized crown.
As shown on Fig. 6A, for measuring flexural strength, test bars (n = 9 per group) were designed according to International Standards Organization (ISO) 404960, with dimensions of 25 mm × 2 mm × 2 mm. The surface and mechanical properties were evaluated using discs that were 10 mm in diameter and 2 mm thick. A solid cube of 10 mm × 10 mm × 10 mm was set as a calibration object to measure the inherent deviation of the printer. A maxillomandibular tooth dentiform model (D85DP-500B.1, Nissin, Kyoto, Japan) was prepared by a co-author (occlusal reduction of 1.5 mm, axial reduction of 1.2 mm, and convergence angle of 6°) and scanned using a tabletop scanner (Identica T500, Medit, Seoul, Korea), while leaving a 60-µm cement space and 0.5-mm-wide sealing band along the crown margins (Fig. 6B). Additional modifications were made to the model using CAD software (Meshmixer, version 3.5.474, Autodesk, Rafael, CA, USA, available at: https://meshmixer.com/). The design file was exported in standard tessellation language (STL) format, calculated using slicing software (Composer, Asiga, Sydney, Australia), and printed using a DLP printer (MAX™, Asiga) at a layer thickness of 50 μm and with support structures59. The study design involved printing 205 discs, 45 bars, and 45 customized interim crowns.
NextDent C&B 3D-printing resin (Lot: WT193N03, Crown & Bridge, NextDent, Soesterberg, Netherlands) was used to produce specimens and customized crowns. It was stored in the original light-protective package to maintain material integrity, and all specimens were stored in aluminum foil-wrapped containers to prevent UV degradation throughout the experiment. The resin was stirred continuously overnight for at least 12 h prior to printing to ensure homogeneity, followed by manual shaking for a minimum of 5 min before printing. As modified fillers, small silica nanoparticles (5–20 nm, 99.5% trace metals basis, CAS Number: 7631-86-9) and large silica microparticles (0.5–10 μm, 99.0% trace metals, CAS Number:14808-60-7) were obtained from Sigma-Aldrich company (St. Louis, MI, USA) (Table 3). The particle size analysis was performed using a Particle Size & Zeta Potential Analyzer (ELS‑Z1000; Otsuka Electronics, Tokyo, Japan). For ease of comparison, the terms small diameter, small silica and nanoparticles are used equally to refer to former groups, while large diameter, large silica and microparticles are presented for the latter groups. Silica particles of these two sizes were added to the base resin at concentration of 1 wt% and 2 wt%. The mixtures were stirred at high speed (450 rpm) for 5 h to ensure uniform dispersion.
After printing, the specimens and interim crowns in all groups were washed for 3 min in a rotary washer (Twin tornado, Medifive, Incheon, South Korea) containing isopropyl alcohol. The specimens and crowns were then dried manually and immediately cured using a UV postcuring box (LC 3D Print Box, 3D Systems, Rock Hill, SC, USA) for 10 min.
Surface characterization
Nine specimens were prepared in each group for color-difference analyses. For consistency with prior studies23 and simple interpretation based on established threshold values61, we applied the CIELAB color space (L*, a*, and b*) to calculate color differences. The color of each specimen was measured using a spectrophotometer (CR-321, Kinoca Minolta, Osaka, Japan). The spectrophotometer was calibrated before the measurements, and the CIELAB color space (L*, a*, and b*) was measured with the specimen placed on a white reflectance standard (L* = 94.56, a* = 0.15, and b* = 1.6). Each specimen was measured three times, and the average of the three measurements was recorded. The color difference (ΔE) between baseline and groups was measured using the following equation:
$$Delta E = :sqrt{{({L}_{b}^{*}text{}-{L}_{n}^{*}text{})}^{2}+{({a}_{b}^{*}text{}-{a}_{n}^{*}text{})}^{2}+{({b}_{b}^{*}text{}-{b}_{n}^{*}text{})}^{2}}$$
where (:{L}_{b}^{*}), (:{a}_{b}^{*}), and (:{b}_{b}^{*}) were obtained from white reflectance standard.
The surface roughness was measured in nine discs per group. To evaluate the original surface condition of the discs after 3D printing and to minimize the direct impact of polishing on the microstructure, the roughness measurements were performed on the discs following a standard cleaning procedure without polishing. The average roughness height (Ra value) was measured using a contact-type profilometer (DektakXT, Bruker, Hamburg, Germany) over a total length of 3.0 mm, cutoff of 0.08 mm, range of 6.5 μm, and measuring speed of 60 μm/s. The measurements were repeated three times for each disc, and statistical analyses were performed using the average of the measured values.
The microstructures of the disc without polishing and customized crown were characterized by scanning electron microscopy (SEM) (JSM-IT800SHL, JEOL, Tokyo, Japan) at 15.0 kV. Before scanning, the specimens were coated with a 100-nm-thick layer of platinum and fixed on a sample holder. Images were acquired at 50×, 100×, 1000×, and 20,000× magnifications. All disc groups were also subjected to energy-dispersive X-ray spectroscopy (EDS) to determine carbon, silicon, oxygen and nitrogen elements in scanned area.
Degree of conversion
To assess the degree of conversion (DC), a single drop of uncured resin was collected and the spectra of it was analyzed using a Fourier-transform infrared (FT-IR) spectrometer (Nicolet IS10, Thermo Fisher Scientific, Madison, WI, USA), after which the 3D printing process started immediately according to the predetermined parameters. Disc-shaped specimens (n = 9) with a diameter of 10 mm and a thickness of 2 mm were prepared, polished using 2000-grit SiC paper, and incubated for 24 h at 37 °C. The DC of each specimen was measured three times on the surface opposite to the supporting side. For the uncured scenario, a drop of the stock resin was used to measure the DC.
After baseline correction of the spectra, the peak value of the absorption bands corresponding to aromatic and aliphatic carbon C = C bonds were measured at 1608 cm–1 and 1637 cm–1, respectively. The DC was calculated using the following equation:
$$DC (%) = left({1-:frac{{R}_{cured}}{{R}_{uncured}}}right) times 100$$
where R represents the ratio of aliphatic to aromatic C = C bond intensities in cured and uncured specimens.
Mechanical properties
Flexural strength was measured using a three-point bending test with a tabletop universal testing instrument (EZ-LX, Shimadzu, Kyoto, Japan). Nine bar-shaped specimens that were 25 mm long, 2 mm wide, and 2 mm high were incubated at 37 °C for 24 h according to International Organization for Standardization (ISO) 4049 (2019). The flexural strength (σ) of the specimens was calculated in megapascals using the following equation:
$$:sigma=frac{3FL}{{2wh}^{2}}$$
where F is the loading force applied at the fracture point in newtons, L is the distance between the supports in millimeters, and w and h are the width and height of the specimen in millimeters, respectively.
The Vickers hardness was measured for disc-shaped specimens (n = 9) with a diameter of 10 mm and thickness of 2 mm that had been polished using 2000-grit and then 4000-grit SiC paper sequentially and then transferred to an incubator for 24 h at 37 °C. Their hardness was measured using a Vickers hardness tester (MMT-X7, Matsuzawa, Kyoto, Japan), with a force of 200 g applied for 15 s on the surface opposite where the specimen was supported. Three measurements were recorded for each disc, with the mean value then calculated.
Relative cell viability
The cytotoxicity of the specimens toward human gingival fibroblasts (HGFs, PCS-201-018, ATCC) was evaluated with a WST-8 cell-proliferation assay following established method62. Frozen HGFs were thawed and cultured in Dulbecco’s modified Eagle’s medium supplemented with 10% fetal bovine serum, 1% penicillin/streptomycin, and 1% non-essential amino acids at 37 °C in 5% CO₂ until 85–90% confluence. Disk-shaped 3D-printed specimens (10 mm × 2 mm) were printed. Disk-shaped specimens with a diameter of 10 mm and a height of 2 mm were prepared for the test to prepare a surface-area-to-volume ratio of 1.25 cm² mL⁻¹ according to ISO 10993-12. The specimens were incubated for 24 h and 72 h to obtain extracts for short-term and long-term biocompatibility assessment respectively. HGFs (8 × 10³ cells well⁻¹) were seeded in 96-well plates, pre-incubated for 24 h, and then exposed to 100 µL of each extract for a further 24 h. Five repetitions were set for each extract. The natural culture group (NC) was set up by incubating the HGFs with 100 µL culture medium alone. After adding 10 µL WST-8 solution and incubating for 120 min, absorbance was measured at 450 nm. Relative cell viability (%) was calculated as
$$:Relative:cell:viabilityleft(%right)=left(frac{{OD}_{sample}-{OD}_{blank}}{{OD}_{control}-{OD}_{blank}}right)times:100$$
where sample wells contained extracts and cells, control wells contained cells and medium, and blanks contained medium only. The experiment was performed in triplicate to confirm reproducibility.
Customized crown experiments
A tabletop scanner was used to scan the printed customized crowns in high-precision scanning mode again. This scanner was calibrated before the scanning process in accordance with the instructions from the manufacturer, reportedly yielding a scanning accuracy of better than 7 µm63. The data for all groups were obtained within 2 h after each sample had been printed48.
The 3D trueness analysis was performed using 3D inspection software (Geomagic Control X version 2024, 3D Systems). The scanning and original files were uploaded in the software with the original design file in STL format as the reference model. The calibration region was positioned away from the cusps and occlusal surface in order to eliminate deviations around the print supports. The marginal region, axial region, and the entire intaglio surface were selected as the standard region, in which the initial alignment and best-fit alignment were performed in sequence. The root mean square (RMS) value was calculated for all point clouds in the standard region as follows:
$$:RMS:value=frac{1}{sqrt{n}}cdot:sqrt{sum:_{i=1}^{n}{left({X}_{1,i}-{X}_{2,i}right)}^{2}}$$
where n is the total number of points, and X1,i and X2,i are the coordinates of corresponding points in the two data sets. The difference (X1,i – X2,i) is squared, summed for all points, and then averaged. The square-root operation ensures the result is in the same units as the original measurements.
3D comparisons were displayed as color-difference maps over a range from − 300 μm to + 300 μm (20 color segments) and a tolerance range from − 30 μm to + 30 μm (green). Expansions of the compared region beyond the standard region’s surface were colored red (positive RMS values), while contractions or recessions below the surface were colored blue (negative RMS values).
Statistical analysis
The sample size of the study was determined using G*Power software (v.3.1.9.4; Kiel, Germany) for a one-way ANOVA comparing five independent groups. We assumed a large effect size from pilot study and previous research64, setting effect size of 0.52, significance level α = 0.05 and desired power ≥ 0.80, which justified the sample size choice under feasible constraints. Standard statistical software (SPSS version 26.0, IBM, Armonk, NY, USA) was used for descriptive statistics and statistical analyses. The presence of normality was checked using the Shapiro–Wilk test. One-way ANOVA was performed to compare the effects of different combinations of silica concentration (1 wt%, 2 wt%) and particle size (nanoparticle, microparticle) on color difference, surface roughness, DC, flexural strength, Vickers hardness and trueness. Each combination was treated as an independent experimental group. The threshold for significance was set at α = 0.05 for all tests. Post hoc comparisons were conducted using Tukey’s HSD test when significant differences were identified.
Conclusions
Based on the findings of this comparative study, silica is a promising filler capable of modifying the surface, mechanical, and printing-trueness properties of 3D-printing resins with satisfying biocompatibility. The effects of silica varied significantly depending on particle size and concentration. Silica microparticles produced better flexural strength and Vickers hardness as well as a rougher surface than silica nanoparticles. Silica nanoparticles produced a superior DC, printing continuity, whitening effect, and smoother surface than silica microparticles.
Data availability
The datasets generated during and/or analysed during the current study are available from the corresponding author on reasonable request.
References
-
Wu, L. & Song, Y. Recent innovations in interfacial strategies for DLP 3D printing process optimization. Mater. Horiz. https://doi.org/10.1039/d4mh01160k (2024).
-
Zhao, J. et al. Modification of photosensitive resin with fumed silica. Polimery 68, 264–268. https://doi.org/10.14314/polimery.2023.5.3 (2023).
-
Xu, F. et al. Digital light processing printed hydrogel scaffolds with adjustable modulus. Sci. Rep. 14, 15695. https://doi.org/10.1038/s41598-024-66507-x (2024).
-
Alshamrani, A., Alhotan, A., Kelly, E. & Ellakwa, A. Mechanical and biocompatibility properties of 3D-Printed dental resin reinforced with glass silica and zirconia nanoparticles: in vitro study. Polymers 15 https://doi.org/10.3390/polym15112523 (2023).
-
AlGhamdi, M. A. et al. Flexural strength of 3D-printed nanocomposite provisional resins: impact of SiO(2) and ZrO(2) nanoparticles and printing orientations in vitro. J. Prosthodontics: Official J. Am. Coll. Prosthodontists. https://doi.org/10.1111/jopr.13829 (2024).
-
Elbatanony, M. M., Safwat, E. M., El-Sherif, S. & Hassan, M. L. Resin-based dental pulp capping restoration enclosing silica and portlandite nanoparticles from natural resources. Sci. Rep. 14, 16554. https://doi.org/10.1038/s41598-024-66728-0 (2024).
-
Huang, Y. et al. Silica nanoparticles: biomedical applications and toxicity. Biomed. pharmacotherapy = Biomedecine Pharmacotherapie. 151, 113053. https://doi.org/10.1016/j.biopha.2022.113053 (2022).
-
Stöber, W., Fink, A. & Bohn, E. Controlled growth of monodisperse silica spheres in the micron size range. J. Colloid Interface Sci. 26, 62–69 (1968).
-
Zimmerli, B., Strub, M., Jeger, F., Stadler, O. & Lussi, A. Composite materials: composition, properties and clinical applications. A literature review. Schweizer Monatsschrift Fur Zahnmedizin = Revue Mensuelle Suisse d’odonto-stomatologie = Rivista Mensile Svizzera Di Odontologia E Stomatologia. 120, 972–986 (2010).
-
Liu, J. et al. The development of filler morphology in dental resin composites: A review. Mater. (Basel Switzerland). 14. https://doi.org/10.3390/ma14195612 (2021).
-
Habib, E., Wang, R., Wang, Y., Zhu, M. & Zhu, X. X. Inorganic fillers for dental resin composites: present and future. ACS Biomaterials Sci. Eng. 2, 1–11. https://doi.org/10.1021/acsbiomaterials.5b00401 (2016).
-
Nowicki, A. et al. Mechanical and material analysis of 3D-Printed temporary materials for implant Reconstructions—A pilot study. Biomedicines 12, 870 (2024).
-
Gad, M. M. & Fouda, S. M. Factors affecting flexural strength of 3D-printed resins: A systematic review. J. Prosthodont. 32, 96–110 (2023).
-
Rodríguez, H. A. & Casanova, H. Effects of silica nanoparticles and silica-zirconia nanoclusters on tribological properties of dental resin composites. J. Nanatechnol. 2018, 7589051. https://doi.org/10.1155/2018/7589051 (2018).
-
Kundie, F., Azhari, C., Muchtar, A. & Ahmad, Z. Effects of filler size on the mechanical properties of Polymer-filled dental composites: A review of recent developments. J. Phys. Sci. 29, 141–165. https://doi.org/10.21315/jps2018.29.1.10 (2018).
-
Talmazov, G. Wear Resistance of SLA 3D Printed Definitive Crowns Using a Permanent Crown Resin: an in-vitro Comparative Study (The University of Texas School of Dentistry at Houston, 2022).
-
Cho, K., Rajan, G., Farrar, P., Prentice, L. & Prusty, B. G. Dental resin composites: A review on materials to product realizations. Compos. Part. B: Eng. 230, 109495 (2022).
-
Ding, J. et al. Nano-silica modified phenolic resin film: manufacturing and properties. Nanatechnol. Reviews. 9, 209–218. https://doi.org/10.1515/ntrev-2020-0018 (2020).
-
Lankoff, A. et al. Effect of surface modification of silica nanoparticles on toxicity and cellular uptake by human peripheral blood lymphocytes in vitro. Nanotoxicology 7, 235–250. https://doi.org/10.3109/17435390.2011.649796 (2013).
-
Barghamadi, H., Atai, M., Imani, M. & Esfandeh, M. Effects of nanoparticle size and content on mechanical properties of dental nanocomposites: experimental versus modeling. Iran. Polym. J. 24, 837–848 (2015).
-
Singh, T., Gangil, B., Ranakoti, L. & Joshi, A. Effect of silica nanoparticles on physical, mechanical, and wear properties of natural fiber reinforced polymer composites. Polym. Compos. 42, 2396–2407 (2021).
-
Suh, Y. R., Ahn, J. S., Ju, S. W. & Kim, K. M. Influences of filler content and size on the color adjustment potential of nonlayered resin composites. Dent. Mater. J. 36, 35–40. https://doi.org/10.4012/dmj.2016-083 (2017).
-
Lee, S. Y. et al. Evaluation of the color stability of 3D printed resin according to the oxygen Inhibition effect and temperature difference in the post-polymerization process. J. Mech. Behav. Biomed. Mater. 136, 105537. https://doi.org/10.1016/j.jmbbm.2022.105537 (2022).
-
Lim, Y. K., Lee, Y. K., Lim, B. S., Rhee, S. H. & Yang, H. C. Influence of filler distribution on the color parameters of experimental resin composites. Dent. Mater. 24, 67–73. https://doi.org/10.1016/j.dental.2007.02.007 (2008).
-
Fielding, L. A. et al. Visible Mie scattering from Hollow silica particles with particulate shells. Chem. Mater. 26, 1270–1277 (2014).
-
Ruyter, I., Nilner, K. & Möller, B. Color stability of dental composite resin materials for crown and Bridge veneers. Dent. Mater. 3, 246–251 (1987).
-
Nam, N. E., Hwangbo, N. K., Jin, G., Shim, J. S. & Kim, J. E. Effects of heat-treatment methods on cytocompatibility and mechanical properties of dental products 3D-printed using photopolymerized resin. J. Prosthodontic Res. 67, 121–131. https://doi.org/10.2186/jpr.JPR_D_21_00345 (2023).
-
Kessler, A., Reymus, M., Hickel, R. & Kunzelmann, K. H. Three-body wear of 3D printed temporary materials. Dent. Mater. 35, 1805–1812. https://doi.org/10.1016/j.dental.2019.10.005 (2019).
-
Ruivo, M. A., Pacheco, R. R., Sebold, M. & Giannini, M. Surface roughness and filler particles characterization of resin-based composites. Microsc. Res. Tech. 82, 1756–1767 (2019).
-
Cazzaniga, G., Ottobelli, M., Ionescu, A., Garcia-Godoy, F. & Brambilla, E. Surface properties of resin-based composite materials and biofilm formation: A review of the current literature. Am. J. Dent. 28, 311–320 (2015).
-
Giti, R., Dabiri, S., Motamedifar, M. & Derafshi, R. Surface roughness, plaque accumulation, and cytotoxicity of provisional restorative materials fabricated by different methods. PLoS One. 16, e0249551 (2021).
-
Al-Maharma, A. Y., Patil, S. P. & Markert, B. Effects of porosity on the mechanical properties of additively manufactured components: a critical review. Mater. Res. Express. 7, 122001 (2020).
-
Liu, P. & Chen, G. F. Porous Materials: Processing and Applications (Elsevier, 2014).
-
Tzimas, K., Rahiotis, C. & Pappa, E. Biofilm formation on hybrid, Resin-Based CAD/CAM materials for indirect restorations: A comprehensive review. Materials 17, 1474 (2024).
-
Bollen, C. M., Lambrechts, P. & Quirynen, M. Comparison of surface roughness of oral hard materials to the threshold surface roughness for bacterial plaque retention: a review of the literature. Dent. Materials: Official Publication Acad. Dent. Mater. 13, 258–269. https://doi.org/10.1016/s0109-5641(97)80038-3 (1997).
-
Aytac, F. et al. Effects of novel finishing and Polishing systems on surface roughness and morphology of nanocomposites. J. Esthetic Restor. Dentistry. 28, 247–261 (2016).
-
Aljabo, A. et al. Conversion, shrinkage, water sorption, flexural strength and modulus of re-mineralizing dental composites. Dent. Mater. 31, 1279–1289. https://doi.org/10.1016/j.dental.2015.08.149 (2015).
-
Kangwankai, K. et al. Monomer conversion, dimensional stability, strength, modulus, surface apatite precipitation and wear of novel, reactive calcium phosphate and polylysine-containing dental composites. PLoS One. 12, e0187757. https://doi.org/10.1371/journal.pone.0187757 (2017).
-
Cevik, P. & Yildirim-Bicer, A. Z. The effect of silica and Prepolymer nanoparticles on the mechanical properties of denture base acrylic resin. J. Prosthodont. 27, 763–770 (2018).
-
Liu, X., Wang, Z., Zhao, C., Bu, W. & Na, H. Preparation and characterization of silane-modified SiO2 particles reinforced resin composites with fluorinated acrylate polymer. J. Mech. Behav. Biomed. Mater. 80, 11–19 (2018).
-
Leprince, J. G., Palin, W. M., Hadis, M. A., Devaux, J. & Leloup, G. Progress in dimethacrylate-based dental composite technology and curing efficiency. Dent. Mater. 29, 139–156. https://doi.org/10.1016/j.dental.2012.11.005 (2013).
-
Khan, S. B. et al. Influence of nanoparticle size on the mechanical and tribological characteristics of TiO2 reinforced epoxy composites. J. Mater. Res. Technol. 26, 6001–6015. https://doi.org/10.1016/j.jmrt.2023.09.002 (2023).
-
Wang, R. et al. Wear behavior of light-cured resin composites with bimodal silica nanostructures as fillers. Mater. Sci. Engineering: C. 33, 4759–4766 (2013).
-
Jiang, T. et al. Study of forming performance and characterization of DLP 3D printed parts. Materials 16, 3847 (2023).
-
Aljehani, A. et al. Effect of build orientation on the fracture resistance and marginal quality of 3D-printed anatomic provisional crowns: an in-vitro study. Saudi Dent. J. 36, 584–590. https://doi.org/10.1016/j.sdentj.2024.01.004 (2024).
-
Mou, Z. et al. Zirconia crowns manufactured using digital light processing: effects of build angle and layer thickness on the accuracy. J. Dent. 151, 105359. https://doi.org/10.1016/j.jdent.2024.105359 (2024).
-
Çakmak, G. et al. Effect of printing layer thickness on the trueness and margin quality of 3D-printed interim dental crowns. Appl. Sci. 11, 9246 (2021).
-
Son, K., Lee, J. H. & Lee, K. B. Comparison of intaglio surface trueness of interim dental crowns fabricated with SLA 3D printing, DLP 3D printing, and milling technologies. Healthc. (Basel Switzerland). 9. https://doi.org/10.3390/healthcare9080983 (2021).
-
Ender, A., Attin, T. & Mehl, A. In vivo precision of conventional and digital methods of obtaining complete-arch dental impressions. J. Prosthet. Dent. 115, 313–320 (2016).
-
Fukazawa, S., Odaira, C. & Kondo, H. Investigation of accuracy and reproducibility of abutment position by intraoral scanners. J. Prosthodontic Res. 61, 450–459 (2017).
-
Refaie, A., Fouda, A., Bourauel, C. & Singer, L. Marginal gap and internal fit of 3D printed versus milled monolithic zirconia crowns. BMC Oral Health. 23, 448 (2023).
-
Vidakis, N. et al. Mechanical reinforcement course of 3D printed polypropylene–antimony doped Tin oxide nanocomposites versus filler loading. Adv. Compos. Mater. 31, 235–256. https://doi.org/10.1080/09243046.2021.1973173 (2022).
-
Becker, O., Varley, R. & Simon, G. Morphology, thermal relaxations and mechanical properties of layered silicate nanocomposites based upon high-functionality epoxy resins. Polymer 43, 4365–4373. https://doi.org/10.1016/S0032-3861(02)00269-0 (2002).
-
Bokhoeva, L. A. et al. Use of nano-sized components in multilayer composite materials. Nanotekhnologii V Stroitel’stve. 16, 180–188 (2024).
-
Lin, J. C., Chang, L. C., Nien, M. H. & Ho, H. L. Mechanical behavior of various nanoparticle filled composites at low-velocity impact. Compos. Struct. 74, 30–36. https://doi.org/10.1016/j.compstruct.2005.03.006 (2006).
-
Kim, D. et al. Effects of Post-Curing time on the mechanical and color properties of Three-Dimensional printed crown and Bridge materials. Polymers 12, 2762 (2020).
-
Lin, C. H., Lin, Y. M., Lai, Y. L. & Lee, S. Y. Mechanical properties, accuracy, and cytotoxicity of UV-polymerized 3D printing resins composed of Bis-EMA, UDMA, and TEGDMA. J. Prosthet. Dent. 123, 349–354 (2020).
-
Grymak, A., Aarts, J. M., Cameron, A. B. & Choi, J. J. E. Evaluation of wear resistance and surface properties of additively manufactured restorative dental materials. J. Dent. 147, 105120. https://doi.org/10.1016/j.jdent.2024.105120 (2024).
-
Sasany, R., Jamjoom, F. Z., Uçar, S. M. & Yilmaz, B. Nanoindentation creep: the impact of water and artificial saliva storage on milled and 3D-printed resin composites. J. Prosthodont. (2024).
-
Janda, R., Roulet, J. F. & Latta, M. The effects of thermocycling on the flexural strength and flexural modulus of modern resin-based filling materials. Dent. Mater. 22, 1103–1108 (2006).
-
Yu, B. & Lee, Y. K. Influence of color parameters of resin composites on their translucency. Dent. Mater. 24, 1236–1242 (2008).
-
Cao, L. et al. Antibacterial and fluorescent clear aligner attachment resin modified with chlorhexidine loaded mesoporous silica nanoparticles and zinc oxide quantum Dots. J. Mech. Behav. Biomed. Mater. 141, 105817 (2023).
-
Rotar, R. N., Faur, A. B., Pop, D. & Jivanescu, A. Scanning distance influence on the intraoral scanning Accuracy—An in vitro study. Materials 15, 3061 (2022).
-
Alageel, O. et al. Trueness, flexural strength, and surface properties of various three-dimensional (3D) printed interim restorative materials after accelerated aging. Polymers 15, 3040 (2023).
Acknowledgements
This work was supported by the National Research Foundation of Korea(NRF) grant funded by the Korea government(Ministry of Science and ICT, MSIT). Project number: NRF-2021R1C1C1012183.
Ethics declarations
Competing interests
The authors declare no competing interests.
Additional information
Publisher’s note
Springer Nature remains neutral with regard to jurisdictional claims in published maps and institutional affiliations.
Supplementary Information
Rights and permissions
Open Access This article is licensed under a Creative Commons Attribution-NonCommercial-NoDerivatives 4.0 International License, which permits any non-commercial use, sharing, distribution and reproduction in any medium or format, as long as you give appropriate credit to the original author(s) and the source, provide a link to the Creative Commons licence, and indicate if you modified the licensed material. You do not have permission under this licence to share adapted material derived from this article or parts of it. The images or other third party material in this article are included in the article’s Creative Commons licence, unless indicated otherwise in a credit line to the material. If material is not included in the article’s Creative Commons licence and your intended use is not permitted by statutory regulation or exceeds the permitted use, you will need to obtain permission directly from the copyright holder. To view a copy of this licence, visit http://creativecommons.org/licenses/by-nc-nd/4.0/.
About this article

Cite this article
Chen, D., Jin, G., Zhang, Z. et al. Effects of silica particle size on the mechanical, surface and printing-trueness properties of 3D-printing dental resin. Sci Rep 15, 35644 (2025). https://doi.org/10.1038/s41598-025-19615-1
-
Received:
-
Accepted:
-
Published:
-
DOI: https://doi.org/10.1038/s41598-025-19615-1