Introduction
Natural gelatin (Gel) is a collagen degradation product extracted from animal skin, bones, and connective tissues. Therefore, it shares a common origin with collagen and possesses a similar amino acid composition. It is characterized by low immunogenicity, good biodegradability and biocompatibility, as well as the capacity to promote cell proliferation and differentiation. These properties render it an ideal material for various biomedical applications and skincare products1,2. In recent years, gelatin microspheres (GMs) prepared based on this material have been widely used in tissue engineering for diverse purposes, such as tissue regeneration, drug delivery systems, and scaffolds for cell delivery2,3,4 .Particularly in the field of drug delivery carriers, GMs have garnered significant attention from researchers5,6,7. Therefore, preparing gelatin that meets the requirements of biomedical applications is a pivotal task in current tissue engineering research.
Compared with the traditional extraction method, the production of recombinant collagen by using genetic engineering technology has significant advantages such as high product purity, strong stability and excellent safety8,9. Currently, this research field is in a stage of rapid development10,11,12. Komagataella phaffii (K. phaffii), as a widely recognized safe eukaryotic expression host, not only has a complete post-translational modification ability in the production of drug proteins but also has been recognized as “Generally Recognized as Safe” (GRAS) by the US Food and Drug Administration (FDA)12,13,14. Although this system has received increasing attention and been widely used by more and more enterprises in the biomedical field, there are still certain limitations15. For example, some target proteins cannot be recombinantly expressed12,15; even if exogenous proteins can be successfully expressed, achieving the optimal expression level is still an extremely challenging task16,17. Especially in bioreactors, it is necessary to precisely regulate various culture parameters (such as pH value, ventilation rate, feed rate, temperature, and methanol concentration) to optimize the protein expression efficiency18. In addition, in order to screen out the strain with the optimal expression level, a series of complex molecular biology experiments are required to evaluate the efficient expression and accumulation of recombinant proteins14,16. However, this process is not only time-consuming but also costly11,19. Therefore, the development of a rapid and efficient screening method has become a key problem that urgently needs to be solved.
In the preliminary research, K. phaffii expression system was successfully utilized to achieve soluble secretion of recombinant human gelatin (hlrGEL6)17. The recombinant gelatin comprises six repeated peptide monomers, reaching a maximum expression level of 0.057 g/L during shake flask fermentation. Although slightly higher than the expression level (0.032 g/L) reported in recent literature for the same strain, it still falls short of the requirements for industrial fermentation15,17. The study also revealed that when hlrGEL6 hydrogel was used as a scaffold for cultivating HepG2 cells, these cells exhibited distinct 3D cell culture characteristics and enhanced cell viability17. These findings highlight its immense potential as a biomedical scaffold material. In order to develop it into a biomedical material, it is imperative to further improve the expression level of the original recombinant yeast strain (GS115/pPICZα-gel6, 4# clone) to achieve or approximate industrial-level high-efficiency expression (not less than 1.0 mg/mL).
At present, the efficient expression and accumulation of recombinant proteins are usually detected by molecular biological methods, such as SDS-PAGE, Western blotting, and mass spectrometry analysis17,20,21. However, these traditional methods are complex to operate, time-consuming, and require staining and marking of samples or even cell disruption treatment. The application of SCLRS provides a new way to study the physiological and biochemical changes of individual living cells in solution22. Since these biological macromolecules such as nucleic acids, proteins, lipids, and carbohydrates have specific Raman spectral characteristics, important information such as the composition, structure, and physiological state of intracellular biological macromolecules can be obtained by analyzing these characteristic spectra23. Chan first used Raman spectroscopy to study the expression of myelin oligodendrocyte glycoprotein (MOG) in individual recombinant E. coli cells induced by isopropyl thiogalactoside (IPTG)24. Xie successfully used SCLRS to rapidly detect the expression of zebrafish β growth hormone recombinant protein in E. coli and K. phaffii. Compared with the traditional SDS-PAGE, SCLRS does not require cell disruption or staining and marking, simplifies the sample preparation process, reduces the sample demand, and is able to monitor the expression of recombinant proteins in living cells at the single-cell level in real time, showing the advantages of non-invasiveness and rapid detection23,25 .
This study aims to utilize the constructed expression strain (GS115/pPICZα-gel6, 4# clone) and explore the effects of different concentrations of antibiotics (such as Zeocin) treatment on the expression of recombinant protein (hlrGEL6) in individual live yeast cells through SCLRS. This method provides a simple, rapid, and non-destructive technical means for the expression analysis of hlrGEL6 in genetic engineering strains.
Materials and methods
Materials
Plasmids and strains
The strains and vectors used in our work are shown in Table 1. The cloning strain E. coli Top10/pPICZα-gel6 and the expression strain GS115/pPICZα-gel6(4# clone) were constructed by our group and stored in our laboratory.
Culture medium
The strains and vectors used in our work are shown in Table 1. E. coli TOP10 and GS115 strains were utilized as cloning and expression hosts, respectively. The GS115 and pPICZα-B were stored in our laboratory.
E. coli Top10 was incubated overnight at 37 °C in Luria–Bertani (LB) medium. E. coli Top10 transformer was screened in LB plates containing ampicillin (100 µg/mL). The yeast transformants (GS115/pPICZα-gel6) were screen on YPDZ plates. Yeast was first inoculated on YPD plates. Subsequently, it was transferred to fermentation medium containing 1% yeast extract, 2% peptone,100 mM potassium phosphate (pH 6.0), 1.34% yeast nitrogen base, 4 × 10− 5% biotin, and 1% glycerol (BMGY) or 1% methanol (BMMY) at 28 °C. The culture media for K. phaffii comprise YPD, BMGY, and BMMY, with the formulations from the operating manual of Invitrogen company17,18.
Reagents
The Bradford Protein Assay Kit was purchased from TaKaRa; bovine serum albumin was purchased from Thermo; Anti-His-HRP was purchased from Wuhan Sanying; Zeocin was purchased from Thermo Fisher. The Fluorescence quantitative PCR instrument was procured from Applied Biosystems. The AKTA Pure protein chromatography purification system and nickel column were bought from GE. All the other reagents are domestically produced and have analytical purity.
Methods
Construction of strains with varying gene dosages for expression
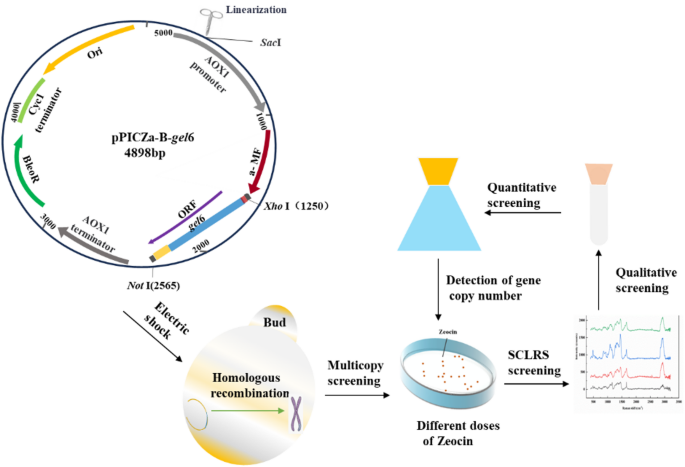
After linearization, the expression vector (Top10/pPICZα-gel6) was randomly integrated into the AOX1 region of the GS115 genome, resulting in variations in gene dosage among different transformants. The presence of the bleomycin resistance gene (Shble) in the vector enabled its product, the antibiotic-binding protein BleoR, to confers Zeocin resistance to the host cells. Consequently, YPDZ plates were employed for screening yeast transformants and, by applying additional Zeocin selection pressure, for increasing the copy number of the target gene26. The principle is illustrated in Fig. 1. Previous studies have demonstrated a correlation between the production of target proteins and an increased gene copy number26,27. Our research has further shown an impact of target gene copy number on glutamine transaminase expression in K. phaffii27. Therefore, selecting transformants with high-copy genes under conditions of high Zeocin concentrations can enhance protein production.
An improved method known as Post-Transformational Vector Amplification (PTVA) was employed to obtain high-copy target genes21,28. The original strain (GS115/pPICZα-gel6, 4# clone), stored in our laboratory, was diluted 100-fold. Subsequently, 200 µL aliquots of each diluted solution were evenly spread onto YPDZ plates with varying concentrations of Zeocin (200, 400, 800, and 1,200 µg/mL). These plates were then incubated at 28 °C for two to three days until single clones appeared. It was observed that the number of clones varied across the different plates. From each plate, twelve individual clones with typical morphology were selected for further analysis through Single-Cell Laser Raman Spectroscopy (SCLRS), with an untransformed empty vector strain serving as a negative control.

Schematic diagram of the construction process of the high-yield strain hlrGEL6.
The circle graph: Schematic map of the recombinant expression vector pPICZα-gel6.
SCLRS for screening transformation products
Raman measurements were collected by Horiba microscopic confocal HR Evolution Raman microscope (Horiba, France). The spectrometer was equipped with an air-cooled solid-state laser operating at 785 nm, a CCD detector cooled to -60℃ and a 600 grooves/mm grating. The laser was coupled to the microscope via an optical fiber with a diameter of 50 μm. To collect data, a dry Olympus MPLAN (100×/0.90NA) objective was used. The monochromator of the spectrometer was calibrated using the Raman scattering line generated by a silicon plate (520.5 cm− 1). For each group of strains, the spectra of 12 individual cells were tested, and each cell was measured twice (n single_strain = 12, n total = 48). Data were collected in the spectral range of 400–3200 cm− 1. The integration time for a single spectrum was 100 s21,28,29.The Raman spectra of the detected strains (Z-200, Z-400, Z-800, Z1200 µg/mL) were all subtracted by the Raman spectra of the empty vector strains. Use the software Horiba provided by the spectrometer to convert the spectral data into ASCII data, and then input it into the software Origin for processing.
Validation experiment of screening transformed strains by SCLRS
In order to verify the primary screening results of SCLRS, four clones (GS115/pPICZ-gel6) with characteristic peaks were selected from each plate and inoculated into 24-well plates containing 2 mL of BMGY medium. They were cultured at 28 °C until the OD600 reached 5 ~ 6. Then, the cultures were centrifuged, and the supernatant was removed; the cells were collected. The cells were induced for expression using 2 mL of BMMY medium containing 1% methanol at 28 °C for 48 h, and the supernatant was collected. The expression of recombinant proteins was detected by SDS-PAGE and Western blot. The antibodies employed for the Western blot analysis were commercial ones, and the constructed original recombinant strain(GS115/pPICZα-gel6, 4# clone) served as the control group.
One expression strain was selected from each of the four groups of strains and the expression level was verified again by re-screening with 100 mL shake flasks. The fermentation process and detection method used in this re-screening were identical to those used in the experiment of 24-well plate above. To identify the effect of different Zeocin screening pressures on the copy number of target genes, further gene-level analysis was performed on the positive strains identified through the secondary screening process. The constructed original recombinant strain (GS115/pPICZα-gel6, 4# clone) was utilized as the control group again.
Detection of the copy number of the gel6 gene in Recombinant strains
To determine the copy number of the gel6 gene in the genome of K. phaffii, four positive clones which had been verified through the experiments above were subjected to Real-time fluorescence quantitative PCR(qPCR), with the gel6 gene in the strain (GS115/pPICZα-gel6,4# clone) serving as a control. First, the plasmid (pMD-19T-gel6)containing gel6 was constructed and a plasmid standard curve was generated. Subsequently, the Ct value of gel6 in each sample was obtained through real-time fluorescence quantitative PCR (qPCR) using yeast genomic DNA as the template. Finally, the copy number of gel6 in the K. phaffii genome was determined by substituting the obtained Ct value into the plasmid standard curve in accordance with the formula ({text{~}}{10^{frac{{{text{Ct}} – {text{b}}}}{{text{k}}}}})(Ct represents the cycle number in qPCR, and k and b respectively represent the slope and intercept of the standard curve).
The specific methodology: the genome of K. phaffii extracted from the four samples were assayed through real-time fluorescence quantitative PCR (qPCR), which was performed with P1/P2 (P1: GGTTCTCCAGGTAATCAA, P2:CACGTTCACCTTTGTTAC) serving as primers. Each sample was assayed in triplicate, with plasmids being extracted and real-time fluorescence quantitative PCR performed independently for each repetition. The qPCR reactions were performed in a 20µL volume containing 2×ChamQ Universal SYBR qPCR Master Mix (10 µL), DNA template (5µL), each primer of 0.4µL (10 µmol/L), and DEPC (7.2 µL). The reaction conditions were as follows: 40 cycles of pre-denaturation at 95℃ for 30s, denaturation at 95℃ for 10 s, and annealing extension at 60℃ for 30s. A melting curve was obtained using the following conditions: 95℃ for 15s, 60℃ for 1 min, 95℃ for 30s, and 60℃ for 15s.
Effect of gene copy number (gel6) on hlrGEL6 expression
The strains with different gel6 gene copy numbers were then inoculated into YPDZ solid medium and cultured at 28 °C for 2 ~ 3 days until single colonies appeared. The single colonies were selected and cultured in 5mL YPDZ liquid medium overnight with shaking. The overnight cultures were all transferred to 25 mL of BMGY medium(pH 6.0)and incubated at 28 °C with shaking at 200 r/min for 24 h to measure the OD600. Once the OD600 reached 6, the strains were collected by centrifugation at 3, 000 g for 5 min, suspended in 100 mL of BMMY medium (methanol 1%, pH 6.0) for induction expression (initial OD600 = 1.5), which lasted for a duration of 72 h at 28 ℃ with the addition of methanol (V/V) once every 24 h.
The pH of the fermentation supernatant was adjusted to 7.4, followed by centrifugation at 12, 000 g for 10 min to remove yeast precipitate and obtain the supernatant. After filtration through a 0.45 μm filter membrane, the supernatant was injected into a nickel column within an AKTA protein purification system(AKTA Pure L, GE Healthcare) for purification in accordance with the procedures in reference(nickel column: His Trap HP)17. The steps were performed in the following sequence: equilibration (50 mmol/ L PBS, 0.3 mol/L NaCl, pH 7.4) → sample loading → re-equilibration(50 mmol/L PBS, 0.3 mol/L NaCl, pH 7.4) → washing (50 mmol/L PBS, 0.3 mol/L NaCl, 20 mmol/L imidazole, pH 7.4) → elution (20 mmol/L PBS, 0.3 mol/L NaCl, 300 mmol/L imidazole, pH7.4), with the eluate being collected. The eluate was dialyzed against PBS (pH 7.4) to remove imidazol Non-reducing SDS-PAGE electrophoresis was used to analyze the purified samples with a 10% gel concentration, and Western Blotting technology was employed to identify the target proteins using His-Tag-HRP antibody. Protein concentrations were measured with a Bradford Protein Assay Kit (TaKaRa), with bovine serum protein (Sigma) serving as the standard protein17,18.
High-density fermentation of high-expressed strains
To further explore expression capabilities of high-expression strains, the strains with higher expression levels were selected for high-density fermentation (BioFlo120, Eppendorf, 10 L). These strains were cultivated in YPD liquid medium and subsequently employed for seed culture. Then, 100 mL of the YPD seed was transferred into 1.2 L of BMGY medium, which served as the initial fermentation medium and consisted of 1.2 L BMGY containing 4% glycerol, 150 mL of YNB, and 150 mL of PPB. The fermentation parameters were set as following: pH 6.0, a rotation speed of 600-800 rpm, a cultivation temperature maintained at 28℃, and an aeration rate of 10 L/min. Once the basic glycerol in the tank was depleted, the dissolved oxygen would temporarily increase, so 50% glycerol (containing 12 ml/L PTM1) was supplemented at a constant rate of 25 ml/(L*h) at this time. When the wet weight of yeast reached 160 g/L, glycerol supplementation ceased and 100% methanol (containing 12 ml/L PTM1) was introduced to commence the induction of expression. Methanol induction was performed in three phases: the first phase at a feeding rate of 3.6 ml/(L*h) for approximately 4 ~ 6 h, the second one at a feeding rate of 7.2 ml/(L*h), and the third one at a feeding speed of 10.8 ml/(L*h), which continued until discharge. The induction temperature was kept at 28 °C; the dissolved oxygen level was maintained at 25%~30%; the entire induction fermentation lasted for 48 h30. Samples were taken every 8 h to measure the wet weight of the yest cells and the concentration of total protein in the fermentation supernatant. Non-reducing SDS-PAGE electrophoresis was used to detect the protein expression levels at different induction times. After fermentation was completed, the fermentation supernatant was purified and the protein concentration was measured. The specific method is described above. After the inducing fermentation, the fermentation supernatant was purified and the protein concentrations were determined using the Bradford method17.
Statistical analysis
All measurements were conducted in triplicate, and the data were analyzed using IBM SPSS Statistics 24. The results are presented as the mean ± standard deviation (SD), with statistical significance determined by a p-value < 0.05.
Results
Construction of expression strains with different gene dosages and analysis of single-cell spectral characteristic peaks
After culturing individual clone strains on YPDZ plates with different concentrations of Zeocin (200, 400, 800, 1200 µg/mL), it was observed that the plates with higher antibiotic concentrations harbored fewer clones, demonstrating a negative correlation between the number of transformants and the dosage of antibiotics. Twelve clones were randomly selected from each plate and subjected to Raman spectroscopy to (Fig. 2) analyze their spectral characteristics.
In Raman mode, the fingerprint identification of individual yeast cells can provide rich information about their chemical composition25,29. Figure 2a depicts the average Raman spectra of yeast cells from different agar plates, revealing strong signals at 1447 cm− 1, 1658 cm− 1, and 2929–2943 cm− 1 across the Raman spectra of various antibiotic groups. These peaks can serve as distinctive Raman spectra for positive transformants (Fig. 2a). Among them, the peak at 1658 cm− 1 corresponds to the amide I vibration peak in proteins, aiding in protein identification. The band at 1447 cm− 1 is attributed to CH2 bending vibrations arising from a combination of proteins and lipids, while the prominent peak at 2929 cm− 1 represents a superposition of symmetric CH2 vibrations and anti-symmetric CH3 vibrations originating from lipids, proteins, and carbohydrates25,31. Figure 2b displays similar waveforms in the Raman spectra of twelve clones on the Z-800 agar plate. Among these, the clone (5#) exhibits more intense characteristic peaks, which were identified through peak searching and deconvolution analysis as illustrated in Figs. 2c, d.

Raman spectroscopy analysis. (a) Utilization of Raman spectroscopy to analyze the distinctive peaks of yeast subjected to varying antibiotic pressures, (b) Raman spectroscopy analysis of 12 monoclonal clones of Z-800 group, with clone 5# exhibiting higher peak values for characteristic peaks, (c-d) Raman spectra and fingerprint peaks of Z-800 (#5).
Experimental verification of Raman spectroscopy for clone analysis
Four clones (GS115/pPICZ-gel6) with distinctive peaks were selected from each plate. These positive clones were preliminarily screened on 24-well plates, and the supernatant from a 48-hour fermentation induction was detected (Fig. 3). All 20 clones tested demonstrated expression, with differences in expression levels among the different antibiotic dosage groups (Fig. 3). Across all strains, a positive correlation was evident between expression levels and antibiotic concentration, while yeast strains exposed to an antibiotic concentration of 1,200 µg/mL exhibited lower expression levels. Further analysis of gene copy numbers is required to determine whether the difference in expression levels is attributed to varying gene dosages.

Western blot analysis and SDS-PAGE electrophoresis. (a) and (b) Western blot analysis of recombinant yeast products under different Zeocin stress conditions, (c) and (d) SDS-PAGE analysis of recombinant yeast products under different Zeocin stress conditions. M: protein marker, control: GS115/pPICZα-gel6, 4#, +: purified recombinant gelatin (stored in the laboratory), -: Negative control (non-reductive).
Copy number of gel6 gene in Recombinant strains
Real-time quantitative PCR (qPCR) was employed to detect the four groups of clones validated in the aforementioned experiments, analyzing whether differences in expression levels between different groups were attributed to the variations in gene dosage, with the original strain serving as a control. The result displays the amplification curves for gel6 plasmid standards and samples (Additional file1: Fig. S1). Based on the amplification curve of the gel6 plasmid standard, a standard curve for the gel6 gene was prepared, with the equation y=-3.471x + 38.797 (R2 = 0.993) (Additional file1: Fig. S1a). Utilizing this standard curve, the copy numbers of the gel6 gene were calculated based on sample concentration and amplification cycle numbers, as shown in Fig. S1 and Table 2. The reaction efficiency or primer amplification efficiency (E) was calculated with the formula E = 10(−1/slope)-1, yielding a value of 94.08%. This indicates that the amplification reaction is efficient, enabling the accurate calculation of copy numbers of the gel6 gene in the tested strains using this standard curve.
The copy numbers of gel6 in the genomes of the tested strains are presented in Table 2. The results indicated that, in the group exposed to an antibiotic concentration of 1,200 µg/mL, the gel6 gene content in the strain was 6.29 × 10³/DNA (ng), marking a 1.44-fold increase compared to the control group. Subsequently, in the groups with antibiotic concentrations of 800 µg/mL and 400 µg/mL, the gel6 gene quantities were found to be 6.01 × 10³/DNA (ng) and 5.66 × 10³/DNA (ng), respectively, representing 1.37-fold and 1.29-fold increase over the control group. However, no significant difference was found in the quantity of gel6 genes between the group exposed to a concentration of 200 µg/mL and the blank control group (original strain). These results suggest that antibiotic pressure do increase the dosage of target genes in strains significantly, with the maximum dosage of target genes per ng DNA reaching up to 1.44 times the original level.
Effect of gene dose on protein expression
From the validated five groups of clones, one strain was randomly selected from each group for shake flask fermentation. The resulting protein was then purified with an AKTA protein purification system, and the concentration of the purified protein was determined through the Bradford method. The primary objective was to assess the impact of gene copy number on protein expression, with the results shown in Table 3; Fig. 4. The protein expression levels of various strains could be calculated based on the measured concentration of purified hlrGEL6 protein and the elution solution volume (Table 3). The experimental results demonstrated varying degrees of increase in protein expression levels among the four experimental yeast strains. Among them, the Z-800 strain exhibited a protein expression level of 0.36 mg/mL, which is 6.25 times higher than that of the control group (GS115/pPICZα-gel6, 4# clone). Following this, the Z-400 strain showed a protein expression level of 0.31 mg/mL, which is a 5.51-fold increase over the control group but falling short of the Z-800 strain. Although the Z-1200 strain had the highest target gene dosage, its expression level was only 0.19 mg/mL, marking a 3.34-fold increase compared to the control group and failing to show a significant dose-dependency.
The aforementioned results indicate that the expression of hlrGEL6 increased with the rise in gene dosage within a certain gene dose range (copy number not more than 6 × 10³/DNA (ng)), which showed a positive effect (0.06, 0.21, 0.31, 0.36 mg/mL). Once 6 × 10³/DNA (ng) was exceeded, the expression level of hlrGEL6 in the strain decreased dramatically (0.19 mg/mL). These findings were consistent with the results of purified protein expression levels determined by SDS-PAGE in strains with varying copy numbers in previous studies (Fig. 4)27.
Figure 4 showed the SDS-PAGE results of these five purified samples, in which the protein sample from the original strain was used as a blank control, and a positive control was incorporated for semiquantitative analysis. As illustrated in Fig. 5, a specific protein band appeared between 43 and 55 kDa in all sample groups excluding the negative control. In a prior study, the purified samples were subjected to matrix assisted laser desorption ionization time of flight mass spectrometer (MALDI-TOF-MS), revealing a precise molecular weight of 36.46 kDa, presumed to be a recombinant gelatin monomer with an ionic charge, which was consistent with its theoretical molecular weight (36.49 kDa)17. The discernible discrepancy between the apparent and actual molecular weight of hlrGEL6 can be attributed to the Gly-X-Y composition in gelatin. According to previous studies of protein expression, such a difference is prevalent, with the apparent molecular weight often exceeding the theoretical weight32.

SDS-PAGE electrophoresis. Employment of SDS-PAGE to detect yeast expression with varying copy numbers (purified samples). M: protein marker, -: Negative control (non-reductive).
High-density fermentation of high-expression strains
A typical fermentation curve is shown in Fig. 5a, encompassing the phases of batch culture, glycerol feed, and methanol induction. In the batch culture phase, yeast seeds were cultivated in BMGY medium (pH 6.0) containing 4% glycerol at 28 °C for 17 ~ 18 h. Once the wet cell weight (WCW) reached 165 g/L, glycerol supplementation commenced. In the glycerol feeding phase, 50% glycerol (containing 12 mL/LPTM1 solution) was introduced, with dissolved oxygen maintained at 30% and temperature kept at 28 °C. When WCW reached approximately (186 ± 2) g/L, the glycerol supplementation ceased. A sharp increase in dissolved oxygen signaled the initiation of the methanol supplementation for induction. The methanol inducing phase was conducted in three stages, with different methanol supplement rates of 3.6, 7.2 and 10.8 mL/(L·h), while dissolved oxygen was maintained at 30% (Fig. 5a). During the methanol induction phase, the expression level of hlrGEL6 gradually increased with the prolongation of the induction time (Fig. 5b, c). The highest yield was reached after 48 h of induction, which was approximately 0.9 mg/mL (Fig. 5b). The fermentation broth after 48 h of induction was purified, and up to 4.62 g of purified protein could be obtained. Through calculation, the expression level of this strain was estimated to be 0.716 g/L.

Analysis of high-density fermentation. (a) Process parameters for high-density fermentation of GS115/pPICZα-gel6-Z800, (b) The relationship between the wet weight of yeast and the protein expression level under different induction durations, (c) SDS-PAGE was used to detect the unpurified proteins at different time points.
Discussion
K. phaffii as a host for heterologous protein expression, boasts outstanding advantages, such as a powerful and controllable AOX1 promoter, high expression levels, stable genetic characteristics, and a simple culture medium composition. It has successfully expressed an array of proteins including collagen15,20,33. However, despite being a well-established heterologous protein expression system, there are still limitations. The main issue is that not all proteins of interest can be recombinantly expressed using K. phaffii; even if expressed, the expression levels need to be improved. In the early stage of this study, the original strain constructed by K. phaffii expression system had a maximum expression level of 0.057 g/L at the shake flask fermentation level, which did not meet the requirements of industrial fermentation. Therefore, it is urgent to improve its expression level to lay the foundation for its development as a biomedical material34.
The optimization strategies for improving the expression of exogenous proteins in K. phaffii encompass six aspects: gene-level regulation, transcriptional control, translational enhancement, protein folding and secretion improvement, stress resistance enhancement, and fermentation process optimization32,35. Among them, increasing the gene copy number is a commonly employed approach to enhance exogenous protein expression36. High-copy integration of target genes can be achieved through multiple-copy expression vectors or resistant screening. So far, two primary methods have been employed for constructing high-copy target genes in K. phaffii: extracellular approaches and intracellular. The former involves constructing a single vector with multiple copies through in vitro ligation, yielding recombinant DNA molecules with multiple copies37. In this study, Song et al. successfully constructed vectors carrying 1, 3, 6, and 8 copies of the transglutaminase gene and achieved functional expression of transglutaminase in K. phaffii38. While this method is easy to perform, obtaining vectors with more than 10 copies is challenging due to vector size constraints37 .
The intracellular construction method is detected by selecting vector genetic markers and combining with drug resistance screening (such as Zeocin and G418) to enrich strains with an increased copy number of the vector. Usually, the method of post-transformation vector amplification (PTVA) is adopted to gradually screen out target genes with a high copy number21. Although the PTVA method is widely used in K. phaffii research due to its advantages of simple operation and high success rate, it still has the limitation of high cost21.
Through the development of a method that utilizes the single-cell spectral characteristics of yeast for rapid screening of positive transformants, it was effective to solve the high cost and time-consuming issues associated with using PTVA method for screening high-copy target genes. Subsequently, traditional biological experiments were conducted for further refinement. Through these screenings, a transformed strain with higher expression of the hlrGEL6 gene is selected as the fermentation strain. The study reveals that on various resistance selection plates, yeast Raman spectra exhibit strong signals at 1447 cm− 1, 1658 cm− 1, and 2929 ~ 2943 cm− 1 (Fig. 2). Specifically, the spectrum at 1658 cm− 1 corresponds to the amide I vibration peak in proteins, while the one at 1447 cm− 1 arises from the combined action of protein and fatty acid CH2 bending vibrations. The strongest band at 2929 cm− 1 is caused by the superposition of symmetric CH2 vibrations and antisymmetric CH3 vibrations in lipids, proteins, and carbohydrates39. The target gene copy numbers were determined through fluorescence quantification analysis of four groups of transformants (Table 2). The Z-1200 group strain exhibited the highest target gene copy number, but its expression level (0.19 mg/mL) was only 3.34 times that of the control group (0.057 mg/mL), indicating no significant dose-dependency relationship (Table 3). Conversely, although the Z-800 group strain had a lower gene copy number than the Z-1200 group strain, it exhibited a higher protein expression level (0.36 mg/mL), which was 6.25 times that of the control group (Table 3). These findings are consistent with our project team’s previous related studies27.
Finally, high-density fermentation was performed on the Z-800 (3# clone) strain under controlled conditions (Fig. 5). After a 72 h fermentation period, the yield of the purified protein reached a maximum of 4.62 g, and the highest protein expression level was 0.72 mg/mL, which was 12.6 times that of the original strain. The findings from this research indicate the importance of strictly regulating pH, temperature, dissolved oxygen, and methanol supply to increase the yield of hlrGEL6 during high-density fermentation40,41. The expression level of Z-800 (3# clone) is slightly lower than that of extracellularly secreted recombinant type III human-like collagen in the K. phaffii system reported in the latest literature (1.05 g/L)15.
Conclusions
To sum up, by combining the SCLRS technology with the improved PTVA method, theoretically, at least two rounds of biological experiment screenings can be reduced, thereby efficiently obtaining the high-expression strain Z-800 (3# clone). Further high-density fermentation of this strain was carried out, and its protein expression level could reach up to 0.72 mg/mL at most, which was 12.6 times higher than that of the original strain. Compared with the traditional method that completely relies on biological experiments to screen positive transformants, the SCLRS technology does not require complex pretreatment of samples. It has the advantages of a small amount of detected samples and simple operation, and can realize the rapid detection of recombinant proteins in individual yeast cells. It is an innovative and efficient detection method and is suitable for the analysis of recombinant protein expression in yeast cells. The next research plan will focus on the Z-800 (3# clone) strain, further increase the yield of hlrGEL6 by optimizing the fermentation conditions, and obtain more purified hlrGEL6 to deeply explore its application potential in three-dimensional cell culture, and evaluate its actual value as a potential biomedical material.
Data availability
Sequence data that support the findings of this study have been deposited in the NCBI with the primary accession code OR365074.1. Data is provided within the manuscript or supplementary information files. The datasets generated and/or analyzed during the current study are available in the NCBI repository, https://www.ncbi.nlm.nih.gov/nuccore/OR365074.1?report=genbank.
References
-
Wei, B. et al. Gelatin methacrylate hydrogel scaffold carrying resveratrol-loaded solid lipid nanoparticles for enhancement of osteogenic differentiation of BMSCs and effective bone regeneration. Regenerative Biomaterials. 8 (5), rbab044. https://doi.org/10.1093/rb/rbab044 (2021).
-
Sabzi, E., Abbasi, F. & Ghaleh, H. Interconnected porous nanofibrous gelatin scaffolds prepared via a combined thermally induced phase separation/particulate leaching method. J. Biomat Sci. 31 (4), 488–503. https://doi.org/10.1080/09205063.2020.1845921 (2020).
-
Yang, L., Wu, H., Lu, L., He, Q. & Zhang, X. A tailored extracellular matrix (ECM) – Mimetic coating for cardiovascular stents by Stepwise assembly of hyaluronic acid and Recombinant human type III collagen. Biomaterials 2, 121055. https://doi.org/10.1016/j.biomaterials.2021.121055 (2021).
-
Zhang, F., Hu, C., Yang, L., Liu, K. & Wang, Y. A conformally adapted all-in-one hydrogel coating:towards robust hemocompatibility and bactericidal activity. J. Mater. Chem. B. 9, 11. https://doi.org/10.1039/D1TB00021G (2021).
-
Gu, Y. et al. Delivery of FGF10 by implantable porous gelatin microspheres for treatment of spinal cord injury. Mol. Med. Rep. 28 (1), 137–146. https://doi.org/10.3892/mmr.2023.13024 (2023).
-
Wu, L. et al. Regulation of macrophage subtype via injectable micro/nano-structured porous microsphere for reprogramming osteoimmune microenvironment. Chem. Eng. J. 439, 135692. https://doi.org/10.1016/j.cej.2022.135692 (2022).
-
Gao, Y. et al. Emulsion template fabrication of antibacterial Gelatin-Based scaffolds with a preferred microstructure for accelerated wound healing. ACS Appl. Polym. Mater. 4 (5), 3885–3895. https://doi.org/10.1021/acsapm.2c00350 (2022).
-
Hou, Z. et al. Preparation and characterization of Recombinant human-source collagen. Chin. J. Biotech. 35 (2), 319–326. https://doi.org/10.13345/j.cjb.180266 (2019).
-
Won, Y. W. & Kim, Y. H. Preparation and cytotoxicity comparison of type a gelatin nanoparticles with Recombinant human gelatin nanoparticles. Macromol. Res. 17 (7), 464–468. https://doi.org/10.1007/BF03218893 (2009).
-
Acar, M. et al. Affinity-based and in a single step purification of Recombinant horseradish peroxidase A2A isoenzyme produced bypichia pastoris. ; 46 (4), 523–534. https://doi.org/10.1007/s00449-022-02837-2 (2022).
-
Acar, M. & Unver, Y. J. B. Constitutive and extracellular expression of pectin methylesterase from pectobacterium chrysanthemi in Pichia pastoris. 3 Biotech. 12 (9), 219. https://doi.org/10.1007/s13205-022-03291-3 (2022).
-
Unver, Y., Ari, B., Acar, M. & Arslan, S. Y. J. B. A self-inducible heterologous protein expression system in Komagataella phaffii(Pichia pastoris). 3 Biotech. 14, 9. https://doi.org/10.1007/s13205-024-04039-x (2024).
-
Venkateswarlu, K. et al. Three–dimensional imaging and quantification of real-time cytosolic calcium oscillations in microglial cells cultured on electrospun matrices using laser scanning confocal microscopy. Biotech. Bioeng. 117 (10), 3108–3123. https://doi.org/10.1002/bit.27465 (2020).
-
Vijayakumar, V. E. & Venkataraman, K. A systematic review of the potential of Pichia pastoris (Komagataella phaffii) as an alternative host for biologics production. Mol. Biotechnol. 66, 7. https://doi.org/10.1007/s12033-023-00803-1 (2024).
-
Xiang, Z. X. et al. High-efficiency secretory expression and characterization of the Recombinant type III human-like collagen in Pichia pastoris. BIOB 9, 117–130. https://doi.org/10.1186/s40643-022-00605-4 (2022).
-
Byrne, B. Biology. Pichia pastoris as an expression host for membrane protein structural biology. Curr. Opin. Struct. Biol. 32, 9–17. https://doi.org/10.1016/j.sbi.2015.01.005 (2015).
-
Song, X., Chu, T., Shi, W. & He, J. J. B. Bioprocessing. Expression, characterization, and application of human-like Recombinant gelatin. BIOB 11 (1), 1–13. https://doi.org/10.1186/s40643-024-00785-1 (2024).
-
Song, X., Shao, C., Guo, Y., Wang, Y. & Cai, J. Improved the expression level of active transglutaminase by directional increasing copy of Mtg gene in Pichia pastoris. BMC Biotech. 19, 54. https://doi.org/10.1186/S12896-019-0542-6 (2019).
-
Watts, A., Sankaranarayanan, S., Watts, A. & Raipuria, R. K. Optimizing protein expression in heterologous system: strategies and tools. Meta Gene. 29 (11), 100899. https://doi.org/10.1016/j.mgene.2021.100899 (2021).
-
Zhou, J. L., Liu, Q. & Yan, W. New insight into the method of posttransformational vector amplification (PTVA) in Pichia pastoris. J. Microbiol. Meth. 151, 2563. https://doi.org/10.1016/j.mimet.2018.04.013 (2018).
-
Xie, C. & Li, Y. Q. Confocal micro-Raman spectroscopy of single biological cells using optical trapping and shifted excitation difference techniques. J. Appl. Phys. 93 (5), 2982–2986. https://doi.org/10.1063/1.1542654 (2003).
-
Novelli-Rousseau, A. et al. Culture-free Antibiotic-susceptibility determination from Single-bacterium Raman spectra. Sci. Rep. 8 (1), 3957. https://doi.org/10.1038/s41598-018-22392-9 (2018).
-
Chan, J. W. et al. Monitoring dynamic protein expression in living E. coli. Bacterial cells by laser tweezers Raman spectroscopy. Cytometry Part. A. 71A (7), 468–474. https://doi.org/10.1002/cyto.a.20407 (2010).
-
Xie, C., Nguyen, N., Zhu, Y. & Li, Y. Q. Detection of the Recombinant proteins in single Transgenic microbial cell using laser tweezers and Raman spectroscopy. 79 (24), 9269–9275. https://doi.org/10.1021/ac0710329 (2007).
-
Kochan, K., Peng, H., Wood, B. R. & Haritos, V. Single cell assessment of yeast metabolic engineering for enhanced lipid production using Raman and AFM-IR imaging. Biotechnol. Biofuels. 11 (1), 106. https://doi.org/10.1186/s13068-018-1108-x (2018).
-
Yang, Z. & Zhang, Z. J. B. Engineering strategies for enhanced production of protein and bio-products in Pichia pastoris. Rev. 36 (1), 182–195. https://doi.org/10.1016/j.biotechadv.2017.11.002 (2017).
-
Song, X. et al. Impact of gene dosage on Recombinant transglutaminase production of Pichia pastoris. Chin. J. Biotechnol. 36 (8), 1679–1688. https://doi.org/10.13345/j.cjb.190531 (2020).
-
Kumar, A. M. & Sarma, J. Modified chemical method for efficient transformation and diagnosis in Pichia pastoris. Protein Expres Purif. 174 (1), 105685. https://doi.org/10.1016/j.pep.2020.105685 (2020).
-
Dagci, I. et al. Machine learning-assisted Sers reveals the biochemical signature of enhanced protein secretion from surface-modified magnetic nanoparticles. 16(51), 70392–70406. https://doi.org/10.1021/acsami.4c18591 (2024).
-
Guo, Y. et al. Balancing the expression and production of a heterodimeric protein: recombinant Agkisacutacin as a novel antithrombotic drug candidate. Rep 5, 11730. https://doi.org/10.1038/srep11730 (2015).
-
Wang, K., Jiang, J. C., Xu, J., Feng, J. F. & Wang, J. X. Effective saccharification of holocellulose over multifunctional sulfonated Char with fused ring structures under microwave irradiation. RSC Adv. 6 (17), 14164–14170. https://doi.org/10.1039/C5RA28113 (2016).
-
Edgar, V. et al. Is heterogeneity in large-scale bioreactors a real problem in Recombinant protein synthesis by Pichia pastoris? Appl. Microbiol. Biot. 107 (7–8), 2223–2233. https://doi.org/10.1007/s00253-023-12434-2 (2023).
-
Xie, J. & Fan, D. A high-toughness and high cell adhesion Polyvinyl alcohol(PVA-hyaluronic acid (HA)-human-like collagen (HLC) composite hydrogel for cartilage repair. Int. J. Polym. Mater. 69, 10a14. https://doi.org/10.1080/00914037.2019.1631824 (2020).
-
Xiao, F. et al. Establishing Komagataella phaffii as a cell factory for efficient production of cholesterol sulfate. ACS Sustainable Chem. Eng. 13 (1), 174–186. https://doi.org/10.1021/acssuschemeng.4c06112 (2025).
-
Liu, C. et al. Increasing gene dosage and chaperones co-expression facilitate the efficient dextranase expression in Pichia pastoris. LWT 2023, 181. https://doi.org/10.1016/j.lwt.2023.114753 (2023).
-
Erden-Karaoglan, F. & Karaoglan, M. Improvement of Recombinant L-Asparaginase production in Pichia pastoris. 3 Biotech. 13, 5. https://doi.org/10.1007/s13205-023-03600-4 (2023).
-
Mombeni, M. et al. pMOX: a new powerful promoter for Recombinant protein production in yeast Pichia pastoris. Enzyme Microb. Tech. 139, 109582. https://doi.org/10.1016/j.enzmictec (2020).
-
Jay, S. A., Ilya, T. & Cregg, J. M. Posttransformational vector amplification in the yeast Pichi a pastoris.FEMS. Yeast Res. (6), 6. https://doi.org/10.1111/j.1567-1364.2008.00410.x (2010).
-
Wang, N., Ren, K., Jia, R., Chen, W. & Sun, R. R. Expression of a fungal manganese peroxidase in Escherichia coli: a comparison between the soluble and refolded enzymes. BMC Biotech. 16 (1), 87. https://doi.org/10.1186/s12896-016-0317-2 (2016).
-
Maresová, H., Marková, Z., Valesová, R., Sklenár, J. & Biotechnology, P. K. Heterologous expression of leader-less Pga gene in Pichia pastoris: intracellular production of prokaryotic enzyme. BMC Biotechnol. BMC Biotech. 10 (1), 7. https://doi.org/10.1186/1472-6750-10-7 (2010).
-
Boojari, M. A., Rajabighaledari, F., Motamedian, E., Soleimani, M. & Shojaosadati, S. Developing a metabolic model-based fed‐batch feeding strategy for Pichia pastoris fermentation through fine‐tuning of the methanol utilization pathway. Microb. Biotechnol. 16, 6. https://doi.org/10.1111/1751-7915.14264 (2023).
Acknowledgements
The authors are especially grateful to Professor Lijun Wu of Anhui University for the support of SCLRS. The authors thank Teacher Yilin Lu of Anhui University for valuable help in SCLRS.
Ethics declarations
Competing interests
The authors declare no competing interests.
Additional information
Publisher’s note
Springer Nature remains neutral with regard to jurisdictional claims in published maps and institutional affiliations.
Supplementary Information
Rights and permissions
Open Access This article is licensed under a Creative Commons Attribution-NonCommercial-NoDerivatives 4.0 International License, which permits any non-commercial use, sharing, distribution and reproduction in any medium or format, as long as you give appropriate credit to the original author(s) and the source, provide a link to the Creative Commons licence, and indicate if you modified the licensed material. You do not have permission under this licence to share adapted material derived from this article or parts of it. The images or other third party material in this article are included in the article’s Creative Commons licence, unless indicated otherwise in a credit line to the material. If material is not included in the article’s Creative Commons licence and your intended use is not permitted by statutory regulation or exceeds the permitted use, you will need to obtain permission directly from the copyright holder. To view a copy of this licence, visit http://creativecommons.org/licenses/by-nc-nd/4.0/.
About this article

Cite this article
Song, X., Wang, Y., Kan, K. et al. Efficient extracellular expression and rapid screening of human-like recombinant gelatin in Komagataella phaffii. Sci Rep 15, 30251 (2025). https://doi.org/10.1038/s41598-025-14855-7
-
Received:
-
Accepted:
-
Published:
-
DOI: https://doi.org/10.1038/s41598-025-14855-7