- Research
- Open access
- Published:
Biotechnology for Biofuels and Bioproducts volume 18, Article number: 72 (2025) Cite this article
Abstract
Background
As outlined by the Intergovernmental Panel on Climate Change, we need to approach global net zero CO2 emissions by approximately 2050 to prevent warming beyond 1.5 °C and the associated environmental tipping points. Future microbial electrosynthesis (MES) systems could decrease net CO2 emissions by capturing it from industrial sources. MES is a process where electroactive microorganisms convert the carbon from CO2 and reduction power from a cathode into reduced organic compounds. However, no MES system has attained an efficiency compatible with a financially feasible scale-up. To improve MES efficiency, we need to consider the energetic constraints of extracellular electron uptake (EEU) from an electrode to cytoplasmic electron carriers like NAD+. In many microbes, EEU to the cytoplasm must pass through the respiratory quinone pool (Q-pool). However, electron transfer from the Q-pool to cytoplasmic NAD+ is thermodynamically unfavorable. Here, we model the thermodynamic barrier for Q-pool dependent EEU using the well-characterized bidirectional electron transfer pathway of Shewanella oneidensis, which has NADH dehydrogenases that are energetically coupled to proton-motive force (PMF), sodium-motive force (SMF), or uncoupled. We also tested our hypothesis that Q-pool dependent EEU to NAD+ is ion-motive force (IMF)-limited in S. oneidensis expressing butanediol dehydrogenase (Bdh), a heterologous NADH-dependent enzyme. We assessed membrane potential changes in S. oneidensis + Bdh on a cathode at the single-cell level pre to post injection with acetoin, the substrate of Bdh.
Results
We modeled the Gibbs free energy change for electron transfer from respiratory quinones to NADH under conditions reflecting changes in membrane potential, pH, reactant to product ratio, and energetically coupled IMF. Of the 40 conditions modeled for each method of energetic coupling (PMF, SMF, and uncoupled), none were thermodynamically favorable without PMF or SMF. We also found that membrane potential decreased upon initiation of EEU to NAD+ for S. oneidensis on a cathode.
Conclusions
Our results suggest that Q-pool-dependent EEU is both IMF-dependent and is IMF-limited in a proof-of-concept system. Because microbes that rely on Q-pool-dependent EEU are among the most genetically tractable and metabolically flexible options for MES systems, it is important that we account for this thermodynamic bottleneck in future MES platform designs.
Introduction
The Intergovernmental Panel on Climate Change’s Special Report: Global Warming of 1.5 °C estimates that global temperatures will reach 1.5 °C above their pre-industrial level between the years 2030 and 2052 with present warming rates [1]. To avoid reaching 1.5 °C warming and future environmental tipping points, we need to decrease net greenhouse gas emissions, particularly CO2 [1].One option for decreasing net CO2 emission involves harnessing biological carbon-fixing reactions to convert inorganic carbon (e.g., CO2) into organic carbon molecules. Some microorganisms can perform electrode-driven carbon fixation in a process called microbial electrosynthesis (MES). During MES, carbon from CO2 is covalently bonded into organic carbon molecules with reducing power from an extracellular electrode [2,3,4,5]. On an industrial scale, MES systems could decrease net greenhouse gas emissions by recycling CO2 waste into organic carbon products at major emission sources [6, 7].
Organisms suitable for industrial-scale MES span many genera; however, a pervasive issue, even at small scales, is low current density (electrons/time/electrode area), which remains far below what will be required for industrial scale-up [2, 7, 8]. Certain autotrophic species, such as the chemoautotrophs Acetobacterium woodii and Sporomusa ovata, and the photoautotroph Rhodopseudomonas palustris, can perform MES, where electron flow from a cathode, a negatively poised electrode, provides the reducing power required for carbon fixing reactions in a bioelectrochemical system (BES) [9,10,11,12]. To date, the highest current density magnitude reported for a pure culture MES system was − 17.5 mA∙cm−2, using A. woodii [2, 13]. However, MES current density magnitudes produced by wildtype autotrophic species remain incompatible with industrial scale-up [14]. MES systems can involve either mixed (multiple species) or pure cultures (a single species), both of which offer benefits and drawbacks. While mixed cultures can offer greater current density magnitudes, here we will focus on pure cultures to better pinpoint EEU bottlenecks [15].
MES requires electron flow from a negatively poised electrode (cathode) to bacteria. However, the natural direction for most species, from bacteria to positively poised electrode (anode), has been more extensively studied. Bacteria able to reduce an anode, such as metal-reducing bacteria, have the metabolic flexibility and sufficiently robust electron transport pathways to respire via an extracellular terminal electron acceptor [16]. The metal-reducing bacterium Geobacter sulfurreducens is an apt example of the magnitude of the anodic current density that can be achieved in a BES with a thick, electrically connected biofilm (~ 0.9 mA cm−2) [17]. However, to reach economic viability given present material and electricity costs Jourdin et al. (2020) estimated, in their techno-economic assessment of CO2-fed MES, that MES systems will require a current density magnitude of − 50 to − 100 mA cm−2 [7, 8, 14]. Recent work with Shewanella oneidensis, another metal-reducing bacterium, suggests that substantial improvements to current density may be possible without a thick electroactive biofilm; Zhang et al. [18] showed that in a microbial flow fuel cell with artificial redox mediators, S. oneidensis was able to produce current densities exceeding 40 mA·cm−2 [18]. While still an emerging approach, it is likely that a combination of improvements to BESs, either through structure or biological engineering could make MES systems financially feasible methods of reducing net carbon emissions. However, even if microbial current densities reliably reached tens of mA·cm−2, the issue of EEU for MES remains [14].
Metal-reducing bacteria have yet to mirror their anodic current density magnitudes on a cathode; to resolve this discrepancy, we must first understand which steps limit EEU. S. oneidensis has the most thoroughly characterized electron transport pathway of all metal reducers, the Mtr pathway [19,20,21,22,23,24]. Because S. oneidensis’ Mtr pathway is well-understood and bidirectional, it is an excellent system to study and improve EEU in metal-reducing bacteria. During EEU, an organism directs electron flow through pathways tied to its energy conservation strategy [25]. For example, ion-motive force (IMF) drives ion-gradient phosphorylation, allowing organisms to conserve energy by coupling exergonic redox reactions to endergonic ion translocations [10, 26,27,28,29,30,31,32]. These exergonic redox reactions from catabolism to final electron acceptor(s) also define the routes available for EEU.
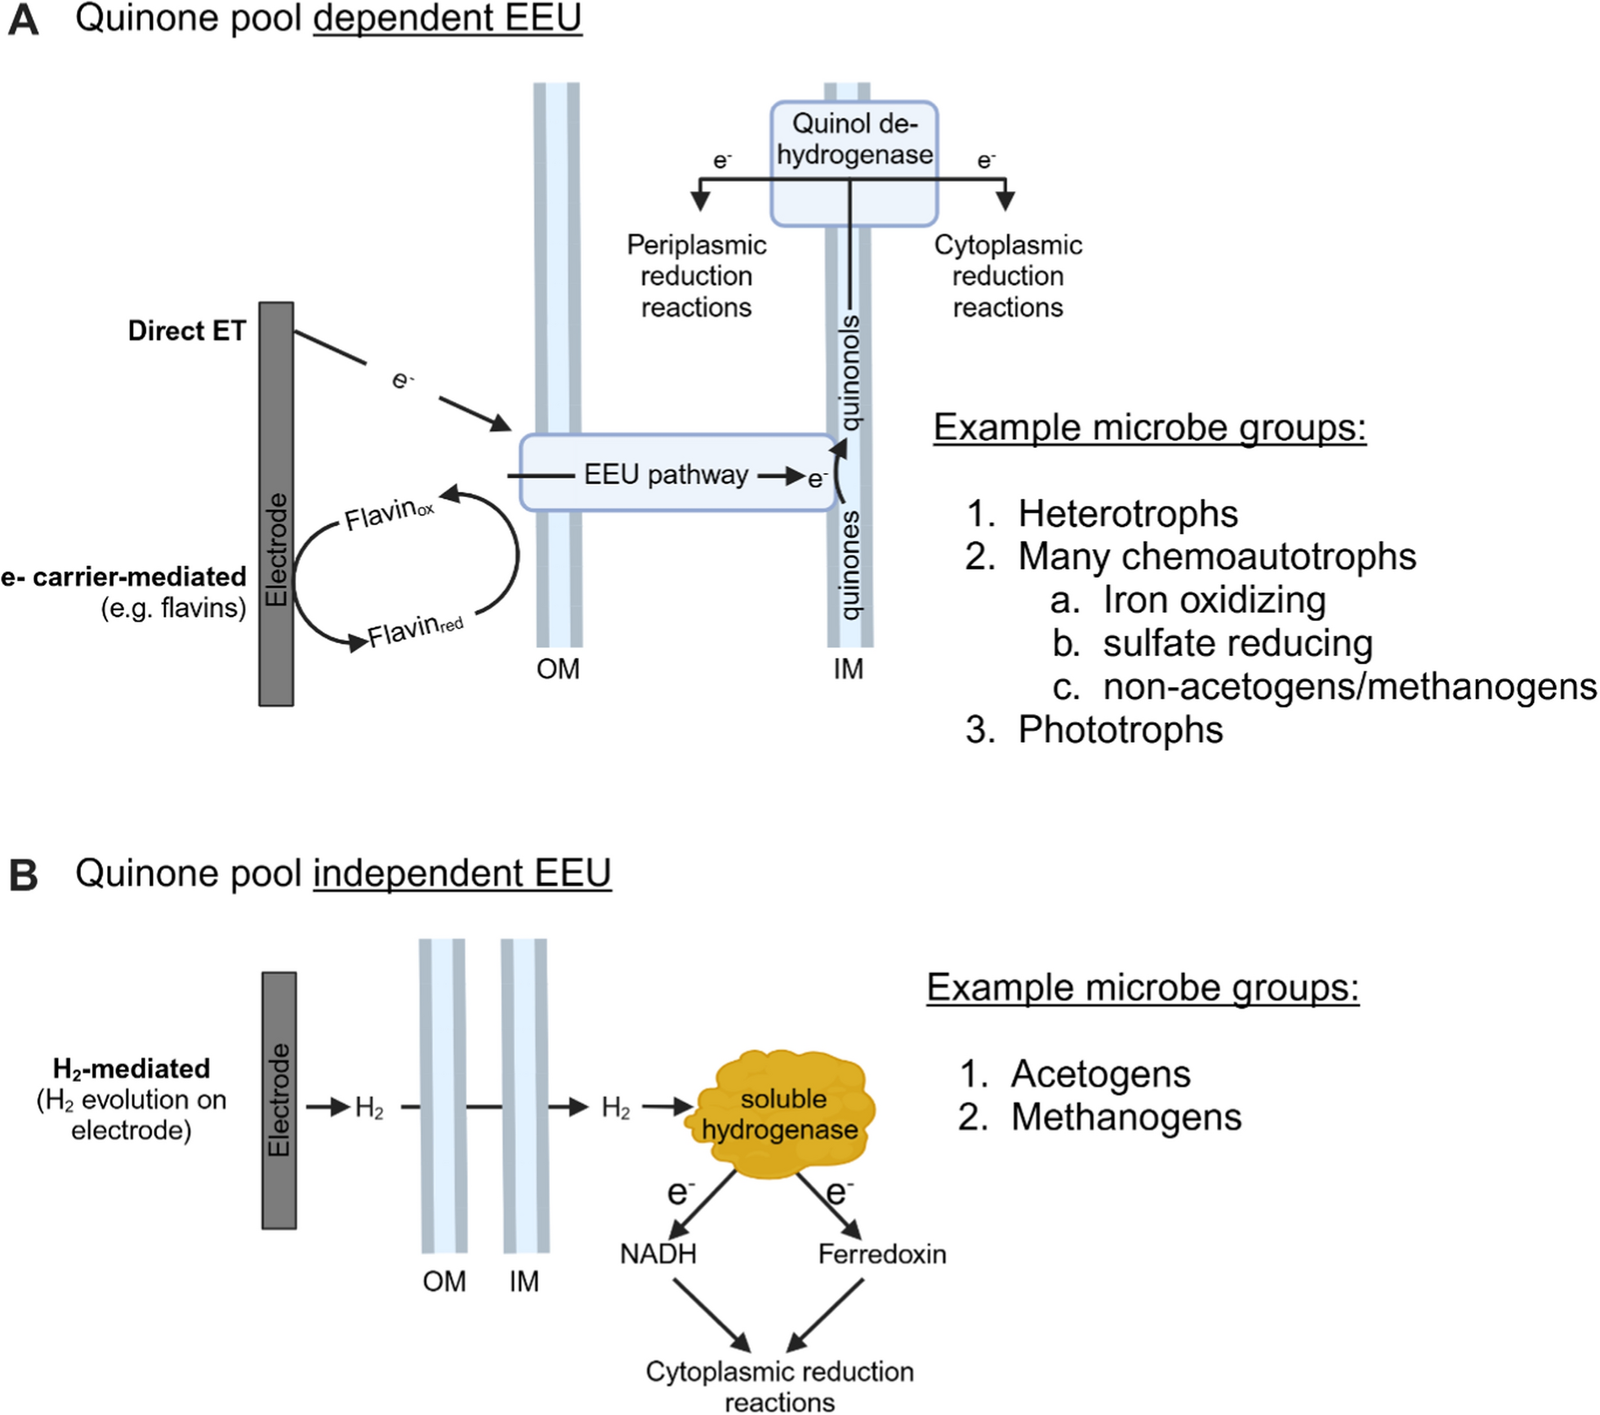
EEU occurs either through a series of conductive proteins in the cell membrane or via small molecules that can diffuse across lipid membranes, such as H2 (Fig. 1A) [10,11,12, 33]. H2-mediated EEU in acetogens and methanogens relies on H2 diffusion to soluble cytoplasmic hydrogenases, allowing electrons to bypass the cell membrane and enter the cytoplasm via H2 (Fig. 1B) [10, 11, 34, 35]. However, in non-diffusive EEU electrons must cross lipid membranes through membrane-integrated proteins and quinones (lipid-soluble redox-active molecules) [36, 37]. Microbial respiratory chains can flexibly combine quinone reductases and quinol oxidases, but each combination shares the intermediate location, the quinone pool (Q-pool) [12, 36,37,38,39,40,41]. While either method of extracellular electron transfer, Q-pool dependent or independent, could enable MES systems to reach economically viable current densities, their advantages and energetic constraints are distinct. We will focus on EEU that is Q-pool dependent, as this encompasses a wide range of genetically tractable microorganisms (Fig. 1).

A Extracellular electron uptake (EEU) through the respiratory quinone pool (Q-pool). B EEU that bypasses the Q-pool via H2 diffusion to soluble cytoplasmic hydrogenases. Note that these examples assume either a wildtype or engineered organism capable of EEU to the cytoplasm. Many species in these categories will not be capable of EEU in their wildtype form
As discussed above, an organism’s electron transport chain is closely tied to its means of energy conservation. While some steps of the respiratory electron transport chain are freely reversible (ΔG ~ 0), the redox reactions that are coupled to IMF generation must be thermodynamically favorable (ΔG < < 0), and far from equilibrium. Note that ‘freely reversible’ commonly refers to Gibbs free energy changes within ± 6 to 10 kJ·mol−1 [42, 43]. The thermodynamically favorable direction for electrons to flow is from a lower to higher reduction potential [26]. Ion-translocating NADH dehydrogenases are among the enzymes that couple electron transfers from low potential electron donors like NADH to reduce the Q-pool. Q-pool dependent EEU requires a reverse of this step, resulting in a thermodynamically unfavorable (ΔG > > 0) electron transfer [44].
In this work, we address an example of the thermodynamically unfavorable electron transfer in S. oneidensis expressing butanediol dehydrogenase (Bdh), as previously described by members of our group [44]. Bdh is an NADH-dependent enzyme, non-native to S. oneidensis, that converts acetoin to 2,3-butanediol [44]. Figure 2B shows the free energy landscape for EEU in S. oneidensis + Bdh. For Steps 1–6 of EEU (Fig. 2), the free energy landscape favors EEU (net -ΔG). The ΔG available for Step 7 depends on the energy-coupling ability of the catalyzing NADH dehydrogenase. S. oneidensis has four NADH dehydrogenases, Nuo (H + -pumping), Nqr1 and Nqr2 (Na + -pumping), and Ndh (uncoupled) [45, 46]. When Step 7 occurs without energetic coupling, EEU is thermodynamically unfavorable in Step 7 (Fig. 2); however, when coupled with proton motive force (PMF) or sodium motive force (SMF), Step 7 shifts in the forward direction (as written) leaving the entire pathway thermodynamically favoring EEU (net –ΔG). To overcome the potential bottleneck in Step 7 that may limit Q-pool dependent MES, it is crucial that we identify the conditions under which this reaction becomes thermodynamically favorable for EEU. Q-pools contain multiple quinone species; however, we will assume menaquinone-7 (MQ)/menaquinol-7 (MQH2), because it is required for 85% of EEU in S. oneidensis [19, 21]. Menaquinone also has a lower redox potential than the other predominant quinone species, ubiquinone, and is, therefore, a better electron donor for NADH generation [47].

A EEU in S. oneidensis from an electrode to NAD+, where PMF is supplied by a proton-pumping terminal oxidase. The thermodynamically distinct paths of electron transfer to three differently coupled NADH dehydrogenases (Nuo, Nqr, and Ndh). B Free energy (ΔG) associated with each step of the pathway in (A). For Step 7, a negative free energy means that EEU across the quinone pool is thermodynamically favorable and a positive free energy means that EEU across the quinone pool to cytoplasmic NAD+ is thermodynamically unfavorable. MQ, menaquinone-7; MQH2, menaquinol-7; FMN, flavin mononucleotide; FMNH2, reduced flavin mononucleotide; STC, small tetraheme cytochrome; MtrABC, proteins of the Mtr pathway; Bdh, butanediol dehydrogenase; bc1, bc1 complex; e-, electron [68]

An example of our experimental setup and analysis for the microscopy-compatible bioelectrochemical system (BES). A Diagram of our BES, the design of which was based on Pirbadian et al. (2020). To minimize O2 changes in the BES during injection, the BES was connected to an anaerobic bottle containing a media reservoir and head space. On the right-hand side is a picture of our BES setup. The aluminum foil on the bottle was present to protect ThT in the media from photodegradation while N2 bubbled into the media bottle overnight. B For each timepoint, the background fluorescence was subtracted in ImageJ. Regions of interest (ROI) were defined for individual cells, or small groups of cells, that fit into the defined area of 0.25 to 20 µm2. For each timepoint of a biological replicate, the mean ThT intensity was the background-subtracted mean fluorescence intensity of the ROIs. Some cell drift out of the field of view (FOV) was uncontrollable, however, we strove to maintain the FOV for each biological replicate to keep the laser exposure time, and any resulting changes in membrane permiability to ThT, consistent for each timepoint
Given the free energy landscape for EEU in S. oneidensis + Bdh (Fig. 2), we expect NADH dehydrogenase activity to be thermodynamically favorable for EEU only when energetically coupled to IMF. To determine if IMF is thermodynamically required for EEU in S. oneidensis + Bdh, we calculated the multicompartment free energy for Step 7 under a range of biologically relevant conditions (variation in pH, reactant to product ratio, and membrane potential voltage). These ΔG calculations assume that Step 7 was catalyzed by either Nuo (4 H + per NADH), Nqr (2 Na+ per NADH), or Ndh (uncoupled, 0 ions per NADH). In this way, we determined whether Step 7 can be driven forward (–ΔG) by manipulating contextual variables (e.g., by increasing electrode potential to over-reduce the quinone pool) or if a source of energetically coupled IMF is thermodynamically required.
We expect that EEU in S. oneidensis is not only IMF-dependent but also IMF-limited under biologically relevant conditions. By comparing the current densities supported by different sections of the Mtr pathway, we can hypothesize the location of the rate-limiting step for EEU. Our previous work, Tefft and TerAvest [44] and Tefft et al. [48], used a comparable BES set up; we observed current density for EEU to fumarate (|− 8.7 µA∙cm−2|) that was approximately 14 times greater in magnitude than to cytoplasmic NAD+ (|− 0.62 µA∙cm−2|), where IMF was supplied by proteorhodopsin (PR), a light-dependent proton pump [44, 48]. Prior to exiting the Q-pool, both electron transfer pathways include the freely reversible free energy landscape depicted in Fig. 2, Steps 1–6. Note, that the term ‘free energy landscape’ refers to the sequential free energy changes along each step of the pathway, illustrating the relative thermodynamic barriers of the process [49]. The difference in thermodynamic favorability lies in the path through which electrons leave the Q-pool. Electron transfer from menaquinol to fumarate is catalyzed by fumarate reductase, a thermodynamically favorable reaction (ΔG°’ = − 11.9 ± 7.0 kJ∙mol−1) that does not depend on energetic coupling to IMF [50]. To determine if Q-pool dependent EEU is IMF limited, we used a fluorescence microscopy technique described by Pirbadian et al. [51]. Pirbadian et al. [51] showed that thioflavin T (ThT), a fluorescent cationic dye, can be used as a proxy for membrane potential in S. oneidensis imaged on a transparent electrode. As Fig. 2 illustrates, when acetoin (the substrate of Bdh) is present, S. oneidensis + Bdh has an NADH-dependent electron acceptor in the cytoplasm. From our previous work Ford and TerAvest [52], we know that even an ostensibly anaerobic BES with active nitrogen bubbling has ~ 1% dissolved oxygen; this is sufficient for the proton pumping terminal oxidase to supply the PMF needed to drive EEU to cytoplasmic NAD+ in S. oneidensis (Fig. 2A) [52]. We imaged S. oneidensis + Bdh on a cathode while monitoring membrane potential change (i.e., the voltage across the inner membrane), pre- to post-injection with either acetoin or the solvent control, water. In this work, we used computational and experimental methods to further define the thermodynamic bottleneck that limits Q-pool dependent EEU, and by extension, Q-pool-dependent MES systems.
Methods
Reactions and equations
Step 7: The reaction for Fig. 2, Step 7:
$$Menaquinol left({MQH}_{2}right)+{NAD}^{+} stackrel{NADH dehydrogenase }{iff }Menaquinone left(MQright)+NADH+{H}^{+}$$
Equation 1: Standard biochemical free energy with multicompartment adjustment:
$${Delta G^{circ{prime}}}_{left(multicompartmentright)}={Delta }_{r}G^{circ {prime}}+{{varvec{N}}}_{{varvec{i}}{varvec{o}}{varvec{n}}}{varvec{R}}{varvec{T}}{varvec{ln}}left(frac{{left[{varvec{i}}{varvec{o}}{varvec{n}}right]}_{{varvec{f}}{varvec{i}}{varvec{n}}{varvec{a}}{varvec{l}}}}{{left[{varvec{i}}{varvec{o}}{varvec{n}}right]}_{{varvec{i}}{varvec{n}}{varvec{i}}{varvec{t}}{varvec{i}}{varvec{a}}{varvec{l}}}boldsymbol{ }}right)+{{varvec{Q}}}_{{varvec{c}}{varvec{h}}{varvec{a}}{varvec{r}}{varvec{g}}{varvec{e}}}{varvec{F}}boldsymbol{Delta }{varvec{phi}}$$
(1)
Equation 2: Overall free energy change for Step 7 taking place in the periplasm and cytoplasm:
$$Delta G= {Delta G^{circ {prime}}}_{left(multicompartmentright)}+RTtext{ln}left(frac{left[MQright]left[NADHright]}{left[{MQH}_{2}right]left[{NAD}^{+}right]}right)$$
(2)
Multicompartment Gibbs free energy calculations
We calculated the multicompartment free energy for Step 7, assuming either Nuo (4 H+ per NADH), Nqr1 (2 Na+ per NADH), or Ndh (uncoupled, 0 ions per NADH) catalyzed the reaction. Standard biochemical free energy (ΔG°’) calculations in a single cellular compartment use the assumption that reactants and products are in a uniform aqueous solution. However, when a reaction involves ion translocation across a membrane, the aqueous solutions on either side of the membrane cannot be assumed internally consistent [50]. In this work, we calculated ΔG°’(multicompartment) using the eQuilibrator 3.0 Python-based Application Programming Interface (API) [50, 53]. eQuilibrator 3.0 API accounts for the differences in pH, charge, and ion concentrations between cellular compartments by adding compartment-specific adjustments to the standard biochemical free energy of a reaction (ΔrG°’) to calculate the multicompartment standard free energy (ΔG°’(multicompartment)) shown in Eq. 1. These adjustments are critical for reactions that involve ion transport from an initial compartment (e.g., periplasm) to a final compartment (e.g., cytoplasm). In Eq. 1, the multicompartment adjustment includes terms for the ion concentration gradient ([ion]) for both the initial and final compartment, the membrane voltage ((Delta phi)) and the stoichiometry of ions transported; Nion represents the number of ions transported, while Qcharge is the total charge transported across the inner membrane. In addition, F is Faraday’s constant (− 96.5 kC mol−1), R is the gas constant (8.31447 × 10⁻³ kJ K−1 mol−1), and T is temperature in Kelvin (289.15 K) [50, 54, 55]. The multicompartment free energy calculation is necessary, because ions are transported from an initial compartment (the periplasm) to a final compartment (the cytoplasm). Once the ΔG°’(multicompartment) is calculated with Eq. 1, it can be plugged into Eq. 2 to calculate the overall free energy change ΔG for Step 7 [50, 55].
We also calculated the Gibbs free energy changes in Fig. 2B using Eqs. 1 and 2, to demonstrate a snapshot of the free energy landscape for EEU through the Mtr pathway to S. oneidensis’ three types of NADH dehydrogenases (PMF-linked, SMF-linked, uncoupled). Cytoplasmic pH was set to 7.6, periplasmic pH to 7.3, the quinone pool at 80% reduced, an NAD+ to NADH ratio favoring EEU (15:1). The membrane potential was set to −0.15 V, representing the transmembrane electrical potential difference across the bacterial inner membrane, with the cytoplasm negative relative to the periplasm. Note that Fig. 2B shows an explainatory aid to complement our hypothesis, not part of our results for this work. For this reason, the input values need only be within a physiologically relevant range for the sake of the example not varried incrementally as done for the data in Fig. 4.

Gibbs free energy predicted for Reaction 1 under various biologically relevant conditions (non-extremophile). In (A–C) a diagram of the associated EEU pathway is on the left and the results of our thermodynamic model are on the right. Each heatmap shows the ΔG calculated for Reaction 1, where the Q-pool is either primarily oxidized or reduced, 0.1% reduced and 90% reduced, respectively. For both an oxidized and reduced Q-pool, we modeled various combinations of membrane potential and periplasmic pH. As Reaction 1 occurs across a membrane, we calculated ΔG using Eqs. 1 and 2. ‘Mtr’ represents the MtrA, MtrB, and MtrC proteins from the Mtr pathway. Small tetraheme cytochromes (STC) are electron carriers in the periplasmic space. ‘FMN’ and ‘FMNH2’ are the oxidized and reduced forms of flavin mononucleotide, respectively. Arrows indicate the direction of electron flow (excluding the ion-translocating arrows). The quinone pool (Q-pool) contains menaquinone (MQ) and menaquinol (MQH2)
Biologically relevant parameter definitions
In the context of this work, ‘biologically relevant’ indicates that a value, or range of values, was chosen, because it is physiologically relevant to bacteria that are neutrophilic and mesophilic. The percentage of reduced quinones in the Q-pool was assumed to be on the edge of the experimentally determined minimum and maximum, 0.1% reduced and 90% reduced, respectively [56, 57]. The Mtr pathway in S. oneidensis primarily interacts with the quinone pair menaquinone/menaquinol via CymA in the inner membrane [58]. The reaction quotient for Step 7 is (frac{left[MQright]left[NADHright]}{left[{MQH}_{2}right]left[{NAD}^{+}right]}), meaning that the ratio of [NAD+] to [NADH] and [MQH2] to [MQ] in contribute symmetrically to the overall Gibbs free energy change of Step 7 (Eq. 2). Because both ratios impact the thermodynamic favorability of Step 7 in a mathematically equivalent manner, through the natural logarithm term ({varvec{ln}}left(frac{left[{varvec{M}}{varvec{Q}}right]left[{varvec{N}}{varvec{A}}{varvec{D}}{varvec{H}}right]}{[{varvec{M}}{varvec{Q}}{{varvec{H}}}_{2}]left[{varvec{N}}{varvec{A}}{{varvec{D}}}^{+}right]}right)), we chose to hold the ratio of NAD+ to NADH constant. The ratio of NAD+ to NADH used in all free energy calculations was 15:1, representing an NAD(H) pool that is 93.7% oxidized. In addition, because ratios remain difficult to measure accurately, we chose the ratio of 15:1, because it is physiologically plausible and favors EEU [59, 60]. By assuming a consistent and highly oxidized NAD(H) pool, paired with either a highly oxidized or highly reduced Q-pool, we decreased the complexity of the modeled scenarios while ensuring that we included the situations most likely to favor EEU for comparing the relative abilities of energetic coupling via Nuo, Nqr, and Ndh.
Bioelectrochemical system (BES) preparation
Pirbadian et al. [51] demonstrated that the fluorescent cationic dye Thioflavin T (ThT) can be used to visualize membrane potential changes in S. oneidensis in response to electrode-driven extracellular electron transfer [51]. In this work, we used a similar experimental setup to Pirbadian et al. [51] to visualize membrane potential changes during EEU for S. oneidensis with the working electrode poised at either + 0.2 V vs Ag/AgCl or −0.5 V vs Ag/AgCl [51]. Each single-chamber BES consisted of a borosilicate glass culture tube that was cut to approximately 7 cm in length from the flanged end. The working electrode was an indium–tin–oxide (ITO) coated glass cover slip measuring 22 × 40 mm with a thickness of 0.16 to 0.19 mm and a sheet resistance of 70–100 Ω/□ (ohms per square), a standard unit for resistance in thin films (SPI Supplies, Thickness #1.5, Cat. # 06498-AB). A titanium wire was connected to the ITO slip with CCC carbon adhesive (Electron Microscopy Sciences, Cat. # 12664). The cut end of the culture tube was adhered to the center of the conductive side of the ITO slip with a two-part epoxy following manufacturer instructions (Polytec PT, Cat. # EP 653-T). To provide electrical insulation and structural support, the epoxy was also spread over remaining exposed portions of the ITO surface and the attachment point of the titanium wire. The counter electrode was a coiled titanium wire, and the reference electrode was Ag/AgCl in saturated KCl in a glass tube with a magnesia stick frit (Sigma Aldrich, Cat. # 31408-1EA). The counter and reference electrodes were held in place and the BES sealed with a butyl rubber septum stopper. Figure 3 A shows a diagram of the microscopy experimental setup.
Bacterial culture preparation and BES inoculation
We used the strain S. oneidensis MR–1 + pBBR1-Bdh (MR–1 + Bdh), created by Tefft and TerAvest [44], for all microscopy experiments.31 The enzyme butanediol dehydrogenase (Bdh) was expressed constitutively on a plasmid conferring kanamycin resistance, pBBR1. For each biological replicate, we inoculated 5 ml of Miller’s Lysogeny Broth (LB) supplemented with kanamycin (kan, 50 μg∙ml−1) with a single colony of MR–1 + Bdh. Each culture grew to an OD600 of 3.47 to 4.66. After growth in LB + kan, cultures were centrifuged (8500 × g for 3 min) and resuspended in 50 ml of M5 minimal medium (1.29 mM K2HPO4, 1.65 mM KH2PO4, 7.87 mM NaCl, 1.70 mM NH4SO4, 475 μM MgSO4·7H2O, 100 mM HEPES, 50 μg ml−1 kanamycin, 1X Wolfe’s mineral solution (excluding both casamino acids and AlK(SO4)2·12 H2O), and 1X Wolfe’s vitamin solution (excluding riboflavin) to wash cells.31,43,53 Following the wash in minimal medium, the culture was again centrifuged (8500 × g for 3 min), then standardized to an OD600 of 0.2 in M5 minimal medium.
Electrochemical experiments with fluorescence monitoring
The BES was inoculated with 7 ml of the standardized culture of MR-1 + Bdh. The three-electrode, single-chamber BES was connected to a potentiostat (VMP, BioLogic USA) with the working electrode potential set to + 0.2 V vs an Ag/AgCl reference electrode for 15–17 h; during this time, 99.9% N2 gas (Airgas) bubbled into the BES (Figure S2). This phase of the experiment is designed to promote oxidation of any residual organic carbon in the system. After this time, all medium was removed from the BES (barring 0.5 ml that remained to avoid drying cells on the ITO electrode) to remove planktonic cells and background fluorescence [51]. The BES was re-filled to a total of 8.5 ml of M5 minimal medium + 10 μM ThT and remained electrically connected to the potentiostat for 30 min prior to beginning fluorescence microscopy, with the working electrode potential set to + 0.2 V vs the Ag/AgCl reference electrode to enable stabilization of the electrochemical environment.
During microscopy, an anaerobic serum bottle was connected to the BES via neoprene tubing to prevent changes in pressure or oxygenation during injections. To prepare the anaerobic serum bottle, the container was autoclave sterilized, and filled with 50 ml of M5 minimal medium, 10 μM ThT, and 1 mM acetoin was sealed with a butyl rubber stopper and connected to two lines of sterile neoprene tubing. Nitrogen was bubbled into the bottle and tubing for a minimum of 16 h. Due to the light sensitivity of ThT, the serum bottle was wrapped in aluminum foil during this time to prevent photodegradation. The three biological replicates that received a water injection rather than acetoin, used anaerobic bottles that contained M5 minimal medium + 10 μM ThT.
To determine if EEU to the cytoplasm is IMF-limited in S. oneidensis + Bdh, we imaged live cells on a transparent ITO electrode to measure membrane potential before and after injecting 0.17 ml of 50 mM acetoin (1 mM working concentration). Fluorescence images were acquired with an inverted Zeiss Axio Observer D1 microscope with a Plan-Apochromat 63x/1.40 Oil DIC objective. Each BES was connected to an anerobic bottle, prepared as described above. All fluorescence images for ThT were collected with the Zeiss Axio Observer D1 GFP filter cube. Once S. oneidensis cells were visualized on the ITO electrode, a portable potentiostat (Rodeostat, IO Rodeo) was connected for the following working electrode potentials (vs Ag/AgCl reference electrode) and timeframes: + 0.2 V (40 min), − 0.5 V (120 min). We collected electric current once per second with a single-channel three-electrode Rodeostat. We plotted all current vs time plots with a 60-s simple moving average. The first injection of either acetoin (1 mM) or water-control occurred at 70 min out of the total 160-min time series. The second injection of either carbonyl cyanide m-chlorophenyl hydrazone (CCCP, 125 μM) or ethanol-control occurred at 130 min out of the total 160 min timeseries. CCCP is a protonophore, which collapses the membrane voltage and pH gradient across the membrane. Each image time series had an interval of 2 min. All injections were prepared in an anaerobic chamber and transported in a BD GasPak System container.
Fluorescence microscopy image analysis
Carl Zeiss image (CZI) files were processed with ImageJ version 1.53t. The background fluorescence was subtracted from each image using the default rolling ball radius setting (50.0 pixels) with smoothing disabled. ImageJ’s analysis tool ‘Analyze Particles’ was used to gather ThT fluorescence data for individual cells from each background subtracted image. The mean fluorescence intensity was calculated for every bacterial cell. Individual bacterial cell fluorescence was used to calculate the mean fluorescence of each timepoint. The collective average of the three biological replicates could then be calculated. The corresponding standard error of the mean (sem) for both the experimental (acetoin) and control (water) groups is also shown. We note that the fluorescence data throughout this work were collected using a fluorescence microscope that required manual re-focusing adjustments approximately 30–45 s prior to each image. As this process introduced slight point-to-point variability in the measurements, unrelated to the true fluorescence dynamics, we limit our interpretation to longer trends rather than individual point-to-point variation. Despite this technical limitation, the broad trends over longer periods remained consistent and comparable across biological replicates.
Statistical analysis
We measured the intraexperiment response in ThT fluorescence (ΔThT) and electric current (ΔI) following injection with either acetoin or water. The pre-injection timeframe was 40–70 min, and the post-injection timeframe was 71–128 min. We evaluated statistical significance with a Welch’s t test. The null hypothesis assumption was that there would be no difference in either ΔThT or ΔI when comparing the experimental group (acetoin injection) to the control group (water injection). The cutoff for statistical significance was p < 0.05. Both the experimental and control groups had three independent biological replicates of S. oneidensis + Bdh. All additional data processing was done in Python with numpy 1.23.4, scipy 1.9.3, pandas 1.2.5, and matplotlib 3.6.0.
Data availability
Gibbs free energy changes were calculated using eQuilibrator 3.0 API in Python 3.9.7 with the following package dependencies: seaborn 0.11.2, scipy 1.8.1, pandas 1.3.4, numpy 1.22.4, matplotlib 3.4.3, cvxpy 1.2.1. The source code and raw data for either the free energy calculations or the microscopy experiments are available on request.
Results
Q-pool dependent EEU to cytoplasmic NAD + is IMF-dependent
We calculated the ΔG for Step 7 in S. oneidensis when catalyzed by three energetically distinct NADH dehydrogenases. Nuo and Nqr are energetically coupled to IMF, transporting 4 H+ and 2 Na+ per NADH, respectively, while Ndh is not coupled to IMF. For each NADH dehydrogenase, we modeled the ΔG of Step 7 in response to biologically relevant changes in the reaction quotient ((frac{left[MQright]left[NADHright]}{left[{MQH}_{2}right]left[{NAD}^{+}right]})), membrane potential ((Delta phi)), ion-transport stoichiometry, and pH difference across the inner membrane (Eqs. 1 and 2, Methods).
For the 40 conditions modeled for each type of energetic coupling in Fig. 4, Step 7 was thermodynamically favorable (ΔG < 0) in 0/40 (0%) of scenarios when energetically uncoupled, 12/40 (30%) when SMF-coupled, and 31/40 (77.5%) when PMF-coupled. A high reactant to product ratio (90% reduced) of menaquinol (MQH2) to menaquinone (MQ), increased the available free energy for Step 7 under all energetic coupling conditions compared to a low ratio of MQH2:MQ (0.1% reduced); however, a shift in the reactant to product ratio alone was not sufficient to make Step 7 favorable in the absence of IMF (ΔG > 0). We only show reactant to product ratios for MQH2 to MQ, because the NAD(H) pool is held constant in our models at 93.7% oxidized to favor EEU, as described in the Methods section.
For each value of periplasmic pH (5, 6, 7, and 8) that we modeled, the cytoplasmic pH was held constant (pH = 7.5). Change in the periplasmic pH only reversed the thermodynamically favored direction of Step 7 when energetically coupled to SMF or PMF. When Ndh was used, ΔG was not dependent on membrane potential. When Step 7 was catalyzed by Nqr or Nuo in our model, a greater membrane potential magnitude (− 0.2 V) yielded the most thermodynamically favorable ΔG for a given column. The ion involved in energetic coupling determined whether an acidic or basic periplasmic pH was the most favorable for EEU (ΔG < 0). When we modeled the ΔG for Step 7 catalyzed by Nuo (PMF-coupled) an acidic periplasmic pH was the most thermodynamically favorable for EEU (Fig. 4C). However, when we modeled the ΔG assuming Nqr (SMF-coupled), a basic periplasmic pH was more thermodynamically favorable for EEU for a given row in Fig. 4B. These results support the hypothesis that energetic coupling to IMF is required for Step 7 to proceed in the EEU direction.
Q-pool dependent EEU to cytoplasmic NAD + is IMF-limited
To determine whether EEU was IMF-limited, we used a small (< 10 ml) single-chamber bioelectrochemical system (BES) designed for simultaneous fluorescence imaging and electrochemical measurements, as shown in Fig. 3. Using this microscopy compatible-BES, we measured electric current produced by S. oneidensis MR-1 + Bdh on a cathode and qualitatively estimated the membrane potential via ThT fluorescence (Fig. 5). We observed that when acetoin was added, ThT fluorescence decreased significantly compared to the water control, indicating that electron transfer to acetoin was an IMF sink that significantly altered the membrane potential.

ThT fluorescence and electrical current simultaneously measured in microscopy-compatible BESs. A, B Applied electrode potential (yellow), ThT fluorescence (green), and current (purple) plotted by time. In (A) the two injections were acetoin and CCCP. B The same experimental procedure performed with the solvent controls injected, water and ethanol respectively. C Mean ± SEM (standard error of the mean) for the pre- to post-injection difference in ThT fluorescence (left, green) and electric current (purple, right). In (C) ‘Intra-experiment’ refers to the pre- to post-injection change, for either acetoin or water within a single biological replicate; ΔThT or Δcurrent are the mean ± SEM of three biological replicates for either the acetoin injection (Acetoin, n = 3) or the solvent control (Water, n = 3). The * symbol indicates statistical significance
When water was injected instead of acetoin, no change in ThT fluorescence or current occurred. There was no significant difference in cathodic current before and after acetoin injection; however, this is not unexpected given the low cell density in the experimental setup. The PMF-uncoupler, CCCP, was injected 60 min after acetoin injection. Following CCCP injection, ThT fluorescence did not decrease further, suggesting that cells may have been completely depolarized after acetoin injection. We confirmed that CCCP injection in this system caused membrane depolarization by injecting CCCP into systems with S. oneidensis MR-1 using lactate as an electron donor and oxygen as an electron acceptor in the electrochemical cell without an applied voltage (Figure S1). Aerobic lactate metabolism provides NADH to the ion translocating NADH dehydrogenases and subsequent build-up of membrane potential [62]. Under these conditions, ThT fluorescence decreased by 50% upon CCCP injection (Figure S1). When lactate was the electron donor and oxygen the electron acceptor, pre-CCCP ThT fluorescence (~ 7000 procedure defined unit, p.d.u.) was ~ 3.5X higher than for S. oneidensis with the cathode as the electron donor and acetoin as the electron acceptor (~ 2000 p.d.u.).
Discussion
To reduce net carbon emissions at industrial sources via MES systems, we must first address the current density bottlenecks that limit EEU. Here, we described the thermodynamic bottleneck that limits Q-pool dependent EEU in S. oneidensis, a constraint applicable to several genera of MES candidate organisms. EEU through the Mtr pathway, a well-characterized and bidirectional ET route in S. oneidensis, is thermodynamically reversible prior to exiting the Q-pool in Step 7. We calculated the multicompartment free energy change available to Step 7 under biologically relevant conditions (non-extremophile). Thermodynamic calculations showed that Q-pool dependent EEU requires energetic coupling to IMF for Step 7 to be thermodynamically favorable under all conditions modeled (Fig. 4). We also hypothesized that Q-pool dependent EEU is IMF-limited.
As discussed by Mancini et al. (2019), extensive calibration is required under all experimental contexts for a membrane potential indicator to be used for quantitative measurements [63]. While this level of optimization was impractical for this study, we were able to assess membrane potential changes with ThT qualitatively by restricting fluorescence intensity comparison to individual biological replicates, then comparing the pre- to post-injection ΔThT for the acetoin and water-control group. When acetoin is added, the periplasm loses positively charged ions either as protons or sodium ions via NADH dehydrogenase, which reduces the magnitude of the membrane potential voltage. As cations leave the periplasm, the corresponding drop in capacitive negative charge (–OH) on the cytoplasmic side of the inner membrane reduces the attraction for positively charged ThT, leading to a decrease in its abundance inside individual cells [51, 63].
We found that acetoin but not the solvent control (water), triggered a sustained decrease in membrane potential (p = 0.0334), suggesting that EEU triggered IMF-consumption. ThT fluorescence following acetoin injection dropped 727.7 ± 145.6 p.d.u, whereas the ThT fluorescence following the solvent control (water) injection dropped 119.2 ± 78.5 p.d.u. In addition, CCCP did not further lower ThT fluorescence after the acetoin-dependent decrease, indicating the membrane potential was already depolarized and EEU was IMF limited. Electric current following CCCP had increased variability, which we speculate could be due to some cell lysis and subsequent electrochemical changes at the electrode. Complete depolarization suggests that inward electron transfer depletes IMF faster than it can be replaced, and therefore, IMF generation is the rate limiting step for EEU under these conditions. The IMF limitation likely leads not only to a limitation in the EEU rate, but also other negative consequences for the cell, such as a limited ability to generate ATP for other processes.
Our finding that Q-pool-dependent EEU in S. oneidensis, an engineered heterotrophic bacterium, is both IMF-dependent and IMF-limited aligns with the mechanisms observed in wild-type autotrophic organisms where EEU drives energy conserving pathways through the Q-pool. As reviewed in Gupta et al. [12], autotrophs relying on Q-pool dependent EEU require a source of IMF for carbon fixation [12]. Similarly, Guzman et al. [9] demonstrated that R. palustris requires PMF for electrode-driven carbon fixation [9]. Past work with S. oneidensis is also consistent with IMF-dependent EEU to the cytoplasm [21, 44, 48, 52, 64]. Tefft and TerAvest [44] reported EEU in S. oneidensis + Bdh + PR (proteorhodopsin), where PR, a light-driven proton pump, provided PMF [44]. On a cathode, S. oneidensis + Bdh + PR, rapidly responded to changes in light, indicating that EEU might be PMF-limited [44]. Rowe et al. [21, 64] showed that S. oneidensis can perform EEU to the Q-pool with PMF supplied natively by proton-pumping terminal oxidases [21, 64]. Ford and TerAvest [52] demonstrated that PMF from terminal oxidases was also sufficient to drive EEU to the cytoplasm in place of PR in S. oneidensis + Bdh [52]. Tefft et al. [48] found that CCCP interfered with EEU to the cytoplasm, but not to fumarate reductase (FccA) in the periplasm [48]. As illustrated by Ross et al. [19], 85% of EEU to FccA must go through the quinone pool [19]. Considered together, Tefft et al [48] and Ross et al. [19] highlight that EEU to the Q-pool is not PMF-dependent; however, electron transfer from the reduced quinone pool to cytoplasmic NAD+ is PMF-dependent [19, 48].
As shown by our model, Step 7 could be thermodynamically favorable for EEU with a consistent supply of IMF. Future work could optimize expression of both H+-pumping oxidases and dissolved oxygen concentration to provide sufficient PMF for EEU, without reaching harmful concentrations of H2O2 from oxygen reduced on the cathode [52]. Oxygen levels must also be optimized to ensure that abiotic oxygen reduction does not represent a major fraction of the electron transfer. Under optimized conditions, it is possible that IMF would no longer be limiting for EEU. If this occurs, and discrepancies between anodic and cathodic current density magnitudes persist, future work could consider enzymatic engineering. Advances in protein design, including emerging AI-based approaches trained on protein sequences, may offer new tools to help alleviate such bottlenecks and begin to close the performance gap between microbial and abiotic systems.
We can improve the feasibility of MES as a scale-able biotechnology by identifying and optimizing the IMF-sources able to drive EEU in metal reducers. The utility of the efficient electron transport pathways in metal-reducing bacteria are not limited to MES systems from a given species or genus. Indeed, the two requirements of MES have been independently demonstrated through heterologous expression: TerAvest et al. [65] showed that E. coli expressing the Mtr pathway could directly link metabolic oxidation to electrode reduction; and Antonovsky et al. (2016) engineered a strain of E. coli capable of fixing CO2 into organic carbon molecules [65,66,67]. In the future, engineered heterotrophic species, and/or their heterologously expressed EEU pathways, could increase current density magnitudes well into the range required for MES to be a scalable and sustainable biotechnology.
Data availability
Free energy changes were calculated using eQuilibrator 3.0 API in Python 3.9.7 with the following package dependencies: seaborn 0.11.2, scipy 1.8.1, pandas 1.3.4, numpy 1.22.4, matplotlib 3.4.3, cvxpy 1.2.1. The source code and raw data for either the free energy calculations or the microscopy experiments are available on request.
References
-
Masson-Delmotte V, Zhai P, Pörtner HO, IPCC, et al. IPCC, 2018: global warming of 1.5°C. An IPCC special report on the impacts of global warming of 1.5°C above pre-industrial levels and related global greenhouse gas emission pathways, in the context of strengthening the global response to the threat of climate change, sustainable development, and efforts to eradicate poverty. Intergov Panel Clim Change. 2018. https://doi.org/10.1017/9781009157940.
-
Karthikeyan R, Singh R, Bose A. Microbial electron uptake in microbial electrosynthesis: a mini-review. J Ind Microbiol Biotechnol. 2019;46(9–10):1419–26. https://doi.org/10.1007/s10295-019-02166-6.
-
Zhang S, Jiang J, Wang H, Li F, Hua T, Wang W. A review of microbial electrosynthesis applied to carbon dioxide capture and conversion: the basic principles, electrode materials, and bioproducts. J CO2 Utilization. 2021;51:101640. https://doi.org/10.1016/j.jcou.2021.101640.
-
Rabaey K, Rozendal RA. Microbial electrosynthesis—revisiting the electrical route for microbial production. Nat Rev Microbiol. 2010;8(10):706–16. https://doi.org/10.1038/nrmicro2422.
-
Nevin KP, Woodard TL, Franks AE, Summers ZM, Lovley DR. Microbial electrosynthesis: feeding microbes electricity to convert carbon dioxide and water to multicarbon extracellular organic compounds. MBio. 2010. https://doi.org/10.1128/mBio.00103-10.
-
Dessì P, Rovira-Alsina L, Sánchez C, et al. Microbial electrosynthesis: towards sustainable biorefineries for production of green chemicals from CO2 emissions. Biotechnol Adv. 2021. https://doi.org/10.1016/j.biotechadv.2020.107675.
-
Jourdin L, Burdyny T. Microbial electrosynthesis: where do we go from here? Trend Biotechnol. 2021;39(4):359–69. https://doi.org/10.1016/j.tibtech.2020.10.014.
-
Prévoteau A, Carvajal-Arroyo JM, Ganigué R, Rabaey K. Microbial electrosynthesis from CO2: forever a promise? Curr Opin Biotechnol. 2020;62:48–57. https://doi.org/10.1016/j.copbio.2019.08.014.
-
Guzman MS, Rengasamy K, Binkley MM, et al. Phototrophic extracellular electron uptake is linked to carbon dioxide fixation in the bacterium Rhodopseudomonas palustris. Nat Commun. 2019;10(1):1–13. https://doi.org/10.1038/s41467-019-09377-6.
-
Kremp F, Roth J, Müller V. A third way of energy conservation in Acetogenic Bacteria. Microbiol Spectr. 2022. https://doi.org/10.1128/spectrum.01385-22.
-
Schuchmann K, Müller V. Autotrophy at the thermodynamic limit of life: a model for energy conservation in acetogenic bacteria. Nat Rev Microbiol. 2014;12(12):809–21. https://doi.org/10.1038/nrmicro3365.
-
Gupta D, Guzman MS, Bose A. Extracellular electron uptake by autotrophic microbes: physiological, ecological, and evolutionary implications. J Ind Microbiol Biotechnol. 2020;47(9–10):863–76. https://doi.org/10.1007/s10295-020-02309-0.
-
Jourdin L, Raes SMT, Buisman CJN, Strik DPBTB. Critical biofilm growth throughout unmodified carbon felts allows continuous bioelectrochemical chain elongation from CO2 up to caproate at high current density. Front Energy Res. 2018. https://doi.org/10.3389/fenrg.2018.00007.
-
Jourdin L, Sousa J, van Stralen N, Strik DPBTB. Techno-economic assessment of microbial electrosynthesis from CO2and/or organics: an interdisciplinary roadmap towards future research and application. Appl Energ. 2020;279:115775. https://doi.org/10.1016/j.apenergy.2020.115775.
-
Hengsbach JN, Sabel-Becker B, Ulber R, Holtmann D. Microbial electrosynthesis of methane and acetate—comparison of pure and mixed cultures. Appl Microbiol Biotechnol. 2022;106(12):4427–43. https://doi.org/10.1007/s00253-022-12031-9.
-
Gralnick JA, Newman DK. Extracellular respiration. Mol Microbiol. 2007;65(1):1–11. https://doi.org/10.1111/j.1365-2958.2007.05778.x.
-
Fujikawa T, Ogura Y, Ishigami K, et al. Unexpected genomic features of high current density-producing Geobacter sulfurreducens strain YM18. FEMS Microbiol Lett. 2021. https://doi.org/10.1093/femsle/fnab119.
-
Zhang L, Zhang Y, Liu Y, et al. High power density redox-mediated Shewanella microbial flow fuel cells. Nat Commun. 2024;15(1):8302. https://doi.org/10.1038/s41467-024-52498-w.
-
Ross DE, Flynn JM, Baron DB, Gralnick JA, Bond DR. Towards electrosynthesis in Shewanella: energetics of reversing the Mtr pathway for reductive metabolism. PLoS ONE. 2011;6(2):e16649. https://doi.org/10.1371/journal.pone.0016649.
-
Coursolle D, Baron DB, Bond DR, Gralnick JA. The Mtr respiratory pathway is essential for reducing flavins and electrodes in Shewanella oneidensis. J Bacteriol. 2010;192(2):467–74. https://doi.org/10.1128/JB.00925-09.
-
Rowe AR, Salimijazi F, Trutschel L, et al. Identification of a pathway for electron uptake in Shewanella oneidensis. Commun Biol. 2021. https://doi.org/10.1038/s42003-021-02454-x.
-
Kotloski NJ, Gralnick JA. Flavin electron shuttles dominate extracellular electron transfer by Shewanella oneidensis. MBio. 2013. https://doi.org/10.1128/mBio.00553-12.
-
Madsen CS, TerAvest MA. NADH dehydrogenases Nuo and Nqr1 contribute to extracellular electron transfer by Shewanella oneidensis MR-1 in bioelectrochemical systems. Sci Rep. 2019;9(1):1–6. https://doi.org/10.1038/s41598-019-51452-x.
-
Edwards MJ, White GF, Butt JN, Richardson DJ, Clarke TA. The crystal structure of a biological insulated transmembrane molecular wire. Cell. 2020. https://doi.org/10.1016/j.cell.2020.03.032.
-
Kracke F, Vassilev I, Krömer JO. Microbial electron transport and energy conservation—the foundation for optimizing bioelectrochemical systems. Front Microbiol. 2015. https://doi.org/10.3389/fmicb.2015.00575.
-
Mitchell P. Chemiosmotic coupling in oxidative and photosynthetic phosphorylation. Biochim Biophys Acta Bioenerg. 2011;1807(12):1507–38. https://doi.org/10.1016/j.bbabio.2011.09.018.
-
Herrmann G, Jayamani E, Mai G, Buckel W. Energy conservation via electron-transferring flavoprotein in anaerobic bacteria. J Bacteriol. 2008;190(3):784–91. https://doi.org/10.1128/JB.01422-07.
-
Buckel W, Thauer RK. Energy conservation via electron bifurcating ferredoxin reduction and proton/Na+ translocating ferredoxin oxidation. Biochim Biophys Acta Bioenerg. 2013;1827(2):94–113. https://doi.org/10.1016/j.bbabio.2012.07.002.
-
Müller V, Hess V. The minimum biological energy quantum. Front Microbiol. 2017;8(OCT):2019. https://doi.org/10.3389/fmicb.2017.02019.
-
Pal Chowdhury N, Basen M. Electron bifurcation: a long-hidden energy-coupling mechanism. Annu Rev Microbiol. 2018. https://doi.org/10.1146/annurev-micro-090816.
-
Martin WF. Hydrogen, metals, bifurcating electrons, and proton gradients: the early evolution of biological energy conservation. FEBS Lett. 2012;586(5):485–93. https://doi.org/10.1016/j.febslet.2011.09.031.
-
Buckel W, Thauer RK. Flavin-based electron bifurcation, a new mechanism of biological energy coupling. Chem Rev. 2018;118(7):3862–86. https://doi.org/10.1021/acs.chemrev.7b00707.
-
Fonseca BM, Paquete CM, Neto SE, Pacheco I, Soares CM, Louro RO. Mind the gap: cytochrome interactions reveal electron pathways across the periplasm of Shewanella oneidensis MR-1. Biochemical Journal. 2013;449(1):101–8. https://doi.org/10.1042/BJ20121467.
-
Schuchmann K, Müller V. Energetics and application of heterotrophy in acetogenic bacteria. Appl Environ Microbiol. 2016;82(14):4056–69. https://doi.org/10.1128/AEM.00882-16.
-
Jourdin L, Grieger T, Monetti J, et al. High acetic acid production rate obtained by microbial electrosynthesis from carbon dioxide. Environ Sci Technol. 2015;49(22):13566–74. https://doi.org/10.1021/acs.est.5b03821.
-
Franza T, Gaudu P. Quinones: more than electron shuttles. Res Microbiol. 2022;173(6–7): 103953. https://doi.org/10.1016/J.RESMIC.2022.103953.
-
Abby SS, Kazemzadeh K, Vragniau C, Pelosi L, Pierrel F. Advances in bacterial pathways for the biosynthesis of ubiquinone. Biochim Biophys Acta Bioenerg. 2020. https://doi.org/10.1016/j.bbabio.2020.148259.
-
Richardson DJ. Bacterial respiration a flexible process for a changing environment. Microbiology. 2000. https://doi.org/10.1099/00221287-146-3-551.
-
Anraku Y. Bacterial electron transport chains. Annu Rev Biochem. 1988. https://doi.org/10.1146/annurev.bi.57.070188.000533.
-
Kaila VRI, Wikström M. Architecture of bacterial respiratory chains. Nat Rev Microbiol. 2021;19(5):319–30. https://doi.org/10.1038/s41579-020-00486-4.
-
Sarewicz M, Pintscher S, Pietras R, et al. Catalytic reactions and energy conservation in the cytochrome bc1 and b6f complexes of energy-transducing membranes. Chem Rev. 2021;121(4):2020–108. https://doi.org/10.1021/acs.chemrev.0c00712.
-
Nelson D, Cox M. Lehninger principles of biochemistry. 8th ed. New York: Macmillan Learning; 2021.
-
Kleijn RJ, Buescher JM, Le Chat L, Jules M, Aymerich S, Sauer U. Metabolic fluxes during strong carbon catabolite repression by malate in bacillus subtilis. J Biol Chem. 2010;285(3):1587–96. https://doi.org/10.1074/JBC.M109.061747.
-
Tefft NM, Teravest MA. Reversing an extracellular electron transfer pathway for electrode-driven acetoin reduction. ACS Synth Biol. 2019;8(7):1590–600. https://doi.org/10.1021/acssynbio.8b00498.
-
Pinchuk GE, Hill EA, Geydebrekht OV, et al. Constraint-based model of Shewanella oneidensis MR-1 metabolism: a tool for data analysis and hypothesis generation. PLoS Comput Biol. 2010;6(6):1–8. https://doi.org/10.1371/journal.pcbi.1000822.
-
Flynn CM, Hunt KA, Gralnick JA, Srienc F. Construction and elementary mode analysis of a metabolic model for Shewanella oneidensis MR-1. Bio Syst. 2012;107(2):120–8. https://doi.org/10.1016/j.biosystems.2011.10.003.
-
Kishi S, Saito K, Kato Y, Ishikita H. Redox potentials of ubiquinone, menaquinone, phylloquinone, and plastoquinone in aqueous solution. Photosynth Res. 2017;134(2):193–200. https://doi.org/10.1007/s11120-017-0433-4.
-
Tefft NM, Ford K, TerAvest MA. NADH dehydrogenases drive inward electron transfer in Shewanella oneidensis MR-1. Microb Biotechnol. 2022. https://doi.org/10.1111/1751-7915.14175.
-
Breuer M, Zarzycki P, Shi L, et al. Molecular structure and free energy landscape for electron transport in the decahaem cytochrome MtrF. Biochem Soc Trans. 2012;40:1198–203. https://doi.org/10.1042/BST20120139.
-
Beber ME, Gollub MG, Mozaffari D, et al. EQuilibrator 3.0: a database solution for thermodynamic constant estimation. Nucl Acid Res. 2022. https://doi.org/10.1093/nar/gkab1106.
-
Pirbadian S, Chavez MS, El-Naggar MY. Spatiotemporal mapping of bacterial membrane potential responses to extracellular electron transfer. Proc Natl Acad Sci U S A. 2020. https://doi.org/10.1073/pnas.2000802117.
-
Ford KC, Teravest MA. The electron transport chain of Shewanella oneidensis MR-1 can operate bidirectionally to enable microbial electrosynthesis. Appl Environ Microbiol. 2023. https://doi.org/10.1101/2023.08.11.553014.
-
Flamholz A, Noor E, Bar-Even A, Milo R. Equilibrator—the biochemical thermodynamics calculator. Nucleic Acids Res. 2012;40(D1):D770–5. https://doi.org/10.1093/nar/gkr874.
-
Mohr PJ, Taylor BN. CODATA recommended values of the fundamental physical constants 1998. Rev Modern Phys. 1998. https://doi.org/10.1103/RevModPhys.72.351.
-
Haraldsdóttir HS, Thiele I, Fleming RMT. Quantitative assignment of reaction directionality in a multicompartmental human metabolic reconstruction. Biophys J. 2012;102(8):1703–11. https://doi.org/10.1016/J.BPJ.2012.02.032.
-
Bekker M, Kramer G, Hartog AF, et al. Changes in the redox state and composition of the quinone pool of Escherichia coli during aerobic batch-culture growth. Microbiology (N Y). 2007;153(6):1974–80. https://doi.org/10.1099/mic.0.2007/006098-0.
-
van Beilen JWA, Hellingwerf KJ. All three endogenous quinone species of Escherichia coli are involved in controlling the activity of the aerobic/anaerobic response regulator ArcA. Front Microbiol. 2016. https://doi.org/10.3389/fmicb.2016.01339.
-
McMillan DGG, Marritt SJ, Butt JN, Jeuken LJC. Menaquinone-7 is specific cofactor in Tetraheme Quinol dehydrogenase CymA. J Biol Chem. 2012. https://doi.org/10.1074/jbc.M112.348813.
-
Li F, Li Y, Sun L, et al. Modular engineering intracellular NADH regeneration boosts extracellular electron transfer of Shewanella oneidensis MR-1. ACS Synth Biol. 2018;7(3):885–95. https://doi.org/10.1021/acssynbio.7b00390.
-
Liu Y, Landick R, Raman S. A regulatory NADH/NAD+ redox biosensor for bacteria. ACS Synth Biol. 2019;8(2):264–73. https://doi.org/10.1021/acssynbio.8b00485.
-
Duhl KL, Tefft NM, TerAvest MA. Shewanella oneidensis MR-1 utilizes both sodium- and proton-pumping NADH dehydrogenases during aerobic growth. Appl Environ Microbiol. 2018. https://doi.org/10.1128/AEM.00415-18.
-
Ishiki K, Shiigi H. Kinetics of intracellular electron generation in Shewanella oneidensis MR-1. Anal Chem. 2019. https://doi.org/10.1021/acs.analchem.9b02900.
-
Mancini L, Terradot G, Tian T, et al. A general workflow for characterization of nernstian dyes and their effects on bacterial physiology. Biophys J. 2019;118(1):4–14. https://doi.org/10.1016/j.bpj.2019.10.030.
-
Rowe AR, Rajeev P, Jain A, et al. Tracking electron uptake from a cathode into Shewanella cells: implications for energy acquisition from solid-substrate electron donors. MBio. 2018. https://doi.org/10.1128/mBio.02203-17.
-
Teravest MA, Zajdel TJ, Ajo-Franklin CM. The Mtr pathway of Shewanella oneidensis MR-1 couples substrate utilization to current production in Escherichia coli. ChemElectroChem. 2014;1(11):1874–9. https://doi.org/10.1002/celc.201402194.
-
Jensen HM, Albers AE, Malley KR, et al. Engineering of a synthetic electron conduit in living cells. PNAS. 2010. https://doi.org/10.1073/pnas.1009645107/-/DCSupplemental.
-
Antonovsky N, Gleizer S, Jona G, Bar-Even A, Correspondence RM. Sugar synthesis from CO 2 in Escherichia coli. Cell. 2016;166:115–25. https://doi.org/10.1016/j.cell.2016.05.064.
-
Agarwal RG, Coste SC, Groff BD, et al. Free energies of proton-coupled electron transfer reagents and their applications. Chem Rev. 2022;122(1):1–49. https://doi.org/10.1021/acs.chemrev.1c00521.
Acknowledgements
We thank Dr. Sahand Pirbadian and Dr. Moh El-Naggar, of the El-Naggar lab (University of Southern California) for helpful discussions, emails, and components for our BES prototype. We also thank members of the TerAvest lab, particularly Nicholas Tefft, for contributing to topical conversations for this project. Thank you to the Ducat Lab (Michigan State University) for use of their fluorescence microscope. Our work was funded by the NSF CAREER award 1750785 to M. TerAvest.
Funding
Our work was funded by the NSF CAREER award 1750785 to MT.
Ethics declarations
Ethics approval and consent to participate
Not applicable.
Consent for publication
Not applicable.
Competing interests
The authors declare no competing interests.
Additional information
Publisher’s Note
Springer Nature remains neutral with regard to jurisdictional claims in published maps and institutional affiliations.
Supplementary Information
Rights and permissions
Open Access This article is licensed under a Creative Commons Attribution-NonCommercial-NoDerivatives 4.0 International License, which permits any non-commercial use, sharing, distribution and reproduction in any medium or format, as long as you give appropriate credit to the original author(s) and the source, provide a link to the Creative Commons licence, and indicate if you modified the licensed material. You do not have permission under this licence to share adapted material derived from this article or parts of it. The images or other third party material in this article are included in the article’s Creative Commons licence, unless indicated otherwise in a credit line to the material. If material is not included in the article’s Creative Commons licence and your intended use is not permitted by statutory regulation or exceeds the permitted use, you will need to obtain permission directly from the copyright holder. To view a copy of this licence, visit http://creativecommons.org/licenses/by-nc-nd/4.0/.
About this article

Cite this article
Miller, S.D., Ford, K.C., Gruenberg Cross, M.C. et al. Energetic constraints of metal-reducing bacteria as biocatalysts for microbial electrosynthesis. Biotechnol. Biofuels Bioprod. 18, 72 (2025). https://doi.org/10.1186/s13068-025-02666-x
-
Received:
-
Accepted:
-
Published:
-
DOI: https://doi.org/10.1186/s13068-025-02666-x