Introduction
Optogenetics and synthetic biology have greatly enhanced our ability to interrogate biological processes with unprecedented spatiotemporal resolution1,2,3,4. By acting as light-induced dimerization modules or allosteric photoswitches, optogenetic tools enable non-invasive, reversible, and highly precise control of cellular functions by controlling protein activities with light5,6,7,8. Current blue light-induced dimerization and dissociation systems, including tunable, light-controlled interacting protein tags for cell biology (TULIP)9, Improved light-induced dimer (iLID)10, LOV2 trap and release of protein (LOVTRAP)11, Cryptochrome 2/CRY-interacting bHLH (CRY2/CIB1)12, and Magnets13,14, are widely utilized to modulate various biological processes, such as gene transcription, signal transduction, receptor activation, protein degradation, and protein localization.
Beyond these blue-light systems, additional optogenetic modules responsive to other wavelengths, such as UV and red light, have been developed. The UVR8-COP1 system utilizes UV-B light to regulate protein-protein interactions. Moreover, red and near-infrared (NIR) responsive systems, such as PhyB-PIF and BphP1-QPAS1, offer greater tissue penetration depth, making them particularly advantageous for in vivo applications1,15,16,17. Incorporating these alternative wavelength-responsive optogenetic modules enables multiplexed, wavelength-specific control of distinct cellular functions. However, despite these advancements, there remains a growing demand for optogenetic tools that provide modularity, ease of integration, and minimal interference with protein function, particularly for applications in complex and multicellular models.
A promising candidate that potentially meets these requirements is the ssrA-sspB dimerization system, derived from the protein degradation machinery of Escherichia coli. This system consists of a compact, seven-residue ssrA peptide tag and a 13-kDa binding partner, sspB18,19,20. The ssrA-sspB pair was first utilized in developing the optical dimerizer known as iLID-sspB10, where the ssrA tag was fused adjacent to the C-terminal Jα helix of the oat phototropin light-oxygen-voltage 2 (LOV2) domain to sterically occlude sspB binding in the dark21,22. Upon exposure to blue light, LOV2 undergoes conformational changes that expose the ssrA tag, thereby restoring its interaction with sspB. Despite affinity and kinetic optimization of the iLID-sspB system through mutagenesis of both domains10, the relatively large size of iLID and sspB imposes limitations in certain biological contexts. More recently, the ssrA-sspB system has been adapted into a binder/tag approach for real-time monitoring of protein conformation and kinase activity23. In this setup, the seven-residue ssrA tag is directly inserted into the protein of interest without perturbing the host protein activity, making ssrA exposure—and subsequent sspB binding—to depend on the specific conformation of the host protein. This binder/tag approach is advantageous due to the minimal size of the ssrA tag and the simplicity of engineering. However, it remains limited to monitoring protein activity and is incompatible with optogenetic control over protein function.
In this work, we introduce two types of photo-inducible binary interaction tools (PhoBITs) that expand the capabilities of the ssrA-sspB system for precise, light-controlled protein-protein interactions. To retain the compact nature of the ssrA tag, we engineer the sspB partner by incorporating distinct photosensory domains to create a LOV2-based OFF switch (PhoBIT1) and a CRY2-based ON switch (PhoBIT2). Both strategies differ substantially from the iLID-sspB design that relies on steric hindrance imposed by the LOV2 domain. In PhoBIT1, light-induced conformational change in LOV2 allosterically modulates the ssrA binding pocket on sspB, thereby triggering ssrA dissociation to function as an OFF switch. PhoBIT2, by contrast, operates as an ON switch by enabling the interaction between mutant ssrA (A2C mutation) and sspB (A56F mutation) via light-dependent CRY2 oligomerization. The compact ssrA tag in PhoBITs enables its integration into a wide range of proteins, thereby minimizing disruption to host protein function while enhancing modularity and adaptability. Notably, PhoBITs allow reversible and light-inducible association or dissociation with low basal activity, making them attractive for optogenetic experiments that require high specificity and minimal background interference1. Furthermore, we demonstrate the broad applicability of PhoBITs in remote control of gene transcription, GPCR signaling, calcium influx, necroptotic cell death, and innate immune response. From a translational perspective, PhoBITs are further engineered into therapeutic intrabodies to achieve optogenetic suppression of tumor growth in vivo.
Results
Engineering of LOV2-based PhoBIT1
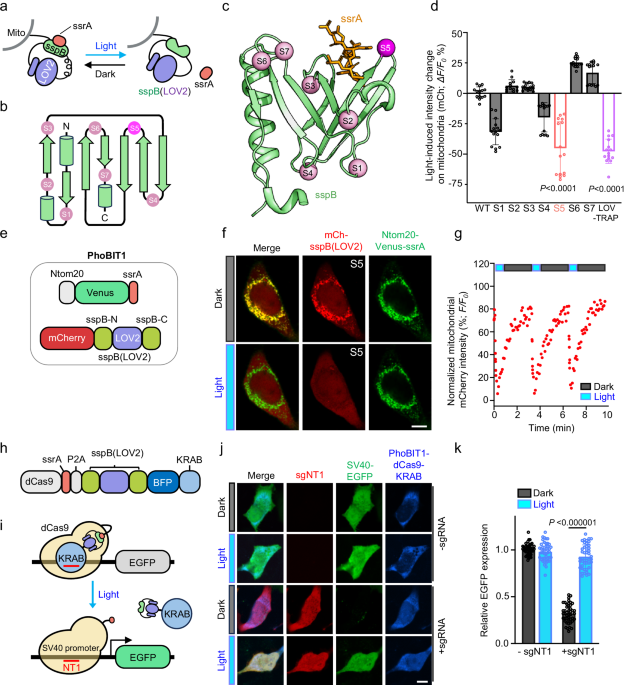
The LOV2 photoswitch has been successfully incorporated into signaling proteins and intrabodies to enable photo-manipulation of protein functions24,25,26,27. Here, we applied a similar approach by inserting LOV2 into sspB to achieve photoswitchable control over its activity. Guided by the 2D topology and 3D structure of sspB, we selected seven insertion sites within the loop regions between α-helices and β-sheets to minimize the risk of disrupting the overall integrity of sspB (Fig. 1a, b and Supplementary Fig. 1a, b). We envisioned that blue light-induced conformational changes in LOV2 would allosterically modulate the ssrA binding pocket of the LOV2-sspB chimera (hereafter designated as “sspB(LOV2)”), thus enabling photoswitchable control over the interaction between sspB(LOV2) and ssrA.

a Schematic of a mitochondria translocation assay to assess light-dependent dissociation between mitochondria-anchored ssrA and engineered photo-responsive sspB. LOV2 is inserted into sspB to generate a hybrid protein, sspB(LOV2). b, c 2D topology (b) and 3D structure (c) of sspB (green; PDB entry: 1TWB) with LOV2 insertion sites indicated by spheres. The best-performing insertion site, S5, was highlighted in magenta. d Quantification of light-induced mitochondrial fluorescence signal changes in HeLa cells expressing indicated mCherry-tagged sspB(LOV2) variants upon photostimulation (470-nm, 30% input). LOVTRAP: Ntom20-Venus-LOV2 and mCherry-Zdk1 (Addgene # 81057). Data are shown as mean ± SD. n = 13 or 15 cells from three independent biological replicates (two-sided unpaired Student’s t-test). S5, LOV-TRAP: P < 0.0001. e Domain architectures of PhoBIT1 constructs used in the study. f Confocal images of a HeLa cell co-expressing mCh-sspB(LOV2) (S5; red) with Ntom20-Venus-ssrA (green) in the absence or presence of photostimulation (470-nm, 30% input). Scale bar, 10 µm. g Quantification of mitochondrial mCherry intensities in PhoBIT1-expressing HeLa cells expressing PhoBIT1 subjected to repeated light-dark cycle stimulation (470-nm, 30% input). The half-lives were determined to be 8.5 s (dissociation) and 28.1 s (re-association), respectively. Data are shown as means ± s.e.m. n = 14 cells from three independent imaging fields. Also see Supplementary Movie 1. h Domain architecture of dCas9-KRAB engineered with PhoBIT1 to enable optogenetic control of the CRISPRi system. i Schematic illustrating light-triggered restoration of the CRISPRi machinery determined by EGFP expression. The ssrA tag is fused to the C-terminus of dCas9, and sspB(LOV2) is fused to the N-terminus of BFP-KRAB. j Confocal images of HeLa cells co-expressing the indicated constructs. Scale bar, 10 µm. k Quantification of EGFP expression in HeLa cells co-transfected with sspB(LOV2)-BFP-KRAB, dCas9-ssrA, and SV40-EGFP, with or without sgNT1; with or without stimulation (470-nm, 30% input). Fluorescence was normalized to the no sgNT1 control in the dark. n = 45 cells from three independent experiments. Data are presented as means ± SD. Statistical significance was determined with two-sided unpaired Student’s t-test. ***P < 0.000001. (Source Data).
To monitor the light-dependent interaction between sspB(LOV2) and ssrA, we fused a mitochondrial outer membrane localization motif from Ntom20 to ssrA and co-expressed sspB(LOV2) in the same mammalian cells (Fig. 1c). LOV2 insertion differentially interfered the interaction between sspB(LOV2) variants and ssrA in the dark, with moderate decrease at sites 1 and 7, while no significant change observed at site 2, 3, 4, 5, and 6 (Supplementary Fig. 1c-d). Upon 470-nm photostimulation, sspB(LOV2) variants S6 and S7 showed increased co-localization with mitochondria-anchored ssrA. In contrast, variants S1, S4, and S5 exhibited varying degrees of light-induced dissociation from mitochondria, with S5 showing the most pronounced dynamic change (Fig. 1d). Compared to the established LOVTRAP system11, the sspB(LOV2) variant S5 showed comparable degree of dissociation upon blue light stimulation (Fig. 1d). Consequently, the combination of the sspB(LOV2) variant S5 with ssrA was designated as the photo-inducible binary interaction tool 1 (PhoBIT1) for subsequent applications (Fig. 1e). Further characterization of PhoBIT1 kinetics revealed a dissociation half-life of 8.5 s and a re-association half-life of 28.1 s (Fig. 1f, g and Supplementary Movie 1). To assess the performance of PhoBIT1 over prolonged expression, we evaluated light-induced dissociation at 24 and 48 h post-transfection (Supplementary Fig. 1e). No significant differences were detected in dissociation efficiency or expression levels, with light-induced dissociation fold changes of 0.58 at 24 h and 0.60 at 48 h (Supplementary Fig. 1f). In summary, we have established PhoBIT1 as a reversible, light-induced dissociation system that operates as a “light-OFF” switch.
PhoBIT1-mediated optogenetic control of CRISPRi
The clustered regularly interspaced short palindromic repeats interference (CRISPRi) system, which leverages the dCas9-KRAB effector, has emerged as a powerful tool for targeted suppression of gene transcription28. To achieve precise light-dependent regulation of CRISPRi activity, we engineered PhoBIT1 into the system by inserting it between dCas9 and BFP-KRAB. Specifically, we fused the ssrA tag to the C-terminus of dCas9 and sspB(LOV2) to the N-terminus of BFP-KRAB (Fig. 1h). A P2A self-cleaving peptide ensured approximately equimolar co-expression of dCas9-ssrA and sspB(LOV2)-BFP-KRAB29. In the dark, sspB(LOV2)-BFP-KRAB binds dCas9-ssrA via the PhoBIT1 module, enabling CRISPRi-mediated transcriptional suppression at the SV40 promoter targeted by sgNT1, a single-guide RNA designed to target this region upstream of an EGFP reporter gene (Fig. 1i). We observed up to 60% repression of EGFP expression (Fig. 1j, k). Upon blue light stimulation, sspB(LOV2)-BFP-KRAB dissociated from dCas9-ssrA, thereby relieving repression and restoring robust EGFP expression (Fig. 1j, k). Together, by integrating PhoBIT1 into the CRISPRi machinery, we have developed a light-responsive system that offers precise control of gene regulation.
PhoBIT1 enables optical control of GPCR activation
Protease-activated receptors (PARs) comprise a subfamily of G protein-coupled receptors (GPCRs) that are activated through proteolytic cleavage of their N-terminal exodomain30,31. This cleavage exposes a tethered agonist peptide, which in turn docks to the binding pocket formed by PAR transmembrane domains to initiate receptor activation (Fig. 2a). The PAR family encompasses four subtypes (PAR1-4), all of which can be activated by proteases such as thrombin, matrix metalloproteinases (MMPs), and factor Xa in response to (patho)physiological cues32. Here, we sought to mimic protease-induced PAR activation using light by obviating the need for proteases. To achieve this, we engineered photoactivable PARs, termed optoPARs, by combining PhoBIT1 with constitutively active, cleaved PAR variants (cPAR; Fig. 2b). Specifically, we attached the ssrA tag to the N-terminus of a cleaved PAR and co-expressed sspB(LOV2)-TM. The latter was directed to the cell surface by fusing sspB(LOV2) to the N-terminus of the single transmembrane (TM) domain derived from the platelet-derived growth factor receptor beta (Fig. 2c). We reasoned that the interaction between ssrA and sspB(LOV2) in the dark would effectively sequester the peptide ligand, preventing it from accessing the binding pocket and maintaining PAR in an inactive state. Upon blue light stimulation, dissociation of sspB(LOV2) from ssrA would release the tethered ligand, allowing it to engage the receptor and trigger PAR activation, thereby eliciting downstream signaling (Fig. 2b).

a, b Schematic illustrating the engineering of OptoPAR using PhoBIT1 and PAR-Tango. a Activation of wild-type (WT) PAR-Tango by an endogenous protease, such as thrombin, which cleaves the N-terminal exodomain (40–50 residues) to unmask a new N-terminus. This exposed N-terminal peptide acts as a tethered agonist to activate PAR, subsequently causing the recruitment of β-arrestin fused with TEV protease (TEVp) to the C-terminus of the PAR. The C-terminus of PAR-Tango contains a V2 vasopressin receptor carboxyl tail that interacts with β-arrestin, a TEV cleavage site, and a transcriptional activator (tTA). TEVp cleaves away tTA to initiate its nuclear translocation, which ultimately switches on TdTomato expression. b OptoPAR design utilizing PhoBIT1 to mimic protease-induced PAR-Tango activation with light. In this design, ssrA is tagged to a cleaved PAR to generate ssrA-cPAR-Tango. In the absence of light, ssrA-cPAR-Tango remains inactive due to its interaction with surface-displayed sspB(LOV2), which blocks the N-terminal activating ligand from engaging PAR. Upon light-induced dissociation of ssrA from sspB(LOV2), the N-terminal peptide restores its interaction with PAR-Tango to drive TdTomato expression. c Design of PAR-Tango constructs. Part A (left): Different versions of PAR-Tango, indicating where the ssrA tag is fused at the thrombin cleavage site. Part B (right): Construct design and detection of surface-displayed sspB(LOV2) using immunostaining. FLAG-tagged part B was probed by an anti-FLAG antibody conjugated with Alexa Fluor 488 (green). Scale bar, 10 µm. d Quantification of tdTomato expression in HeLa cells transfected with the indicated constructs, with and without light stimulation. The fold change in light-induced expression is indicated above the bars. n = 100 cells from three independent biological replicates. Data are presented as means ± S.D. e Representative confocal images showing tdTomato expression in HeLa cells transfected with the indicated PAR4-Tango constructs, with and without light exposure. Scale bar, 10 µm. PAR-Tango proteinase-activated receptor, with transcriptional activation following arrestin translocation, cPAR cleaved proteinase-activated receptor, sPAR ssrA-fused cPAR, LOV2 Light-oxygen-voltage-sensing domain 2, TEV tobacco etch virus, TEVcs TEV cleavage site, TM Transmembrane domain, TRE trans-regulatory element. (Source Data).
We leveraged the Tango assay to monitor PAR activation, wherein β-arrestin fused with a tobacco etch virus protease (TEVp) is recruited to the C-terminus of a PAR-tango construct upon activation33,34. This interaction facilitates proteolysis at the TEVp cleavage site (TEVcs) to unleash the transcriptional factor (tTA). Upon release, tTA translocates to the nucleus to drive the expression of a reporter gene, such as the red fluorescent protein tdTomato, which serves as a convenient indicator of receptor activation (Fig. 2a, b). To accelerate the screening of engineered optoPARs, we developed a custom-built illumination device, termed LUX (see Supplementary Fig. 2 for detailed design specifications). This device provides programmable blue light stimulation with user-defined illumination cycles and patterns, allowing us to exert precise control over experimental conditions. In HeLa cells, we observed higher tdTomato expression in cells co-expressing the cleaved PAR-Tango variants (cPAR-Tango) compared to those expressing the wild-type PAR-Tango, which served as a control (Fig. 2d, e). Co-expression of ssrA-fused cPAR-Tango (abbreviated as sPAR-Tango) also led to increased tdTomato expression, albeit to a lesser extent. When sPAR-Tango was co-expressed with sspB(LOV2)-TM, tdTomato expression was further reduced in the absence of light, consistent with the anticipated sequestration of the ssrA-fused peptide agonist by the surface-anchored sspB(LOV2)-TM. Upon light stimulation using the LUX device, tdTomato expression increased by 2.2- to 5.7-fold, with sPAR4 (A3 + B combination) exhibiting the highest fold change (Fig. 2d, e). This response aligns with light-induced dissociation of ssrA from sspB(LOV2)-TM, hence enabling the activation of sPAR-tango and subsequent downstream signaling (Fig. 2b). To determine whether the downstream pathways inherent to PAR4 activation can be triggered by light, we assessed Ca2+ influx mediated through the Gαq-PLCβ-PIP2-IP3 axis using the ultra-sensitive Ca2+ indicator NEMOf (Supplementary Fig. 3a). Upon blue light stimulation, we observed a 4.7-fold increase in NEMOf intensity with a half-life of 25.3 s, consistent with light-induced activation of Gαq signaling (Supplementary Fig. 3b–d).
To further evaluate the advantage of the compact size of PhoBIT1, we replaced the light-sensitive component of optoPAR4, which showed the strongest light-induced activation among engineered optoPARs, with Zdk1 and LOV2 (Supplementary Fig. 4a) from the LOVTRAP system. We fused the smaller Zdk1 (59 amino acids) to the N-terminus of cleaved PAR4 (cPAR4) and displayed the larger LOV2 extracellularly. Although this configuration did not significantly affect protein localization (Supplementary Fig. 4a, right), the LOVTRAP-based construct failed to elicit light-dependent PAR4 activation, as evidenced by the lack of tdTomato reporter expression (Supplementary Fig. 4b). We reasoned that Zdk1, despite its modest size (Supplementary Table 1), may have impose steric hindrance on the agonist-embedded N-terminus of cPAR4, preventing effective interaction with the receptor binding pocket and thereby impairing receptor activation. In contrast, fusion of the ssrA tag (7 amino acids) with the N-terminus of cleaved PAR4 did not abolish receptor activation, thus indicating the advantage of PhoBIT1 for applications requiring intradomain insertion.
To investigate the elevated basal activity observed in the Tango assay (Fig. 2d, PAR4 A3 + B group), we adjusted the stoichiometry of Part A (ssrA-PAR4) and Part B (sspB(LOV2)-TM) by co-transfecting cells with varying amounts of Part B plasmid (Supplementary Fig. 4c). Increasing Part B expression reduced leaky tdTomato expression in the dark, suggesting that excess sspB(LOV2)-TM enhances sequestration of ssrA-PAR4. However, at a 5:1 ratio, light-induced activation diminished, likely due to plasmid overload impairing Part A expression. By fine-tuning the ratio of Part B to Part A, we achieved a greater light-induced fold change than the 5.7-fold observed with sPAR4 (Fig. 2d), while simultaneously minimizing basal activity (Supplementary Fig. 4c). Collectively, we have pioneered a strategy for optogenetic manipulation of GPCR activity by leveraging the PhoBIT1 system, which paves the way for future interrogation of GPCR activation dynamics and cellular responses.
Engineering of CRY2-based PhoBIT2
Next, we set out to use the similar building blocks to engineer a “light-ON” switch. Our engineering strategy involved two key steps: (i) systematically introducing mutations in both the ssrA and sspB components to minimize background interactions in the dark, and (ii) enabling light-dependent association between ssrA and sspB variants by fusing the photolyase-homology domain of cryptochrome 2 (CRY2) to the sspB component. We reasoned that light-induced oligomerization of CRY2-sspB would enhance its binding strength for ssrA, thereby creating a robust and tunable light-dependent binary interaction system (Fig. 3a, b). Bearing these in mind, we performed a deep mutational scanning of the ssrA heptapeptide by generating a library of 140 ssrA mutants for evaluation.

a Schematic of PhoBIT2 design. CRY2 is fused to sspB to allow oligomerization, thereby enhancing its binding with the ssrA tag upon blue light stimulation. Mutations are introduced into both components to minimize the background interaction in the dark. The combination of ssrA2 (mutant A2C) and sspB2 (mutant A56F) is used to generate PhoBIT2, which displays the lowest background while retains strong light-inducible heterodimerization. b The 3D structure of the ssrA-sspB complex (PDB entry: 1TWB), with the optimized residues in PhoBIT2 (yellow, A2C in ssrA; magenta, A56F in sspB) indicated. c Schematic of a bioluminescence resonance energy transfer (BRET) assay design to screen ssrA mutants. ssrA mutants were anchored on mitochondria via fusion to Ntom20 with a Venus fluorescent tag, whereas mCherry-sspB-NanoLuc (NLuc) is located in the cytoplasm. The binary interaction between ssrA mutants and sspB allows the donor (NLuc) to transfer energy to the acceptor (Venus), resulting in a high BRET ratio. The Venus emission intensity over the summed emission intensity of NLuc emission is used to calculate the BRET ratio. d Quantification of BRET ratios for screened ssrA mutants. The BRET ratio for the wild-type ssrA-sspB interaction was normalized to 1 for comparison. e Heatmap showing the BRET ratio corresponding to each mutated position in the ssrA peptide following deep mutational scanning. f Left, cartoon illustration of a mitochondria translocation assay used to assess the relative strength of ssrA-sspB variant interaction in living cells. Right, heatmaps showing the fold-change of mitochondrial mCherry intensity for the indicated sspB variants following photostimulation. g Representative confocal images of HeLa cells co-expressing the indicated combinations of mitochondria-anchored ssrA mutants (Venus-tagged; green) and CRY2-fused sspB mutants (mCherry-tagged; red), before and after photostimulation. Scale bar, 10 μm. h Quantification of basal mitochondrial mCherry signal in the dark state (FDark; X-axis) and the fold-change of mitochondrial mCherry intensity upon light stimulation (FLight/Dark; Y-axis) during ssrA-sspB screening. CRY2olig-CIB1: HeLa cells co-expressing Ntom20-Venus-CIB1 and mCh-CRY2olig. (Source Data).
To assess the interactions between ssrA and sspB variants, we utilized the bioluminescence resonance energy transfer (BRET) assay. This assay detects energy transfer, which occurs only when the donor and acceptor are in close proximity, thereby providing a quantitative measure of molecular interactions35. In our design, the fluorescent protein Venus was fused to a Ntom20-tagged ssrA mutant, serving as a mitochondria-anchored BRET acceptor, while NanoLuc fused to cytosolic sspB acted as the BRET donor (Fig. 3c). Transient co-expression of NanoLuc-sspB and Ntom20-Venus-ssrA variants in HeLa cells produced varying BRET signals, corresponding to different strengths of interaction between engineered sspB and ssrA mutants (Fig. 3d). Among the 140 ssrA mutants screened, only a few demonstrated enhanced binding to sspB compared to WT ssrA, while the majority exhibited reduced binding strengths (Fig. 3d, e). Based on this screening, we selected two mutants, A2C (median BRET ratio) and A2W (lowest BRET ratio), as representative candidates for further optimization and functional characterization.
For sspB optimization, we fused CRY2 to two previously reported sspB variants, R73Q and A56V36, and evaluated their association with ssrA variants (WT, A2C, and A2W) before and after blue light stimulation. Among all combinations tested, Ntom20-Venus-ssrA-A2C paired with mCh-CRY2-sspB-A56V exhibited the most notable light-induced binding by achieving a 3.2-fold increase in colocalization compared to the dark state (Fig. 3f, left, and Supplementary Fig. 5a). Encouraged by this result, we performed a second round of targeted mutagenesis at the A56 residue, systematically substituting it with 19 additional amino acids (Fig. 3f, g). Among the resulting variants, mCh-CRY2-sspB-A56F emerged as the most promising candidate. This variant demonstrated low basal binding in the dark state (Fig. 3g) and exhibited a remarkable 9.9-fold increase in colocalization upon blue light stimulation (Fig. 3f, right, and Supplementary Fig. 5b). Notably, compared to the established light-inducible heterodimerization system CRY2olig/CIB1, the optimized ssrA-A2C and sspB-A56V pair exhibited lower basal binding and higher light-induced association, indicating improved overall performance (Fig. 3h and Supplementary Fig. 5a). In contrast, the ssrA-A2W variant markedly disrupted the interaction with mCh-CRY2-sspB-WT, leading to a diffuse cytoplasmic distribution of mCh-CRY2-sspB-WT in HeLa cells in the dark (Fig. 3g). Upon blue light stimulation, mCh-CRY2-sspB-WT formed clusters that failed to colocalize with mitochondrial-anchored ssrA-A2W (Fig. 3g). Based on these findings, we identified the best-performing pair, consisting of ssrA-A2C (abbreviated as ssrA2) and sspB-A56V (designated as sspB2; Fig. 3h), and subsequently named this optimized ‘Light-ON’ system PhoBIT2.
Optogenetic manipulation of Ca2+ channel activation by PhoBIT2
We next sought to utilize PhoBIT2 to manipulate protein functions in a light-dependent manner. The compact size of the ssrA2 tag makes it a highly attractive tool for insertion into proteins with minimal disruption to their native function. Previous work by us and others have shown that fusing CRY2 to the N-terminus of the cytoplasmic domain of stromal interaction molecule 1 (STIM1ct) at positions 233 or 238 effectively induces STIM1ct oligomerization, thereby triggering Ca²⁺ influx through endogenous ORAI channels (Fig. 4a)37,38,39,40,41,42. However, it remains unclear whether oligomerization at other sites within the context of full-length STIM1ct would elicit similar functional outcomes. CRY2, with its bulky size of nearly 500 residues, poses a risk of disrupting host protein function upon insertion. This limitation can be circumvented by using the considerably smaller ssrA2 tag with just seven residues. To explore this, we strategically inserted the ssrA2 heptapeptide at six locations corresponding to flexible loop regions or major domain boundaries (Fig. 4b): position 276 (between the α1 and α2 helices of the coiled-coil region (CC1)), position 329 (between α2 and α3 of CC1), position 343 (between CC1α3 and the STIM-Orai activating region (SOAR)), position 463 (between SOAR and the proline/serine-rich (PS) region), and position 685 (immediately after the polybasic (PB) domain). We hypothesized that blue light-induced oligomerization of mCh-CRY2-sspB2 and its subsequent docking with ssrA2-inserted STIM1ct would switch on the molecule by overcoming intramolecular inhibition43,44,45,46. This activation would enable STIM1ct to engage and gate ORAI channels, ultimately inducing Ca²⁺ influx (Fig. 4a). Using the genetically-encoded mNeoGreen-based NEMOf Ca2+ sensor as a sensitive readout47, we observed that adding ssrA2 to the position 685 produced the most notable light-induced Ca2+ influx. In contrast, insertion at other positions resulted in either negligible or moderate Ca2+ responses (Fig. 4b, c). In the dark, insertions at positions 276, 343, and 463 showed significantly different responses compared to the control, while others did not. Under light stimulation, all variants except the WT differed significantly from the control (P < 0.0001). Notably, the light-induced activation is comparable to that of the previously established tool, mCherry-CRY2-STIM1ct (233–685) (Fig. 4c)39. Because PhoBIT2-engineered STIM1ct contains a S/TxIP motif that interacts with microtubule plus-end tracking proteins48,49,50, it also exhibited light-dependent comet-like movement along growing microtubule plus ends (Supplementary Fig. 6a and Supplementary Movie 2). The light-induced Ca2+ influx in HeLa cells was fully reversible, with the activation and deactivation half-lives determined to be 0.4 and 2.9 min, respectively (Fig. 4d, e).

a Schematic demonstration of PhoBIT2 coupled with STIM1ct to photo-activate Ca2+ influx through endogenous ORAI channels. STIM1ct, stromal interaction molecule 1 cytoplasmic domain; CRY2, the photolyase homology domain of Arabidopsis cryptochrome 2 (residues 1–498). Created in BioRender. Lee, Y. (2025) https://BioRender.com/qnjigjh. b Domain architecture of human STIM1ct with ssrA2 insertion sites indicated by red triangles. CC1 coiled-coil domain 1, SOAR STIM-Orai activating region, P/S proline/serine-rich region, TRIP the S/TxIP microtubule-binding motif, PB polybasic tail. c Quantification of light-induced changes of intracellular Ca2+ levels (indicated by NEMOf) in HeLa cells co-expressing the indicated ssrA2-inserted STIM1ct variants and mCh-CRY2-sspB2. ssrA2-STIMct (site 685) showed the most notable changes and was used in experiments shown in (d–g). Ctrl: HeLa cells expressing only the calcium indicator NEMOf. WT: STIM1ct (233–685) without ssrA2 insertion. CRY2-STIM1ct: mCherry-CRY2-STIM1ct (233–685) construct previously reported by us. Data are shown as mean ± SD. n = 55, 59 or 60 cells from three independent biological replicates. Statistical significance was determined with two-way ANOVA followed by post-hoc Turkey’s test. d Confocal images of light-dependent Ca2+ influx at the indicated time points. HeLa cells were co-transfected with ssrA2-STIMct (site 685), mCh-CRY2-sspB2, and the NEMOf Ca2+ indicator. Scale bar, 10 µm. e Quantification of reversible light-induced cytosolic NEMOf signal changes. HeLa cells were subjected to three repeated dark-light cycles. n = 11 cells (mean ± s.e.m). f Confocal images showing light-triggered Ca2+-dependent subcellular localization of NFAT1–460-GFP at the indicated time points. The nuclear shape is marked by red dashed lines. Scale bar, 10 µm. g Quantification of Ca2+/NFAT-dependent luciferase reporter gene expression in HEK293 cells expressing mCh-CRY2-sspB2 and STIM1ct without ssrA2 insertion as control or ssrA2 inserted at sites 463 and 685, in the absence (black) or presence (blue) of photostimulation. n = 3 independent biological replicates. *** P = 0.000420 (mean ± s.e.m, Two-sided unpaired Student’s t-test). (Source Data).
To further assess downstream effects of light-induced Ca2+ influx, we monitored the translocation of the nuclear factor of activated-T cells (NFAT), which is dephosphorylated and translocates to the nucleus in response to sustained elevation of cytosolic Ca2+ levels. We co-expressed ssrA2-STIM1ct (site 685) and mCh-CRY2-sspB2 in HeLa cells stably expressing NFAT1–460-GFP. Upon light stimulation, we observed a gradual translocation of NFAT1–460 into the nucleus over the course of one hour, suggesting that the light-induced Ca2+ influx was sufficient to activate the downstream NFAT signaling pathway (Fig. 4f and Supplementary Fig. 6b). To further validate this finding, we employed an NFAT luciferase reporter assay in HEK293T cells as a quantitative measure of NFAT activation. Consistent with the results in HeLa cells, ssrA2-STIM1ct (site 685) induced robust luciferase expression upon blue light stimulation (Fig. 4g). Additionally, we validated the endogenous IL-2 mRNA expression and secretion upon blue light stimulation in Jurkat cells (Supplementary Fig. 7a, b). Jurkat cells co-expressing ssrA2-STIM1ct (site 685)-mCerulean and mCh-CRY2-sspB2 exhibited significantly elevated IL-2 mRNA levels and IL-2 secretion following blue light illumination (Supplementary Fig. 7c–e). In contrast to the NFAT luciferase assay (Fig. 4g), where the 3x NFAT response element (RE) may have contributed to elevated background activity, assessment of endogenous IL-2 showed minimal background activation, providing a more physiologically-relevant assessment of signaling specificity. By contrast, ssrA2-STIM1ct (site 463) and WT STIM1ct (without ssrA2 fusion) did not produce appreciable light-dependent luciferase activity. Congruently, these findings establish that PhoBIT2 can be precisely tailored to photomanipulate STIM1, thereby enabling controlled Ca2+ influx and activation of downstream signaling pathways, such as NFAT, in a light-dependent manner.
PhoBIT2 as an ON-switch for light-induced necroptosis
Building on the insight that the ssrA tag can be incorporated into proteins to elicit photo-activated functional responses, we expanded our applications to include the mixed lineage kinase domain-like (MLKL) protein. MLKL, when activated, undergoes oligomerization and translocates to the plasma membrane (PM) to trigger cell death, a process known as necroptosis51,52,53,54. To achieve light-induced necroptosis, we adapted PhoBIT2 by fusing ssrA2 to the N-terminal fragment of MLKL (MLKL-NT, amino acids 1–140), a key domain critical for necroptosis, and co-expressing mCh-CRY2-sspB2-PB in HeLa cells. In this construct, the polybasic domain (PB) from STIM1 was attached to the C-terminus of mCh-CRY2-sspB2 to enhance PM translocation upon blue light stimulation39,55,56 (Fig. 5a, b).

Scale bar, 10 μm. a Schematic illustrating inducible necroptosis mediated by ssrA2-fused MLKL-NT following its co-clustering with mCh-CRY2-sspB2-PB in the presence of photostimulation. PM plasma membrane, PB polybasic tail from STIM1, MLKL mixed lineage kinase-like domain, NT N-terminal domain (aa 1–140). b Constructs of PhoBIT2-fused MLKL and summary of light-dependent necroptosis events. c Time-lapsed confocal images of HeLa cells co-expressing the indicated constructs. The combination of A2 + B, but not A1 + B, led to the translocation of ssrA2-fused MLKL toward the PM to cause PM rupture (indicated by yellow arrows), a process visualized by Pacific Blue (blue) conjugated Annexin V staining. d Quantification of cytosolic MLKL translocation to PM (red) and Annexin V staining on PM (blue) at the indicated time points. Data are shown as mean ± s.e.m. (n = 7 or 20 cells from three biological replicates). (Source Data).
We hypothesized that blue light-induced PM targeting and co-clustering of mCh-CRY2-sspB2-PB with ssrA2-tagged MLKL-NT would mimic the activation of MLKL to induce necroptosis. To test this, we generated two ssrA2-fused MLKL-NT constructs: one with ssrA2 appended to the N-terminus of MLKL-NT (construct A1) and another with ssrA2 fused between MLKL-NT and mCherry (construct A2). Interestingly, only the A2 construct induced necroptotic cell death in a blue light-dependent manner, despite both constructs displaying light-dependent PM translocation with a half-life of approximately 30 s (Fig. 5c). This finding aligns with previous studies suggesting that N-terminal tagging tends to compromise the functional integrity of MLKL57,58,59,60. Light-induced necroptosis, detected through Annexin V staining, started to occur 6 min post-illumination, accompanied with subsequent membrane rupture (Fig. 5c, d and Supplementary Movie 3). Additionally, MLKL-NT-ssrA2-mCherry exhibited comparable levels of light-induced necroptosis to those of the established tool LiPOP1 following light illumination (Supplementary Fig. 8). Overall, these results demonstrate that PhoBIT2 can be effectively harnessed as a light-controlled ON-switch for necroptosis, which expands its potential for precise modulation of programmed cell death pathways.
Light-inducible STING activation driven by PhoBIT2
We next applied the PhoBIT2 system to modulate innate immune signaling by targeting the stimulator of the interferon gene (STING) pathway. STING is a key mediator downstream of cyclic GMP-AMP synthase (cGAS), which detects cytosolic double-stranded DNA (dsDNA) from sources such as pathogens61,62,63. Upon dsDNA detection, cGAS catalyzes the synthesis of cyclic GMP-AMP (cGAMP), a second messenger that binds to endoplasmic reticulum (ER)-resident STING. This triggers STING oligomerization and its translocation to the ER intermediate compartment and the Golgi64,65. These events facilitate the recruitment of TANK-binding kinase 1 (TBK1) and the transcription factor interferon regulatory factor 3 (IRF3), forming supramolecular organizing centers (SMOCs). TBK1-mediated phosphorylation of IRF3 drives its multimerization and nuclear translocation, where it collaborates with NF-κB to promote the transcription of interferon beta (IFNβ). This process culminates in the release of type I interferons and other proinflammatory cytokines to mount a robust innate immune response65,66.
Here, we tagged ssrA2 to the N- and/or C-terminus of the STING cytosolic domain (cSTING; amino acids 152–379), a region known to be sufficient for downstream cytokine activation65,67. We hypothesized that light-triggered oligomerization of CRY2-sspB2, coupled with its interaction with ssrA2-fused cSTING, could mimic natural STING oligomerization and activate downstream signaling (Fig. 6a). To test this, we screened several configurations of ssrA2-fused cSTING constructs (Part A) and CRY2-fused sspB2 constructs (Part B; Fig. 6b). We noted that placing ssrA2 at the N-terminus of cSTING (construct A2) only resulted in mild interaction with sspB2, whereas positioning it at the C-terminus (construct A3) enhanced co-clustering between cSTING-ssrA2 and CRY2-sspB2. The strongest effect was observed when ssrA2 was fused to both termini of cSTING (construct A4). For Part B, placing sspB2 at the N-terminus (construct B2) yielded the most robust co-oligomerization with ssrA2-fused cSTING (Fig. 6c). In HeLa cells co-expressing the optimal combination of constructs (A4 and B2), we observed rapid oligomerization of cSTING within one minute of blue light illumination (Fig. 6d, e and Supplementary Fig. 9a–c). As control, GFP alone (construct A0) and cSTING lacking ssrA2 fusion (construct A1) did not exhibit any light-dependent co-localization with sspB2-mCh-CRY2 (Supplementary Fig. 9a, b).

a Schematic demonstrating light-dependent activation of STING signaling via coupling PhoBIT2 with cytosolic STING (cSTING; aa 152–379). Light-dependent oligomerization of sspB2-CRY2 leads to co-clustering of ssrA-cSTING, which in turn activates downstream TBK1 and IRF3 phosphorylation. Next, phosphorylated IRF3 (p-IRF3) undergoes nuclear translocation to trigger type I interferon responses. b Domain architectures of PhoBIT2-cSTING variants used in the study. Part A consists of GFP control, GFP-cSTING, either tagged or untagged with ssrA at the N and/or C termini. Part B features mCherry, CRY2, and sspB2 arranged in two different configurations. c Heatmap showing the degree of oligomerization by measuring the fold change in GFP intensity (Part A) relative to mCherry (Part B) following light stimulation. d Confocal images of HeLa cells co-expressing the indicated constructs before and after photostimulation. Scale bar, 10 μm. e The intensity profiles of GFP-ssrA2-cSTINGct-ssrA2 (A4; green) and sspB2-mCh-CRY2 (B2; red; across the red line) in response to photostimulation. f Western blot analysis of TBK1, IRF3, and their phosphorylated forms, in A549 cells expressing the indicated constructs before and after photostimulation. GAPDH is used as the loading control. g ELISA measurements of secreted IFN-β. A549 cells expressing the indicated constructs were either kept in the dark or exposed to pulsed blue light (20 s ON and 30 s OFF for 8 h). Data are shown as mean ± s.e.m from three biological replicates. Statistical analysis was performed using two-way ANOVA followed by Turkey’s post hoc test. Polyinosinic:polycytidylic acid (Poly I:C) is a synthetic double-stranded RNA (dsRNA) analog that acts as an immunostimulant in the assay. (Source Data).
To confirm light-dependent activation of STING signaling, we assessed the phosphorylation of TBK1 and IRF3, two key downstream effectors67. A549 cells, chosen for their intact cGAS-STING signaling components and ease for genetic manipulation, were transfected with the optimal construct combination (A4 + B2), while cSTING lacking ssrA2 (A1 + B2) was used as a negative control. After 30 min of blue light stimulation, robust phosphorylation of both TBK1 and IRF3 was observed in the A4 + B2 group but not in the A1 + B2 group (Fig. 6f and Supplementary Fig. 9d). To independently validate STING pathway activation, we performed an ELISA assay to quantify the production of interferon beta (IFNβ) by using untagged cSTING as a negative control and poly I:C treatment as a positive control. Consistent with the immunoblotting data, ELISA analysis revealed abundant IFNβ secretion in response to light stimulation for the A4 + B2 group (Fig. 6g). Though not statistically significant, we did observe a slight elevation in IFNβ secretion from the A4 + B2 group without light stimulation. We speculate that the background activity may arise from overexpression of the cSTING fragment. This limitation could potentially be addressed by optimizing the minimal activation domain through truncation of the STING fragment, which is a feasible strategy that has proven effective in several previous studies68. Together, our findings demonstrate the versatility and effectiveness of PhoBIT2 as an optogenetic switch, which enables remote control of STING-mediated innate immune signaling through light-induced co-oligomerization and activation of downstream effectors.
PhoBIT2 allows light-inducible monobody-target recognition
The applications described above successfully demonstrated the integration of PhoBIT2 into overexpressed signaling proteins with predominant helical secondary structures. Next, we sought to determine whether this engineering approach could be adapted to a protein of interest with a beta-sheet scaffold, such as monobody, and assess its potential to control endogenous targets. As a test case, we selected a monobody that specifically recognizes the oncogenic fusion protein Breakpoint Cluster Region-Abelson Murine Leukemia (BCR-ABL). The BCR-ABL gene arises from a fusion between the BCR gene on chromosome 22 and the ABL1 gene on chromosome 9, a genetic aberration frequently found in chronic myelogenous leukemia (CML)69. This fusion protein encodes a constitutively active tyrosine kinase that drives oncogenic transformation by activating several pro-growth and pro-survival signaling pathways70,71,72,73. An engineered tandem fusion monobody, HA4-7c12, has been reported to disrupt BCR-ABL activity, thus promoting apoptosis in CML-derived cells such as K562 cells74. This makes it an ideal model for testing the therapeutic potential of our engineered approach.
To enable inducible suppression of BCR-ABL kinase activity as a leukemia mitigation strategy, we incorporated the PhoBIT2 system into the tandem monobody HA4-7c12, making monobody-target recognition photoswitchable. By introducing the ssrA2 tag at selected positions within HA4-7c12 and harnessing the light-driven oligomerization of CRY2clust-sspB2, an optimized CRY2 photoreceptor with enhanced photosensitivity75, we aimed to enhance binding to the SH2 domain of BCR-ABL following photostimulation, thereby inhibiting its phosphorylation and suppressing leukemogenesis (Fig. 7a).

a Schematic illustrating inhibition of BCR-ABL kinase activity by ssrA2-fused HA4-7c12 fusion monobody upon photostimulation. In the dark state, the BCR-ABL oncofusion protein in K562 cells is not inhibited by ssrA2-inserted monobody HA4-7c12, maintaining a high kinase activity to support leukemia cell growth. Upon blue light stimulation, CRY2-sspB2 oligomerizes and enhances the binding of ssrA2-fused monobody with its antigen BCR-ABL, subsequently inhibiting phosphorylation of BCR-ABL in K562 cells to suppress leukemia. b The 3D structure showing a monobody (clone 7c12) complexed with the ABL-SH2 domain (PDB entry: 3T04), with the ssrA2 insertion sites indicated by spheres. c Quantification of light-induced mitochondrial intensity change (Δ7F/F0) of indicated ssrA2-engineered monobody variants. n = 15 cells from three biological replicates. Data are shown as mean ± s.e.m. d Confocal images of HeLa cells co-expressing fusion monobody HA4-7c12 with or without ssrA2 insertion (top panel, WT; bottom panel, S2 variant) and Ntom20-Venus-Abl-SH2 upon blue light stimulation. Enlarged mitochondria regions are shown in white boxed insets. Scale bar, 10 µm. e Constructs used for viral transduction in K562 cells. Part A: Fusion monobody HA4-7c12 with (A1) or without (A2) ssrA2 insertion (red bar). Part B: mCerulean-CRY2-sspB2. Created in BioRender. Lee, Y. (2025) https://BioRender.com/t9kki1m. f Western blot detecting endogenous BCR-ABL and its phosphorylation state in K562 cells expressing indicated constructs and the non-expression control (K562WT), with or without photostimulation. GAPDH is used as the loading control. g Schematic illustrating the in vivo experimental setup. 5 × 10⁶ K562 leukemia cells expressing indicated constructs were injected (s.c.) in the flank of SCID mice. Starting from day 2 post-K562 inoculation, mice were either subjected to photostimulation for 11 days or maintained in the dark. Created in BioRender. Lee, Y. (2025) https://BioRender.com/t9kki1m. h Images of isolated tumors for the indicated groups on day 15. i, j Quantification of xenograft tumor sizes (i) and tumor weights (j). n = 7 mice (mean ± s.e.m.). j Line at median for the scatter plot. Statistical analysis was performed using two-way ANOVA followed by Turkey’s post hoc test. (Source Data).
The tandem monobody HA4-7c12 engages BCR-ABL via three key loops: BC, DE, and FG loops74. To achieve light-dependent monobody-target recognition, we inserted ssrA2 into eight distinct positions within the loop regions connecting beta-sheets in the 7c12 moiety (Fig. 7b and Supplementary Fig. 10a). Again, we adopted a mitochondria co-localization assay to monitor the relative strength of interactions between mitochondria-anchored SH2 domain derived from BCR-ABL (construct Ntom20-Venus-ABL-SH2) and ssrA2-HA4-7c12 variants before and after light illumination. Among the tested variants, S2 showed minimal pre-binding to Ntom20-Venus-ABL-SH2 in the absence of light but exhibited a notable increase in colocalization upon photostimulation (Fig. 7c, d). In contrast, the WT HA4-7c12 exhibited strong pre-binding to the mitochondria-anchored ABL-SH2 domain regardless of photostimulation (Fig. 7d). Together, we engineered a light-controllable tandem monobody that could conditionally target the BCR-ABL oncoprotein, paving the way for testing optogenetic strategies in leukemia intervention.
PhoBIT2-monobody enables light-controlled tumor suppression
Next, we investigated the inhibitory effect of our engineered light-switchable HA4-7c12 on BCR-ABL Y412 phosphorylation, an indicator of activation of this pro-oncogenic kinase76. To assess this, we transduced BCR-ABL-expressing K562 leukemia cells with lentiviruses encoding either mCherry-HA4-7c12 with (A2 + B) or without ssrA2 (A1 + B), along with mCerulean-CRY2clust-sspB2 (Fig. 7e). Western blot analysis revealed light-dependent inhibition of Y412 phosphorylation in K562 cells co-expressing the A2 + B constructs (Fig. 7f and Supplementary Fig. 10c), whereas cells co-expressing A1 + B (lacking ssrA2) showed minimal change upon light stimulation. This is consistent with the weaker pre-binding observed with ssrA2-HA4-7c12 in the dark (Fig. 7d). The inclusion of a K562WT control (Fig. 7f, left two lanes) confirmed high basal Bcr-Abl phosphorylation levels. These results confirmed that the light-mediated effect was specific to the ssrA2-incorporated HA4-7c12 monodoby chimera. Additionally, K562 cells expressing the A2 + B constructs showed a pronounced decrease in cell proliferation upon light exposure (Supplementary Fig. 10b), indicating that light-induced BCR-ABL inhibition effectively suppressed CML cell growth in vitro.
To rigorously validate these findings in vivo, we moved on to assess the degree of light-induced tumor suppression using a xenograft model of CML. K562 cells co-expressing mCerulean- and mCherry-tagged constructs were sorted via flow cytometry to isolate double-positive populations and subsequently injected subcutaneously into SCID mice. Two days post-injection, the mice were either shielded or exposed to pulsed blue light stimulation68, which continued daily for 11 days, with tumors harvested on day 15 (Fig. 7g). Following photostimulation, mice receiving the A2 + B constructs exhibited a substantial reduction in tumor burden, whereas the control group receiving WT K562 cells showed no significant changes in size or weight, regardless of light exposure (Fig. 7h–j). In summary, the optimized PhoBIT2 system, combined with the BCR-ABL-binding tandem monobody HA4-7c12, achieved light-dependent inhibition of BCR-ABL phosphorylation and tumor suppression both in vitro and in vivo.
Discussions
In the present study, we introduced the photo-inducible binary interaction tool (PhoBIT), designed by harnessing the protein-protein interaction between ssrA and sspB—proteins derived from the bacterial degradation machinery—to function as both OFF-switch (PhoBIT1) and ON-switch (PhoBIT2) modules. In PhoBIT1, a LOV2 domain acts as an allosteric switch to photo-modulate the ssrA binding pocket on sspB, creating an “OFF” switch that enables light-induced dissociation between ssrA and sspB. As for PhoBIT2, we leveraged the light-dependent oligomerization of CRY2 to enhance weak interactions between sspB2 (A56F) and ssrA2 (A2C), establishing a robust “ON” switch to photo-manipulate target protein activities. The functionality of the PhoBIT systems was demonstrated across diverse applications, including transcriptional suppression via dCas9-KRAB-mediated CRISPRi, activation of GPCR using PAR receptors, modulation of the CRAC channel via engineered STIM1, induction of necroptosis, activation of innate immune signaling through the STING pathway, and therapeutic intervention against leukemia through monobody-mediated inhibition of the oncogenic BCR-ABL fusion protein. Notably, our engineered PhoBIT system incorporates LOV2 or CRY2 as photosensory domains, introducing specific mutations into these well-characterized photoswitches could potentially tune the light-induced ON/OFF kinetics77,78,79. This flexibility, with the deactivation half-lives varying from seconds to hours, offers a versatile platform for achieving precise temporal control over protein interactions, tailored to a variety of experimental and therapeutic needs.
While PhoBITs primarily utilize blue-light-responsive photoswitches (LOV2 and CRY2), optogenetic systems operated by alternative wavelengths offer complementary advantages. For instance, the UV-B-responsive UVR8-COP1 system provides confined spatial control due to the limited penetration depth of UV light. Conversely, red and near-infrared (NIR) light-responsive systems, such as PhyB-PIF and BphP1-QPAS1, enable deeper tissue penetration and are particularly useful for in vivo applications1,15. Integrating these alternative modules into future PhoBITs design could significantly expand the optogenetic toolbox, enabling multiplexed regulation of protein interactions. By leveraging different wavelengths, future optogenetic control could achieve even greater precise and orthogonality in complex biological systems.
A notable advantage of the PhoBIT system is the compact size of the ssrA or ssrA2 tag, which consists of only seven amino acids. This minimal size allows for easy integration of ssrA or ssrA2 into any protein of interest with low risk of disrupting the host protein function. In contrast, many existing optogenetic modules—whether one-component allosteric photoswitches or two-component optical dimerization/dissociation tools—are considerably larger in size (Supplementary Table 1). Their bulky size can complicate integration into target proteins and may readily perturb protein functionality. For example, replacing the ssrA tag (7 amino acids) in optoPAR4 with Zdk1 (59 amino acids) resulted in a loss of light-dependent PAR4 activation, possibly due to the steric hindrance imposed by the bulky Zdk1 on the ligand binding of the agonist-embedded N-terminus of cPAR4 (Supplementary Fig. 4a, b). In contrast, the minimal size of ssrA tag enabled flexible fusion to the N-terminus of PAR4 without compromising receptor function, indicating the practical advantage of its compact design for applications requiring minimal structural perturbation. Very recently, Liu et al. demonstrated the binder/tag (ssrA/sspB) approach for probing protein conformation through single particle tracking or FRET in living cells23. In this creative approach, the interaction between ssrA and sspB depends on the solvent exposure of ssrA, which is dictated by the conformation of the protein into which ssrA is inserted. However, this binder/tag strategy is limited to sensing protein conformations and cannot be used to actively manipulate or actuate proteins of interest. To address this limitation, our PhoBIT system builds upon the minimally disruptive nature of the ssrA tag while introducing optogenetic control. Through systematic mutagenesis of both ssrA and sspB components, we optimized their binding affinities to reduce basal interaction and maximize the dynamic range of interaction changes upon photostimulation. Furthermore, we integrated the LOV2 photosensory domain into sspB to achieve light-dependent dissociation between ssrA and sspB. These advancements enable precise, light-controlled modulation of the function of ssrA- or ssrA2-tagged proteins, expanding the utility of this approach from purely observational to dynamic and functional regulation.
The engineering of PhoBIT1-caged PAR introduces an innovative approach for optogenetically controlling G protein-coupled receptors (GPCRs), expanding the repertoires of existing optogenetic GPCR tools. Current strategies in GPCR optogenetics fall primarily into two categories: canonical opsins (optoGPCRs) and opsin-GPCR chimeras (optoXRs)1,80,81,82,83. OptoGPCRs are naturally light-sensitive opsins that directly activate GPCR pathways upon illumination, whereas optoXRs are engineered chimeric receptors that combine the light-sensitive domain of opsins with the intracellular loops of corresponding GPCRs. Despite their versatility, optoXRs face inherent challenges due to their chimeric nature, which limits their ability to fully replicate native GPCR properties, including ligand binding, G protein coupling, and biased signaling82. In contrast, PhoBIT1-caged PAR enables optogenetic control of GPCRs without altering their native structure, preserving intrinsic dynamics and functional specificity to maintain physiological activation and desired signaling profiles. This approach is readily adaptable to a wide range of peptide-liganded GPCRs84,85,86,87, offering a versatile and minimally invasive tool for studying GPCR functions while preserving their native conformations.
The translational potential of PhoBIT-engineered therapeutic intrabody is exemplified by its ability to conditionally suppress leukemia driven by the BCR-ABL oncogene (Fig. 7). Current standard-of-care treatments for chronic myeloid leukemia (CML) involve the use of tyrosine kinase inhibitors, such as imatinib, which effectively suppress BCR-ABL phosphorylation88. However, the emergence of drug resistance, often due to BCR-ABL mutations, poses a significant challenge, frequently leading to relapse in patients89. The PhoBIT-engineered monobody offers a promising alternative by specifically targeting BCR-ABL activity in a controlled, conditional manner, hence presenting a complementary strategy to overcome TKI resistance and improve treatment outcomes. Beyond its therapeutic implications, this approach serves as an excellent proof-of-concept model for the broader application of PhoBIT-engineered systems in photo-controlling various antibody-like scaffolds, including affibodies, nanobodies, and designed protein binders90,91,92,93,94, to target oncogenic and other disease-associated pathways.
In summary, the PhoBIT system enables precise, light-dependent association and dissociation between two proteins of interest, providing a powerful and versatile platform for optogenetic control of diverse biological processes. Its high modularity, ease of integration into existing systems, and minimal impact on native protein function make it a robust and highly adaptable tool, which offers considerable advantages for both basic research and translational applications.
Methods
Ethical statement
We confirm that this research complies with all relevant ethical regulations. All animal studies were approved by the Institutional Animal Care Use Committee (IACUC) of the Texas A&M University Institute of Biosciences and Technology.
Chemicals and reagents
For molecular cloning and plasmid construction, KOD Hot Start DNA polymerase was purchased from EMD Millipore, MA, USA. Restriction enzymes, T4 ligase kit, and NEBuilder HiFi DNA Assembly (M5520AVIAL) were purchased from New England Biolabs, Ipswich, MA, USA. For cell culture, the HeLa (CCL-2), HEK293T (CRL-3216), A549 (CCL-185), Jurkat (TIB-152), and K562 (CCL-243) cell lines were purchased from ATCC. DMEM was purchased from Sigma-Aldrich, St. Louis, MO, USA, and RPMI 1640 medium was purchased from Corning, USA. Fetal bovine serum was purchased from Cytiva, USA, and the penicillin-streptomycin cocktail was purchased from Corning, USA. Four-well 35-mm glass-bottom dishes were purchased from Cellvis, USA, and Lipofectamine 3000 transfection reagent was purchased from Thermo Fisher Scientific, USA. For western blot, RIPA buffer (#89901) was purchased from Thermo Fisher Scientific, USA, while protease inhibitor cocktail (#P3100-010), phosphatase inhibitor cocktail (#P3200-001), and West-Q Pico Dura ECL Solution were purchased from GenDEPOT, Katy, TX, USA. Nitrocellulose membranes were purchased from Bio-Rad, USA. For immunofluorescence, paraformaldehyde (PFA) was purchased from Electron Microscopy Sciences (EMS), USA, and Alexa Fluor 488-conjugated goat anti-mouse antibody (#A28175) was purchased from ThermoFisher, USA. For NFAT-dependent luciferase assay, phorbol myristate acetate (P8139) was purchased from Sigma-Aldrich, USA. Bright-Glo Luciferase Assay System (E2610) was purchased from Promega, USA, For ELISA assays, Ionomycin was purchased from Sigma-Aldrich, USA. Human IL-2 ELISA kit was purchased from Thermo Fisher Scientific, USA. The human IL-2 ELISA kit was purchased from Thermo Fisher Scientific, USA. The hIFN-β ELISA assay (luex-hifnbv2) was purchased from InvivoGen, USA. Poly I:C was purchased from Sigma-Aldrich, USA. For cell death imaging, Annexin V (NC9818309) was purchased from Biolegend, USA. For animal studies, SCID beige mice (CBSCBG) were purchased from Taconic Biosciences. Antibodies used in the study were summarized in Supplementary Table 2.
Molecular cloning and plasmid construction
The plasmids were all created using the standard restriction enzyme digestion and ligation method. KOD Hot Start DNA polymerase was used for PCR amplification. For ssrA mutation screening, we ordered primers with three “N” base pairs on reversed primer to introduce single mutations at the desired amino acid position. The reverse random primers were used together with forward primers to PCR out Venus and introduce single mutations into ssrA at the C-terminus of Venus, resulting in 140 Ntom20-Venus-ssrA variants. pTriEX-NanoLuc-sspB was generated by inserting NanoLuc into the plasmid using restriction enzymes NcoI and HindIII. ssrA-STIM1ct variants were generated by introducing the ssrA tag in the forward and reverse primers, using STIM1ct-mCerulean as templates for PCR. mCherry-CRY2-sspB was constructed by inserting sspB into the N1-mCherry-CRY2 vector using restriction enzymes BspEI and BamHI. pGL4.30[luc2P/NFAT RE/Hygro] was purchased from Promega. FLAG-MLKL(1–140)-ssrA2-mCherry and ssrA2-MLKL(1–140)-mCherry were constructed by replacing MLKL(1–140)-CRY2 with FLAG-MLKL(1–140)-ssrA2 and ssrA2-MLKL(1–140), respectively, using XhoI and EcoRI. mCherry-CRY2-sspB2-PB was constructed by inserting PB into mCherry-CRY2-sspB2 using XhoI and BamHI. Ntom20-Abl-SH2 was constructed by amplifying the SH2 domain of BCR-ABL from pDONR223-ABL1 (Addgene # 23939) and cloned it into the pTriEX vector using BamHI and XhoI. mCh-sspB(LOV2) was constructed by inserting LOV2 into pTriEX-NES-mCherry-sspB using NEBuilder HiFi DNA Assembly. PAR1-4 were cloned from the PRESTO-Tango plasmid kit. The PRESTO-Tango plasmid kit was a gift from Bryan Roth (Addgene kit # 1000000068). cPAR1-4-Tango variants were generated by truncating the N-terminal sequence at the reported protease cleavage sites. ssrA tags were added to the N-termini of cPAR1-4 by introducing forward primers and PCR amplifying the whole cPAR1-4 plasmids together with reverse primers. pDisplay-LOV2-sspB was generated by replacing the mSA of pDisplay-mSA-EGFP-TM (Addgene # 39863) with sspB-LOV2 using ApaI and AscI, followed by deletion of EGFP using PCR. pAAV-beta-arrestin2-HA-TEV219 was a gift from Dr. Alice Ting (Addgene # 104845). pTRE-tdTomato was a gift from Dr. Connie Cepko (Addgene # 50798). Key primers used in plasmid construction were summarized in Supplementary Table 3.
Cell culture and transfection
HeLa, HEK293T, Jurkat, and A549 cells were cultured in DMEM, while K562 and Jurkat cells were cultured in RPMI 1640. For Jurkat cells, 2 mM L-glutamine (Sigma-Aldrich) was supplemented. Both DMEM and RPMI 1640 media were maintained at 37 °C with 5% CO2 and supplemented with 10% fetal bovine serum and 1% penicillin-streptomycin cocktail. For fluorescence imaging experiments, cells were seeded in four-well 35-mm glass-bottom dishes one day before transfection. The plasmids were transfected using Lipofectamine 3000 transfection reagent according to the manufacturer’s instructions. Cells were imaged 18–24 h after transfection.
Mice
All animal studies were approved by the Institutional Animal Care and Use Committee (IACUC) of the Texas A&M University Institute of Biosciences and Technology. Female SCID beige mice (CBSCBG), 6 to 8 weeks of age, were used in all experiments. All animals were housed at the Institute of Biosciences and Technology, Texas A&M University (Houston, TX, USA), under specific pathogen-free (SPF) conditions and standard housing parameters (23–26 °C, 40%–60% humidity, under 12-h light/dark cycle). The maximum permitted tumor diameter was 20 mm.
Design of the LUX illuminator
The LUX illuminator is a customizable, cost-effective device designed for high throughput optogenetics research. Its modular design, illustrated in the exploded view (Supplementary Fig. 2a), facilitates easy assembly and component swapping, making it adaptable to various experimental needs. The assembled device and the LED array close-up highlight its compact design and the individually programmable LEDs, capable of running up to 96 different sequences simultaneously (Supplementary Fig. 2b, c). The bill of materials lists affordable, commercially available components, ensuring accessibility (Supplementary Fig. 2d). The microcontroller and PCB design along with the internal component layout emphasize robust engineering and ease of assembly (Supplementary Fig. 2e, f). The circuit diagram provides detailed electrical connections, crucial for accurate replication and modification (Supplementary Fig. 2g). The LUX illuminator is user-friendly, programmable via a custom Excel worksheet, and includes enhancements like a 6800 mAh battery and a micro-SD card slot for extended use and easy program transfer.
Western blot analysis
On day 1, cells were trypsinized and washed three times with cold PBS, then lysed directly using RIPA buffer for 30 min on ice. The lysis buffer contained 1× protease inhibitor cocktail and phosphatase inhibitor cocktail. After lysis, the samples were centrifuged, and the supernatant was transferred to new tubes and denatured at 95 °C for 5 min, then loaded onto a 10% SDS-PAGE gel along with 1× SDS loading buffer (100 mM Tris-HCl, 4% SDS, 0.2% bromophenol blue, 20% glycerol, 200 mM DTT, pH 7.4). Proteins were transferred onto nitrocellulose membranes and incubated with the indicated primary antibodies overnight at 4 °C. On day 2, the membranes were incubated with secondary antibodies at room temperature for 1 h and visualized using the ChemiDoc Imaging System (Bio-Rad) with West-Q Pico Dura ECL Solution. Densitometric analysis of Western blot bands was performed using the Gel Analysis function in Image J (NIH) (version 2.16.0/1.54p). Net intensities were calculated by subtracting background signal from the plot profiles and normalized to GAPDH or the indicated reference proteins.
Time-lapsed confocal imaging and data analysis
Fluorescence imaging was performed using a Nikon Ti2 inverted epifluorescence microscope equipped with a Yokogawa W1 spinning disk scan-head, a LU-NV solid-state laser system, and a live-cell culture cage to maintain the temperature at 37 °C with 5% CO2. High-resolution imaging was achieved using a 60× oil lens. Data analysis was performed using Nikon NIS-Elements imaging software (version 4.5 1.00), and the results were plotted using the Prism 10.5.0 (673) software (GraphPad). For analysis of mitochondrial fluorescence intensities, cells exhibiting aggregated or morphologically abnormal mitochondria were excluded from analysis. Regions of interest (ROIs) were then selected based on the expression of the mitochondria-anchored plasmid. Specifically, in experiments using NTOM20-Venus fused to ssrA, green fluorescence was used to identify mitochondria. Subsequently, the fluorescence intensity of the target protein within the ROI was quantified for further analysis.
Bioluminescence resonance energy transfer (BRET) assay
HEK293 cells were seeded in 24-well plates and transfected with Ntom20-Venus-ssrA variants and NanoLuc-sspB, with a total 0.5 μg of DNA in each well of a 24-well plate. After 24 h, cells were washed twice with cold PBS, resuspended in PBS, and transferred to an opaque 96-well plate for luciferase assay. The PBS-resuspended cells were subjected to the Bright-Glo Luciferase Assay System (E2610; Promega), and luminescence signals at a wavelength of 535 nm were measured using a Cytation 5 Cell Imaging Multi-Mode Reader (BioTek). Raw BRET signals were calculated as the emission intensity at 520 to 545 nm divided by the emission intensity at 475 to 495 nm. Net BRET signals were calculated as the raw BRET minus the raw BRET signal measured from cells expressing only the NanoLuc donor. The BRET ratio heatmap was generated using GraphPad Prism v.10.5.0 (673) (GraphPad).
Immunofluorescence for surface expression validation
On day 1, HeLa cells transfected with the plasmid were fixed with 4% paraformaldehyde (PFA) for 20 min at room temperature (RT). Subsequently, cells were incubated with an anti-FLAG antibody overnight at 4 °C. On day 2, the cells were incubated with Alexa Fluor 488-conjugated goat anti-mouse antibody for 1 h at RT, washed with PBS three times, and then subjected to confocal imaging.
Ca2+ imaging using NEMOf
HeLa cells were plated and transfected with 250 ng of ssrA2-STIM1ct constructs and 50 ng of the ultrasensitive, genetically encoded Ca2+ sensor NEMOf after 24 h. Cells were imaged by confocal microscopy 24 h post-transfection. During one light-dark cycle, cells were recorded with 488 nm and 561 nm channels simultaneously at 3-s intervals for the light cycle, followed by recording with only the 561 nm channel during the dark cycles. Light-dark cycles were repeated three times. Based on our previous studies, the 470-nm laser source with a 1–5% input was sufficient to activate the LOV2- or CRY2-based optogenetic constructs24,77,95,96,97.
NFAT-dependent luciferase assay
For the NFAT-dependent luciferase expression assay, HEK293T cells seeded in 96-well plates were co-transfected with ssrA2-STIM1ct variants, mCherry-CRY2-sspB2, and pGL4.30[luc2P/NFAT RE/Hygro] (NFAT RE-luc; Promega). 24 h after transfection, cells were placed in a home-made LUX microplate illumination device (see Supplementary Fig. 2 for the configuration) and stimulated with blue light (power density of 4 mW/cm2) in the presence of phorbol myristate acetate (PMA) at a final concentration of 15 nM. 4 h later, luciferase activity was determined using the Bright-Glo Luciferase Assay System, and luminescence signals were measured using a Cytation 5 Cell Imaging Multi-Mode Reader (BioTek).
ELISA quantification of human IFNβ
A549 cells were seeded in a 6-well plate on day 0. On day 1, cells were co-transfected with 500 ng of GFP-cSTING (ssrA2-fused or without ssrA) and mCh-CRY2-sspB2 or sspB2-mCh-CRY2 plasmids. On day 2, cells were stimulated were stimulated with 10 μg/ml poly I:C or pulsed 470 nm blue light (20 s ON and 5 min OFF) for 24 h. The supernatant containing secreted IFNβ was collected the following day and subjected to hIFN-β ELISA assay according to the manufacturer’s instructions. Data are shown as means ± s.e.m. of five replicate wells and represent three independent experiments.
Electroporation and treatment of Jurkat cells
Jurkat T cells were electroporated using the Neon Transfection System (Invitrogen) according to the manufacturer’s instructions at day 0. In brief, 1 million Jurkat T cells were mixed with a total of 10 µg plasmids encoding ssrA2-STIMct (site 685)-mCerulean and mCh-CRY2-sspB2 or mCerulean and mCherry as control. Cells are subjected to electroporation and incubated in fresh RPMI 1640 in a 6-well plate overnight for recovery. On day 1, mCerulean and mCherry double positive cells were sorted and transferred into a new 6-well plate supplemented with fresh medium for growth. On day 3, cells were subjected to indicated treatments, including 1 μM ionomycin, blue light (30 s ON, 1 min OFF, 10–40 mW/mm2), 10 nM PMA for 8 h. Supernatants were collected by centrifugation at 300 × g for 5 min and stored at −20 °C until analysis. Pellets were collected for western blot analysis and RNA isolation for real-time PCR analysis.
ELISA measurements of human IL-2
Supernatant collected from Jurkat cells was prediluted at a ratio of 1:25 (20 μL supernatant + 480 μL sample diluent). Then, 50 μL of the diluted supernatant was added to pre-coated anti-IL-2 antibody microwells of the Human IL-2 ELISA Kit (BMS221-2, Thermo Fisher Scientific), along with 50 μL of biotin-conjugated anti-IL-2 antibody (1:100 dilution in 1× Assay Buffer), and incubated at room temperature for 2 h. The plate was washed 6 times with Wash Buffer, and 100 μL of streptavidin-HRP (1:100 dilution) was added, followed by a 1-h incubation at RT and another 6 washes. Then, 100 μL of TMB substrate solution was added and incubated for 30 min at room temperature. The reaction was stopped with 100 μL of Stop Solution, and absorbance was measured at 450 nm using a Cytation 5 Cell Imaging Multi-Mode Reader (BioTek). IL-2 concentrations were calculated using a standard curve (range: 18.8–1200 pg/mL) and multiplied by the total dilution factor (25 × 2 = 50, accounting for the 1:25 predilution and the additional 1:2 dilution in the assay) to obtain the final concentrations. Statistical analysis was performed using a one-way ANOVA.
Real-time PCR analysis
Total RNA was isolated from electroporated Jurkat cells using TRIzol reagent (Invitrogen, Waltham, MA, USA) according to the manufacturer’s instructions. Concentration was determined using a Nanodrop. cDNA was synthesized from the RNA using the Superscript III First-Strand cDNA Synthesis Kit (Invitrogen, Waltham, MA, USA) following the manufacturer’s instructions. Real-time PCR was then conducted on the ABI Prism 7000 analyzer (Applied Biosystems) with the SYBR Green ER qPCR Super Mix Universal kit (Invitrogen) and specific primers. The resulting data were presented as the accumulation index (2ΔΔCt). The primer sequences are listed in Supplementary Table 3. IL-2 mRNA expression level was normalized to GAPDH.
Cell death monitored and cell viability assay by Annexin V staining
For real-time imaging of cell death, HeLa cells seeded on glass-bottom dishes were transfected with Flag-MLKL(1–140)-ssrA2-mCherry or ssrA2-MLKL(1–140)-mCherry and mCherry-CRY2-sspB2-PB. 24 h after transfection, HeLa cells were washed twice with cold PBS and stained with 1 μM Pacific Blue Annexin V diluted in 1X binding buffer. Time-lapse confocal imaging was initiated and recorded with 488 nm, 561 nm, and bright field channels with 500 milliseconds ON and 15-s intervals. For the cell viability assay, LiPOP1 made of mCherry-CRY2-MLKL-NT(3 A) was used as the positive control98. Confocal imaging was performed 4 hours after stimulation with pulsed 470 nm blue light cycles (30 s ON, 3 min OFF).
Generation of a murine xenograft model of leukemia
For each K562 cell line expressing the indicated constructs validated by flow cytometry, 5 × 10⁶ cells were trypsinized, counted, resuspended in 50 μl PBS, and injected subcutaneously (s.c.) into the flank of mice on Day 0. Mice were subjected to pulsed blue light stimulation (470 nm; 250 mW/cm2; 20 s ON and 5 min OFF; 6 h every other day) or left without blue light stimulation two days post-inoculation. Tumor size was measured at indicated time points and calculated using the formula (4/3 π × 0.5 × length × 0.5 × width × 0.5 × height) (mm3). On Day 15, mice were euthanized by CO2 inhalation for tumor isolation and imaging.
Flow cytometry analysis
The transduced K562 cells or electroporated Jurkat cells expressing mCherry-tagged and/or mCerulean-tagged protein were resuspended in 1× FACS buffer (PBS containing 2% FBS) on ice, then sorted by comparison to negative control without fluorescent-tagged protein expression to >90% purity using LSRII flow cytometer (BD Biosciences, Franklin Lakes, NJ, USA). The following experiments were stated in each experiment.
CRISPRi assay
The pHR-SFFV-dCas9-BFP (Addgene # 46910), pHR-SFFV-dCas9-BFP-KRAB (Addgene # 46911), pMLS-SV40-EGFP (Addgene # 46919), and pU6-sgGFP-NT1 (Addgene # 46914) plasmids were obtained from Addgene. HEK293T cells were seeded on glass-bottom dishes on day 0. On day 1, cells were transiently transfected with 100 ng of pMLS-SV40-EGFP plasmid, 500 ng of pHR-SFFV-dCas9-BFP or pHR-SFFV-dCas9-BFP-KRAB, with or without 500 ng of pU6-sgGFP-NT1. Confocal images were performed on day 6. Cells expressing BFP were selected for subsequent fluorescence imaging analysis. The relative EGFP expression was calculated by normalizing the EGFP fluorescence intensity to the mean intensity of the dark group lacking sgNT1.
Statistics and reproducibility
Quantitative data are presented as the mean ± standard error of the mean (s.e.m.), unless otherwise specified. The sample size for each experiment is provided. No data were excluded from experiment analyses. All experiments were not randomized in this study. All representative confocal images were obtained from at least three independent experiments, each producing similar results. Graphs were created using GraphPad Prism version 10.5.0 (673). Half-life calculations were performed using the “one-phase decay” function in the software. Statistical analyses were conducted using indicated test in figure legends.
Reporting summary
Further information on research design is available in the Nature Portfolio Reporting Summary linked to this article.
Data availability
The PhoBIT1 components include Ntom20-Venus-ssrA (Addgene #223688) and mCh-sspB(LOV2) (Addgene #223689). The PhoBIT2 components, fused with STIM1ct, consist of STIM1ct-ssrA2-mCerulean (Addgene #223690) and mCh-CRY2-sspB2 (Addgene #223691). Source data is available for Figs. 1d, g, k, 2d, 3d–f, h, 4c, e, g, 5d, 6c, e–g, 7c, f, i, j and Supplementary Figs. 1c, f, 3c, d, f, g, 4a, b, 6c–e, 7, 8d, and 9b, c in the associated source data file. Creative Commons (CC-BY) license from Biorender listed here: Fig. 4a (https://BioRender.com/qnjigjh), Fig. 7e and g (https://BioRender.com/t9kki1m). Source data are provided with this paper.
References
-
Tan, P., He, L., Huang, Y. & Zhou, Y. Optophysiology: illuminating cell physiology with optogenetics. Physiol. Rev. 102, 1263–1325 (2022).
-
Benner, S. A. & Sismour, A. M. Synthetic biology. Nat. Rev. Genet 6, 533–543 (2005).
-
Emiliani, V. et al. Optogenetics for light control of biological systems. Nat. Rev. Methods Primers 2 https://doi.org/10.1038/s43586-022-00136-4 (2022).
-
Zhang, K. & Cui, B. Optogenetic control of intracellular signaling pathways. Trends Biotechnol. 33, 92–100 (2015).
-
Kwon, E. & Heo, W. D. Optogenetic tools for dissecting complex intracellular signaling pathways. Biochem. Biophys. Res. Commun. 527, 331–336 (2020).
-
Dagliyan, O. & Hahn, K. M. Controlling protein conformation with light. Curr. Opin. Struct. Biol. 57, 17–22 (2019).
-
Spiltoir, J. I. & Tucker, C. L. Photodimerization systems for regulating protein-protein interactions with light. Curr. Opin. Struct. Biol. 57, 1–8 (2019).
-
Ye, H. & Fussenegger, M. Optogenetic medicine: synthetic therapeutic solutions precision-guided by light. Cold Spring Harb. Perspect. Med. 9 https://doi.org/10.1101/cshperspect.a034371 (2019).
-
Strickland, D. et al. TULIPs: tunable, light-controlled interacting protein tags for cell biology. Nat. Methods 9, 379–384 (2012).
-
Guntas, G. et al. Engineering an improved light-induced dimer (iLID) for controlling the localization and activity of signaling proteins. Proc. Natl. Acad. Sci. USA 112, 112–117 (2015).
-
Wang, H. & Hahn, K. M. LOVTRAP: a versatile method to control protein function with light. Curr. Protoc. Cell Biol. 73, 21 10 21–21 10 14 (2016).
-
Liu, H. et al. Photoexcited CRY2 interacts with CIB1 to regulate transcription and floral initiation in Arabidopsis. Science 322, 1535–1539 (2008).
-
Benedetti, L. et al. Optimized Vivid-derived magnets photodimerizers for subcellular optogenetics in mammalian cells. Elife 9 https://doi.org/10.7554/eLife.63230 (2020).
-
Kawano, F., Suzuki, H., Furuya, A. & Sato, M. Engineered pairs of distinct photoswitches for optogenetic control of cellular proteins. Nat. Commun. 6, 6256 (2015).
-
Qiao, L. et al. A sensitive red/far-red photoswitch for controllable gene therapy in mouse models of metabolic diseases. Nat. Commun. 15, 10310 (2024).
-
Redchuk, T. A., Omelina, E. S., Chernov, K. G. & Verkhusha, V. V. Near-infrared optogenetic pair for protein regulation and spectral multiplexing. Nat. Chem. Biol. 13, 633–639 (2017).
-
Levskaya, A., Weiner, O. D., Lim, W. A. & Voigt, C. A. Spatiotemporal control of cell signalling using a light-switchable protein interaction. Nature 461, 997–1001 (2009).
-
Flynn, J. M. et al. Overlapping recognition determinants within the ssrA degradation tag allow modulation of proteolysis. Proc. Natl. Acad. Sci. USA 98, 10584–10589 (2001).
-
Levchenko, I., Grant, R. A., Wah, D. A., Sauer, R. T. & Baker, T. A. Structure of a delivery protein for an AAA+ protease in complex with a peptide degradation tag. Mol. Cell 12, 365–372 (2003).
-
Wah, D. A., Levchenko, I., Baker, T. A. & Sauer, R. T. Characterization of a specificity factor for an AAA+ ATPase: assembly of SspB dimers with ssrA-tagged proteins and the ClpX hexamer. Chem. Biol. 9, 1237–1245 (2002).
-
Harper, S. M., Neil, L. C. & Gardner, K. H. Structural basis of a phototropin light switch. Science 301, 1541–1544 (2003).
-
Wu, Y. I. et al. A genetically encoded photoactivatable Rac controls the motility of living cells. Nature 461, 104–108 (2009).
-
Liu, B. et al. Biosensors based on peptide exposure show single molecule conformations in live cells. Cell 184, 5670–5685 e5623 (2021).
-
He, L., Tan, P., Huang, Y. & Zhou, Y. Design of smart antibody mimetics with photosensitive switches. Adv. Biol. (Weinh.) 5, e2000541 (2021).
-
Carrasco-Lopez, C. et al. Development of light-responsive protein binding in the monobody non-immunoglobulin scaffold. Nat. Commun. 11, 4045 (2020).
-
Dagliyan, O. et al. Engineering extrinsic disorder to control protein activity in living cells. Science 354, 1441–1444 (2016).
-
Gil, A. A. et al. Optogenetic control of protein binding using light-switchable nanobodies. Nat. Commun. 11, 4044 (2020).
-
Qi, L. S. et al. Repurposing CRISPR as an RNA-guided platform for sequence-specific control of gene expression. Cell 152, 1173–1183 (2013).
-
Liu, Z. et al. Systematic comparison of 2A peptides for cloning multi-genes in a polycistronic vector. Sci. Rep. 7, 2193 (2017).
-
Yang, D. et al. G protein-coupled receptors: structure- and function-based drug discovery. Signal Transduct. Target Ther. 6, 7 (2021).
-
Coughlin, S. R. Thrombin signalling and protease-activated receptors. Nature 407, 258–264 (2000).
-
Han, X., Nieman, M. T. & Kerlin, B. A. Protease-activated receptors: an illustrated review. Res. Pr. Thromb. Haemost. 5, 17–26 (2021).
-
Barnea, G. et al. The genetic design of signaling cascades to record receptor activation. Proc. Natl. Acad. Sci. USA 105, 64–69 (2008).
-
Kroeze, W. K. et al. PRESTO-Tango as an open-source resource for interrogation of the druggable human GPCRome. Nat. Struct. Mol. Biol. 22, 362–369 (2015).
-
Pfleger, K. D. & Eidne, K. A. Illuminating insights into protein-protein interactions using bioluminescence resonance energy transfer (BRET). Nat. Methods 3, 165–174 (2006).
-
Zimmerman, S. P. et al. Tuning the binding affinities and reversion kinetics of a light inducible dimer allows control of transmembrane protein localization. Biochemistry 55, 5264–5271 (2016).
-
Kyung, T. et al. Optogenetic control of endogenous Ca(2+) channels in vivo. Nat. Biotechnol. 33, 1092–1096 (2015).
-
Lee, Y. T., Chen, R., Zhou, Y. & He, L. Optogenetic control of calcium influx in mammalian cells. Methods Enzymol. 654, 255–270 (2021).
-
Ma, G. et al. Optogenetic engineering to probe the molecular choreography of STIM1-mediated cell signaling. Nat. Commun. 11, 1039 (2020).
-
Ma, G. & Zhou, Y. A STIMulating journey into optogenetic engineering. Cell Calcium 88, 102197 (2020).
-
Nguyen, N. T. et al. CRAC channel-based optogenetics. Cell Calcium 75, 79–88 (2018).
-
Nguyen, N. T., Ma, G., Zhou, Y. & Jing, J. Optogenetic approaches to control Ca(2+)-modulated physiological processes. Curr. Opin. Physiol. 17, 187–196 (2020).
-
Ma, G. et al. Inside-out Ca(2+) signalling prompted by STIM1 conformational switch. Nat. Commun. 6, 7826 (2015).
-
Rathner, P. et al. Interhelical interactions within the STIM1 CC1 domain modulate CRAC channel activation. Nat. Chem. Biol. 17, 196–204 (2021).
-
Sallinger, M. et al. Activation mechanisms and structural dynamics of STIM proteins. J. Physiol. 602, 1475–1507 (2024).
-
van Dorp, S. et al. Conformational dynamics of auto-inhibition in the ER calcium sensor STIM1. Elife 10 https://doi.org/10.7554/eLife.66194 (2021).
-
Li, J. et al. Engineering of NEMO as calcium indicators with large dynamics and high sensitivity. Nat. Methods 20, 918–924 (2023).
-
Grigoriev, I. et al. STIM1 is a MT-plus-end-tracking protein involved in remodeling of the ER. Curr. Biol. 18, 177–182 (2008).
-
Chang, C. L., Chen, Y. J., Quintanilla, C. G., Hsieh, T. S. & Liou, J. EB1 binding restricts STIM1 translocation to ER-PM junctions and regulates store-operated Ca(2+) entry. J. Cell Biol. 217, 2047–2058 (2018).
-
Mathur, J., Mathur, N., Kernebeck, B., Srinivas, B. P. & Hulskamp, M. A novel localization pattern for an EB1-like protein links microtubule dynamics to endomembrane organization. Curr. Biol. 13, 1991–1997 (2003).
-
Dondelinger, Y. et al. MLKL compromises plasma membrane integrity by binding to phosphatidylinositol phosphates. Cell Rep. 7, 971–981 (2014).
-
Sun, L. et al. Mixed lineage kinase domain-like protein mediates necrosis signaling downstream of RIP3 kinase. Cell 148, 213–227 (2012).
-
Wang, H. et al. Mixed lineage kinase domain-like protein MLKL causes necrotic membrane disruption upon phosphorylation by RIP3. Mol. Cell 54, 133–146 (2014).
-
Zhao, J. et al. Mixed lineage kinase domain-like is a key receptor interacting protein 3 downstream component of TNF-induced necrosis. Proc. Natl. Acad. Sci. USA 109, 5322–5327 (2012).
-
He, L. et al. Optical control of membrane tethering and interorganellar communication at nanoscales. Chem. Sci. 8, 5275–5281 (2017).
-
Zhou, Y. et al. Initial activation of STIM1, the regulator of store-operated calcium entry. Nat. Struct. Mol. Biol. 20, 973–981 (2013).
-
Hildebrand, J. M. et al. Activation of the pseudokinase MLKL unleashes the four-helix bundle domain to induce membrane localization and necroptotic cell death. Proc. Natl. Acad. Sci. USA 111, 15072–15077 (2014).
-
Huang, D. et al. The MLKL channel in necroptosis is an octamer formed by tetramers in a dyadic process. Mol. Cell Biol. 37 https://doi.org/10.1128/MCB.00497-16 (2017).
-
Liu, S. et al. MLKL forms disulfide bond-dependent amyloid-like polymers to induce necroptosis. Proc. Natl. Acad. Sci. USA 114, E7450–E7459 (2017).
-
Cai, Z. et al. Plasma membrane translocation of trimerized MLKL protein is required for TNF-induced necroptosis. Nat. Cell Biol. 16, 55–65 (2014).
-
Chen, C. & Xu, P. Cellular functions of cGAS-STING signaling. Trends Cell Biol. 33, 630–648 (2023).
-
Hopfner, K. P. & Hornung, V. Molecular mechanisms and cellular functions of cGAS-STING signalling. Nat. Rev. Mol. Cell Biol. 21, 501–521 (2020).
-
Sun, L., Wu, J., Du, F., Chen, X. & Chen, Z. J. Cyclic GMP-AMP synthase is a cytosolic DNA sensor that activates the type I interferon pathway. Science 339, 786–791 (2013).
-
Cai, X., Chiu, Y. H. & Chen, Z. J. The cGAS-cGAMP-STING pathway of cytosolic DNA sensing and signaling. Mol. Cell 54, 289–296 (2014).
-
Zhang, X., Bai, X. C. & Chen, Z. J. Structures and mechanisms in the cGAS-STING Innate immunity pathway. Immunity 53, 43–53 (2020).
-
Motwani, M., Pesiridis, S. & Fitzgerald, K. A. DNA sensing by the cGAS-STING pathway in health and disease. Nat. Rev. Genet. 20, 657–674 (2019).
-
Yum, S., Li, M., Fang, Y. & Chen, Z. J. TBK1 recruitment to STING activates both IRF3 and NF-kappaB that mediate immune defense against tumors and viral infections. Proc. Natl. Acad. Sci. USA 118 https://doi.org/10.1073/pnas.2100225118 (2021).
-
Dou, Y. et al. Optogenetic engineering of STING signaling allows remote immunomodulation to enhance cancer immunotherapy. Nat. Commun. 14, 5461 (2023).
-
Deininger, M. W., Goldman, J. M. & Melo, J. V. The molecular biology of chronic myeloid leukemia. Blood 96, 3343–3356 (2000).
-
Wong, S. & Witte, O. N. The BCR-ABL story: bench to bedside and back. Annu Rev. Immunol. 22, 247–306 (2004).
-
Nieborowska-Skorska, M. et al. Signal transducer and activator of transcription (STAT)5 activation by BCR/ABL is dependent on intact src homology (SH)3 and SH2 domains of BCR/ABL and is required for leukemogenesis. J. Exp. Med. 189, 1229–1242 (1999).
-
Hoelbl, A. et al. Stat5 is indispensable for the maintenance of bcr/abl-positive leukaemia. EMBO Mol. Med. 2, 98–110 (2010).
-
Sattler, M. et al. Critical role for Gab2 in transformation by BCR/ABL. Cancer Cell 1, 479–492 (2002).
-
Wojcik, J. et al. Allosteric inhibition of Bcr-Abl kinase by high affinity monobody inhibitors directed to the src homology 2 (SH2)-kinase interface. J. Biol. Chem. 291, 8836–8847 (2016).
-
Park, H. et al. Optogenetic protein clustering through fluorescent protein tagging and extension of CRY2. Nat. Commun. 8, 30 (2017).
-
Hantschel, O. & Superti-Furga, G. Regulation of the c-Abl and Bcr-Abl tyrosine kinases. Nat. Rev. Mol. Cell Biol. 5, 33–44 (2004).
-
He, L. et al. Circularly permuted LOV2 as a modular photoswitch for optogenetic engineering. Nat. Chem. Biol. 17, 915–923 (2021).
-
Taslimi, A. et al. Optimized second-generation CRY2-CIB dimerizers and photoactivatable Cre recombinase. Nat. Chem. Biol. 12, 425–430 (2016).
-
Zayner, J. P. & Sosnick, T. R. Factors that control the chemistry of the LOV domain photocycle. PLoS ONE 9, e87074 (2014).
-
Wietek, J. et al. A bistable inhibitory optoGPCR for multiplexed optogenetic control of neural circuits. Nat. Methods 21, 1275–1287 (2024).
-
Ma, G. et al. Optogenetic toolkit for precise control of calcium signaling. Cell Calcium 64, 36–46 (2017).
-
Tichy, A. M., Gerrard, E. J., Sexton, P. M. & Janovjak, H. Light-activated chimeric GPCRs: limitations and opportunities. Curr. Opin. Struct. Biol. 57, 196–203 (2019).
-
Airan, R. D., Thompson, K. R., Fenno, L. E., Bernstein, H. & Deisseroth, K. Temporally precise in vivo control of intracellular signalling. Nature 458, 1025–1029 (2009).
-
Wootten, D., Christopoulos, A., Marti-Solano, M., Babu, M. M. & Sexton, P. M. Mechanisms of signalling and biased agonism in G protein-coupled receptors. Nat. Rev. Mol. Cell Biol. 19, 638–653 (2018).
-
Foster, S. R. et al. Discovery of human signaling systems: pairing peptides to g protein-coupled receptors. Cell 179, 895–908 e821 (2019).
-
Billerbeck, S. et al. A scalable peptide-GPCR language for engineering multicellular communication. Nat. Commun. 9, 5057 (2018).
-
Davenport, A. P., Scully, C. C. G., de Graaf, C., Brown, A. J. H. & Maguire, J. J. Advances in therapeutic peptides targeting G protein-coupled receptors. Nat. Rev. Drug Discov. 19, 389–413 (2020).
-
Moen, M. D., McKeage, K., Plosker, G. L. & Siddiqui, M. A. Imatinib: a review of its use in chronic myeloid leukaemia. Drugs 67, 299–320 (2007).
-
O’Hare, T., Eide, C. A. & Deininger, M. W. Bcr-Abl kinase domain mutations, drug resistance, and the road to a cure for chronic myeloid leukemia. Blood 110, 2242–2249 (2007).
-
Bennett, N. R. et al. Improving de novo protein binder design with deep learning. Nat. Commun. 14, 2625 (2023).
-
Vazquez Torres, S. et al. De novo design of high-affinity binders of bioactive helical peptides. Nature 626, 435–442 (2024).
-
Alexander, E. & Leong, K. W. Discovery of nanobodies: a comprehensive review of their applications and potential over the past five years. J. Nanobiotechnology 22, 661 (2024).
-
Jin, B. K., Odongo, S., Radwanska, M. & Magez, S. NANOBODIES(R): a review of diagnostic and therapeutic applications. Int. J. Mol. Sci. 24 https://doi.org/10.3390/ijms24065994 (2023).
-
Stahl, S. et al. Affibody molecules in biotechnological and medical applications. Trends Biotechnol. 35, 691–712 (2017).
-
He, L. et al. Engineering of a bona fide light-operated calcium channel. Nat. Commun. 12, 164 (2021).
-
Tan, P. et al. Optical control of protein delivery and partitioning in the nucleolus. Nucleic Acids Res. 50, e69 (2022).
-
He, L. et al. Near-infrared photoactivatable control of Ca(2+) signaling and optogenetic immunomodulation. Elife 4 https://doi.org/10.7554/eLife.10024 (2015).
-
He, L. et al. Optogenetic Control Of Non-apoptotic Cell Death. Adv. Sci. (Weinh.) 8, 2100424 (2021).
Acknowledgements
This work was supported by the National Institutes of Health (R01GM144986 & R21AI174606 to Y.Z., and R01CA240258, R01DK132286 & R35HL166557 to Y.H.), the Welch Foundation (BE-1913-20220331 to Y.Z.), the Cancer Prevention and Research Institute of Texas (RP250468 to Y.Z.), the Alkek Early Career Fellowship (to L.G.), and the Leukemia & Lymphoma Society (to Y.Z.). Figures 4a and 7e, g were created by Biorender.com.
Ethics declarations
Competing interests
The authors declare no competing interests.
Peer review
Peer review information
Nature Communications thanks John Lin, and the other, anonymous, reviewer(s) for their contribution to the peer review of this work. A peer review file is available.
Additional information
Publisher’s note Springer Nature remains neutral with regard to jurisdictional claims in published maps and institutional affiliations.
Supplementary information
Source data
Rights and permissions
Open Access This article is licensed under a Creative Commons Attribution-NonCommercial-NoDerivatives 4.0 International License, which permits any non-commercial use, sharing, distribution and reproduction in any medium or format, as long as you give appropriate credit to the original author(s) and the source, provide a link to the Creative Commons licence, and indicate if you modified the licensed material. You do not have permission under this licence to share adapted material derived from this article or parts of it. The images or other third party material in this article are included in the article’s Creative Commons licence, unless indicated otherwise in a credit line to the material. If material is not included in the article’s Creative Commons licence and your intended use is not permitted by statutory regulation or exceeds the permitted use, you will need to obtain permission directly from the copyright holder. To view a copy of this licence, visit http://creativecommons.org/licenses/by-nc-nd/4.0/.
About this article

Cite this article
Lee, YT., Guo, L., Lan, TH. et al. Engineering of photo-inducible binary interaction tools for biomedical applications. Nat Commun 16, 6940 (2025). https://doi.org/10.1038/s41467-025-61710-4
-
Received:
-
Accepted:
-
Published:
-
DOI: https://doi.org/10.1038/s41467-025-61710-4