Introduction
Zanthoxylum armatum DC. (ZAD), belonging to Zanthoxylum genus in Rutaceae family1, is primarily distributed throughout southwestern China, including Sichuan, Chongqing, and Guizhou2. Due to its unique fragrant and pungent flavor, a variety of products centered around ZAD have been developed, with ZAD oil being a representative deep-processed product. The pungent sensation characteristic of ZAD offers a combination of spiciness and numbing sensation. It is distinct from the five basic taste modalities, including sweet, sour, bitter, salty, and umami. Sanshools, a group of long chain unsaturated alkyl amides with three conjugated double bonds, are abundant and responsible for the pungent flavor in ZAD3. Among them, hydroxy-α-sanshool, hydroxy-β-sanshool, hydroxy-ε-sanshool and hydroxy-γ-sanshool are crucial for the ZAD pungency profile2,4. However, different pungency compounds produce distinct numbing sensations, which may be related with the structural characteristics such as the number of cis/trans bonds, branched chains, geometric isomers, and the quantity of amide groups5,6. Oh et al. found that an increase in the concentration of pungent compounds does not always correspond to a higher perceived intensity of spiciness in humans, highlighting the multifaceted nature of spiciness perception7. In addition, relevant research about pungency evaluation more fucus on concentration, thresholds and conventional sensory assessment approaches. However, limited attention has been given to their temporal dynamic characteristics and to the evaluation of objective physiological indicators8. Therefore, a comprehensive evaluation of the pungent taste in food should take into account not only the concentration of pungent compounds but also their distinct effects on the overall numbing sensation.
The complex process of taste perception, especially with regard to pungent flavors, presents considerable challenges for both traditional sensory evaluation methods and advanced biomimetic devices such as electronic tongues. As an indirect measurement method, Scoville pungency units (SPU) serve as the primary metric for quantifying the intensity of pungent flavors9. This method determines the highest dilution at which pungency remains perceptible, using a sequential two-fold dilution process to establish the SPU value of a given substance10,11. While widely adopted, this approach primarily reflects the detection threshold of pungency rather than encompassing the full sensory experience. Recent research has further explored the multifaceted nature of pungent sensations in ZAD, including the overall perception of pungency, individual preferences, the psychophysical mechanisms underlying sensory response and the influence of variables such as gender, population demographics, and regional factors. However, as most of these studies rely on subjective sensory scoring methods, they are inherently affected by human bias12. Therefore, in-depth investigations into the chemical composition of numbing compounds, their sensory characteristics, and the development of intelligent sensory evaluation methods are essential for a more objective and comprehensive assessment of pungency in ZAD.
With the advancement of technology, particularly in the fields of computer vision and computational algorithms, the ability to analyze subtle changes in facial features to detect variations in facial expressions has greatly improved13. This facial expression analysis has emerged as an indirect and valuable tool in the field of food sensory research14. Previous studies have shown that distinct facial expressions are triggered by different flavors15,16 and the act of consuming food or beverages can lead to noticeable emotional changes17,18. Additionally, reported research has revealed a close relationship between taste perception and emotional experience, demonstrating not only the association between specific tastes and corresponding emotional responses but also the influence of tastes on the perception of affective stimuli19. Facial expressions serve as reliable indicators of spontaneous emotions and provide evidence of innate reactions to fundamental taste qualities17. Despite these findings, the majority of existing research has focused on the overall emotional responses elicited by sampled items, with comparatively little attention given to the nuanced relationships between specific facial action units (AUs) and the corresponding food or beverage samples. Moreover, previous studies have focused more on broad emotion categories and less on the specific, fine-grained muscle movements, such as AUs. Therefore, our study will provide a novel contribution by conducting a detailed AU-level analysis of facial responses to numbing and applying machine learning techniques to decode these responses for more reliable classification.
The analysis of facial expressions commonly employs the Facial Action Coding System (FACS), a framework developed by Ekman et al. 20, which categorizes human facial movements based on expressed emotions. It defines 44 distinct AUs, each representing a specific facial muscle movement20. In this system, the smallest identifiable component of a facial expression is an AU-for example, AU25 corresponds to parted lips21. Combinations of different AUs can convey a wide range of emotions, including happiness, sadness, anger, fear, surprise, disgust, and neutrality22,23. Notably, the similarity in facial expressions triggered by both pungent and spicy flavors can be logically attributed to their classification as nociceptive sensations, stimuli that activate pain receptors, thus sharing similar physiological mechanisms. Therefore, it is reasonable to infer that these types of flavors may evoke comparable facial responses24. Furthermore, recent advancements in facial recognition technology have demonstrated its effectiveness in predicting emotional reactions to pungent stimuli. However, for a more precise assessment of perceived pungency levels, it is essential to conduct a detailed analysis of the specific AUs activated by such stimuli. Identifying which AUs are most indicative of pungency remains an area that has yet to be thoroughly investigated. Therefore, machine learning was used to further analyze the AUs data to predict the accuracy of the model in binary and triple classification cases. Machine learning has shown considerable advantages in denoising, parameter selection, model identification, and prediction, with notable success in areas such as food quality grading25. Furthermore, researchers have increasingly integrated analytical data with sensory evaluation to achieve more accurate sensory predictions26. However, the application of machine learning combined with facial recognition technology in numbing substances remains limited. Therefore, compared to traditional statistical methods and subjective sensory evaluation, constructing predictive models based on machine learning algorithms combined with key AUs data from facial recognition technology can more comprehensively and accurately assess the perceptual characteristics of numbing flavor.
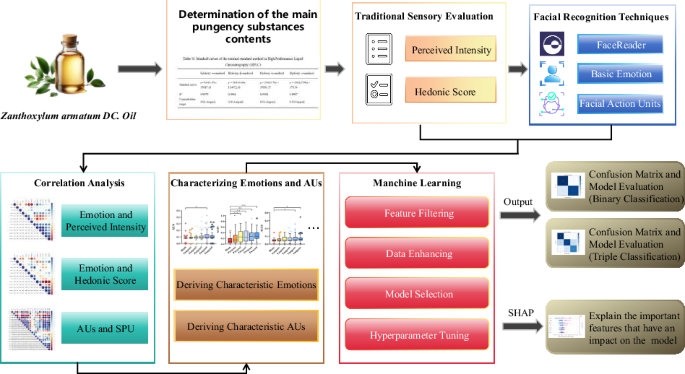
The study aimed to use FaceReader software to systematically capture the facial expressions of participants in response to the pungency of ZAD oil. First, the contents of four major pungency compounds were determined. Second, combined traditional sensory evaluation methods with the face recognition technology, we explored the pungency intensity, the degree of preference, the emotional changes caused by the pungency flavor, and the changes in AUs of different pungent ZAD oils. Finally, machine learning was employed to analyze the data by screening a variety of classification models and predicting the accuracy of the model under the scenarios of binary classification and ternary classification. It could provide an in-depth understanding of the pungency perception via the facial recognition techniques and machine learning methods. By analyzing multiple evaluations of numbing flavor, this study can establish a replicable framework that reduces subjective bias and informs the development of intelligent sensory instruments. Predicting key AUs could further elucidate the physiological-psychological mechanisms of numbing perception and strengthen the link between facial expressions and internal sensory experiences.
Results
Determination of the main pungency substances contents in ZAD oil
The contents of four major pungency compounds in the ZAD oil samples were determined using high-performance liquid chromatography (HPLC), and their concentrations were calculated using the external standard method. The standard curves of the four pungency compounds were shown in Table S1. The contents of hydroxy -ε-sanshool, hydroxy -α-sanshool, hydroxy -β-sanshool and hydroxy -γ-sanshool were 54.939 ± 4.115 mg/mL, 242.741 ± 18.293 mg/mL, 91.661 ± 6.928 mg/mL and 0.983 ± 0.095 mg/mL, respectively. The results were consistent with the previous research, where the content of hydroxy-α-sanshool account for more than 70% of the total content, and hydroxy-γ-sanshool is present in very low amount or absent27,28.
Analysis of pungent perceived intensity and hedonic score
Figure 1 showed the pungent perceived intensities and hedonic scores across samples. In Fig. 1A, the pungency perceived intensity was shown across different sample concentrations, revealing a clear positive correlation between perceived pungency and increasing pungent levels. Statistical analysis demonstrated significant variation in pungency perceived intensity across the samples (p < 0.001). In Fig. 1B, the results showed a distinct variation in hedonic evaluations among samples with different pungency levels and a significant difference in hedonic ratings among the six samples (p < 0.001). Notably, the blank group was least favored, while the pungent 1 through 5 exhibited a progressive decline in liking, corresponding to increasing pungency intensity. Although limited research exists on hedonic evaluations of pungency in vinegar chili oil, specifically, previous studies have observed similar trends in other food contexts. For example, consumer liking initially increased and then declined with increasing spiciness when chili oil was added to cheese29, which was consistent with the pattern observed in our study.

A Perception intensity; (B) Hedonic scores; Differences in perceived intensity (C) and hedonic score (D) by gender; Pungent 1−5 were gradually increasing concentrations of Zanthoxylum armatum DC oils. Calculate the outliers according to the Tukey’s test; Different letters were considered statistically significant differences among groups according to Duncan’s multiple range test (p < 0.05).
Additionally, gender-related differences in pungency perception and hedonic evaluation were explored (Fig. 1C, D). Male participants exhibited a slightly higher sensitivity to pungency compared to female participants. However, this difference was not uniform and may be influenced by factors such as geographic background, age, and individual experience with spicy foods. This observation aligns with prior findings30 that suggest males often exhibit a higher preference for spicy foods compared to females.
Analysis of emotion scores differences
ANOVA analysis was conducted to examine the variation in facial emotion scores across the different pungent sample solutions. The analysis revealed a significant difference among the samples (p ≤ 0.001).
Emotion scores corresponding to each concentration level were illustrated in Fig. 2. Among the seven emotional states assessed, including happiness, sadness, anger, surprise, fear, disgust, and neutrality, the neutral emotion (Fig. 2A) exhibited the highest mean response rate, followed by sadness (Fig. 2C) and anger (Fig. 2D). To further explore emotional responses, one-way ANOVAs were performed for each emotion across the different samples. The results indicated significant differences (p < 0.05), although the overall variability was relatively small. Notably, neutral (Fig. 2A) and disgust (Fig. 2G) expressions showed significant differences among the samples, whereas the remaining five emotions did not differ significantly across the varying levels of pungency.

A Netural; (B) Happy; (C) Sad; (D) Angry; (E) Surprised; (F) Scared; (G) Disgusted; Pungent 1−5 were gradually increasing concentrations of Zanthoxylum armatum DC oils. Calculate the outliers according to the Tukey’ s test; Different letters were considered statistically significant differences among groups according to Duncan’s multiple range test (p < 0.05).
The correlation analysis between pungency perceived intensities and hedonic scores with facial expression intensities
First, we tested the normality of all variables, including perceived intensity, liking ratings, seven basic emotion scores, and the intensity scores of the 20 AUs. Normality was assessed using the Shapiro-Wilk test implemented in GraphPad Prism 9.0. The results indicated that the null hypothesis of a normal distribution was rejected for most variables (p < 0.05). Second, we found that the relationship between sensory perception and facial responses was not necessarily linear. For example, liking and numbing intensity appeared to follow an inverted U-shaped pattern, initially increasing and then decreasing (as observed in the analysis of pungent perceived intensity and hedonic score section). The relationship between sensory perception (such as spiciness) and physiological response (such as AU intensity) was likely not a simple linear relationship and may involve threshold or saturation effects. Third, compared to the Pearson correlation, the Spearman correlation does not rely on distributional assumptions and is calculated based on the rank order of the data rather than the raw values, making it well-suited for handling such nonparametric data31. Furthermore, the Spearman method effectively reduces the impact of outliers and captures a wider range of monotonic relationships, making it more suitable for the complex data types and research objectives of this study, while Pearson’s correlation requires that the data follow a bivariate normal distribution and calculates linear relationships based on the raw data values. Therefore, Spearman correlation analysis was carried out to explore the relation between perceived pungency intensity and hedonic responses with facial emotion scores.
Figure 3A showed that neutral, anger, and sadness exhibited a strong positive correlation with perceived pungency intensity. Disgust also showed a positive correlation, particularly as the pungency level of the samples increased. In contrast, surprise, fear, and happiness displayed a negative correlation with perceived intensity. Notably, there was a significant difference (p < 0.05) among the correlation scores.

A Perception intensity correlation; (B) Hedonic scores correlation; Color stand for the strength of the correlation with blue representing a high positive correlation and red representing a high negative correlation; Each grid in the figure shows the correlation coefficients and the corresponding significant differences (*,**, ***=p < 0.05, p < 0.01, p < 0.001).
Previous research has demonstrated that individuals with a preference for spicy foods exhibit heightened sensitivity to facial expressions of anger and disgust24, a finding consistent with the present results. Additionally, this study revealed a positive correlation between sadness and perceived pungency intensity. This may be attributed to the activation of specific AUs associated with sadness in response to pungent stimulation32. According to FACS, sadness is typically characterized by the activation of AU4 (brow lowerer), AU15 (lip corner depressor), AU17 (chin raiser), and the combination AU1 + AU4 (inner brow raiser with frown)20,21,22. In our study, we observed significant activation of AU4 and AU17 in response to the numbing sensation, consistent with the prototypical expression of sadness. AU15 was also expressed in some participants, but due to considerable individual variability, its overall significance was less pronounced than that of AU4 and AU17. These findings are consistent with previous reports. Du et al. identified AU4 and AU15 as core components of sadness expressions33. Leitch et al. also found that negative taste stimuli (such as bitterness) elicited a combination of AUs resembling sadness15.
In Fig. 3B, the correlation between hedonic ratings and facial emotion scores varied depending on the emotion. Sadness and anger initially exhibited a positive correlation with hedonic responses, which later shifted to negative as pungency increased. In contrast, fear and happiness showed an initially negative correlation that later became positive. Furthermore, there was a significant difference between the correlation scores (p < 0.05). These correlation differences appeared to reflect individual differences in sample preference, presenting an overall trend of increase followed by decline in emotional response. Interestingly, for the three samples with lower hedonic ratings, a positive correlation with happiness was observed. This finding may be limited by the constraints of the FaceReader software, which detects only seven basic emotions. Given that human emotional expression is far more nuanced and complex34, so further systematic and large-scale studies are necessary to comprehensively investigate the affective responses and fondness for pungent flavors.
Analysis of differences in AUs scores and correlation with SPU
Figure 4 illustrated box-and-whisker plots representing the average scores of 20 distinct AUs across six pungent sample conditions. One-way ANOVAs were conducted for each AU across the different pungency levels, revealing significant differences (p < 0.05) in the activation of several AUs, including AU4, AU10, AU25, and AU26. We observed that these AUs values increased with the rising pungency intensities of the samples.

AU stands for Facial Action Unit; Calculate the outliers according to the Tukey’ s test; According to Duncan’s multiple range test, *, **, *** indicate the presence of significant differences (*, **, ***=p < 0.05, p < 0.01, p < 0.001).
Figure S3 showed the Spearman’s correlation between the mean scores of the 20 AUs and the SPU of the samples. The analysis indicated that AUs 1, 2, 5, 14, and 17 were negatively correlated with SPU values, while the remaining AUs exhibited positive correlations. Given that AUs could function both independently and in combination to convey a wide range of emotional expressions, the correlation patterns would provide valuable insights into which AUs were more likely to be activated or suppressed in response to increasing levels of pungency. Notably, AUs 4, 6, 7, 10, 23, 25, and 26 showed the strongest significantly positive correlations with SPU (p < 0.05). These findings suggest that these seven AUs may be key indicators of facial responses to pungency, thereby offering a more in-depth understanding of the facial expression patterns elicited by varying intensities of pungent stimuli.
Construction of classification model for pungent flavor grading analysis
Kernel Density Estimation (KDE) was utilized to examine the distribution of the complete dataset comprising AUs. This method provided a detailed visualization of the data structure across a range of values and assisted in the identification of informative features35. In Figure S4A and E, we analyzed two classification scenarios, including a binary and a ternary classification scenario, both showing significant class imbalance in the original data distribution. In the binary scenario, Class “0” (the blank group) comprised 52 samples, while Class “1” (all ZAD oil samples: 52 participants × 5 concentrations) comprised 260 samples. The class ratio (0:1) was approximately 1:5, and the minority class accounted for approximately 16.7% of the total. In the ternary scenario, Class “0” (the blank group) included 52 samples, Class “1” (low pungency intensity: Pungent 1, Pungent 2) included 104 samples, and Class “2” (low pungency intensity: Pungent 3, Pungent 4 and Pungent 5) included 156 samples. The resulting ratio (0:1:2) was approximately 1:2:3, with Class “0” accounting for approximately 16.7% and Class “1” for approximately 33.3% of the total. The KDE plots for both binary and ternary classification scenarios revealed imbalanced peak distributions, reflecting the intrinsic class imbalance present in the dataset.
To address this issue, Synthetic Minority Over-sampling Technique (SMOTE) and its variants were employed to enhance the representation of minority classes36. SMOTE is a widely used approach to address class imbalance. It mainly targets minority class samples to synthesize new samples, thereby balancing the dataset. However, it is prone to overgeneralization and noise propagation37,38. In this study, given the data-dependent performance of different SMOTE variants, we adopted a data-driven strategy rather than assuming a priori superiority. Using Extra Trees as the base model, we compared multiple oversampling methods via 5-fold cross-validation, with Area Under the Curve (AUC) and Accuracy (ACC) as evaluation metrics. By preferentially oversampling minority class samples located in regions of highest classification uncertainty, Borderline-SMOTE enhances generalization in such complex multi-class scenarios, thereby outperforming standard SMOTE, which performs uniform sampling across all minority class instances. Additionally, Borderline-SMOTE is defined as the most important variant of SMOTE, and has been testified to behave better than SMOTE. Therefore, the idea of Borderline-SMOTE has been adopted by many SMOTE variants38.
The intensity data for many AUs exhibited significant positive skewness and significant variance heterogeneity. By compressing high values and stretching low values, the logarithmic transformation can bring the data distribution closer to normality and stabilize variance39,40. This provided a more suitable statistical foundation for subsequent modeling and ultimately enhanced both the classification accuracy and robustness of the models. Furthermore, although the Extra Trees algorithm was generally insensitive to monotonic transformations, the logarithmic transformation may strengthen the linear relationship between features and the target variable, which was particularly advantageous for distance-based algorithms or models employing linear kernel functions. More importantly, it significantly improved the separability of categories in feature space (Figure S4F), thereby offering intuitive evidence of its effectiveness and a stronger basis for improving classifier performance. In Figure S4B, F, we observed that the log-transformed data distribution highlighted distinct, non-overlapping regions between classes, suggesting that several features possess strong discriminative power for classification tasks.
Various approaches, including other SMOTE approaches, the effects of K-nearest neighbors (K)41 and the varying impacts of SMOTE modifications42,43 were systematically evaluated to further analyze the data.
Figure S5A–E showed the binary classification modeling outcomes, including comparisons between the original dataset, SVM-SMOTE, and SMOTE-modified datasets. Overall, the best performance was achieved with SMOTE using K = 6, as indicated by a comprehensive assessment of evaluation metrics. For the ternary classification task, Figure S5F–J presents model performance based on the original data, SMOTE-modified data, and Borderline-SMOTE. The optimal model was obtained using the Borderline-SMOTE technique with K = 8, based on the aggregated evaluation criteria.
In Figure S4C, D, G, H, the KDE and logarithmic KDE plots of the SMOTE-generated synthetic data revealed distinctive data patterns, particularly in regions involving AUs 4, 17, 25, 26, and 43. Combined with the earlier correlation analysis between AUs and SPU, AUs 4, 6, 7, 10, 23, 25, and 26 were identified as key features associated with pungency perception.
Model selection and evaluation
Table S2 outlined eight commonly employed classification models, including their respective acronyms and adjustable hyperparameters. Model selection was carried out using the scikit-learn library in Python, with performance evaluation conducted via five-fold stratified cross-validation. This process assessed the predictive accuracy of both binary and ternary classification models and facilitated the aggregation of Receiver Operating Characteristic (ROC) curves for comparative analysis.
Figures 5A and 5B provided a comparative overview of the model performances, evaluated primarily using the area under the ROC_AUC, where higher values indicated superior model discrimination. In the binary classification section, the Extra Trees classifier achieved the highest AUC score of 0.97. In the ternary classification context, the Extra Trees model also led with an AUC of 0.77. Therefore, the Extra Trees model was deemed most suitable for the study’s objectives.

A, B Receiver Operating Characteristic (ROC) diagram of various algorithm modeling; (C, D) Area Under the Curve (AUC) and Accuracy (ACC) violin plots for various models.
In Figs. 5C and 5D, violin plots illustrated the distribution of accuracy and AUC scores across the eight models, with the red and blue areas representing model accuracy and AUC values, respectively. For binary classification, the Extra Trees model exhibited a median accuracy of 0.88 and an AUC of 0.95, both metrics surpassing the remaining models. In ternary classification, this model maintained its leading position, achieving a median accuracy of 0.61 and an AUC of 0.70. These findings align with previous research42,44, which demonstrated that the Extra Trees model offers slight advantages over Decision Trees and Random Forests in terms of both training efficiency and classification accuracy. Based on this comparative analysis, the Extra Trees model was selected as the optimal classifier for subsequent analyses in this study.
Hyperparameter tuning
Optimizing hyperparameters is essential for maximizing model performance and generalization. Following the model selection phase, the Extra Trees classifier was identified as the most suitable model for training the dataset. Therefore, hyperparameter tuning was undertaken for the Extra Tree model. As both Extra Trees and Random Forest classifiers fall under the category of ensemble decision tree algorithms, they share key parameters that significantly influence their predictive accuracy45,46. In this study, hyperparameter tuning focused on three critical parameters: the number of estimators, the minimum number of samples required to split an internal node, and the maximum depth of the trees. To ensure effective model generalization, it is essential to fine-tune key hyperparameters, including the maximum tree depth, Minimum samples split, and the number of tree estimators.
A grid search was conducted on the training dataset. Given the dataset’s size, excessively large numbers of estimators or excessive tree depths should be avoided. The grid search range was defined based on extensive preliminary testing, as detailed in Table S3. Optimal hyperparameter combinations were determined through five-fold cross-validation. For the binary classification task, the best performance was achieved with a maximum tree depth of 17, a minimum sample split of 2, and 218 estimators, resulting in an average cross-validation score of 0.870. For the ternary classification task, optimal settings included a maximum depth of 28, a minimum sample split of 2, and 186 estimators, yielding an average cross-validation score of 0.612, as reported in Table S3.
Model testing
Figure 6A, C showed the prediction performance of the binary classification model. The analysis of the confusion matrix revealed a sensitivity of 0.860, a specificity of 0.957 and a model accuracy of 0.904, indicating the model’s strong capability in correctly identifying both true positives and true negatives. Additionally, the ROC analysis showed an AUC value of 0.96, which was close to the theoretical maximum of 1.0, further demonstrating the model’s excellent generalization performance.

A, B Confusion matrix of model testing; (C, D) ROC diagram of model testing.
Figure 6B, D depicted the testing results of the ternary classification model. The results of the confusion matrix for multiple classifications needed to be discussed separately for each classification case. For class “0” (no numbness), the model achieved a sensitivity of 0.750 and a specificity of 0.862. For class “1”, sensitivity and specificity were 0.806 and 0.889, respectively. For class “2”, the corresponding values were 0.704 and 0.884. The overall accuracy of the model was 0.755. These results indicated that the model maintained robust predictive performance across all classes, with sensitivities and specificities consistently exceeding 0.7. ROC analysis further supported these findings, with AUC values of 0.94, 0.81, and 0.89 for classes “0”, “1”, and “2”, respectively. As all AUC scores were above 0.80, the results confirmed the model’s strong ability to generalize across complex multiclass classification tasks.
Outcomes of SHapley Additive exPlanation (SHAP) analysis
Following the evaluation of the classification model, SHapley Additive exPlanation (SHAP) analysis was employed to elucidate the influence of individual AUs associated with the perception of pungency. This interpretability method enabled both local and global insights into the model by quantifying each AU’s contribution to predictive outcomes and analyzing inter-feature interactions.
Figure 7 presented SHAP summary plots for both binary and ternary classification models based on seven selected AUs. Figure 7A, B corresponded to the binary and ternary classification results, respectively, illustrating the relative importance of each AU in terms of its SHAP value. The horizontal distribution of the data points reflected the magnitude of each AU’s impact, with greater dispersion indicating a higher influence on model predictions. In the binary classification model (Fig. 7A), AU25 and AU4 exhibited the most substantial positive contributions, as indicated by a predominance of red (positive SHAP value) points. AU26 and AU7 also contributed positively, though to a lesser extent, with most of their data points clustering near the neutral axis. The remaining AUs showed minimal dispersion and limited impact on the prediction outcome. In the ternary classification model (Fig. 7B), AU25 continued to demonstrate a strong influence; however, an overall reduction in the SHAP values was observed across all AUs. This attenuation in contribution was likely due to the increased complexity introduced by the three-class prediction task, which may dilute the predictive power of individual features. To further explore feature interactions, SHAP dependence plots were used to examine relationships between AU25 and other AUs. Figure 7C, E showed interactions between AU25 and AUs 26 and 7, respectively, within the binary classification context. A positive relationship was observed between AU25 and its SHAP values, indicating that higher AU25 intensities tended to enhance the model’s predictive performance. A similar trend was noted for AU26, suggesting a potential synergistic effect, whereas AU7 exhibited little to no correlation, implying limited interaction. These findings were consistent in the ternary model (Fig. 7D, F), where AU26 values increased in tandem with rising AU25 SHAP values, while AU7 displayed an inverse trend, further supporting its negligible interaction.

A, B SHAP plots for the binary and triple classification models; (C, E) SHAP values of AU25 for the binary classification model and interactions for AU7 and AU26; (D, F) SHAP values of AU25 for the triple classification model and interactions for AU7 and AU26.
AU25 (lips part) has been identified as the most important feature for predicting numbing taste34. First, it reflected an involuntary physiological reaction to strong numbing stimulation: exposure of the tongue to high concentrations of ZAD oil is frequently accompanied by a rapid inhalation or brief gasp, externally observable as lip parting. This reaction was similar to the typical response pattern observed during burning or severe pain and reflected a universal feature of pain-related facial expressions. Second, AU25 was also associated with “taste evaluation” behavior. During sensory assessments, participants often inhale slightly through the mouth to direct aroma molecules toward the olfactory epithelium, thereby enhancing flavor perception. However, when the stimulus was excessively strong, this behavior shifted from evaluative to protective, reflecting the intensity of the stimulus. Consequently, the degree of AU25 activation may serve as a direct indicator of stimulus intensity. In addition, AU25 frequently co-occurred with AU26 (jaw drop) and AU10 (upper lip lift), together forming characteristic facial expression patterns such as “disgust” or “surprise” in response to strong or aversive chemical stimuli. Our SHAP dependency analyses (Fig. 7C–F) further confirmed the positive synergistic effect between AU25 and AU26. Thus, AU25 should not be regarded as an isolated action but rather as a highly sensitive representation of intense oral chemical stimulation. Its pronounced feature importance underscored that “lip parting” was a reliable biomarker for differentiating numbing taste intensities. Therefore, the SHAP analysis highlighted AU25 and AU26 as critical contributors to model performance in both binary and ternary classification tasks. Strategic enhancement of these AUs during data acquisition may improve the model’s prediction accuracy and robustness. Additional SHAP interaction plots for the remaining AUs were provided in Figures S6 and S7.
In summary, the model exhibited high sensitivity, specificity, and accuracy in both binary and ternary classification tasks. The ROC analysis further confirmed the model’s strong generalization capability, indicating a promising foundation for the classification and evaluation of the pungency of ZAD oil. SHAP analysis identified AU25 as a critical feature in both classification models, with higher values of AU25 contributing significantly to improved model performance. Additionally, local SHAP analysis revealed a positive correlation between AU25 and AU26, suggesting that increases in AU25 were accompanied by corresponding increases in AU26. These findings imply that enhancing the activation of AU25 and AU26 during data acquisition may further improve the predictive accuracy of the model.
Discussion
This study provided a novel approach in the domain of food sensory analysis by establishing a correlation between AUs and sensory evaluations of pungency, thereby enabling the deduction of both emotional responses and specific AU patterns associated with pungent stimuli. Building on this foundation, machine learning techniques were employed to classify pungency levels, with both binary and ternary classification models demonstrating robust predictive performance. SHAP analysis further clarified the critical role of AU25, highlighting its substantial contribution to the overall accuracy of the predictive models. By integrating objective facial expression data with machine learning, this research offers a more quantifiable and reproducible method for evaluating pungency, thereby reducing the subjectivity commonly associated with traditional sensory evaluation techniques.
Methods
Materials and chemicals
Fresh ZAD are provided by Yaomazi Food Co., Ltd. (Chengdu, China). The ZAD oil was extracted by supercritical carbon dioxide processed (SCDP) according to the method2. The methanol was HPLC grade and purchased from Merck (Darmstadt, Germany). Ultrapure water was purchased from Watsons Corp. (China). Four pungency standards, including hydroxy-α-sanshool, hydroxy-ε-sanshool, hydroxy-β-sanshool, and hydroxy-γ-sanshool, were all purchased from Shanghai Yuanye Biotechnology Co., Ltd. (Shanghai, China). The ZAD oil was stored at 4 °C, and four pungency standards were stored in at -20 °C.
Determine the content of the main pungency substances in ZAD oil
The contents of the pungency substances in ZAD oil were detected according to the method28 with some modifications. After the ZDA oil was shaken, 0.2 g (accurate to 0.0001 g) sample was weighed and placed to a flask with a stopper. Subsequently, 50 mL of methanol was added to the flask and ultrasonic extraction was performed for 0.5 hour. After extraction, it was transferred to a 100 mL volumetric flask and the volume was adjusted with methanol. The solution was filtered through a 0.22 μm membrane filter for further detection. The four pungency standards were weighed and dissolved in methanol. Mixed standard solutions of different concentrations were then prepared for making a standard curve. The range of concentrations of the four pungency standards were 10-1000 mg/mL (Hydroxy-α-sanshool), 10−1000 mg/mL (Hydroxy-β-sanshool), 10-1000 mg/mL (Hydroxy-ε-sanshool) and 0.01−10 mg/mL (Hydroxy-γ-sanshool), respectively. The chromatographic conditions are also carried out with reference to the content in the standard. Here, explanations are provided indicating that a 30-minute ultrasonic extraction yields high, stable, and reproducible chromatographic peak responses for the target compounds, based on both preliminary and final experiments. Triplicate measurements were performed in the experiment.
Sample preparation
In this study, Zanthoxylum armatum DC oil was diluted through first-grade rapeseed oil step by step to five different concentrations including 0.0313 g/g (sample 1), 0.0625 g/g (sample 2), 0.1250 g/g (sample 3), 0.2500 g/g (sample 4) and 0.5000 g/g (sample 5) and the SPU were 5000 (pungent 1), 11200 (pungent 2), 23000 (pungent 3), 45000 (pungent 4) and 92000 (pungent 5), respectively. The first-grade rapeseed oil was designated as the blank group. The distilled water was employed as a palate cleanser.
Participants
The sensory evaluation methods were conducted by following the method14 with some modifications. Participants were recruit according to the International Standard method for selection “training and monitoring of assessors” (ISO-8586-1, 2012) as well as ASTM WK49746 (2016) standard. A panel of 52 subjects (31 women and 21 men, aged from 18 to 30) participated the face recognition sensory evaluation experiment. Before carrying out the sensory evaluation, participants were given the following information: (1) To ensure their sitting posture was adjusted so that the camera could capture the optimal angle consistently; (2) six samples before them should be tasted sequentially by number and they should rinse with 50-60 mL drinkable water twice between samples to avoid taste fatigue and carry-over effects; (3) all extraneous items should be removed from the table to prevent potential disruptions during the experiment.
Relevant agreements were signed to protect the rights and privacy of all participants involved in this study. The samples used in the research were safe and consisted solely of common food items that complied with national safety standards. All participants provided written informed consent prior to participation, and the study was conducted in strict compliance with relevant regulations to ensure the protection of participants’ rights and interests throughout the research process.
Facial recognition experimental process
Sensory evaluations were conducted in a dedicated testing room in accordance with the standards outlined in ISO 6658:2005 and GB 13868:2009. Six distinct samples were placed in 100 mL plastic containers, each assigned a random three-digit code, and presented to participants in a randomized sequence at ambient temperature. To obscure the color of the sample solutions, each container was wrapped in aluminum foil. The evaluation experiments were scheduled during standard working hours, in both the morning and afternoon, to ensure optimal tasting conditions and minimize potential emotional variability.
Prior to each session, participants were instructed to cleanse their palates with drinking water and adopt a neutral facial expression. All six sample sets were arranged in front of each participant at the start of the session. Upon selecting a sample, 0.1 mL of the solution was accurately dispensed onto the tip of the tongue. Participants were instructed to hold the sample on the tongue without swallowing. The start of the evaluation was signaled by the instructor, simultaneously initiating the recording of facial expressions via the FaceReader software. Participants were required to maintain their gaze on the camera for 60 seconds, allowing for the continuous capture of facial responses to the pungent stimulus, until the instructor signaled the end of the recording. Here, a 60 second expression capture window was adopted as a balanced choice to ensure both data quality and participant comfort.
Subsequently, participants rated the perceived pungency intensity and hedonic value of the sample, as illustrated in Figure S1. Here, we have obtained written consent to publish the images relating to the participant. This process was replicated across all six sample sets, with 10−30 minutes intervals between trials. During these breaks, participants were allowed to drink plain water and consume prearranged confections to neutralize any lingering pungency. The detailed overview of the experimental design and methodology was summarized in Figure S2.
Facial recognition experimental training
The experimental process was documented using a high-definition video recording device, configured to a resolution of 1920 × 1080 pixels and a frame rate of 15 frames per second. Videos were saved in AVI format. The recording environment featured a white background with optimized lighting conditions to ensure consistent and high-quality video capture. The camera was positioned at a distance of approximately 70−100 cm from participants, aligned at facial level to accurately capture expressions.
Frame-by-frame video analysis was conducted using FaceReader 9 software (Noldus Information Technology, Wageningen, The Netherlands), which utilizes over 500 facial modeling points to assess seven primary emotions: neutrality, happiness, sadness, anger, disgust, surprise, and fear. The “East Asian” facial model was employed to ensure accurate recognition of facial expressions characteristic of East Asian populations, including Chinese and Japanese individuals. Emotional intensities were quantified on a continuous scale from 0 (no expression) to 1 (maximum expression intensity as predicted by the model).
In addition to emotion classification, the software incorporates the FACS for detailed analysis of 20 facial action units (AUs), including AU1, 2, 4, 5, 6, 7, 9, 10, 12, 14, 15, 17, 18, 20, 23, 24, 25, 26, 27, and 43. The expressions corresponding to these AUs were listed in Table S1. The intensity of each AU was measured on a scale from 0 (no activation) to 1 (full activation). Intermediate activation levels were classified as “trace,” “slight,” “marked,” and “severe,” reflecting the software’s capacity to distinguish gradations of facial muscle activity in accordance with FACS guidelines. All AUs intensity scores were recorded for subsequent statistical analysis.
Data processing and statistical analysis
Variance analysis considered the full range of individual responses, rather than relying solely on aggregated means, across all measured variables, including perceived pungency intensity, hedonic ratings, emotional responses, and AUs scores. Accordingly, Spearman’s rank correlation coefficient was used to assess the relationships between the variables, including participant-reported perceptions and the averaged AUs scores. All statistical analyses were conducted using GraphPad Prism version 9.0 (GraphPad Corporation, Boston, MA, USA).
Machine learning methods. In this study, two distinct classification modeling strategies were employed in this study. The first aimed to distinguish the blank group from samples containing ZAD oil, while the second focused on categorizing samples according to differences in pungency content-specifically, into three groups: the blank group, a combined group of pungent1 and pungent2, and another combined group comprising pungent3, pungent4, and pungent5. For each modeling approach, the dataset was partitioned into training and testing subsets in a 70:30 ratio. KDE was utilized to preliminarily explore the distributional characteristics of the dataset. In other words, before building the classification model, we applied KDE to visualize the distribution of all 20 AUs. This allowed for an initial assessment of class separability and potential imbalance in the dataset, thereby providing a basis for subsequent techniques such as SMOTE. KDE was implemented using the kdeplot function in the Python seaborn (v0.13.0) library. This function, based on scipy.stats.gaussian_kde, offered a high-level interface for generating smoothed density distributions plots. A Gaussian kernel was used, assuming a normal distribution at each data point, with the final density estimated as the superposition of these Gaussian distributions. The kernel function was defined as: (K(u)=frac{1}{sqrt{2pi }}exp (-frac{1}{2}{left(uright)}^{2})), (u=frac{x-{x}_{i}}{h}), where h was the bandwidth. The bandwidth was determined automatically using seaborn’s default Scott’s rule: (h={n}^{-frac{1}{d+4}}), where n was the number of samples and d was the data dimension (d = 1 for the univariate KDE plots in this study). This rule was robust and effective in univariate settings, required no manual adjustment, and ensured the reproducibility and objectivity of the results. To address class imbalance, the random forest algorithm was adopted as the base model. Model selection was guided by comparative evaluations of AUC and ACC metrics. Hyperparameters were optimized via a Grid Search method, with the best-performing configuration determined through five-fold cross-validation. Model performance was evaluated using confusion matrices, ROC curves, and additional classification metrics. Subsequently, SHAP analysis was applied to interpret the contribution of individual features to the model’s predictive performance. All analyses were conducted using Python version 3.9, supported by libraries including pandas (v2.1.1), seaborn (v0.13.0), matplotlib (v3.8.0), numpy (v1.26.1), scikit-learn (v1.3.1), and SHAP (v0.44.0), which collectively facilitated the computational procedures and visual representation of the results.
Data availability
Data is provided within the manuscript or supplementary information files.
Code availability
The underlying code for this study is not publicly available but may be made available to qualified researchers on reasonable request from the corresponding author.
References
-
Ji, Y., Li, S. & Ho, C.-T. Chemical composition, sensory properties and application of Sichuan pepper (Zanthoxylum genus),. Food Sci. Hum. Well. 8, 115–125 (2019).
-
Liu, F. et al. Process of Zanthoxylum armatum DC. oil by a novel low-temperature continuous phase transition extraction: Evaluation of aroma, pungent compounds and quality. LWT-Food Sci. Technol. 176, 114523 (2023).
-
Hu, H. et al. Structure-reactivity relationships of sanshools as the key pungent dietary components in foods: a DFT study. Comput. Theor. Chem. 1227, 114241 (2023).
-
Liang, W. et al. Phytochemistry and health functions of Zanthoxylum bungeanum maxim and Zanthoxylum schinifolium Sieb. et Zucc as pharma-foods: a systematic review. Trends Food Sci. Tech. 143, 104225 (2024).
-
Bader, M. et al. All-trans-configuration in Zanthoxylum alkylamides swaps the tingling with a numbing sensation and diminishes salivation. J. Agric. Food Chem. 62, 2479–2488 (2014).
-
Li, R.-L. et al. Amides from Zanthoxylum bungeanum maxim. (Rutaceae) are promising natural agents with neuroprotective activities. Arab. J. Chem. 16, 104817 (2023).
-
Oh, J. et al. Water and oil matrix effect on the perceived spiciness in chili pepper powder. J. Sens. Stud. 40, e70028 (2025).
-
Luo, J. et al. Composition, structure and flavor mechanism of numbing substances in Chinese prickly ash in the genus Zanthoxylum: a review. Food Chem. 373, 131454 (2022).
-
Zhang, L. L. et al. The relationship between alkylamide compound content and pungency intensity of Zanthoxylum bungeanum based on sensory evaluation and ultra-performance liquid chromatography-mass spectrometry/ mass spectrometry (UPLC-MS/MS) analysis. J. Sci. Food Agric. 99, 1475–1483 (2018).
-
Popelka, P. et al. Determination of capsaicin content and pungency level of different fresh and dried chilli peppers. Folia Veterinaria 61, 11–16 (2017).
-
Pan, S. et al. Research progress in the sensory classification and detection of numb-taste components of Zanthoxylum. Sci. Technol. Food Ind. 38, 347–351 (2017). In Chinese.
-
Zhao, L. et al. Pungency of Chinese pepper: its perception and preference. Sci. Talks 2, 100009 (2022).
-
Rocha-Parra, D. et al. Comparison between discrete and continuous analysis of facial expressions, elicited by bitter-tasting beverages in overweight and healthy-weight individuals. Int. J. Food Sci. Tech. 56, 3876–3884 (2021).
-
Zhi, R., Cao, L. & Cao, G. Asians’ facial responsiveness to basic tastes by automated facial expression analysis system. J. Food Sci. 82, 794–806 (2017).
-
Leitch, K. A. et al. Characterizing consumer emotional response to sweeteners using an emotion terminology questionnaire and facial expression analysis. Food Int. Res. 76, 283–292 (2015).
-
Li, Z. et al. Analysis of facial expressions in response to basic taste stimuli using artificial intelligence to predict perceived hedonic ratings. PLoS ONE 16, e0250928 (2021).
-
Bredie, W. L. P., Tan, H. S. G. & Wendin, K. A comparative study on facially expressed emotions in response to basic tastes. Chemosens. Percept. 7, 1–9 (2014).
-
Danner, L. et al. Make a face! Implicit and explicit measurement of facial expressions elicited by orange juices using face reading technology. Food Qual. Prefer. 32, 167–172 (2014).
-
Casado-Garc´ıa, A. & Heras, J. Ensemble methods for object detection. Eur. Conf. Artif. Intell. 325, 2688–2695 (2020).
-
Ekman, P., W. V. Friesen, W. V. Facial action coding system: a technique for the measurement of facial movement, a technique for the measurement of facial action. Consult Psycol. https://doi.org/10.1037/t27734-000 (1978).
-
Prince, E. B., Martin, K. B., Messinger, D. S. Facial Action Coding System. https://local.psy.miami.edu/faculty/dmessinger/c_c/rsrcs/rdgs/emot/FACSChapter_SAGEEncyclopedia.pdf (2015).
-
Lewinski, P., den Uyl, T. M. & Butler, C. Automated facial coding: validation of basic emotions and FACS AUs in FaceReader. J. Neurosci. Psychol. E. 7, 227–236 (2014).
-
Du, S., Tao, Y. & Martinez, A. M. Compound facial expressions of emotion. PNAS 111, E1454–E1462 (2013).
-
Chen, D. et al. You see what you eat: effects of spicy food on emotion perception. Curr. Psychol. 43, 3275–3291 (2023).
-
Li, S. et al. Machine learning discrimination and prediction of different quality grades of sauce-flavor baijiu based on biomarker and key flavor compounds screening. Food Chem. X. 24, 101877 (2024).
-
Zhang, J. et al. Integrated multi-omics and machine learning reveal the intrinsic relationship between color and flavor variations in processed ginseng products through major pigment dynamics and non-enzymatic pathways. LWT-Food Sci. Technol. 228, 118161 (2025).
-
Chi, Y. et al. Ultrasound-assisted enzymatic extraction of hydroxy-sanshool compounds from the hydrodistillation residue of two Sichuan peppers: optimization, quantification and pungent taste contribution evaluation. RSC Adv. 11, 4547–4554 (2021).
-
Feng, X. et al. Dynamic Zanthoxylum pungency characteristics and their correlation with sanshool composition and chemical structure. Food Chem. 407, 135138 (2023).
-
Schlossareck, C. & Ross, C. F. Consumer sensory evaluation of aftertaste intensity and liking of spicy paneer cheese. Int. J. Food Sci. Tech. 55, 2710–2718 (2020).
-
Siebert, E., Lee, S. Y., Prescott, M. P. Chili pepper preference development and its impact on dietary intake: a narrative review. Front. Nutr. 9, 1039207 (2022).
-
Hauke, J. & Kossowski, T. Comparison of values of Pearson’s and Spearman’s correlation coefficients on the same sets of data. Quageo 30, 87–93 (2011).
-
Snoek, L. et al. Testing, explaining, and exploring models of facial expressions of emotions. Sci. Adv. 9, eabq8421 (2023).
-
Du, S., Tao, Y. & Martinez, A. M. Compound facial expressions of emotion. Proc. Natl. Acad. Sci. USA 111, E1454–E1462 (2014).
-
Yan, W.-J. et al. Perceived emotions and AU combinations in ambiguous facial expressions. Pattern Recogn. Lett. 164, 74–80 (2022).
-
Cui, Z. et al. TastePeptides-EEG: An ensemble model for umami taste evaluation based on electroencephalogram and machine learning. J. Agric. Food Chem. 71, 13430–13439 (2023).
-
Fern´andez, A. et al. SMOTE for learning from imbalanced data: Progress and challenges, Marking the 15 year Anniversary. J. Artif. Intell. Res. 61, 863–905 (2018).
-
Hu, C. et al. An automatic methodology for lithology identification in a tight sandstone reservoir using a bidirectional long short-term memory network combined with Borderline-SMOTE. Acta Geophys. 73, 2319–2335 (2024).
-
Guo, J. et al. Adaptive SV-Borderline SMOTE-SVM algorithm for imbalanced data classification. Appl. Soft Comput. 150, 110986 (2024).
-
Lee, D. K. Data transformation: a focus on the interpretation. Korean J. Anesthesiol. 73, 503–508 (2020).
-
Curran-Everett, D. Explorations in statistics: the log transformation. Adv. Physiol. Educ. 42, 343–347 (2018).
-
Ghorbani, R. & Ghousi, R. Comparing different resampling methods in predicting students’ performance using machine learning techniques. IEEE Access 8, 67899–67911 (2020).
-
Al Majzoub, H. et al. HCAB-SMOTE: a hybrid clustered affinitive borderline SMOTE approach for imbalanced data binary classification. Arab. J. Sci. Eng. 45, 3205–3222 (2020).
-
Douzas, G. & Bacao, F. Geometric SMOTE a geometrically enhanced drop-in replacement for SMOTE. Inf. Sci. 501, 118–135 (2019).
-
Ahmad, M. W., Reynolds, J. & Rezgui, Y. Predictive modelling for solar thermal energy systems: a comparison of support vector regression, random forest, extra trees and regression trees. J. Clean. Prod. 203, 810–821 (2018).
-
Biau, G. & Scornet, E. A random forest guided tour. Test 25, 197–227 (2016).
-
Geurts, P., Ernst, D. & Wehenkel, L. Extremely randomized trees. Mach. Learn. 63, 3–42 (2006).
Acknowledgements
This research was financially supported by the Guangdong Provincial Key Laboratory of Nutraceuticals and Functional Foods (2018B030322010) and the Sichuan Province Key Research and Development Plan Project for the Research and Development of Antibacterial Active Substances and Products of Zanthoxylum armatum DC. (2022YFN0019).
Ethics declarations
Competing interests
The authors declare no competing interests.
Additional information
Publisher’s note Springer Nature remains neutral with regard to jurisdictional claims in published maps and institutional affiliations.
Supplementary information
Rights and permissions
Open Access This article is licensed under a Creative Commons Attribution-NonCommercial-NoDerivatives 4.0 International License, which permits any non-commercial use, sharing, distribution and reproduction in any medium or format, as long as you give appropriate credit to the original author(s) and the source, provide a link to the Creative Commons licence, and indicate if you modified the licensed material. You do not have permission under this licence to share adapted material derived from this article or parts of it. The images or other third party material in this article are included in the article’s Creative Commons licence, unless indicated otherwise in a credit line to the material. If material is not included in the article’s Creative Commons licence and your intended use is not permitted by statutory regulation or exceeds the permitted use, you will need to obtain permission directly from the copyright holder. To view a copy of this licence, visit http://creativecommons.org/licenses/by-nc-nd/4.0/.
About this article

Cite this article
Zheng, S., Kan, Q., Liu, G. et al. Evaluating the pungency perception of Zanthoxylum armatum DC. oil by facial recognition techniques and machine learning. npj Sci Food 9, 214 (2025). https://doi.org/10.1038/s41538-025-00596-4
-
Received:
-
Accepted:
-
Published:
-
DOI: https://doi.org/10.1038/s41538-025-00596-4