Introduction
Rapid population growth, urbanization, industrial expansion, and other economic activities have contributed to a rise in wastewater generation1. Wastewater treatment (WWT) is crucial for mitigating environmental pollution and reducing its impact2,3. Waste water treatment plants (WWTPs) can influence environmental health in various ways, depending on their scale, technology, and treatment methods. During the treatment process, microorganisms may become airborne and disperse into the surrounding environment4. There are approximately one billion species of active microorganisms in biological WWT systems, with a total cell count of around 2.3 × 10⁹ mL⁻1 in activated sludge. These microorganisms play a crucial role in WWT processes and are cultivated using mechanical devices such as Aeration and agitation5. WWTPs can release bioaerosols, potentially impacting worker health6.
Bioaerosols are airborne biological particles, including viruses, bacteria, fungi, and pollen, ranging from nanometers to micrometers in size. Their concentration varies from 1 to 10⁷ CFU/m3, with WWTP studies reporting airborne bacterial levels between 102 and 6 × 10⁴ CFU/m37. Staphylococcus aureus and Escherichia coli are major wastewater pathogens that can be inhaled as bioaerosols, enter the respiratory tract, and subsequently reach the gastrointestinal system, potentially causing infections8. Additionally, potential pathogens such as Aeromonas caviae, Flavobacterium sp., and Staphylococcus lentus, along with opportunistic pathogens like Enterococcus casseliflavus, Pseudomonas fluorescens, and Staphylococcus spp., have been detected in bioaerosols from WWTPs9.
Currently, there are no established occupational exposure standards for bioaerosols. Reports from countries such as the United States, Canada, the United Kingdom, and the Netherlands confirm this. For example, the UK Health and Safety Executive (HSE) states that no country has set exposure limits for bioaerosols or their toxins. Similarly, the Canadian Institut de recherche Robert-Sauvé en santé et en sécurité du travail (IRSST) notes that no such standards exist in the United States or Canada10. To protect the health of employees and the public, it is crucial to assess the composition and concentration of airborne microorganisms in contaminated environments11. In WWTPs, bioaerosol emissions are highest in the pretreatment and primary equalization tank (ET), as well as in areas with mechanical equipment used for wastewater aeration4. Aeration tanks (AT) are a significant source of bioaerosols, with mechanical Aeration generating more dispersion than diffusion aeration6. Additionally, processes such as draining, mixing, and spraying can further contribute to the release of microorganisms into the air7. The type and amount of bioaerosols vary from one WWTP to another. In addition, meteorological conditions can determine the survival of airborne microorganisms12. Factors such as Temperature, relative humidity (RH), and wind speed (WS) can affect the rate of production, diffusion, and deposition of these particles13. Changes in Temperature and RH can alter the bacterial concentration of aerosols. When RH is greater than 35%, the number of microorganisms in the air increases12. Airborne bacterial concentrations are typically higher in colder seasons due to the greater stability of bioaerosols and reduced exposure to ultraviolet radiation. However, in indoor treatment plants, bioaerosol levels increase in warmer seasons7. Workers in WWTPs are exposed to bioaerosols through dermal, mucosal, inhalation, and ingestion, with inhalation exposure being 105 times higher than dermal exposure2. Bioaerosols containing pathogenic microorganisms can infect people through inhalation and skin contact. These particles are easily transported by wind for several kilometers and pose a risk not only to workers but also to nearby residents14. Although WWTP staff mainly focus on the treatment process, sludge management, and effluent quality, they generally lack specific programs for monitoring airborne microbial pollution within the plant environment15. While previous studies have examined bioaerosols in hospitals, residential areas, and urban WWTPs1,2,16,17, little information exists on bacterial bioaerosols in industrial WWTPs located in arid climates18,19.
This study provides a novel contribution by being among the first to investigate bacterial bioaerosols in an industrial wastewater treatment plant situated in an arid region, using a combined methodological framework that integrates culture-based quantification, molecular (PCR-based) identification, and simultaneous real-time monitoring of key environmental variables (Temperature, RH, WS, and UV radiation). Such an integrative approach allows for a more precise understanding of the interaction between airborne bacterial populations and environmental stressors, which has not been previously reported under similar climatic and operational conditions. Accordingly, this research offers new insights into bioaerosol dynamics and health risks in industrial wastewater systems, providing valuable guidance for the development of evidence-based air quality management and occupational health strategies.
Materials and methods
The study areas
The present study was conducted at the Jahanabad Industrial Estate WWTP in Meybod, located approximately 30 km from Yazd city, Iran. The geographical coordinates of the treatment plant are 32°14′45″N latitude and 54°45′00″E longitude. This treatment plant, with an area of over 450,000 hectares, treats wastewater from 190 industrial units operating in the town. Industries located in this town include food, textile, cellulose, electrical and electronics, metal, petrochemical, tile, and ceramic industries. The per capita wastewater production in this industrial town is estimated to be about 1332 cubic meters per day. The units of this treatment plant include a pumping station, equalization tank (ET), anaerobic and Aeration tanks (AT), a sedimentation section, chlorination, and a filtration unit (FU), which are designed as an integrated system for treating industrial wastewater.
Sampling
This study was conducted during the spring and summer of 2020. Sampling times were determined according to the United States Environmental Protection Agency (EPA, 2013) sampling calendar and adjusted to the peak operating hours of the WWTP (9:00–13:00) to ensure maximum bioaerosol release and representative sampling14. A total of 96 bacterial bioaerosol samples were collected at 14-day intervals over 6 months from the ET, AT, FU, and administrative building (AB) of the office building, as well as from locations 100 m upstream (100U) and 100 m downstream (100D) of the WWTP. The sampling sites were selected based on their potential for bioaerosol generation and the accessibility of different operational units within the treatment process. Table 1 shows the geographical coordinates of the sampling points. Previous studies have identified aeration tanks as major emission sources due to turbulence and droplet formation20; thus, the AT was chosen as the primary source point. The ET represented the preliminary treatment stage, and the FU reflected the final stage. The AB and two reference sites, 100U and 100D, were included to assess background and dispersion levels. The upstream point (100U), located 100 m upwind of the facility, represented background conditions, while the downstream point (100D), 100 m downwind, was used to evaluate aerosol dispersion, where lower counts likely resulted from dilution with distance. Although grit chambers are recognized as potential emission sources, this plant lacked a separate grit chamber, as preliminary processes were integrated within the ET.
Bacterial bioaerosol samples were taken during peak operating hours of the treatment plant at a height of 1.5 m above the ground and 1 m from the walls. To increase accuracy, two samples were taken at each sampling location. Sampling of bacterial bioaerosols from the air was performed according to the National Institute of Occupational Safety and Health (NIOSH) method according to the standard (NIOSH-0800) and the recommendations of the US Environmental Protection Agency (EPA) in 2013, using an Anderson single-stage sampler (model 10-710, made in the UK) with a flow rate of 28.3 L/min and a duration of 15 min, every 14 days using 9 cm plates. Sampling was performed using an Anderson single-stage impactor sampler (400 holes with a diameter of 0.25 µm and can pass a flow rate of 10–30 L/min). The sampling pump was calibrated by a rotameter before each sampling step. All equipment was sterilized before sampling21.
The transfer medium used for bacterial samples is Tryptic Soy Agar (TSA). These were aseptically prepared in the laboratory, and to inhibit fungal growth, the antibiotic nystatin was added to the TSA medium at a concentration of 500 μg/L also placed upside down in a specialized transport box containing dry ice for delivery to the sampling site. Plates were sealed and transported to the laboratory under sterile conditions. After sampling, the plates were placed upside down in a box and transported to the laboratory. During each sampling, meteorological parameters such as Temperature and RH were measured using a hygrometer (Wet Bulb Globe Temperature (WBGT) model MK427JY), while wind speed was recorded with an anemometer. Additionally, wind direction, UVA, and UVC radiation levels were measured22. The samples were placed in an incubator at 35 to 37 °C in the laboratory for 24–48 h. Then, the number of bacterial colonies grown on the culture media was counted and recorded as CFU/m3 and CFU/Plate units. The morphology of the colonies that predominated in size and number on each pair of plates from each sampling point was noted. These colonies were then passed onto a plate containing Blood agar medium to obtain a pure colony22,23.
Differential microbiological tests
Differential identification of bacteria was performed according to standard methods. For differential identification of bacteria, samples were first cultured on Blood Agar medium (Merck, Germany) using the isolation method. Plates were incubated at 35–37 °C for 24–48 h in an aerobic incubator (without CO₂ supplementation). In the next step, a Catalase test was performed to differentiate members of the Micrococcaceae family (Micrococcus and Staphylococcus) from Streptococcaceae. For gram-positive cocci, mannitol and novobiocin (NB) susceptibility tests were performed, and for gram-positive bacilli, Simon citrate, indole, SIM, VP, Egg Yolk, and penicillin susceptibility tests were performed24,25,26.
Amplification of DNA
Molecular detection methods and PCR techniques were used to confirm the bacterial species 27,28. To extract DNA from colonies, an aliquot of each colony was dissolved in 1 mL of distilled water, and then the tube containing this mixture was placed in a boiling water bath for 15 min. After that, the solution was transferred to a microcentrifuge and centrifuged for 10 min at 13,000 rpm. At this stage, the DNA remained dissolved in the liquid phase, and the membranes and cell walls were deposited. Then the supernatant was separated and stored as extracted DNA.
After DNA extraction, bacterial 16s rRNA was amplified with universal eubacterial primers that consist of F27 (5ʹ- AGAGTTTGATCMTGGCTCAG-3ʹ) and R1492 (5ʹ- TACGGYTACCTTGTTACGACT-3ʹ), which are targeted to universally conserved regions and permit the amplification of an approximately 1500-bp fragment. PCR reactions were carried out in 25 μl of microtubes consisting of 1μl of each primer, 2.5 μl 10 × buffer, 1μl MgCl2, 0.5 μl dNTPs, 17.5 μl distilled sterile H2O, 0.5 μl Taq DNA polymerase, and one μl of extracted DNA. Thermocycling conditions (SimpliAmp, Applied Biosystems) were as follows: samples were heated at 95 °C for 5 min (1 cycle), 94 °C for 30 s, 58 °C for 30 s, 72 °C for 1 min (30 cycles), and 72 ºC for 5 min. PCR products were visualized on a 1% agarose gel and quantified with an appropriate molecular weight marker (electrophoresis for 30 min). Upon qualification of the band integrity using a gel documentation system, the target samples were forwarded for nucleotide sequencing. The acquired sequencing reads were subsequently interrogated utilizing the Basic Local Alignment Search Tool (BLAST)29.
Statistical analysis
For quantitative variables, after checking the normality of their distribution through the Kolmogorov–Smirnov test (n = 96), mean and standard deviation indices were used. To examine the means of quantitative variables in the treatment plant in different seasons, after checking the normality of the quantitative variable, we used the two-intendent sample T-test. To examine the mean of bacteria in different units, after checking the normality of the data, we used the Welch analysis of variance test (Welch’s ANOVA). Also, the Bonferroni test was used to examine the difference in the mean population of bioaerosols in different units. To examine the relationship between environmental parameters and the number of bioaerosols, Spearman’s correlation coefficient was used, and to examine the relationship between qualitative variables, a separate chi-square test was used for each qualitative parameter. Data analysis was performed using SPSS software (version 22) and GraphPad Prism (version 8), and a p-value of less than 0.05 was considered statistically significant.
Results
Table 2 presents the results of sequencing the dominant bioaerosols identified. Figure 1 illustrates the dominant bacterial species detected during the spring and summer seasons. The results of bacterial sequencing indicated that Kocuria, Bacillus, and Micrococcus were the most dominant bacterial genera identified in this treatment plant, with Bacillus being more abundant than the others. Furthermore, the results revealed that the species Kocuria turfanensis, Bacillus firmus, Kocuria rosea, and Kocuria rhizophila were among the dominant species across most units of the treatment plant.

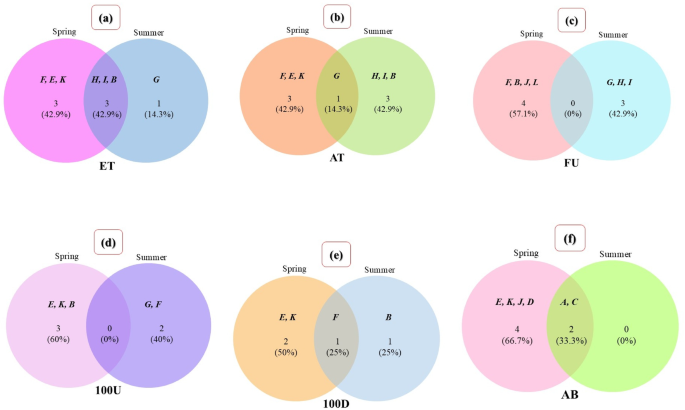
Venn diagram showing the dominant bacterial species identified during the spring and summer seasons. Each part of the diagram corresponds to a specific unit of the wastewater treatment plant: (a) Equalization tank (ET), (b) Aeration tanks (AT), (c) Filtration unit (FU), (d) 100 m upstream (100U), (e) 100 m downstream (100D), (f) Administrative building (AB).
Figure 1 illustrates a Venn diagram depicting the dominant bacterial species identified during the spring and summer seasons. The bacterial sequencing results revealed that Kocuria, Bacillus, and Micrococcus were the most dominant bacterial genera identified in this treatment plant, with Bacillus being more abundant than the others. Additionally, the results indicated that the species Kocuria turfanensis, Bacillus firmus, Kocuria rosea, and Kocuria rhizophila were among the dominant species found in most treatment plant units. When considering the specific units of the plant, several species were present in multiple locations and across both seasons, representing the shared bioaerosol community. The most important shared species included Micrococcus luteus (A), primarily in the Administrative Building (AB); Kocuria rhizophila (B), found in the Equalization Tank (EQ), Aeration Tank (AT), and 100 m Downstream (100D); Micrococcus antarcticus (C), detected in AB; Bacillus firmus (E), present in EQ, 100 m Upstream (100U), and 100D; Kocuria turfanensis (F), detected in EQ, AT, and 100D; Bacillus cereus (G), found in AT, Filtration Unit (FU), and 100U; and Kocuria rosea (K), observed in EQ, AT, and AB. Other species appeared in more limited units or as non-dominant species (Table 1 illustrates full sequencing results).
Table 3 illustrates the mean bacterial bioaerosols in the spring and summer seasons and the total at different sampling points. The results illustrate that bacterial counts differed significantly among sampling points in both seasons (p < 0.001). In spring, the highest mean count was observed in AB (79.63 ± 5.69; 187.58 ± 13.41) and the lowest in 100U (14.75 ± 3.04; 34.74 ± 7.17) (CFU/Plate; CFU/m3). During summer, the EQ unit recorded the highest bacterial load (86.13 ± 5.13; 202.89 ± 12.11), while 100D exhibited the lowest (4.13 ± 1.02; 9.72 ± 2.41). Pairwise comparisons (Bonferroni test) confirmed that differences among sites were significant within each season (p < 0.001). However, seasonal comparison (independent-sample T-test) showed no significant overall difference between spring and summer (p > 0.05), although the mean bacterial concentrations were slightly higher in summer.
According to Table 4, during spring, the highest mean number of bioaerosols (CFU/Plate) was recorded in the AB (79.63 ± 5.69) and EQ (64.13 ± 7.56) units, while the lowest was in the 100U (14.75 ± 3.04). In summer, EQ had the highest mean (86.13 ± 5.13), followed by AT (62.38 ± 5.44) and AB (50.25 ± 4.39), while the lowest was in the 100D (4.13 ± 1.02). Welch’s ANOVA confirmed these trends, the Bonferroni multiple comparison test showed significant differences between EQ and AT (CFU/Plate) in Summer 23.75 (p = 0.003), EQ and FU in spring 41.87 (p = 0.034); in summer 61.62 (p < 0.0001), and EQ and 100U in spring 49.37 (p = 0.006); in summer 69.25 (p < 0.0001). The smallest differences were between FU and 100U or 100D (CFU/Plate), such as 7.50 in spring and 7.62 in summer, indicating similarly low levels in 100D.
Figure 2 illustrates the mean of bacilli (A) and cocci (B) per plate during the spring and summer seasons. The results show that in the spring, the mean of bacilli differed at different sampling points (p < 0.01). Based on Welch’s analysis of variance test, the Bonferroni multiple comparison test showed that the highest number of bacilli was observed at the EQ station in this season, while the lowest number was recorded at a distance of 100D. In the summer season, the mean of bacilli at different sampling points also had a significant difference (p < 0.001). According to Welch’s analysis of variance, the Bonferroni multiple comparison test showed the highest number of bacilli in this season was observed in unit AB, and the lowest at a distance of 100D. Seasonal comparisons indicated that although the mean of bacilli was higher in summer than in spring, the difference between the two seasons was not statistically significant (p > 0.05). In other words, while the mean of bacilli varied across different units of the treatment plant, the overall seasonal variation was not substantial.

Mean of bacilli (a) and cocci (b) per plate during the spring and summer seasons.
Figure 3 illustrates the mean environmental parameters measured during the spring and summer seasons. The mean relative humidity (a) in spring was 10.80 ± 11.73%. The mean Temperature (b) during summer was 34.84 ± 5.50 °C. The mean wind direction (c) in spring (from the end to the beginning of the treatment plant) was 41.00 ± 7.70°. The mean UVA level (d) in summer was 0.71 ± 0.41 W/m2, and the mean UVC level (e) in spring was 0.005 ± 0.005 W/m2. The mean wind speed from inlet to outlet (f) was 1.34 ± 1.48 m/s, while the mean wind speed from outlet to inlet (g) was slightly lower. During some sampling periods, no wind (h) was recorded.

Mean environmental parameters measured during the spring and summer seasons: Relative humidity (a), Temperature (b), mean wind direction (c), UVA (d), UVC (e), Wind inlet to outlet (f), Wind outlet to inlet (g), No wind (h).
The results of the correlation analysis between bacterial bioaerosol populations and ecological factors are summarized in Table 5. To assess the relationship between airborne bacterial counts and wind speed, Spearman’s correlation coefficient was applied. The analysis revealed a weak and inverse correlation between these two variables, which was not statistically significant (r = − 0.08, p = 0.44), indicating that an increase in wind speed was associated with a slight decrease in bacterial concentration. A weak but statistically significant positive correlation was observed between bacterial bioaerosol levels and RH (r = 0.516, p < 0.001), suggesting that higher RH levels were associated with increased bacterial presence. In contrast, a significant inverse relationship was found between ambient Temperature and bacterial bioaerosol levels (r = − 0.56, p < 0.001), indicating a decrease in bacterial counts with rising Temperatures. Furthermore, UVA intensity showed a significant inverse correlation with bacterial bioaerosol concentrations (r = − 0.517, p < 0.001), and a similar inverse and significant relationship was observed with UVC intensity (r = − 0.59, p < 0.001). Overall, increases in UVA and UVC radiation intensity were associated with a reduction in airborne bacterial populations.
Table 6 presents the results of the study of the relationship between bacterial bioaerosol population and wind direction in the spring and summer seasons. To compare the number of airborne bacteria in different environments while controlling for the effect of wind direction in the spring season, a separate Welch analysis of variance test was performed for each wind direction (start to end, end to start, and no wind). The results showed that in the spring season, in all three wind conditions (start to end, end to start, and no wind), there is a significant difference between the bacterial bioaerosol population in different units. Also, the results showed that in the summer season, in the first-to-last and last-to-first modes, there was a significant difference between the bacterial bioaerosol population in different units. However, in times without wind, no significant difference was observed. To better understand the results of Table 6, we can examine the population of bacterial bioaerosols in the summer season in the AT unit. When the wind direction is from the beginning of the treatment plant, that is, from the first and most polluted unit of the treatment plant to the end of the treatment plant, the population of bacterial bioaerosols is higher (79.00 ± 3.00) than in the case of no wind (71.50 ± 9.50). Also, when the wind direction is from the end of the treatment plant, that is, from the last unit of the treatment plant towards the beginning of the treatment plant, the population of bacterial bioaerosols is lower than in the case of no wind (71.50). The results showed that when the wind direction is from head to tail, there is a significant difference between the bacterial bioaerosol population in different units. Also, when the wind direction is from end to beginning, there is a significant difference between the bacterial bioaerosol population in different units. However, when there is no wind, there is no significant difference between the bacterial bioaerosol population in different units.
Discussion
Wastewater generated from various domestic, commercial, and hospital sources or combined wastewaters and sent to WWTPs for treatment processes contains a large and diverse number of pathogenic microorganisms that can be aerosolized (airborne) through various processes in WWTPs and, as a result, pose a health risk to treatment plant workers30. Exposure of WWTP workers to bioaerosols occurs mainly through inhalation or the hand-to-mouth route. Unfortunately, there is no internationally accepted standard for bioaerosol pollution31. Given that WWTPs are one of the most important sources of particulate matter and bacterial and fungal bioaerosols32, and that the concentration of microorganisms in bioaerosols produced by WWTPs is 10-1000 times higher than in the wastewater itself33, there is no specific standard for bioaerosol pollution in the air of WWTPs and their surroundings10. In the present study, the predominant bacterial species present in the air of the WWTP in Jahanabad Industrial Town, Meybod, were investigated and identified.
Bioaerosols in WWTPs are primarily generated in granulation or AT units, where mechanical processes are employed34,35. The results of the present study indicated that the ET (equalization) unit exhibited a high potential for generating bacterial bioaerosols. This may be attributed to the turbulence created by the inflow of wastewater into the ET unit. The splashing of wastewater during this turbulence leads to the formation of particles with diameters ranging from 50 to 100 μm. These droplets rapidly evaporate, resulting in reduced settling velocity and prolonged suspension in the air32. Consistent with these findings, Breza-Boruta reported the highest bioaerosol emissions near the granulation pond, the first operational unit of the treatment facility36. Similarly, Ranalli et al. observed that the highest concentration of airborne aerobic bacteria occurred in the mechanical pretreatment stage37. Additionally, several studies have identified the AT as a major source of bioaerosol emission, primarily due to mechanical turbulence within the unit, which aligns with the findings of the current study38,39,40,41.
The high concentration of bacterial bioaerosols in the AT observed in this study is consistent with previous findings indicating a direct relationship between bioaerosol generation, proximity to the AT, and the intensity of aeration processes11,42,43. Interestingly, Carducci et al. reported low microbial contamination in areas surrounding the AT, which aligns with the present study’s findings44. In a study by Ebrahimi et al., the average bioaerosols in the aeration tank of the WWTP of Morchekhort Industrial Park in Isfahan, Iran, were significantly higher than in other parts of the treatment plant45. This apparent contradiction could be attributed to differences in aeration technologies and equipment. In the WWTP investigated by Carducci, aeration was performed using pressurized air bubbles. In contrast, the current study found moderate to high microbial concentrations in the ET unit, suggesting that mechanically driven systems significantly contribute to the dispersion of microorganisms. The variation in bacterial bioaerosol levels between the AT and ET units can be further explained by the findings of Brandi et al., who reported that surface aeration or mechanical agitation in ATs results in higher bioaerosol emissions compared to diffuser-based aeration systems46. Several factors influence the extent of bioaerosol production, including the size of the treatment facility, the treatment technology employed, and the type of aeration system used. Notably, the lowest bioaerosol emission levels are associated with spray aeration systems42.
Given that aeration systems are often the primary source of bioaerosol release in WWTPs, replacing surface aerators with diffuser aerators is considered an effective strategy to reduce bioaerosol emissions. Diffuser aerators generate smaller bubbles and cause less turbulence in the wastewater compared to extensive surface aerators, thereby limiting the formation and dispersion of bioaerosols38,47. Studies have shown that bioaerosol concentrations increase with larger bubble sizes33. These findings highlight the significant influence of aeration system type on the amount of bioaerosol generated32,43,48. Several investigations have reported that the lowest concentrations of bioaerosols are typically observed around the secondary sedimentation unit, likely due to the absence of mechanical agitation and minimal wastewater turbulence in this area49. The overall concentration of bioaerosols in WWTPs is influenced by various factors, including sampling location36, the type of wastewater and aeration system40,50, meteorological conditions, and the treatment technology employed51.
In the present study, the lowest bacterial concentrations were observed at the downstream point (100D) (4.13 ± 1.02 CFU/Plate; 9.72 ± 2.41 CFU/m3 in summer), whereas the upstream point (100U) showed higher levels (14.75 ± 3.04 CFU/Plate; 34.74 ± 7.17 CFU/m3 in spring). This pattern can be attributed to both environmental and operational factors. The mean wind direction during spring (41.00 ± 7.70°) and average wind speed (1.34 ± 1.48 m/s) generally favored aerosol movement along the treatment line; however, reversed or calm wind conditions observed during some sampling periods could limit downstream transport. Furthermore, elevated Temperature (34.84 ± 5.50 °C) and UV radiation (0.71 ± 0.41 W/m2) in summer likely promoted bacterial inactivation. The progressive reduction of bioaerosols along the treatment sequence (from EQ to FU) due to sedimentation, filtration, and exposure to these environmental conditions may therefore explain the lower bacterial concentrations recorded at 100D despite its downstream location.
In this study, the elevated concentration of bioaerosols in the indoor air of the facility may be attributed to the fact that wastewater quality testing is performed in the same space where personnel are present. This co-location increases the likelihood of microbial contamination. Moreover, it is important to recognize that the quality of outdoor air significantly affects indoor air conditions; thus, ambient air pollution is a critical factor influencing indoor air quality52. The detection of Staphylococcus species in the AB may be due to their natural presence in the human skin and gastrointestinal microbiota. The presence of staff in this part of the WWTP likely contributes to the elevated levels of these bacteria in the AB air53. Makison et al. emphasized that extreme RH levels, both high and low, can substantially affect the survival and environmental stability of Staphylococcus, thereby influencing their persistence and distribution in air samples collected from such environments54.
Several studies have reported a link between bacterial and fungal contamination, seasonal variation, and meteorological parameters. Nielsen et al. demonstrated that microbial concentrations are influenced by seasonal changes55. The findings of the present study also indicated seasonal variation in bioaerosol concentrations, which aligns with the results of Korzeniewska’s research, where bioaerosol emissions were found to be higher during warmer months43. Climatic conditions such as high RH, near-freezing Temperatures, and low wind speed have been shown to promote the formation of bacterial agglomerates. This aggregation increases particle mass and, subsequently, their settling velocity during summer56. Furthermore, our study confirmed that increasing distance from the contamination source leads to a significant reduction in bacterial bioaerosol concentration, a finding consistent with those of previous studies44,48. According to Stellacci et al., bioaerosols are generally not detectable beyond 300 m from WWTPs. Even under unfavorable meteorological conditions, their concentration remains below levels considered hazardous to nearby workers57. Additionally, the current study found a weak correlation between most environmental parameters and bacterial bioaerosol emissions, which is consistent with findings by Oppliger et al.58.
The results of the present study indicated that Bacillus species were dominant in the investigated WWTP. These bacteria possess the ability to form endospores and exhibit high resistance to adverse environmental conditions, which enhances their survival in the air. Their spore-forming capability and metabolic versatility allow them to persist under extreme conditions such as UV radiation, nutrient deprivation, and elevated Temperatures59. No gram-negative bacteria were detected in the collected samples. The predominance of gram-positive bacteria aligns with the findings of Pascual et al., which suggest that gram-negative bacteria are less likely to survive in aerosolized form compared to gram-positive ones due to their cell wall structure and lower environmental stability39. Occupational exposure to bioaerosols in workplaces, especially in wastewater treatment plants, can cause a wide range of adverse health effects, including infectious diseases, acute toxic effects, inflammatory and allergic reactions, chronic obstructive pulmonary disease, fetal damage, and even cancer60. Studies have shown that sewage treatment plant workers have a higher prevalence of “sewage worker syndrome,” which is associated with symptoms such as fatigue, headaches, dizziness, gastrointestinal symptoms, and respiratory problems, than other occupational groups8. A study conducted at a WWTP of a hospital in Bushehr, Iran, showed that the concentration and duration of exposure to bioaerosols have the greatest impact on workers’ health16. These symptoms are likely caused by exposure to a variety of bacterial bioaerosols released during aeration and mechanical treatment processes. Because airborne bacteria typically attach to fine particulate matter, they can be easily transported by wind over considerable distances. Therefore, exposure to these bacteria can pose a potential health risk not only to treatment plant workers but also to residents in nearby areas61.
The study highlights the need to limit worker exposure, especially in high-risk zones such as the AT and ET units. Implementing physical barriers to separate highly contaminated areas from cleaner sections can significantly reduce exposure risks47. Constructing enclosed chambers over operational units can also help minimize the release of bioaerosols into both the facility and the surrounding environment32. Brooks et al. reported that air filtration systems in enclosed WWTP sections effectively reduced bioaerosol exposure, particularly in areas involving mechanical agitation62. Similarly, Li et al. demonstrated the efficacy of granular activated carbon (GAC) adsorption in removing airborne microorganisms59. In a WWTP employing the oxidation ditch process, the use of a mechanical ventilation system reduced airborne bacterial and fungal concentrations by 66.33% and 62.95%, respectively, within four hours63. In addition to engineering controls, the adoption of personal protective measures such as the use of masks, protective clothing, frequent hand washing, and proper hygiene can significantly mitigate infection risk for workers, particularly in high-exposure zones64. The use of diffusers and deep aeration systems in aeration tanks is crucial for reducing bioaerosols in wastewater treatment plants (WWTPs)65. However, due to the current absence of specific guidelines and regulatory standards for airborne bacterial bioaerosols in WWTPs, there is an urgent need for relevant authorities to establish clear policies and protective thresholds to safeguard the health and safety of WWTP personnel.
Limitations
This study has some limitations that should be acknowledged. The sampling period included only two seasons, spring and summer, which may not fully represent the annual variation in bacterial bioaerosol concentrations. Moreover, since culture-based methods were used for bacterial identification, the actual microbial diversity might have been underestimated because non-culturable or slow-growing species were not detected. The investigation was also limited to a single industrial wastewater treatment plant, and therefore, the findings may not be entirely generalizable to other facilities operating under different climatic or operational conditions. In addition, variations in daily plant operation, such as changes in wastewater load or aeration intensity, were not continuously monitored and could have influenced short-term fluctuations in bacterial emissions. Despite these limitations, the study provides valuable baseline information on bacterial bioaerosols in an arid-region industrial WWTP and contributes to a better understanding of their relationship with environmental factors.
Conclusion
The findings of this study demonstrate that industrial WWTPs have a high potential to release bacterial bioaerosols into the surrounding environment, regardless of wastewater composition. Although bacterial concentrations varied among treatment units, seasonal differences were not statistically significant. The highest levels of bacterial bioaerosols were detected in the ET, AT, and AB units, while the lowest levels occurred at the 100U and 100D points. Interestingly, the lower concentrations at the downstream site, despite its position along the prevailing wind path, suggest that environmental factors such as wind variability, Temperature, UV radiation, and progressive treatment processes play a crucial role in reducing airborne bacterial loads. Cocci were more prevalent in spring, whereas bacilli were more abundant in summer. The dominant genera were Bacillus, Kocuria, and Micrococcus, with Bacillus being the most prevalent. Environmental correlation analysis revealed that relative humidity positively affected bacterial concentrations, while Temperature and UV radiation showed inverse relationships. These findings indicate that certain operational areas of WWTPs (particularly ET and AT) can act as hotspots for microbial emissions. Therefore, operators should implement exposure reduction strategies, including improved ventilation in high-emission zones, limiting worker presence near open tanks during humid periods, and ensuring consistent use of personal protective equipment. Regular monitoring of airborne microorganisms is also recommended to identify times and locations of elevated exposure risk. Such preventive measures can enhance both occupational health and environmental safety in similar industrial settings. Given the limited spatial and temporal scope of this study, further large-scale and long-term investigations are warranted to validate and expand upon these results.
Data availability
The supporting data are available from the corresponding authors upon reasonable request.
References
-
Wang, Y. et al. Comparative analysis of bioaerosol emissions: Seasonal dynamics and exposure risks in hospital vs. municipal wastewater treatment systems. Environ. Pollut. 359, 124608 (2024).
-
Vishwakarma, Y. K., Ram, K., Gogoi, M. M., Banerjee, T. & Singh, R. Bioaerosol emissions from wastewater treatment process at urban environment and potential health impacts. J. Environ. Manag. 361, 121202 (2024).
-
Esteki, R., Ehrampoush, M. H., Nasab, H. & Ebrahimi, A. A. Investigating the improvement of the quality of industrial effluents for reuse with added processes: coagulation, flocculation, multi-layer filter, and UV. Sci. Rep. 14(1), 3971 (2024).
-
Niazi, S. et al. Assessment of bioaerosol contamination (bacteria and fungi) in the largest urban wastewater treatment plant in the Middle East. Environ. Sci. Pollut. Res. 22, 16014–16021 (2015).
-
Han, Y. et al. Composition, dispersion, and health risks of bioaerosols in wastewater treatment plants: A review. Front. Environ. Sci. Eng. 15, 1–16 (2020).
-
Zhao, X.-y et al. Bioaerosols emission characteristics from wastewater treatment aeration tanks and associated health risk exposure assessment during autumn and winter. Sci. Total Environ. 851, 158106 (2022).
-
Zhao, Y. et al. Bioaerosol emission and exposure risk from a wastewater treatment plant in winter and spring. Ecotoxicol. Environ. Saf. 287, 117294 (2024).
-
Chen, Y.-h, Yan, C., Yang, Y.-f & Ma, J.-x. Quantitative microbial risk assessment and sensitivity analysis for workers exposed to pathogenic bacterial bioaerosols under various aeration modes in two wastewater treatment plants. Sci. Total Environ. 755, 142615 (2021).
-
Han, Y., Yang, K., Yang, T., Zhang, M. & Li, L. Bioaerosols emission and exposure risk of a wastewater treatment plant with A2O treatment process. Ecotoxicol. Environ. Saf. 169, 161–168 (2019).
-
Kim, K.-H., Kabir, E. & Jahan, S. A. Airborne bioaerosols and their impact on human health. J. Environ. Sci. 67, 23–35 (2018).
-
Karra, S. & Katsivela, E. Microorganisms in bioaerosol emissions from wastewater treatment plants during summer at a mediterranean site. Water Res. 41(6), 1355–1365 (2007).
-
Ding, W., Li, L., Han, Y., Liu, J. & Liu, J. Site-related and seasonal variation of bioaerosol emission in an indoor wastewater treatment station: level, characteristics of particle size, and microbial structure. Aerobiologia 32, 211–224 (2016).
-
Liu, J., Zang, N., Liu, X., Tian, H. & Kang, X. Bioaerosols dispersed from a typical wastewater treatment plant with a membrane bioreactor: Emission characteristics, source analysis and health risk. Process Saf. Environ. Prot. 160, 976–987 (2022).
-
Kermani, M., Dehghani, A., Farzadkia, M., Asl, F. B. & Zeinalzadeh, D. Assessment of bioaerosol contamination in an urban wastewater treatment plant in Tehran Iran. J. Air Pollut. Health. 1(3), 161–170 (2016).
-
Gutierrez, O. et al. Assessment of pH shock as a method for controlling sulfide and methane formation in pressure main sewer systems. Water Res. 48, 569–578 (2014).
-
Tangestani, M., Jafari, A. J., Kermani, M., Kalantary, R. R. & Arfaeinia, H. Application of Monte Carlo simulation and quantitative microbial risk approach to investigate seasonal variation of airborne particulate matter and bioaerosols in medical waste management department and wastewater treatment plant of Iranian hospitals. Results Chem. 15, 102196 (2025).
-
El-Bestawy, E., Ibrahim, M. M. & EsA, S. Quantitative and qualitative analysis of bioaerosols emissions from the domestic eastern wastewater treatment plant, Alexandria Egypt. Sci. Rep. 14(1), 30479 (2024).
-
Lou, M. et al. The bioaerosols emitted from toilet and wastewater treatment plant: A literature review. Environ. Sci. Pollut. Res. 28, 2509–2521 (2021).
-
Crook, B., Gawn, J. M., Swan, J. R. Bacteria, viruses and other bioaerosols in industrial workplaces. Microorg. Home Indoor Work Environ. Divers. Health Impacts Investig. Control. 109 (2016).
-
Tian, J. et al. Detection and characterization of bioaerosol emissions from wastewater treatment plants: Challenges and opportunities. Front. Microbiol. 13, 958514 (2022).
-
Eller, P. M., Cassinelli, M,. NIOSH manual of analytical methods. US Department of Health and Human Services. Public Health Serv. Cent. Dis. Control Prev. Nat. Inst. Occup. Saf. Health. 1994.
-
Han, Y., Yang, T., Xu, G., Li, L. & Liu, J. Characteristics and interactions of bioaerosol microorganisms from wastewater treatment plants. J. Hazard. Mater. 391, 122256 (2020).
-
Li, P., Li, L., Wang, Y., Zheng, T. & Liu, J. Characterization, factors, and UV reduction of airborne bacteria in a rural wastewater treatment station. Sci. Total Environ. 751, 141811 (2021).
-
Sekyere, J. O., Faife, S. L. Pathogens, virulence and resistance genes surveillance with metagenomics can pre-empt dissemination and escalation of untreatable infections: a systematic review and meta-analyses. bioRxiv. 2021.06. 30.450418 (2021).
-
Forbes, B. A., Sahm, D. F. & Weissfeld, A. S. Diagnostic microbiology: Mosby St Louis (2007).
-
Mahon, C. R. & Lehmanm, D. C. Textbook of Diagnostic Microbiology-E-Book: Textbook of Diagnostic Microbiology-E-Book: Elsevier Health Sciences; 2022.
-
Klein, S. et al. Encapsulation of bacterial cells in electrospun microtubes. Biomacromol 10(7), 1751–1756 (2009).
-
Gholami, M. et al. Indigenous bacteria as an alternative for promoting recycled paper and cardboard mill wastewater treatment. Sci. Rep. 12(1), 16767 (2022).
-
Amin, M. M. et al. Improvement of biodegradability of explosives using anaerobic-intrinsic bioaugmentation approach. Bul. Chem. Commun. 49, 735–741 (2017).
-
Al Batanony, M. & El Shafie, M., Work-related health effects among wastewater treatment plants workers. (2011).
-
Mirzaee, S. A., Nikaeen, M., Hajizadeh, Y., Nabavi, B. F. & Hassanzadeh, A. Detection of Legionella spp. by a nested-PCR assay in air samples of a wastewater treatment plant and downwind distances in Isfahan. Adv. Biomed. Res. 4(1), 48 (2015).
-
Filipkowska, Z., Janczukowicz, W., Krzemieniewski, M. & Pesta, J. Microbiological air pollution in the surroundings of the wastewater treatment plant with activated-sludge tanks aerated by horizontal rotors. Pol. J. Environ. Stud. 9(4), 273–280 (2000).
-
Bünger, J., Schappler-Scheele, B., Hilgers, R. & Hallier, E. A 5-year follow-up study on respiratory disorders and lung function in workers exposed to organic dust from composting plants. Int. Arch. Occup. Environ. Health 80, 306–312 (2007).
-
Filipkowska Z., Janczukowicz W., Krzemieniewski M. & Pesta J. Municipal wastewater treatment plant with activated sludge tanks aerated by CELPOX devices as a source of microbiological pollution of the atmosphere. Pol. J. Environ. Stud. 11 6 (2002).
-
Haas, D. et al. Exposure to bioaerosol from sewage systems. Water Air Soil Pollut. 207, 49–56 (2010).
-
Breza-Boruta B. & Paluszak Z. Influence of water treatment plant on microbiological composition of air bioaerosol. Pol. J. Environ. Stud. 16 5 (2007).
-
Ranalli, G., Principi, P. & Sorlini, C. Bacterial aerosol emission from wastewater treatment plants: Culture methods and bio-molecular tools. Aerobiologia 16, 39–46 (2000).
-
Sánchez-Monedero, M., Aguilar, M. I., Fenoll, R. & Roig, A. Effect of the aeration system on the levels of airborne microorganisms generated at wastewater treatment plants. Water Res. 42(14), 3739–3744 (2008).
-
Pascual, L. et al. Bioaerosol emission from wastewater treatment plants. Aerobiologia 19, 261–270 (2003).
-
Kruczalak K. & Olanczuk-Neyman K. Microorganisms in the air over wastewater treamtment plants. Pol. J. Environ. Stud. 13 5 (2004).
-
Laitinen, S. et al. Workers’ exposure to airborne bacteria and endotoxins at industrial wastewater treatment plants. Am. Ind. Hyg. Assoc. J. 55(11), 1055–1060 (1994).
-
Vítězová, M., Vítěz, T., Mlejnková, H. & Lošák, T. Microbial contamination of the air at the wastewater treatment plant. Acta Universitatis Agriculturae et Silviculturae Mendelianae Brunensis. 60(3), 233–240 (2013).
-
Korzeniewska, E. et al. Determination of emitted airborne microorganisms from a BIO-PAK wastewater treatment plant. Water Res. 43(11), 2841–2851 (2009).
-
Carducci, A. et al. Assessing airborne biological hazard from urban wastewater treatment. Water Res. 34(4), 1173–1178 (2000).
-
Ebrahimi, A. A., Ehrampoush, M. H., Rezaie, A , Forghani, S., Rezvani, M. & Zadeh, Z. S. et al. Assessment of seasonal variation of microbial aerosol and gaseous emissions from wastewater treatment plant of Morche Khort industrial town. J. Environ. Health Sustain. Dev. 2022.
-
Brandi, G., Sisti, M. & Amagliani, G. Evaluation of the environmental impact of microbial aerosols generated by wastewater treatment plants utilizing different aeration systems. J. Appl. Microbiol. 88(5), 845–852 (2000).
-
Kim, K.-Y., Kim, H.-T., Kim, D., Nakajima, J. & Higuchi, T. Distribution characteristics of airborne bacteria and fungi in the feedstuff-manufacturing factories. J. Hazard. Mater. 169(1–3), 1054–1060 (2009).
-
Fernando, N. L. & Fedorak, P. M. Changes at an activated sludge sewage treatment plant alter the numbers of airborne aerobic microorganisms. Water Res. 39(19), 4597–4608 (2005).
-
Fathi, S., Hajizadeh, Y., Nikaeen, M. & Gorbani, M. Assessment of microbial aerosol emissions in an urban wastewater treatment plant operated with activated sludge process. Aerobiologia 33, 507–515 (2017).
-
Michałkiewicz, M., Pruss, A., Dymaczewski, Z., Jeż-Walkowiak, J. & Kwaśna, S. Microbiological air monitoring around municipal wastewater treatment plants. Pol. J. Environ. Stud. 20 5 (2011).
-
Małecka-Adamowicz, M., Donderski, W. & Dokładna, W. Microflora of air in the sewage treatment plant of Kapuściska in Bydgoszcz. Pol. J. Environ. Stud. 20 5 (2011).
-
Baudet, A. et al. Indoor air quality in healthcare and care facilities: Chemical pollutants and microbiological contaminants. Atmosphere 12(10), 1337 (2021).
-
Madsen, A. M. et al. Concentrations of staphylococcus species in indoor air as associated with other bacteria, season, relative humidity, air change rate, and S. aureus-positive occupants. Environ. Res. 160, 282–291 (2018).
-
Makison, C. & Swan, J. The effect of humidity on the survival of MRSA on hard surfaces. Indoor Built Environ. 15(1), 85–91 (2006).
-
Nielsen, B. H., Nielsen, E. M. & Breum, N. O. Seasonal variation in bioaerosol exposure during biowaste collection and measurements of leaked percolate. Waste Manag. Res. 18(1), 64–72 (2000).
-
Després, V. et al. Primary biological aerosol particles in the atmosphere: A review. Tellus B Chem. Phys. Meteorol. 64(1), 15598 (2012).
-
Stellacci, P., Liberti, L., Notarnicola, M. & Haas, C. N. Hygienic sustainability of site location of wastewater treatment plants: A case study I Estimating odour emission impact. Desalination 253(1–3), 51–56 (2010).
-
Oppliger, A., Hilfiker, S. & Vu, D. T. Influence of seasons and sampling strategy on assessment of bioaerosols in sewage treatment plants in Switzerland. Ann. Occup. Hyg. 49(5), 393–400 (2005).
-
Li, L., Gao, M. & Liu, J. Distribution characterization of microbial aerosols emitted from a wastewater treatment plant using the orbal oxidation ditch process. Process Biochem. 46(4), 910–915 (2011).
-
Carducci, A. et al. Quantitative microbial risk assessment for workers exposed to bioaerosol in wastewater treatment plants aimed at the choice and setup of safety measures. Int. J. Environ. Res. Public Health 15(7), 1490 (2018).
-
Yang, K. et al. Airborne bacteria in a wastewater treatment plant: Emission characterization, source analysis and health risk assessment. Water Res. 149, 596–606 (2019).
-
Brooks, J. P., Gerba, C. P. & Pepper, I. L. Bioaerosol emission, fate, and transport from municipal and animal wastes. Biol. Aerosols Gener. Land Appl. Biosolids Microb. Risk Assess. 1050, 19 (2004).
-
Guo, X., Wu, P., Ding, W., Zhang, W. & Li, L. Reduction and characterization of bioaerosols in a wastewater treatment station via ventilation. J. Environ. Sci. 26(8), 1575–1583 (2014).
-
Heinonen-Tanski, H., Reponen, T. & Koivunen, J. Airborne enteric coliphages and bacteria in sewage treatment plants. Water Res. 43(9), 2558–2566 (2009).
-
Jari, H. et al. Airborne bacteria and fungi in a wastewater treatment plant: Type and characterization of bio-aerosols, emission characterization and mapping. Aerobiologia 38(2), 163–176 (2022).
Acknowledgements
The authors would like to gratefully acknowledge the research deputy of Shahid Sadoughi University of Medical Sciences, Yazd.
Ethics declarations
Competing interests
The authors declare no competing interests.
Ethics approval
The present study has the code of ethics IR.SSU.SPH.REC.1398.132 of Shahid Sadoughi University of Medical Sciences, Yazd, Iran.
Additional information
Publisher’s note
Springer Nature remains neutral with regard to jurisdictional claims in published maps and institutional affiliations.
Rights and permissions
Open Access This article is licensed under a Creative Commons Attribution-NonCommercial-NoDerivatives 4.0 International License, which permits any non-commercial use, sharing, distribution and reproduction in any medium or format, as long as you give appropriate credit to the original author(s) and the source, provide a link to the Creative Commons licence, and indicate if you modified the licensed material. You do not have permission under this licence to share adapted material derived from this article or parts of it. The images or other third party material in this article are included in the article’s Creative Commons licence, unless indicated otherwise in a credit line to the material. If material is not included in the article’s Creative Commons licence and your intended use is not permitted by statutory regulation or exceeds the permitted use, you will need to obtain permission directly from the copyright holder. To view a copy of this licence, visit http://creativecommons.org/licenses/by-nc-nd/4.0/.
About this article

Cite this article
Salari, M., Ardakani, M.A., Nasab, H. et al. Evaluation of bacterial bioaerosols and their relationship with environmental factors in the air of the wastewater treatment plant of industrial. Sci Rep 15, 44827 (2025). https://doi.org/10.1038/s41598-025-28692-1
-
Received:
-
Accepted:
-
Published:
-
Version of record:
-
DOI: https://doi.org/10.1038/s41598-025-28692-1