Abstract
Undernutrition is widespread in developing countries and exacerbated by conditions such as nodding syndrome, with a prevalence of 4.5% in northern Uganda. To combat this problem, nutrient-rich formulae were developed using locally sourced ingredients. Preferred formulae were analysed for nutritional, physico-chemical, antinutritional, and functional properties using standard methods. The composites were developed from two main energy lines (maize and sorghum), with ingredients at ratios of 70:2:15:5:3:5 for maize/sorghum: silver fish: soybean: orange-fleshed sweet potato (OFSP): beans: chia seeds, respectively. Compared with the sorghum-based formula, maize-based formula had significantly higher amounts of selenium, potassium, and vitamins A and D; the bioavailability of iron and zinc; and in vitro protein digestibility. Unlike the sorghum-based formula, the maize-based formula also had lower levels of antinutritional factors and a better fatty acid profile (p < 0.05). The sorghum-based formula had significantly higher levels of ash, crude protein, magnesium, calcium, and vitamin B6 and a higher oil absorption capacity and bulk density. Whereas maize-based formula is good in levels of selenium, vitamins A and D, bioavailability of zinc and iron, protein digestibility and antinutritional factors, the sorghum-based formula is better in terms of crude protein, ash, oil absorption capacity and bulk density. Therefore, the choice of each formula should depend on the benefits targeted.
Introduction
Malnutrition remains a major challenge in both developing and industrialized countries. Globally, pooled estimates show that the prevalence rates of overweight and obesity among children and adolescents are 14.8% and 22.2%, respectively1. It is projected that approximately 167 million people worldwide will experience compromised health due to being overweight or obese by 2025. In addition, 47 million people are underweight, and 340 million suffer from micronutrient deficiencies worldwide2. Although developing countries face a double burden of malnutrition, undernutrition outweighs overnutrition in its impact3. The prevalence is higher in Southeast Asia and Sub-Saharan Africa than in other regions4,5. In Uganda, the national prevalence of undernutrition is 9% overall, with 14% among women of reproductive age (15–49 years) and men (15–54 years), respectively6. In northern Uganda, the prevalence of wasting was 9% among women, while Pader district recorded up to 12% prevalence of wasting among women of reproductive age7.
There is a link between malnutrition and nodding syndrome (NS). NS is a condition of unknown cause, characterized by frequent atonic seizures. It is complicated by tonic clonic, focal, myoclonic or atypical absence seizures; cognitive and motor decline; malnutrition; and behavioural and emotional difficulties8. It affects many people in Uganda and across other sub-Saharan African countries9,10,11. The condition typically manifests with undernutrition, both as wasting and stunting9,12,13. In such cases, deficiencies in micronutrients such as selenium, vitamin D and vitamin B6 are common14,15,16,17. The situation is worsened by high levels of food insecurity in the region, as most families feed on stapples known to be less nutritious. A number of studies have reported significant association between NS and malnutrition prevalence, especially undernutrition, among affected individuals. For example, Spencer et al.16. reported a case‒control study in the Kitgum district in northern Uganda, where more cases than controls were associated with vitamin B6 deficiency. Enyagu and Bazira13 reported that undernutrition was associated with NS cases. In this study, 100% were wasted, 90% were stunted and 78% were underweight. Significant factors associated with undernutrition being a lack of food, seizures at food and early weaning. A retrospective review of 32 NS children admitted to health facilities in northern Uganda revealed that moderate and severe undernutrition among cases improved following 13 months of regular nutritional, multivitamin and antiseizure supplementation18. Nodding syndrome, especially in parents, can nutritionally affect children. For example, Nyakato et al.19. reported that children born to mothers with NS had significantly poorer nutritional and growth outcomes than those born to NS-free mothers. A study conducted in northern Uganda by Kitara et al.8. also linked several anthropometric indicators, such as head circumference, which depended on the duration of NS sickness. In terms of minerals, the serum concentrations of potassium and sodium were lower in NS patients than in controls. Furthermore, a case series reported by Idro et al.12. revealed that undernutrition, especially wasting and stunting, was associated with NS in Ugandan children admitted to Mulago National Referral Hospital.
Most of the interventions to manage nodding syndrome in northern Uganda have been primarily medical20,21, although proper nutrition is crucial for treatment effectiveness22. Because nodding syndrome cases involve people who will be future parents, they require adequate and well-tailored interventions. Nutritious and acceptable foods for any nutritional condition can be formulated by combining locally available food items to meet particular nutritional needs of the target group23,24,25. Northern Uganda is endowed with nutritious food items that, if used well, can address the nutritional needs of affected individuals26. However, these locally available nutritious foods have been largely unexplored for use in the dietary management of NS. Furthermore, these foods are often consumed without value addition, which limits their application in managing medical conditions such as NS. In addition, the lack of value added to these nutrient-rich items means that these foods have a long preparation time, which consumes energy and makes them impractical as dietary interventions in resource-limited communities affected by NS. Despite the evidence linking NS with undernutrition, the literature on food-based approaches-particularly the development of nutrient-rich composites from locally available ingredients for development of nutrient-rich composites from locally available ingredients for dietary management of NS in poor communities-remains scarce in the context of northern Uganda.
Importantly, processing different food ingredients into a formulation can affect a number of product attributes. This includes the bioavailability of the target nutrients, due to interactions among the ingredients and their physicochemical and functional properties27,28,29,30. As such, it is important to evaluate the quality attributes of newly developed food products before they are recommended for use by the target group. This study evaluated the nutritional and functional quality of locally developed food composites to target the nutritional needs of individuals with nodding syndrome in northern Uganda. The region is known to be agricultural and produces many food items despite having a high prevalence of NS, which is associated with malnutrition. For example, the seasonal food production level has been 55 metric tons (MT) for maize, 23 MT for millet, 25 MT for sorghum, 10 MT for beans, 16 MT for sweet potato and 6 MT for soybeans, in the Acholi subregion of Northern Uganda, where the study was conducted31.
Results
Proximate composition of the formulated composite
As shown in Table 1, significant differences were observed between the two formulations in moisture content, ash content and crude protein content. The moisture content of the maize-based formula was significantly higher than that of the sorghum-based formula (p < 0.05), at 8.92% versus 7.99%, respectively. On the other hand, the sorghum-based formula had a significantly higher ash content than the maize-based formula (p < 0.05), at 2.23% versus 2.08%, respectively. Similarly, for crude protein, the sorghum-based formula had a significantly higher value than the maize-formula, at 7.85% versus 7.45%, respectively. However, the main energy source did not significantly affect crude fat (p = 0.186), crude fibre (p = 0.101), total carbohydrate (p = 0.267) or total energy content (p = 0.157) when the two formulae were compared.
Minerals and vitamin contents of the formulated composite by main energy source
The micronutrient contents of the composites are presented in Table 2. The maize-based formula contained significantly higher potassium (351.69 mg/100 g) than the sorghum-based formula (314.38 mg/100 g) (p < 0.001). In contrast, the sorghum-based formula had significantly higher magnesium (115.83 mg/100 g versus 105.07 mg/100 g) and calcium (144.35 mg/100 g versus 134.52 mg/100 g) than maize-based formula (p < 0.05). However, there was no significant difference in the sodium and phosphorus contents between the two formulae (p > 0.05). For trace elements, a significant difference was observed only for selenium, where the maize-based formula had significantly higher amounts than the sorghum-based formula, with 18.43 µg/100 g versus 17.83 µg/100 g, respectively. There were no significant differences in zinc, iron, copper or manganese levels between the two formulae (p > 0.05). Compared with the sorghum-based formula, the maize-based formula contained significantly higher levels of vitamins A (42.37 µg/100 g versus 36.18 µg/100 g) and D (334.79 µg/100 g versus 195.61 µg/100 g) (p < 0.05). The sorghum-based formula, however, had a significantly higher level of vitamin B6 than did the maize-based formula (p < 0.05), at 26.25 mg/100 g versus 21.15 mg/100 g, respectively.
Antinutritional factors, micronutrient bioavailability and protein digestibility of nutrient-dense food composites formulated from local food materials
Table 3 shows significant differences in the levels of all antinutritional factors studied between the maize- and sorghum-based formulae. In this regard, the sorghum-based formula had significantly higher values of antinutritional factors than the maize-based formula (p < 0.05). The values were 0.87 mg/100 g versus 0.50 mg/100 g for phytate, 8.13 mg/100 g versus 5.47 mg/100 g for total tannins, 19.60 mg/100 g versus 2.97 mg/100 g for total polyphenols and 18.43 mg/100 g versus 5.72 mg/100 g for trypsin inhibitors. The proportion of bioavailable zinc was higher than that of iron. The proportion of bioavailable zinc in the maize-based formula (54.93%) was significantly higher than that in the sorghum-based formula (33.53%) (p < 0.05). In terms of iron bioavailability, the proportion of bioavailable minerals was also significantly higher (p < 0.05) in the maize-based formula (50.01%) than in the sorghum-based formula (22.92%). Finally, protein digestibility was significantly higher in the maize-based formula (37.4%) than in the sorghum-based formula (35%).
Functional properties of the formulated composites
Table 4 presents the results of the variations in the functional properties of nutrient-dense formulae from two main energy food sources, maize and sorghum. Compared with the maize formula, the sorghum-based formula showed significantly higher oil absorption (3.0% versus 1.36%) and bulk density (0.89 g/cm3 vs. 0.79 g/cm3) (p < 0.05). In contrast, the maize-based formula had higher values of peak time (5.93 min vs. 3.78 min), pasting temperature (87.98 °C versus 81.58 °C) and viscosity (861 RVU versus 292.3 RVU) than sorghum-based formula (p < 0.05).
Fatty acid profile of nutrient-dense food composites
As shown in Table 5, the fatty acid compositions of the two composites differed significantly in relative weight.
The dominant fatty acids detected included palmitic acid (16:0), stearic acid (18:0), oleic acid (18:1), linoleic acid (18:2) and linolenic acid (18:3). Compared with the sorghum-based formula, the maize-based formula contained significantly higher values of oleic acid, linoleic acid and linolenic acid. On the other hand, sorghum-based formula had significantly higher palmitic acid than maize-based formula (p = 0.002). There was no significant difference in the mean stearic acid composition when the two formulae were compared (p = 0.927). Finally, the maize-based formula contained significantly higher monounsaturated fatty acids (MUFAs) (62%) and polyunsaturated fatty acids (PUFAs) (57%) than the sorghum-based formula (p < 0.05). There was however, no significant difference when the composite formulae were compared for SAFAs (p = 0.511).
Discussions
Nodding syndrome is associated with undernutrition and deficiencies in essential nutrients such as iron, zinc, and selenium32. These deficiencies are attributed to the routine consumption of carbohydrate-rich diets33, a common practice in northern Uganda. One approach to addressing these problems is to develop nutrient-rich food rations of public health importance. However, food formulations can negatively affect the levels and bioavailability of target nutrients due to interactions among different ingredients30. This study evaluated the nutritional quality of nutrient-dense food composites formulated from local food materials that targeted the nutritional needs of nodding syndrome patients in northern Uganda.
Proximate composition is often used as an indicator of nutritional quality and shelf life in food products, which reflects their suitability for use34. The low moisture content of the formulated formulae suggests good storage stability because they prevent mold growth and other chemical reactions28. The moisture content of a food is influenced by factors such as the type of food, variety, and storage conditions36. The moisture content of the maize-based formula was higher than that of the sorghum-based formula, probably because of the roasting of sorghum. This processing technique is known to lower the moisture content of cereal flours37. However, both formulae had moisture contents within the acceptable limits for cereal flours, which is less than 10%. The ash content of food indicates its total mineral content such as iron, calcium, and potassium38,39. The high ash content observed is likely due to the incorporation of ingredients such as silverfish and iron-rich beans which are known to be rich in minerals40. The sorghum-based formula had a higher ash content than the maize-based formula, possibly because sorghum, the main ingredient, was malted and roasted, which positively impact the ash content41,42. On top of that, sorghum not being dehulled unlike maize makes sense to have higher ash content since dehulling reduces the level of minerals which make up the ash43. This implies that it could potentially supply more minerals than the maize-based formula. The crude protein level in both formulae was higher than previously reported values of approximately 7% and 4.2% obtained in sorghum and maize-based composites in Kenya and Uganda, respectively44,45. The levels were, however, below other findings, which were above 10%46,47. The high protein content of the two formulations could be due to silver fish, beans and soybeans. These all have high protein contents above 20%. Compared with the maize-based formula, the sorghum-based formula had a significantly greater level of crude protein. This is due to the reduction in fats and carbohydrates, as they are utilized during respiration as well as the synthesis of other amino acids48.
In terms of minerals and vitamins, sorghum-based formula could contain relatively high levels of magnesium and calcium. This is because sorghum, the dominant ingredient, was not dehulled, unlike maize. Dehulling has been found to reduce the level of mineral nutrients in cereals, which could explain this observation43. In addition, sorghum grain has been previously found to have higher levels of calcium than maize does, which is another probable explanation43. However, the higher potassium level of maize-based formula than sorghum-based formula could be because malting has been found to significantly reduce the potassium concentration in cereal grains49. Although the vitamin A content of cereal grains can increase during germination50, maize-based formula (not malted) had higher vitamin A and D contents than sorghum. This was likely because roasting reduces vitamin D concentration in foods51. Carotenoids are concentrated in the corneous endosperm (74–86%), followed by the endosperm (9–23%) and germ (2–4%)52. Milling maize could increase the composite’s carotenoid content, and thus its vitamin A level compared with sorghum-based formula53,54. Compared with the maize-based formula, the sorghum-based formula resulted in significantly higher levels of vitamin B6. This could be due to the malting of sorghum, the main ingredient. Such a process results in the synthesis of a number of B vitamins55. On the other hand, the maize-based formula had higher amounts of selenium than the sorghum-based formula. The differences could be due to the higher total selenium content of maize than sorghum, and maize contains more selenium than sorghum does56. Selenium plays key protective roles against a wide range of diseases, such as cancer, cardiovascular disease, neurodegenerative disease, and infertility57. This important trace element has been found to be deficient among nodding syndrome patients12,58.
Although malting is generally known to reduce the antinutritional components of plant-based foods59, the malted sorghum-based formula had higher levels of these components than the maize-based formula. This could be because maize flour is known to contain lower concentrations of tannins and phytic acid than sorghum flour does. This in turn, has lower concentrations of total polyphenols and trypsin inhibitor activity than maize flour does60,61,62,63. In addition, maize was dehulled once. This processing technique is known to reduce the concentration of antinutritional factors, which are always concentrated in the maize bran64. The levels of tannins and trypsin inhibitory activity observed in this study were higher than those reported in previous studies involving maize‒soybean composites65,66,67. This could be because the maize and soybeans in those formulations were steeped in water. This further reduced the composition of antinutritional factors. In contrasts, the maize-based formula in the present study had lower phytate concentrations than those reported in the above studies, probably because of dehulling. The higher bioavailability of iron and zinc in the maize-based formula than in the sorghum formula could be due to the high level of antinutritional factors in sorghum. These factors are known to cause a significant reduction in the bioavailability of such micronutrients62. The bioavailability of iron and zinc obtained in this study is far higher than the values obtained from a previous study. That previous study involved a blend of millet-sesame-soybean, which also responded to nutrition gaps in northern Uganda68. This could be because the present study included more ingredients rich in the two minerals mentioned above. For example, silver fish, which contain 2.6–10.7 mg/100 g of iron and 4.1–10.3 mg/100 g of zinc69; chia seeds, which contain 7.7–24.4 mg/100 g of iron and 4.6–6.9 mg/100 g of zinc70; and iron-rich beans, which contain 7.0 mg/100 g of iron71. The protein in vitro digestibility in the current study was, however, lower than values obtained from previous studies68,72. This could be because, in previous studies, there were few ingredients with few protease inhibitors and food matrices, which could increase the bioavailability of protein, unlike in the current study.
The functional properties determine the suitability of a given food product for targeted end use73. The oil absorption capacity indicates the rate at which proteins bind to lipids in food formulations35. This makes flour suitable for improving flavour and mouthfeel when it is used in food preparation28. The oil absorption capacity (OAC) of sorghum-based formula could have been higher than that of maize-based formula due to malting of sorghum. This processing technique is known to increase the OAC of sorghum, peaking on the third day75. This increase in OAC during germination is likely due to the change in protein quality. During such a process, some amino acids are synthesized, and this protein promotes oil absorption76. The OAC for the maize-based formula in this study is lower than the OAC obtained in a previous study28 of different formulations: maize-millet, soybean‒wheat, and rice‒wheat at ratios of 70:30, 50:50, and 30:70, respectively. This could be due to the dehulling of maize in the current study, a processing step known to have a significant effect on OAC77. However, sorghum-based formula had higher OAC scores than other composite products with sorghum as the dominant ingredient78. This implies that sorghum should have better organoleptic properties, such as mouth feel, flavour, and texture, which positively influence overall product acceptability79. In foods, oil is usually bound to proteins, particularly amino acids28. This may explain why sorghum-based formula had higher crude protein values than maize-based formula.
The bulk density, which measures the heaviness of flour, can be affected by the particle size and flour density76. Dehulling of maize was previously found to decrease the bulk density from 0.76 g/mL to 0.65 g/mL77. This could explain why the maize-based formula had a lower bulk density than the sorghum-based formula in the present study. However, the bulk density of the composites in this study was generally higher than that reported in other studies that investigated the bulk density of maize and sorghum malted flours74,78. This is possibly because of the different treatments the ingredients in this study underwent. Unlike those two studies, the maize in this study was not malted. Even in the case of sorghum-based formula where malting was performed, it took only two days, unlike in some cases in those studies where malting was performed for three days. Notably, higher bulk density is desirable for nutrient-dense food composite targeting undernutrition as higher energy and nutrient density per volume is always the goal80.
The water absorption capacity (WAC) determines the ability of flour or starch to hold or retain water against gravity29. It is important in the bulking and consistency of products as well as in baking applications79. The good water absorption capacity of composite flours can prove useful in the manufacture of products where good viscosity is required81. The WAC in both composite formulae in this study is higher than that obtained in a previous study79, which ranged from 0.7% to 1.32%, probably due to differences in ingredient composition.
The peak viscosity indicates the water binding capacity as well as the ease with which the starch granules disintegrate, and it is correlated with the final product quality82. In other words, it is the maximum viscosity achieved after the temperature has risen above the pasting temperature83. The peak viscosity is closely associated with high starch damage, which in turn enhances viscosity84. The pasting temperature (PT) refers to the temperature at which the viscosity of starch begins to increase during heating. Hence, it is the minimum temperature required for cooking85. The pasting temperature here is higher than the values previously obtained in other studies while using Rapid Visco Analyser (RVA), which were 74.28–76.67 °C and 73.48–75.10 °C86, 70.00–80.33 °C87 and 75.02°−76.72 °C for different composites involving cereals. The high pasting temperatures in this study indicate the resistance potential of the ingredients against swelling. This could be correlated with the amount of starch (amylose and amylopectin) present in the flours86,87. The high pasting temperature of flour is important for creating a strong and elastic dough and improving the texture and mouthfeel87. This make the products in the current study suitable for food applications as thickeners and gelling agents88. Finally, sorghum-based formula had lower pasting temperatures than maize-based formula. This implies that it requires less energy to prepare. This is more suitable for resource-constrained beneficiaries, such as caregivers, for nodding syndrome cases. The higher pasting temperature and viscosity of maize-based formula than sorghum-based formula implies that it will require more energy or fuel to cook it unlike for sorghum-based formula. This is a significant barrier to its to its use by resource-limited households with nodding syndrome cases.
The peak time offers an indication of the minimum time required to cook the flour86. The shorter peak time in the sorghum-based formula than in the maize-based formula could be due to malting. This processing technique has previously been found to reduce the peak time89. This implies that maize-based formula require more energy to cook than sorghum-based formula do because the intermolecular bonds in maize need to be broken to achieve gelatinization90.
In terms of the fatty acid profile, the maize-based formula generally had significantly higher monounsaturated and polyunsaturated fatty acids than the sorghum-based formula did (p < 0.05). Maize flour has been reported to have a lower fatty acid concentration than sorghum flour in previous studies66,91. The sorghum-based formula could have had a lower fatty acid composition because of soaking and malting, which sorghum underwent92. Because it is rich in polyunsaturated fatty acids, the maize-based formula is preferable for supporting health and brain function, which is particularly important for NS patients93,94. Unsaturated fatty acids are essential and play a number of functions in the human body. For example, oleic acid has been found to have a small blood pressure–lowering effect95 and is likely to improve glucose control and insulin sensitivity96. Furthermore, human cell membranes contain high amounts of linoleic acid. This is known to lower blood cholesterol and low-density lipoprotein (LDL) cholesterol concentrations, hence lowering cardiovascular disease (CVD) incidence and mortality97. Linolenic acids, commonly found in crops such as chia seeds98, are known to have cardiovascular and anti-inflammatory health benefits99.
A summary of the difference between maize-based and sorghum-based formulae has been highlighted in Table 6. In summary, it can be noted that maize-based formula outperformed sorghum-based formula in key nutrition and anti-nutritional factors like levels of selenium, vitamins A and D, bioavailability of zinc and iron, protein digestibility and antinutritional factors. On the other hand, the sorghum-based formula performed better than maize-based formula in terms of crude protein, ash, oil absorption capacity and bulk density. Therefore, the choice of each formula should depend on the benefits targeted.
Conclusion and recommendations
Food formulations have previously been developed to address the nutritional needs of different population groups. However, such interventions remain underexplored for chronic conditions such as nodding syndrome (NS), which is strongly associated with undernutrition. This study evaluated the nutritional and functional quality of nutrient-dense food composites formulated from locally available foods to address the nutritional needs of NS patients in northern Uganda. The results demonstrate that both sorghum- and maize-based composites are suitable for NS patients due to their rich nutrient profiles. The maize-based formula performed better than sorghum-based formula in terms of minerals, fat soluble vitamins, antinutritional factors, fatty acid profile, protein digestibility and the bioavailability of zinc and iron. Conversely, the sorghum-based formula outperformed maize-based formula in proximate composition, water-soluble vitamins and functional properties. These differences are important for guiding public health practitioners in selecting appropriate nutrient-dense composites for managing NS. To maximize benefits of sorghum-based composites, strategies to reduce their high antinutritional factors, which limit nutrient bioavailability, should be explored. To guide future interventions, efficacy trials of these composites among the target population should be conducted to assess nutritional responses and determine optimal conditions for maximising their benefits. Future studies should also investigate how alternation in processing methods e.g., malting duration, and roasting parameters, can contribute to the reduction of the antinutritional factors from the food ingredients. This should be carefully done to preserve the important nutritional and functional benefits already highlighted in this study.
Materials and methods
Selection of food materials for composite development
The nutrient-dense formulations were developed from locally sourced food ingredients, including biofortified orange-fleshed sweet potato variety OFSP-NASPOT 8 (Ipomoea batatas), soybean variety MAKSOY 3 N (Glycine max), silver fish (Rastrineobola argentea), iron-rich beans-NARO Bean 1 (Phaseolus vulgaris), maize of local variety (Zea mays), sorghum of local red color variety (Sorghum bicolor), and chia seeds-local variety (Salvia hispanica). These samples were chosen because of their nutrient profiles. For example, maize and sorghum mainly supply 358 kcal/100 g and 329 kcal/100 g of energy, respectively100, whereas beans and soybeans, with approximately 45% protein101, provide a low-cost source of protein for households that cannot afford animal protein regularly. Soybeans with 25% fat were also supplied with fatty acids in the composite101. Silver fish with 53.35% protein69 complemented proteins from beans and soybeans, as its amino acid profile is different from that of beans. Chia seeds with 66.6 µg/100 g of selenium70, OFSP with 276.98 µg/100 g of β-carotene102 and iron-rich beans with 6.98 mg/100 g of iron71 provide rich sources of some of the most limiting micronutrients in the diets of the communities where most NS cases reside.
Treatment of ingredients
The maize and sorghum grains were cleaned following local practices to remove impurities and other unwanted grains. The sorghum was malted for 48 h to reduce antinutritional factors63,103, sun-dried for 24 h and then oven-roasted. Maize was polished/dehulled once to reduce the aflatoxin concentration104,105 and improve acceptability as locally practiced. Soybean and chia were each cleaned and roasted in an oven to reduce antinutritional factors such as trypsin inhibitors106 as well as to increase the protein, carbohydrate and ash contents of the product107. Roasting also improves the organoleptic characteristics and overall acceptability of soybean products107. Iron-rich beans were cleaned to remove foreign bodies and then kept in a dry place. Orange-fleshed sweet potato (OFSP) was peeled with a stainless-steel knife, washed, grated, and dried in sunshine on a clean tarpaulin for 48 h108. Finally, the silver fish were cleaned and oven-roasted to reduce undesirable odours109,110 before use in the composite formulation.
Composite formulation
The ingredients were selected from different food groups to provide a nutrient balance. Theoretical formulations were established via Microsoft Excel to optimize the nutrient values of the different combinations. This was done with the aid of the food composition table developed by Harvest Plus111 to match the nutrient content of selected foods with the intake recommendations for the target age group. The proportions were based on the recommended daily allowance (RDA) for macronutrients for the target group, specifying that 50–70% of daily energy should come from carbohydrates, 10–35% from protein, and 20–35% should from fats112. Therefore, a total of 8 formulations were developed (3 for each energy line and a control purely maize or sorghum) with varying proportions of the ingredients (60:2:20:10:3:5, 65:5:3:15:5:7, 70:2:15:5:3:5) in the ratio of maize/sorghum: silver fish: soybean: OFSP: beans: chia seeds. The formulations are detailed in Table 7. These formulations were subjected to a preliminary sensory evaluation which led to the choice of one most preferred formulation of each energy line. This chosen formulation (70:2:15:5:3:5) was subjected to nutrient and functional analyses in this paper. The intention was to recommend it for uptake.
Laboratory analysis of the composite
The most accepted composites from both energy lines (maize and sorghum) were analysed at the National Agriculture Research Organization (NARO) institutes in Uganda; Namulonge and Kawanda Food Science laboratories. This involved the determination of physicochemical characteristics, proximate, mineral composition and antinutritional factors.
Proximate analysis
For the two most preferred composites, all the analyses were performed in triplicate according to AOAC standards as previously described by Ngoma et al.113 to determine the moisture content, crude protein, crude fat, ash, crude fibre, total carbohydrate, and crude energy contents. For moisture content, the crucible and food samples were weighed and placed in an oven at a temperature of 105 °C, and the sample was dried until a constant weight was achieved via an Oven plus II GallenKamp model OPL225.WD1. C SG96/06/320, United Kingdom. Crude protein was determined via the Kjeldahl method according to method 981.10 of the AOAC International. Crude fat content was determined via the hexane Soxhlet extraction method as previously described114. In this case, a Soxhlet extraction machine with the specification 2055 SOXTECH Model Foss Tecator by Food Technology Ltd., Sweden, was used. The crude fibre content was determined following the method of Sani et al.115. The ash content was also determined following the method of Sani et al.115, using a Naber Furnace D-2804 muffle furnace model (Bremen, Germany). The total carbohydrate content (%) was calculated as: 100- (moisture + crude protein + crude fat + crude fibre + ash)116. Finally, total energy was determined following the AOAC standards above by multiplying the mean values of crude fat, crude protein and carbohydrate by 9, 4, and 4, respectively, and taking the sum of the products86.
Macro- and micronutrient analyses
For minerals, calcium was determined via the flame photometric method as previously described by Slyke and Cleaver117, whereas phosphorus, iron, magnesium, and zinc were determined via the atomic absorption spectrophotometric method118. Selenium was analysed via high-resolution continuum source atomic absorption spectrometry119. The levels of vitamin D, phytic acid and tannins were determined via High-Performance Liquid Chromatography (HPLC), according to Poitevin118.
Determination of functional properties
The determination of bulk density followed procedures of Adeleke and Odedeji120. To a graduated cylinder of 25 mL, 10 g of flour was added. The cylinder was then tapped until a constant volume was reached, which was then recorded. The bulk density was then calculated via the following formula:
$$Bulk-density (g/cm^{3}) =:frac{Weight:of:the:sample}{Volume:of:the:sample:after:tapping}$$
Water Absorption Capacity (WAC) and Oil Absorption Capacity (OAC) were determined following previous procedures121. Here, 2 g of flour was mixed with 10 mL of distilled water for 5 min with a magnetic stirrer. The mixture was then stirred at room temperature for 30 min and centrifuged at 3500 rpm for 30 min. After this, the volume of the supernatant was measured via a 10 mL measuring cylinder on each sample. The water absorption capacity was then calculated via the following formula:
$$WAC (%) =:frac{Weight:of:water:bound:x:100{%}}{Weight:of:the:dry:sample:left(basisright)}$$
To determine the Oil Absorption Capacity (OAC), 1 g of flour was mixed with 10 mL of sunflower cooking oil. The mixture was then stirred for 30 min at room temperature before being centrifuged at 4500 rpm for 10 min. After this, the excess water or clear supernatant was decanted and discarded. Finally, the OAC was calculated as the amount of oil absorbed per gram of flour sample via the following formula:
$$OAC (%) =:frac{W3-W2}{W1}$$
where:
W1 = weight of flour, W2 = weight of empty tube + flour used, W3 = weight of empty tube + flour + oil absorbed.
For the pasting property (peak viscosity, final viscosity, pasting time and temperature), a Rapid Visco Analyser (RVA), which was directly connected to a computer system, was used to record the parameters automatically122. This machine analyses the ability of a sample to form a viscous gel on the basis of its rheology under controlled conditions. In this case, 3 g of each sample was weighed, and 25 mL of water was added to form a suspension, which was then spun and heated under controlled time‒temperature conditions, as described in a previous study123.
Antinutritional factors
The antinutritional factors, such as trypsin inhibitors, phytate, tannins, and total polyphenols, were determined following a number of established procedures. For trypsin inhibitor analysis, the sample was sieved (No. 100, 150 μm), and 1.0 g was extracted with 50.0 mL of 10 mM NaOH via a magnetic stirrer for 1 h. While a No. 50 sieve was used, extraction took 3 h, and the suspension was diluted for 30–70% trypsin inhibition. Reagents were added in sequence, and the assay was run in a 37 °C water bath. After 10 min of trypsin addition with mixing, the reaction was stopped with 1.0 mL of 30% acetic acid. The mixture was centrifuged or filtered, and the absorbance at 410 nm (A410S) was used to measure trypsin activity in the presence of the inhibitors124.
In brief, the total phenolic content was measured by adding 50 mL of sample, 20 µL of Na2CO3 solution and 20 µL of Folin–Ciocalteu reagent to a 96-well microplate in triplicate. The mixture was left in the dark for 30 min, and the relative absorbance of the samples was measured at 765 nm in a spectrophotometer via Magellan™ data analysis software. Gallic acid was used as the reference standard, and the data were expressed as gallic acid equivalents (GAE), expressed as mg GAE/10 mL125.
Tannin levels were determined according to Herald et al.126 via the vanillin-HCl method. The reagents were prepared by mixing equal volumes of 8% HCl in methanol and 1% vanillin in methanol. A 0.2 g ground sample was extracted with 10 mL of conc. HCl in methanol, shaken for 20 min, and centrifuged at 2500 rpm for 5 min. Then, 1.0 mL of the supernatant was mixed with 5 mL of vanillin-HCl. The absorbance at 450 nm was measured after 20 min at 30 °C. A standard curve was used to express the results as catechin equivalents, which were corrected for the blank and reported as tannic acid equivalents as follows:
$$Tannin (%) =:frac{Cx10}{Sample:weight}times100$$
where:
C = Concentration corresponding to the optical density.
10 = Volume of the extract (mL).
For phytate analysis, 2.0 g of the sample was mixed with 50 mL of Na₂SO₄-HCl solution (100 g/L Na₂SO₄, 1.2% HCl) in a 100 mL conical flask and shaken for 2 h at room temperature. The supernatant was filtered, and 10 mL of the extract was diluted to 30 mL with distilled water after adding 1 mL of 0.75 M NaOH. The mixture was passed through an anion resin column (AG1-X4, 100–200 mesh). The column was washed, and phytic acid was eluted with 0.7 M NaCl. After FeCl₃-sulfosalicylic acid reagent was added, the mixture was centrifuged, and the absorbance was measured at 500 nm via a spectrophotometer127. Nutrient digestibility and bioavailability, especially for iron and zinc, were analysed according to Kiers et al.128., where 5 g of sample was suspended in 30 mL distilled water and digested under simulated gastrointestinal conditions using amylase, lipase, pepsin, pancreatin, and bile. After digestion, the suspension was centrifuged at 3600 × g for 15 min. The supernatant was decanted, pooled, and filtered through a 0.45 mm filter. A blank sample (distilled water) was processed similarly. Both filtered supernatants were analysed for Fe and Zn via a Micro Plasma Atomic Emission Spectrophotometer (MP-AES 4200). The mineral content was corrected by subtracting the blank values, and soluble Fe and Zn were considered bioavailable. The percentage of soluble minerals was calculated as the bioavailability %.
$$Bioavailability {%} =:frac{Amount:of:Fe:or:Zn:left(supernatantright)-amount:of:Fe:or:Zn:left(blankright)}{Amount:of:Fe:or:Zn:left(undigested:sampleright)}times100$$
Lipid profile analyses
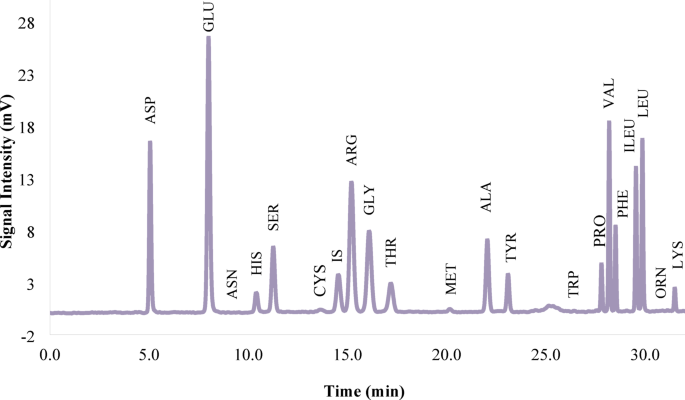
The fatty acid profile was assessed via High-Performance Liquid Chromatography (HPLC) as previously described129. A 0.5 ± 0.001 g sample was weighed into a saponification flask and mixed with 7.0 mL of 0.5 M methanolic KOH. The mixture was incubated at 80 °C with periodic shaking for 1 h. The sample was washed five times with 14.0 mL of ultrapure water (HPLC grade). Dichloromethane (10.0 mL) was added, and the upper layer containing fatty acid methyl esters (FAMEs) was collected and pooled. The extract was dried over magnesium sulfate and filtered, and volatiles were removed under reduced pressure. The dried extract was dissolved in diethyl ether, filtered through a 0.22 μm PTFE filter, and transferred into a 1.5 mL amber vial for HPLC analysis as described by Carvalho et al.130.
Data analysis
The laboratory data were analysed via Stata software version 16. Descriptive statistics such as the mean, standard deviation and median were used to present the proximate, nutritional, and physicochemical characteristics and functional properties of the composites. Independent-sample t-tests were used to establish significant differences in the means of the proximate, functional and nutritional properties of the maize and sorghum composite lines. All the assumptions were tested before parametric tests were conducted. The differences were considered statistically significant at p < 0.05.
Data availability
All the data used and presented in this paper will be made available from the corresponding author upon reasonable request.
References
-
Zhang, X. et al. Global prevalence of overweight and obesity in children and adolescents: a systematic review and meta-analysis. JAMA Pediatr. 178 (8), 800–813. https://doi.org/10.1001/jamapediatrics.2024.1576 (2024).
-
Viana, R. S., Keisyanne, D. A. M. & Augusto, C. F. D. M. Worldwide prevalence of the double burden of malnutrition in children and adolescents at the individual level: systematic review and meta-regression. J. Pediatr. (Rio J). 101 (2). https://doi.org/10.1016/j.jped.2024.11.010 (2025).
-
Bishwajit, G. & Yaya, S. Child and adolescent obesity overweight and obesity among under-five children in South Asia overweight and obesity among under- Fi ve children. Child. Adolesc. Obes. 3 (1), 105–121. https://doi.org/10.1080/2574254X.2020.1769992 (2020).
-
Ahinkorah, B. O. et al. Prevalence and factors associated with the triple burden of malnutrition among mother-child pairs in sub-Saharan Africa. Nutrients. 13 (6), 1–13. https://doi.org/10.3390/nu13062050 (2021).
-
Biswas, T. et al. Current progress and future directions in the double burden of malnutrition among women in South and Southeast Asian countries. Curr. Dev. Nutr. 3 (7), 1–8. https://doi.org/10.1093/cdn/nzz026 (2019).
-
Uganda Bureau of Statistics (UBOS). and ICF, Uganda demographic and health survey. vol. 1. (2023). Available: https://www.dhsprogram.com. Accessed 7 May 2023.
-
UBOS. MakSPH, and UNICEF, Food security and nutrition assessment in Northern Uganda and West nile Key Findings 2019. Kampala., (2020).
-
Kitara, D. L. et al. Nodding syndrome (NS) in Northern uganda: a probable metabolic disorder. Br. J. Med. Med. Res. 3 (4), 2054–2068 (2013).
-
Gumisiriza, N. et al. Prevalence and incidence of nodding syndrome and other forms of epilepsy in onchocerciasis-endemic areas in Northern Uganda after the implementation of onchocerciasis control measures. Infect. Dis. Poverty. 9 (1), 1–11. https://doi.org/10.1186/s40249-020-0628-3 (2020).
-
Mwaka, A., Semakula, J. R., Abbo, C. & Idro, R. Nodding syndrome: recent insights into etiology, pathophysiology, and treatment. Res. Rep. Trop. Med. 9, 89–93. https://doi.org/10.2147/rrtm.s145209 (2018).
-
Olum, S., Scolding, P., Hardy, C., Obol, J. & Scolding, N. J. Response to: ‘Nodding syndrome, many questions remain but we can prevent it by eliminating onchocerciasis’. Brain Commun. 3 (1), 1–2. https://doi.org/10.1093/braincomms/fcaa229 (2021).
-
Idro, R. et al. Proposed guidelines for the management of nodding syndrome. Afr. Health Sci. 13 (2), 219–232. https://doi.org/10.4314/ahs.v13i2.4 (2013).
-
Enyagu, P. & Bazira, J. Nutritional status of children living with nodding disease syndrome and copying strategies of their families in Uganda. Asian Journal of Research in Medicine and Medical Science. 5 (1), 1–14 (2022).
-
Idro, R. et al. Nodding syndrome in Ugandan children-clinical features, brain imaging and complications: A case series. BMJ Open. 3 (5). https://doi.org/10.1136/bmjopen-2012-002540 (2013).
-
Spencer, P. S. et al. Environmental, dietary and case-control study of nodding syndrome in uganda: A post-measles brain disorder triggered by malnutrition? J. Neurol. Sci. 369, 191–203. https://doi.org/10.1016/j.jns.2016.08.023 (2016).
-
Spencer, P. S., Okot, C., Palmer, V. S., Angues, R. V. & Mazumder, R. Nodding syndrome: A key role for sources of nutrition? eNeurologicalSci 27, 100401. https://doi.org/10.1016/j.ensci.2022.100401 (2022).
-
Donnelly, J. CDC planning trial for mysterious nodding syndrome. Lancet 379 (9813), 299. https://doi.org/10.1016/S0140-6736(12)60126-3 (2012).
-
Gazda, S. & Kitara, D. L. Treatment and rehabilitation outcomes of children affected with nodding syndrome in Northern uganda: A descriptive case series. Pan Afr. Med. J. 29, 1–11. https://doi.org/10.11604/pamj.2018.29.228.13627 (2018).
-
Nyakato, M. et al. Poor neurodevelopment, nutritional and physical growth outcomes among children born to mothers with nodding syndrome. Seizure Eur. J. Epilepsy., (2024).
-
Katabarwa, M. N. et al. After 70 years of fighting an age-old scourge, onchocerciasis in Uganda, the end is in sight. Int. Health. 10, i79–i88. https://doi.org/10.1093/inthealth/ihx044 (2018).
-
Idro, R. et al. Patients with nodding syndrome in Uganda improve with symptomatic treatment: A cross-sectional study. BMJ Open. 4 (11), 1–8. https://doi.org/10.1136/bmjopen-2014-006476 (2014).
-
Downer, S. et al. Food is medicine: Actions to integrate food and nutrition into healthcare, BMJ, vol. 369, no. Table 1, (2020). https://doi.org/10.1136/bmj.m2482
-
Mbela, D. E. N., Kinabo, J., Mwanri, A. W. & Ekesa, B. Sensory evaluation of improved and local recipes for children aged 6 to 23 months in Bukoba, Tanzania. Afr. J. Food Sci. 12 (11), 297–308. https://doi.org/10.5897/ajfs2018.1738 (2018).
-
Nezif, A. Research review on formulation and sensory evaluation of complementary foods from cereals and legumes in Ethiopia. Food Sci. Nutr. Technol. 5 (5), 1–9. https://doi.org/10.23880/fsnt-16000231 (2020).
-
Ndagire, C. T., Muyonga, J. H., Manju, R. & Nakimbugwe, D. Optimized formulation and processing protocol for a supplementary bean-based composite flour. Food Sci. Nutr. 3 (6), 527–538. https://doi.org/10.1002/fsn3.244 (2015).
-
NARO, University, M. & The, V. E. D. C. O. PHH FRN Nutrition Baseline Report for Pallisa, Kamuli and Buyende Districts, Kampala, Uganda, (2021).
-
Eke-Ejiofor, J. N., Ojimadu, A. E., Wordu, G. O. & Ofoedu, C. E. Functional properties of complementary food from millet (Pennisetum glaucum), African Yam bean (Sphenostylis stenocarpa), and jackfruit (Artocarpus heterophyllus) flour blends: A comparative study. Asian Food Sci. J. 20 (9), 45–62. https://doi.org/10.9734/afsj/2021/v20i930342 (2021).
-
Awuchi, G. C. Proximate composition and functional properties of different grain flour composites for industrial applications. Int. J. Food Sci. 2 (1), 43–64. https://doi.org/10.47604/ijf.1010 (2019).
-
Abu, M. S. et al. Proximate composition, mineral content and functional properties of composite flours and microbiological/sensory analysis of composite flour bread enzymology and protein chemistry view project, Quest Journals J. Res. Agric. Anim. Sci., vol. 8, no. September, pp. 2321–9459, [Online]. Available: www.questjournals.org (2021).
-
Zawistowski, J. & Kopeć, A. Effect of functional food ingredients on nutrient absorption and digestion, in Nutrition and Functional Foods in Boosting Digestion, Metabolism and Immune Health, (eds Bagchi, D. & Ohia, S. E.) Academic, 173–189. doi: https://doi.org/10.1016/B978-0-12-821232-5.00003-3. (2022).
-
Uganda Bureau of Statistics (UBOS). Uganda Annual Agricultural Survey 2018, Kampala, Uganda, 2020. [Online]. Available: https://www.ptonline.com/articles/how-to-get-better-mfi-results
-
Beal, T. & Ortenzi, F. Priority micronutrient density in foods. Front. Nutr. 9, 1–13. https://doi.org/10.3389/fnut.2022.806566 (2022).
-
Imamura, F. et al. Dietary quality among men and women in 187 countries in 1990 and 2010: a systematic assessment. Lancet Glob Heal. 3 (3), e132–e142 (2015).
-
Figura, L. & Teixeira, A. A. Food Physics: Physical properties-measurement and Applications (Springer Science & Business Media, 2007).
-
Singh, A. et al. Effect of milling method on selected physical and functional properties of Cowpea (Vigna unguiculata) paste. Int. J. Food Sci. Technol. 40 (5), 525–536 (2005).
-
Oppong, D., Arthur, E., Kwadwo, S. O., Badu, E. & Sakyi, P. Proximate composition and some functional properties of soft wheat flour. Int. J. Innov. Res. Sci. Eng. Technol. 4 (2), 753–758 (2015).
-
Sudha, K. V., Karakannavar, S. J., Yenagi, N. B. & Inamdar, B. Effect of roasting on the physicochemical and nutritional properties of Foxtail millet (Setaria italica) and Bengal gram Dhal flours. ~ 1543 ~ Pharma Innov. J. 10 (5), 1543–1547 (2021).
-
Ndife, J., Obiegbunna, J. & Ajayi, S. Comparative evaluation of the nutritional and sensory quality of major commercial whole-wheat breads in Nigerian market. Adv. J. Food Sci. Technol. 5 (12), 1600–1605 (2013).
-
Ibeabuchi, J. C. et al. Comparative study on the proximate composition, functional and sensory properties of three varieties of beans phaseolus lunatus, phaseolus vulgaris and vigna umbellata. Int. J. Adv. Eng. Technol. Manag Appl. Sci. 5 (1), 1–23 (2017).
-
Awuor, O. L., Muge, E. K., Mulaa, F. J. & Mbatia, B. N. Proximate composition of rastrineobola Argentea (Dagaa) of lake Victoria-Kenya. Afr. J. Biochem. Res. 8 (1), 1–6. https://doi.org/10.5897/ajbr2013.0720 (2014).
-
Murungweni, K. T., Ramashia, S. E. & Mashau, M. E. Effect of malting on physicochemical, antioxidant, and microstructural properties of finger millet (Eleusine coracana) flours. Food Sci. Nutr. 12 (1), 547–563. https://doi.org/10.1002/fsn3.3790 (2024).
-
Khan, A. & Saini, C. S. Effect of roasting on physicochemical and functional properties of flaxseed flour. Cogent Eng. 3 (1). https://doi.org/10.1080/23311916.2016.1145566 (2016).
-
Ismaila, F. & Bilkisu, A. Effects of dehulling on the mineral elements content of some cereals (Maize, Millet, and Guinea Corn). Glob J. Agric. Res. 10 (3), 1–12. https://doi.org/10.37745/gjar.2013/vo10.n3pp112 (2022).
-
Agbor Asuk, A., Ugwu, M. N. & Idole, B. The effect of different malting periods on the nutritional composition of malted sorghum-soy composite flour. J. Food Sci. Nutr. Res. 03 (03), 217–230. https://doi.org/10.26502/jfsnr.2642-11000051 (2020).
-
Mugalavai, V. K., Oyalo, J. O. & Onkware, A. O. Characterization of the nutritional properties of sorghum composite flours using different food to food fortification approaches. Eur. J. Agric. Food Sci. 2 (6), 1–7. https://doi.org/10.24018/ejfood.2020.2.6.84 (2020).
-
Ukom, A. N., Adiegwu, E. C., Ojimelukwe, P. C. & Okwunodulu, I. N. Quality and sensory acceptability of yellow maize Ogi porridge enriched with orange-fleshed sweet potato and African Yam bean seed flours for infants. Sci. Afr. 6, e00194. https://doi.org/10.1016/j.sciaf.2019.e00194 (2019).
-
Nicole, M., Fei, H. Y. & Claver, I. P. Characterization of ready-to-eat composite porridge flours made by soy-maize-sorghum-wheat extrusion cooking process. Pakistan J. Nutr. 9 (2), 171–178. https://doi.org/10.3923/pjn.2010.171.178 (2010).
-
Saithalavi, K. M., Bhasin, A. & Yaqoob, M. Impact of sprouting on physicochemical and nutritional properties of sorghum: A review. J. Food Meas. Charact. 15 (5), 4190–4204 (2021).
-
Udeh, H. O., Duodu, K. G. & Jideani, A. I. O. Effect of malting period on physicochemical properties, minerals, and phytic acid of finger millet (Eleusine coracana) flour varieties. Food Sci. Nutr. 6 (7), 1858–1869. https://doi.org/10.1002/fsn3.696 (2018).
-
Coulibaly, A. & Chen, J. Evaluation of energetic compounds, antioxidant capacity, some vitamins and minerals, phytase and amylase activity during germination of Foxtail millet. Am. J. Food Technol. 6, 40–51 (2011).
-
Zareie, M., Abbasi, A. & Faghih, S. Thermal stability and kinetic study on thermal degradation of vitamin d3 in fortified Canola oil. J. Food Sci. 84 (9), 2475–2481. https://doi.org/10.1111/1750-3841.14764 (2019).
-
Garg, M. et al. Vitamins in cereals: a critical review of content, health effects, processing losses, bioaccessibility, fortification, and biofortification strategies for their improvement, Front. Nutr., vol. 8, no. June, pp. 1–15, (2021). https://doi.org/10.3389/fnut.2021.586815
-
Kean, E. G., Hamaker, B. R. & Ferruzzi, M. G. Carotenoid bioaccessibility from whole grain and degermed maize meal products. J. Agric. Food Chem. 56 (21), 9918–9926. https://doi.org/10.1021/jf8018613 (2008).
-
Pillay, K., Siwela, M., Derera, J. & Veldman, F. J. Provitamin A carotenoids in biofortified maize and their retention during processing and Preparation of South African maize foods. J. Food Sci. Technol. 51 (4), 634–644. https://doi.org/10.1007/s13197-011-0559-x (2014).
-
Baranwal, D. Malting: an Indigenous technology used for improving the nutritional quality of grains- A review. Asian J. Dairy. Food Res. 36 (03). https://doi.org/10.18805/ajdfr.v36i03.8960 (2017).
-
Zarmai, S., Eneji, I. S. & Sha’Ato, R. Selenium contents of common cereal and legume staples in central Nigeria. Curr. J. Appl. Sci. Technol. 36 (4), 1–8. https://doi.org/10.9734/cjast/2019/v36i430241 (2019).
-
Kieliszek, M. & Bano, I. Selenium as an important factor in various disease states-a review. EXCLI J. 21, 948–966. https://doi.org/10.17179/excli2022-5137 (2022).
-
Korevaar, D. A. & Visser, B. J. Reviewing the evidence on nodding syndrome, A mysterious tropical disorder. Int. J. Infect. Dis. 17 (3), 149–152. https://doi.org/10.1016/j.ijid.2012.09.015 (2013).
-
Nkhata, S. G., Ayua, E., Kamau, E. H. & Shingiro, J. B. Fermentation and germination improve nutritional value of cereals and legumes through activation of endogenous enzymes. Food Sci. Nutr. 6 (8), 2446–2458 (2018).
-
Terefe, Z. K., Omwamba, M. N. & Nduko, J. M. Effect of solid state fermentation on proximate composition, antinutritional factors and in vitro protein digestibility of maize flour. Food Sci. Nutr. 9 (11), 6343–6352. https://doi.org/10.1002/fsn3.2599 (2021).
-
Oluba, O. M. & Oredokun-Lache, A. B. Nutritional composition and glycemic index analyses of vitamin A-biofortified maize in healthy subjects. Food Sci. Nutr. 6 (8), 2285–2292. https://doi.org/10.1002/fsn3.801 (2018).
-
Samtiya, M., Aluko, R. E. & Dhewa, T. Plant food anti-nutritional factors and their reduction strategies: an overview. Food Prod. Process. Nutr. 2 (1), 1–14. https://doi.org/10.1186/s43014-020-0020-5 (2020).
-
Ojha, P. et al. Malting and fermentation effects on antinutritional components and functional characteristics of sorghum flour. Food Sci. Nutr. 6 (1), 47–53. https://doi.org/10.1002/fsn3.525 (2018).
-
Tatah, S. V. et al. Effects of dehulling on the levels of micronutrients in Maize, milled and sorghum grains. FUW Trends Sci. Technol. J. 6 (1), 220–222. https://doi.org/10.1007/s13197-011 (2021).
-
Igbua, F. Z., Adejo, S. O. & Igoli, N. P. Antinutrients and bioavailability of nutrients in maize, cassava and soybeans composite flour. Asian Food Sci. J. 16 (2), 5–12. https://doi.org/10.9734/AFSJ/2020/v16i230167 (2020).
-
David, O. A., Daniel, E. E., Agbenu, A. C. & Nyerere, A. C. Nutritional composition and functional properties of maize – soya bean composite flour. Global Journal of Research in Chemistry and Pharmacy., 01 (01), (2022).
-
Inyang, U. E., Akindolu, B. E. & Elijah, A. I. Nutrient composition, amino acid profile and anti-nutritional factors of nixtamalized maize flour supplemented with sprouted soybean flour. Eur. J. Nutr. Food Saf. 9 (1), 41–51. https://doi.org/10.9734/ejnfs/2019/46150 (2019).
-
Alowo, D., Muggaga, C. & Ongeng, D. The effect of traditional malting technology practiced by an ethnic community in Northern Uganda on in-vitro nutrient bioavailability and consumer sensory preference for locally formulated complementary food formulae. Food Sci. Nutr. 6 (8), 2491–2498. https://doi.org/10.1002/fsn3.856 (2018).
-
Kabahenda, M., Amega, R., Okalany, E., Husken, S. & Heck, S. Protein and micronutrient composition of Low-Value fish products commonly marketed in the lake Victoria region. World J. Agric. Sci. 7 (5), 521–526 (2011).
-
Marcinek, K. & Krejpcio, Z. Chia seeds (Salvia hispanica): health promoting properties and therapeutic applications – a review. Rocz Panstw Zakl Hig. 68 (2), 123–129 (2017).
-
Smartfarming, N. A. R. O. Beans varieties. [Online]. Available: https://www.smartfarmingug.com/product/naro-beans/
-
Nkundabombi, M. G., Nakimbugwe, D. & Muyonga, J. H. Effect of processing methods on nutritional, sensory, and physicochemical characteristics of biofortified bean flour. Food Sci. Nutr. 4 (3), 384–397. https://doi.org/10.1002/fsn3.301 (2016).
-
Oluwole, O. et al. Some functional properties of flours from commonly consumed selected Nigerian food crops. Int. Res. J. Agric. Food Sci. 1 (5), 92–98 (2016).
-
Elbaloula, M. F., Yang, R., Guo, Q. & Gu, Z. Major nutrient compositions and functional properties of sorghum flour at 0–3 days of grain germination. Int. J. Food Sci. Nutr. 65 (1), 48–52 (2014).
-
Kinsella, J. E. & Melachouris, N. Functional properties of proteins in foods: a survey. Crit. Rev. Food Sci. & Nutr. 7 (3), 201–206 (2009).
-
Abah, C. R., Ishiwu, C. N., Obiegbuna, J. E. & Oladejo, A. A. Sorghum Grains: Nutritional Composition, Functional Properties and Its Food Applications, Eur. J. Nutr. Food Saf., no. June, pp. 101–111, (2020). https://doi.org/10.9734/ejnfs/2020/v12i530232
-
Pal, R. S. et al. Impact of dehulling and germination on nutrients, antinutrients, and antioxidant properties in horsegram. J. Food Sci. Technol. 53 (1), 337–347. https://doi.org/10.1007/s13197-015-2037-3 (2016).
-
Keyata, E. O., Tola, Y. B., Bultosa, G. & Forsido, S. F. Bioactive compounds, antioxidant capacity, functional and sensory properties of optimized complementary weaning flour processed from sorghum, soybean, and Karkade (Hibiscus Sabdariffa L.) seeds. Sci. Afr. 19, e01457 (2023).
-
Iwe, M. O., Onyeukwu, U. & Agiriga, A. N. Proximate, functional and pasting properties of FARO 44 rice, African Yam bean and brown Cowpea seeds composite flour. Cogent Food Agric. 2 (1). https://doi.org/10.1080/23311932.2016.1142409 (2016).
-
Chukwu, M., Kabuo, N. O. & Nwokocha, N. J. Effects of fermentation time on the functional properties of ogiri-ahuekere (Arachis Hypogaea Linn) seed condiment. Int. J. Biotechnol. Food Sci. 6 (5), 77–85. https://doi.org/10.2139/ssrn.3517482 (2018).
-
Hyacinthe, A. A., Bedel, F. J. & Patrice, L. Koffi Amoin Gisèle, Anno Hermann Fourier Atta, and Kouamé Functional properties of composite flours produced with Ivorian taro (Colocasia esculenta L. Cv Fouê) corms flour and wheat (Triticum aestivum L.) flour, GSC Biol. Pharm. Sci., vol. 15, no. 3, pp. 164–176, (2021). https://doi.org/10.30574/gscbps.2021.15.3.0131
-
Zhang, X., Tong, Q., Zhu, W. & Ren, F. Pasting, rheological properties and gelatinization kinetics of tapioca starch with sucrose or glucose. J. Food Eng. 114 (2), 255–261 (2013).
-
Leon, E. et al. Pasting properties of Transgenic lines of a commercial bread wheat expressing combinations of HMW glutenin subunit genes. J. Cereal Sci. 51 (3), 344–349. https://doi.org/10.1016/j.jcs.2010.02.002 (2010).
-
Sanni, L. O., Ikuomola, D. P. & Sanni, S. A. Effect of length of fermentation and varieties on the qualities of sweet potato gari, in Proc. 8th triennial Symposium of the International Society for Tropical Root Crops. Africa Branch (ISTRC-AB), Ed. MO Akoroda, IITA, Ibadan, Nigeria, pp. 208–211. (2001).
-
Kumar, R. & Khatkar, B. S. Thermal, pasting and morphological properties of starch granules of wheat (Triticum aestivum L.) varieties. J. Food Sci. Technol. 54, 2403–2410 (2017).
-
Anberbir, S. M. et al. Evaluation of nutritional composition, functional and pasting properties of Pearl millet, teff, and buckwheat grain composite flour. Appl. Food Res. 4 (1), 100390 (2024).
-
Tsegaye, G. A. The study of functional and rheological properties of Teff [Eragrostis Teff (Zucc.) trotter] grain flour varieties. Int. J. Food Eng. Technol. 4 (1), 1–8 (2020).
-
Kaushal, P., Kumar, V. & Sharma, H. K. Comparative study of physicochemical, functional, antinutritional and pasting properties of Taro (Colocasia esculenta), rice (Oryza sativa) flour, Pigeonpea (Cajanus cajan) flour and their blends. Lwt 48 (1), 59–68. https://doi.org/10.1016/j.lwt.2012.02.028 (2012).
-
Onwurafor, E. U. et al. Effect of malting periods on the nutrient composition, antinutrient content and pasting properties of Mungbean flour. Agro-Science 19 (1), 18. https://doi.org/10.4314/as.v19i1.3 (2020).
-
Kaur, M. & Singh, N. Relationships between selected properties of seeds, flours, and starches from different Chickpea cultivars. Int. J. Food Prop. 9 (4), 597–608 (2006).
-
Zhang, Y. et al. Triacylglycerol, fatty acid, and phytochemical profiles in a new redAugust sorghum variety (Ji Liang No. 1) and its antioxidant and anti-inflammatory properties, no. pp. 949–958, 2019, (2018). https://doi.org/10.1002/fsn3.886
-
Davana, T. V., Revanna, M. L. & Begum, S. S. Effect of malting on the nutritional composition, anti-nutrition factors and mineral composition on sorghum (Sorghum bicolor), 40, 4, pp. 451–455, (2021). https://doi.org/10.18805/ajdfr.DR-1624.Submitted
-
Dighriri, I. M. et al. Effects of Omega-3 polyunsaturated fatty acids on brain functions: a systematic review. Cureus 14 (10). https://doi.org/10.7759/cureus.30091 (2022).
-
McNamara, R. K., Asch, R. H., Lindquist, D. M. & Krikorian, R. Role of polyunsaturated fatty acids in human brain structure and function across the lifespan: an update on neuroimaging findings Robert. Physiol. Behav. 136 (1), 23–34. https://doi.org/10.1177/0022146515594631.Marriage (2019).
-
Bermudez, B. et al. Oleic acid in Olive oil: from a metabolic framework toward a clinical perspective. Curr. Pharm. Des. 17 (8), 831–843. https://doi.org/10.2174/138161211795428957 (2011).
-
Perez-Martinez, P., Garcia-Rios, A., Delgado-Lista, J., Perez-Jimenez, F. & Lopez-Miranda, J. Mediterranean diet rich in Olive oil and obesity, metabolic syndrome and diabetes mellitus. Curr. Pharm. Des. 17 (8), 769–777. https://doi.org/10.2174/138161211795428948 (2011).
-
Calder, P. C Functional roles of fatty acids and their effects on human health. J. Parenter. Enter. Nutr. 39, 18S–32S. https://doi.org/10.1177/0148607115595980 (2015).
-
Cholewski, M., Tomczykowa, M. & Tomczyk, M. A comprehensive review of chemistry, sources and bioavailability of omega-3 fatty acids, vol. 10, no. 11. (2018). https://doi.org/10.3390/nu10111662
-
Rodriguez-Leyva, D., Bassett, C. M. C., McCullough, R. & Pierce, G. N. The cardiovascular effects of flaxseed and its omega-3 fatty acid, alpha-linolenic acid. Can. J. Cardiol. 26 (9), 489–496. https://doi.org/10.1016/S0828-282X(10)70455-4 (2010).
-
Kulamarva, A. G., Sosle, V. R. & Raghavan, G. S. V. Nutritional and rheological properties of sorghum. Int. J. Food Prop. 12 (1), 55–69. https://doi.org/10.1080/10942910802252148 (2009).
-
Basharat, S., Ijaz, A., Tufail, T., Bader, H. & Ain, U. Nutritional and physicochemical characterization of soymilk nutritional and physicochemical characterization of soymilk university Institute of diet and nutritional Sciences, faculty of allied health Sciences, the. Int. J. Biosci. 16 (6), 256–264. https://doi.org/10.12692/ijb/16.5.256-264 (2020).
-
Tumuhimbise, G. A., Namutebi, A. & Muyonga, J. H. Microstructure and in vitro beta carotene bioaccessibility of heat processed orange fleshed sweet potato. Plant. Foods Hum. Nutr. 64 (4), 312–318. https://doi.org/10.1007/s11130-009-0142-z (2009).
-
Feyera, M. Overview of Malting and Fermentation Role in Sorghum Flour, Primarily for Antinutrient Reduction, J. Hum. Nutr. Food Sci., vol. 9, no. 1, pp. 1–9, 2021, [Online]. Available: https://www.jscimedcentral.com/Nutrition/nutrition-9-1138.pdf
-
Mutungi, C., Lamuka, P., Arimi, S., Gathumbi, J. & Onyango, C. The fate of aflatoxins during processing of maize into muthokoi – A traditional Kenyan food. Food Control. 19 (7), 714–721. https://doi.org/10.1016/j.foodcont.2007.07.011 (2008).
-
Matumba, L., Van Poucke, C., Njumbe Ediage, E., Jacobs, B. & De Saeger, S. Effectiveness of hand sorting, flotation/washing, dehulling and combinations thereof on the decontamination of mycotoxin-contaminated white maize. Food Addit. Contam. – Part. Chem. Anal. Control Expo Risk Assess. 32 (6), 960–969. https://doi.org/10.1080/19440049.2015.1029535 (2015).
-
Vagadia, B. H., Vanga, S. K. & Raghavan, V. Inactivation methods of soybean trypsin inhibitor – A review. Trends Food Sci. Technol. 64, 115–125. https://doi.org/10.1016/j.tifs.2017.02.003 (2017).
-
Raza, A., Munir, A., Ghafoor, A. & Ali, S. Soybean roasting using continuous solar roaster–A decentralized approach for agricultural processing. J. Food Process. Eng. 42 (6), 1–12. https://doi.org/10.1111/jfpe.13184 (2019).
-
Ntsama, P. M., Tsafack, J. J. T., Medoua, G. N. & Mbofung, C. M. F. Preparation of ready to use supplementary food for treating moderate acute malnutrition in children aged 6 to 59 months, IRA-International J. Appl. Sci. (ISSN 2455–4499), vol. 14, no. 3, p. 22, (2020). https://doi.org/10.21013/jas.v14.n3.p1
-
Byrd, K. A., Pincus, L., Pasqualino, M. M., Muzofa, F. & Cole, S. M. Dried small fish provide nutrient densities important for the first 1000 days. Matern Child. Nutr. 17 (4), 1–13. https://doi.org/10.1111/mcn.13192 (2021).
-
Mhongole, O. & Mhina, M. Value addition – Hot smoked Lake Victoria Sardine (Rastrineobola argentea) for human consumption, IIFET 2012 Tanzania, Visible Possibilities Econ. Sustain. Fish. Aquac. Seaf. Trade, no. 1, pp. 1–12, (2012).
-
Hotz, C., Lubowa, A., Sison, C., Moursi, M. & Loechl, C. A Food Composition Table for Central and Eastern Uganda (International food policy research institute (IFPRI) and international center for tropical agriculture (CIAT), 2012).
-
of H. H. Services, U. D. US department of agriculture 2015–2020 dietary guidelines for Americans; US department of health human services. Wash. DC. https://doi.org/10.1097/NT.0b013e31826c50af (2019).
-
Ngoma, K., Mashau, M. E. & Silungwe, H. Physicochemical and functional properties of chemically pretreated ndou sweet potato flour, Int. J. Food Sci., vol. 2019, (2019). https://doi.org/10.1155/2019/4158213
-
Bland, J., Grimm, C., Bechtel, P., Deb, U. & Dey, M. Proximate composition and nutritional attributes of ready-to-cook catfish products. Foods 10, 1–10. https://doi.org/10.3390/foods10112716 (2021).
-
Sani, U., Abubakar, S., Suleiman, F. & Olabode, H. O. Proximate analysis and production of bio-ethanol from sweet potato (Ipomoea batatas) white cultivars obtained from Samaru Zaria. Bayero J. Pure Appl. Sci. 14 (2), 157–168. https://doi.org/10.4314/bajopas.v14i2.18 (2021).
-
Peter-Ikechukwu, A. I., Ogazi, C. G., Uzoukwu, A. E., Kabuo, N. O. & Chukwu, M. N. Proximate compositions and functional properties of composite flour produced with date fruit pulp, toasted watermelon seed and wheat. J. Food Chem. Nanotechnol. 6 (3), 159–166. https://doi.org/10.17756/jfcn.2020-097 (2020).
-
Slyke, V. & Cleaver, J. Flame-Photometric determination of calcium. J. Sci. Food Agric. 12 (12), 848–852 (1961).
-
Poitevin, E. Official methods for the determination of minerals and trace elements in infant formula and milk products: A review. J. AOAC Int. 99 (1), 42–52. https://doi.org/10.5740/jaoacint.15-0246 (2016).
-
Krawczyk-Coda, M. Determination of selenium in food samples by high-resolution continuum source atomic absorption spectrometry after preconcentration on Halloysite nanotubes using ultrasound-assisted dispersive micro solid-phase extraction. Food Anal. Methods. 12 (1), 128–135. https://doi.org/10.1007/s12161-018-1345-4 (2019).
-
Adeleke, R. & Odedeji, J. Functional properties of wheat and Sweetpotato flour blends. Pakistan J. Nutr. 9, 535–538. https://doi.org/10.1515/9783110854213.bm (2012).
-
Adebowale, Y. A., Adeyemi, I. A. & Oshodi, A. A. Functional and physicochemical properties of flours of six mucuna species. Afr. J. Biotechnol. 4 (12), 1461–1468 (2005).
-
Adepeju, A. B., Gbadamosi, S. O., Omobuwajo, T. O. & Abiodun, O. A. Functional and physico-chemical properties of complementary diets produced from breadfruit (Artocarpus altilis). Afr. J. Food Sci. Technol. 5 (4), 105–113 (2014).
-
Ugada, A. M., Okidi, L. & Ongeng, D. Development of micronutrient dense composite flour for routine enrichment of complementary foods for children 6–24 months old in acholi sub-region of Uganda. Discov Food. 3 (1). https://doi.org/10.1007/s44187-023-00064-6 (2023).
-
Liu, K. Soybean trypsin inhibitor assay: further improvement of the standard method approved and reapproved by American oil chemists’ society and American association of cereal chemists international. JAOCS J. Am. Oil Chem. Soc. 96 (6), 635–645. https://doi.org/10.1002/aocs.12205 (2019).
-
Singleton, V. L., Orthofer, R. & Lamuela-Raventós, R. M. [14] analysis of total phenols and other oxidation substrates and antioxidants by means of folin-ciocalteu reagent, in Methods in Enzymology, vol. 299, Elsevier, 152–178. doi: https://doi.org/10.1016/S0076-6879(99)99017-1. (1999).
-
Herald, T. J., Gadgil, P., Perumal, R., Bean, S. R. & Wilson, J. D. High-throughput micro-plate HCl-vanillin assay for screening tannin content in sorghum grain. J. Sci. Food Agric. 94 (10), 2133–2136. https://doi.org/10.1002/jsfa.6538 (2014).
-
Ma, G. et al. Phytate intake and molar ratios of phytate to zinc, iron and calcium in the diets of people in China. Eur. J. Clin. Nutr. 59 (12), 1404–1411. https://doi.org/10.1038/sj.ejcn.1602254 (2005).
-
Kiers, J. L., Nout, R. M. J. & Rombouts, F. M. In vitro digestibility of processed and fermented Soya bean, Cowpea and maize. J. Sci. Food Agric. 80 (9), 1325–1331. https://doi.org/10.1002/1097-0010(200007)80:9%3C1325::AID-JSFA648%3E3.0.CO;2-K (2000).
-
Taher, E. M., El-essawy, H. A., Saudi, A. M. & Aly, S. A. Fatty acid profile of some fat rich foods with special reference to their trans fatty acids content. Int. J. Pharm. Chem. Sci. 7 (2), 32–37 (2018).
-
Carvalho, M. S., Mendonça, M. A., Pinho, D. M. M., Resck, I. S. & Suarez, P. A. Z. Chromatographic analyses of fatty acid Methyl esters by HPLC-UV and GC-FID. J. Braz Chem. Soc. 23 (4), 763–769. https://doi.org/10.1590/S0103-50532012000400023 (2012).
Acknowledgements
The authors would like to thank Dr. Okidi Lawrence and Dr. Elolu Samuel in the Department of Food Science and Postharvest Technology for their support in producing this publication.
Ethics declarations
Competing interests
The authors declare no competing interests.
Ethics approval
The study was approved by the Gulu University Research Ethics Committee (GUREC) with registration number GUREC-2022-258. After clearance, the protocol was registered with the Uganda National Council for Science and Technology (UNCST) with registration number A234ES, in compliance with the UNCST guidelines 2014 on the protection of human subjects.
Additional information
Publisher’s note
Springer Nature remains neutral with regard to jurisdictional claims in published maps and institutional affiliations.
Rights and permissions
Open Access This article is licensed under a Creative Commons Attribution-NonCommercial-NoDerivatives 4.0 International License, which permits any non-commercial use, sharing, distribution and reproduction in any medium or format, as long as you give appropriate credit to the original author(s) and the source, provide a link to the Creative Commons licence, and indicate if you modified the licensed material. You do not have permission under this licence to share adapted material derived from this article or parts of it. The images or other third party material in this article are included in the article’s Creative Commons licence, unless indicated otherwise in a credit line to the material. If material is not included in the article’s Creative Commons licence and your intended use is not permitted by statutory regulation or exceeds the permitted use, you will need to obtain permission directly from the copyright holder. To view a copy of this licence, visit http://creativecommons.org/licenses/by-nc-nd/4.0/.
About this article

Cite this article
Aloka, B., Olum, S. & Ongeng, D. Evaluation of the nutritional quality of food composites developed from local ingredients to target the needs of persons experiencing nodding syndrome in Northern Uganda. Sci Rep 15, 41572 (2025). https://doi.org/10.1038/s41598-025-25483-6
-
Received:
-
Accepted:
-
Published:
-
Version of record:
-
DOI: https://doi.org/10.1038/s41598-025-25483-6