
Introduction
Electrochemical aptamer-based (E-AB) sensors1 are a biosensing platform that employs dynamic nucleic acid oligonucleotides (oligos) called aptamers, which are engineered to bind specific molecular targets with high affinity (Fig. 1a, left). These interactions are transduced into quantifiable signals through electrochemical measurements (Fig. 1b), typically using an aptamer-linked redox reporter such as methylene blue (MB)1. The reagentless and reversible nature of E-AB sensors makes them particularly well-suited for continuous, real-time monitoring of biomolecules in complex environments. Unlike antibodies, aptamers are short oligos with much faster dissociation rates (kOFF = milliseconds2 vs. minutes to hours or days for antibodies3), rapidly achieving steady-state interactions with target concentration, and thus support continuous sensing. Modulation of the sensor potential drives the electrochemical reduction of the methylene blue reporter, producing currents that correlate with target concentration1. While E-AB sensors are designed to meet the demands of in vivo and real-time sensing, significant challenges remain when they are deployed in biological fluids such as plasma or serum for point-of-care measurements. These challenges often stem from interactions with biomolecular components (Fig. 1a, right) in these complex matrices that were not present during aptamer selection4,5.

a While E-ABs functionalized with off-the-shelf aptamers may present strong sensor signals in buffered solutions (keT,2 >> keT,1), this behavior may be significantly affected in plasma (keT,3 < keT,2) due to nonspecific protein binding if the original aptamer selection was not correctly carried out against protein counter selections. In plasma, proteins (shown as green and blue elements with various shapes) may interfere with electron transfer between the reporter methylene blue (MB) and the electrode, causing a smaller ΔkeT. b Square wave voltammograms illustrating a smaller ΔkeT in plasma (blue trace vs. black) relative to buffered saline (red trace vs. black). c Method proposed in this study to recover sensor sensitivity of buffered saline in plasma: in a first step, thrombin is added to the plasma to induce coagulation and clotting. Second, the protein clots are filtered out. Finally, the filtrate is used to measure target concentrations. d The use of this method leads to the recovery of the EC50 normally seen in buffered saline from plasma samples. Figure Fig 1a, c Created in BioRender. Demek, E. (2025) https://BioRender.com/uqgdnvw.
Aptamers are typically generated using the Systematic Evolution of Ligands by Exponential Enrichment (SELEX)6,7, a highly customizable process that allows for selection under specific conditions tailored to the desired application. However, the environment in which an aptamer is selected strongly influences its performance4. Aptamers selected in buffers lacking serum proteins or other biomimetic components often perform poorly in biofluids, exhibiting nonspecific binding and signal dampening (see, for example, blue trace in Fig. 1b). We have consistently observed that “off-the-shelf” aptamers suffer from decreased sensitivity and unreliable quantification when used in biological media, primarily due to interference from proteins and other biomolecules not accounted for during selection4,8. To overcome this issue and allow single point measurements we present a simple, generalizable method to remove proteins and other serum components that interfere with E-AB sensing in undiluted plasma, thereby restoring sensor sensitivity measurements taken in buffered saline. Our approach employs thrombin to coagulate serum proteins9 (Fig. 1c), followed by filtration to remove the coagulated material. This method can be easily tuned by adjusting filter pore size, incubation time, and temperature to accommodate different target molecules, which may vary in size, charge, or other physicochemical properties. We demonstrate this strategy using three aptamers that have been previously adapted for E-AB sensing and are known to exhibit signal dampening in biological media. In each case, our method successfully recovered their effective concentration at 50% sensor signal output (EC50) to within experimental error of that obtained in buffer (Fig. 1d) or even improved it. Finally, we raise awareness that the chemical nature of the target can directly affect how it interacts with naturally occurring proteins, requiring subtle adaptations of the method for effective signal recovery.
Results and discussion
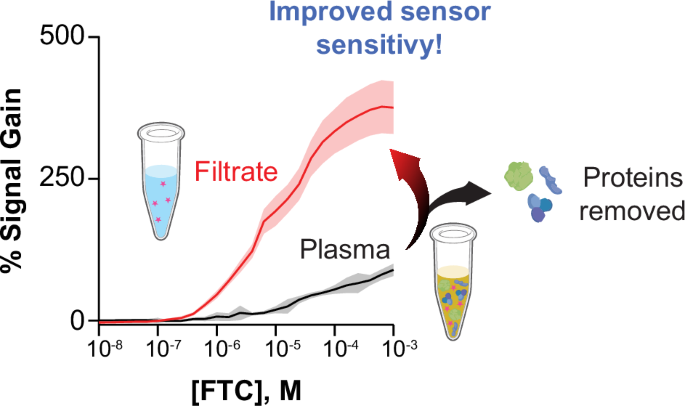
Proteins in biological fluids can dampen E-AB signal and sensitivity. We first illustrate these effects using an emtricitabine (also known as FTC) binding aptamer5, which was selected with the express purpose of measuring FTC in clinical samples via electrochemical measurements. The E-AB sensor achieved an EC50 in PBS of 10.4 ± 0.6 µM, which is on par with the expected clinical range for FTC in patients10 (Fig. 2a). However, as the sensor is moved into serum or plasma, the EC50 decreased to 89 ± 19 µM and 78 ± 16 µM, respectively, moving out of the desired sensing range. Additionally, the maximum signal output decreased from 350% in PBS to 89% in plasma (Fig. 2a, red trace vs. black), while staying at ~350% in serum. Note that FTC’s extent of protein binding is known to be less than 4%11, thus the effects seen here are likely related to protein interactions with the aptamer or sensor surface.

a Dose-response curves of E-ABs functionalized with the emtricitabine (FTC) aptamer against various FTC concentrations, measured in phosphate-buffered saline (PBS, red data), human serum (blue), and human plasma (black). In these measurements, the sensors’ signal output and EC50 decrease with increasing medium complexity; with sensor signal output going from 350% in PBS down to 89% in plasma, and the EC50 decreasing from 10 µM in PBS to 80 µM in plasma. b Single point injection of 10 µM FTC into PBS (red bar) or into a solution of 600 µM (physiological) serum albumin (BSA, black) in buffered saline. The experiment of FTC into PBS addition resulted in a 53 ± 1% signal change, while the equivalent experiment in BSA solution only generated 24 ± 1%. c Experiment showing the response of FTC-binding E-ABs in the face of increasing BSA concentrations until above physiological levels (i.e., 1 mM). In the physiological range, 500–800 µM, the FTC sensor is responding to BSA with a sensor signal output = 62 ± 12%. d Plasma samples treated with 1 mg/mL proteinase K to hydrolyze albumin showed signal recovery relative to untreated plasma. In panels A and D, solid lines represent a nonlinear fit to the Hill isotherm. For all panels n = 8 sensors, and the error bars represent the standard deviation of the mean. All measurements were conducted using square wave voltammetry. % Signal is plotted as the difference between normalized measurements performed at 600 Hz and measurements performed at 8 Hz (also known as KDM), using a 25 mV square wave amplitude.
To investigate the source of the decreased E-AB sensitivity and signal, we interrogated FTC sensors in either PBS alone or PBS containing 600 µM bovine serum albumin (BSA) to emulate physiological concentrations of circulating serum albumin (human albumin is cost-prohibitive). Then, FTC was spiked to a final concentration of 10 µM. Sensors that were exposed to physiological levels of albumin responded to the FTC spike with a 24 ± 1% increase in signal relative to baseline, while sensors in PBS alone showed 53 ± 1% signal increase at the square wave frequencies considered5 (Fig. 2b). These results confirmed our hypothesis that proteins in the biofluids—presumably albumin—play a role in decreasing sensor sensitivity and signal. We note that in the original paper reporting the FTC aptamer, albumin or other proteins were not included in the aptamer selection rounds, thus not controlling against nonspecific protein binding5.
To further characterize the effect of albumin on the FTC sensor, BSA was titrated into PBS spanning a range from 50 nM to 1 mM BSA, including the physiological range of 500–800 µM12, and measured at the specified frequencies of the FTC sensor (8 and 600 Hz)5. Due to the difference in expense and their close sequence homology13, we used BSA instead of human serum albumin in these characterization experiments. With increasing additions of BSA, the FTC sensor responded with a sensor signal output of up to 63 ± 13% in the physiological range, close to the 89% signal output seen in the full plasma titration of FTC (Fig. 2c vs. black trace in Fig. 2a).
Based on the confirmation of our previous hypothesis that serum or plasma proteins play a role in the dampening of both signal and sensitivity, we further hypothesized that digestion of serum or plasma proteins would reverse some of the dampening observed. To test this, we spiked samples of plasma containing specified amounts of FTC with 1 mg/mL proteinase K and incubated them for 5 min at 55 °C to allow digestion of the proteins. Proteinase K treatment led to an increase in signal output from 89% seen in the plasma FTC curve, to about 550% (Fig. 2d). The digested proteins were not filtered out of the plasma, leaving behind small peptides. Because this total signal output is higher than that of the FTC sensor in buffer, we speculate the additional signal is likely due to a time-dependent increase in the extent of nonspecific electrostatic interaction between the peptides generated by the digestion and the negatively charged DNA backbone, driving the sensor equilibrium to an “on” state. The digestion of proteins was carried out on separate sample vials. After each individual measurement, the sensors were washed with PBS and migrated to the next sample with a higher concentration of FTC. While protein levels were constant (all serum came from the same batch), the cumulative time of exposure to the post-digestion peptides increase throughout the experiment. Thus, the overall gain at the last point may be a combination of FTC binding and nonspecifically bound peptides to the sensor surface.
Coagulation and removal of serum or plasma proteins allows regeneration of FTC sensor sensitivity (Fig. 3a). To illustrate this, we coagulated the proteins in plasma using 2 mU/mL of thrombin, which cleaves fibrinogen to fibrin to activate clotting9. We pelleted the coagulated proteins via centrifugation and passed the supernatant first through a 100 kDa molecular weight cut-off filter, then through a 50 kDa filter to remove smaller proteins and digested peptides. These sizes were chosen to capture the three major serum protein classes, serum albumin (66.5 kDa14), human gamma-globulin (~160 kDa15), and fibrinogen ( ~300kDa16). Recently, it has been reported that 100 kDa filters are effective at preventing signal drift in E-AB sensors8. Finally, we used the filtrate to measure the concentration of FTC in the sample. The goal of this process is to clot the plasma proteins to make a fluid similar to serum, then filter that further to bring the complexity of the samples similar to that of FTC in PBS. This process offers a general strategy that can be adapted to the recovery of sensor sensitivity for various E-AB sensors developed using off-the-shelf aptamer sequences that were not specifically selected in the presence of biofluid proteins.

a Plasma samples are spiked with thrombin (final concentration of 2 mU/µL) and incubated, first for 10 min at 37 °C, then for 60 min at room temperature to allow coagulation. Then, the proteins are pelleted down via centrifugation at 16k × g for 45 min. The supernatant is then filtered using Amicon centrifugal filters as explained in the methods, to produce a filtrate containing the small-molecule target, which is quantified via E-AB measurements. b For FTC-binding E-ABs, the protocol leads to an increase in sensor signal output and sensitivity, with improvement of the EC50 from 80 µM in the original plasma to 11 µM in the filtrate. c Blinded, randomized FTC-containing plasma samples were interrogated via this protocol, resulting in a linear correlation with 97% agreement. Figure 3a Created in BioRender. Demek, E. (2025) https://BioRender.com/bpx5unm.
Using our protein separation method for FTC quantification, the total sensor signal output achieved in filtrate was two-fold larger than that of the original plasma titration curve (Fig. 3b). As seen in Fig. 2a (red trace), the EC50 in PBS was 10.4 ± 0.6 µM, while the EC50 in plasma shifted to 78 ± 16 µM. Using our protein filtration method, the EC50 obtained in the filtrate shifted back to 11 ± 3 µM (Fig. 3b). Given this positive result, we decided to move the protocol forward for the quantification of FTC in randomized plasma samples. As a first test, we asked an independent laboratory to make randomized, blinded plasma samples covering the clinical range of FTC. Then, we implemented our protein filtration protocol and conducted E-AB measurements to quantify FTC in the resulting filtrate. Doing so we observed a positive percent agreement of 97% between the actual, real concentrations spiked into each randomized sample, and our experimentally measured concentrations (Fig. 3c). Through a Chi-squared goodness-of-fit test with sample and expected distributions, the random sample experimental and real values had a chi-squared value of 2.59 for 7 degrees of freedom, resulting in a p-value of 0.92. This p-value indicates that the data sets are not significantly different.
Real-world, patient-to-patient variability in composition interferes with clinical measurements. To illustrate this and as a final validation experiment, we challenged our signal recovery method against real-world clinical samples collected by the Centers for Disease Control (CDC) from consented individuals participating in a study of antiretroviral drug pharmacokinetics5. First, we implemented our protocol on n = 28 samples, which were deidentified, randomized, and measured for FTC levels via liquid chromatography – mass spectrometry (LC-MS) at the CDC labs. The LC-MS measured concentrations were blinded for us. In our first attempt to quantify FTC, we tested the thrombin-treated filtrate post-pellet formation that had been centrifuged at 23 °C. Unfortunately, after unblinding and cross-comparing results, our E-AB-measured FTC concentrations did not match the concentrations determined by LC-MS, and we observed a high rate of false-positive outcomes in samples confirmed to be FTC negative (Fig. S1). Through a Chi-squared goodness-of-fit test with sample and expected distributions, the electrochemical and validated LC-MS values had a chi-squared value of 248 for 19 degrees of freedom, the resulting p-value was 0, meaning that the populations were significantly different and could not be related. We speculated that given the samples were collected at various times of the day, fat content in the plasma may vary drastically depending on subject lifestyle and time of donation (i.e., post meals vs. fasting). These effects of individual differences in cholesterol and fat content seen in clinical samples likely were not observed in the calibration experiments due to the pooling of plasma evening out the cholesterol and fat levels across all samples. While FTC has an octanol/water partition coefficient of log P = −0.4311, and is generally considered a hydrophilic drug with low probability of bioaccumulation in fat, we hypothesized the fat content may be interacting directly with the sensor and affecting our measurements. In an effort to confirm our hypothesis, we titrated cholesterol into PBS, mimicking the titration with BSA (Fig. 2c). Cholesterol produced 15% signal gain at 1 mM, much lower than that of BSA at the same concentration (Fig. S2). The smaller signal gain produced by cholesterol agrees with our assessment that the major interferents are serum proteins, while cholesterol and other fats play a smaller interference role.
To address the potential effect of plasma fat levels on our measurements, we changed the temperature of our centrifugation protocol to 4 °C17, which should cause fatty components in the plasma to pellet with the proteins. Implementing this “delipidation” step, we were able to regain the signal and measure samples, as well as achieve 100% agreement in confirmed negative samples (i.e., the E-AB measurements generated zero sensor signal output). We once again performed the plasma recovery method, with the added delipidation step, for an n = 20, and had an agreement of 74% (Fig. 4a). Chi-squared squared goodness-of-fit test with sample and expected distributions was performed, the random sample experimental and real values had a chi-squared value of 11 for 8 degrees of freedom, and the resulting p-value of 0.57 indicated that there was no evidence that the electrochemically measured samples were different than the LC-MS validated concentrations. Direct concentrations of the experimentally determined and LC-MS validated concentrations are shown in Table S1. One sample, denoted by the dashed circle in Fig. 4a, had a confirmed concentration of 10.4 µM by LC-MS measurement, but 1.7 µM by electrochemical measurement (ID = 2 in Table S1). However, this sample was outside of the expected clinical range, 100 nm to 10 µM, so it was not included in the Chi-squared analysis or linear correlation5. Additionally, this particular sample was investigated and found to have a higher degree of hemolysis than the other samples by the CDC hemolysis reference palette18 (Fig. S3). We speculate the increased presence of red blood cell components led to the filters clogging and preventing FTC from flowing through, artificially lowering the concentration in the filtrate.

a Blinded plasma samples (N = 21) from consented individuals undergoing antiretroviral therapy were shipped to the Arroyo laboratory from the Centers for Disease Control (CDC). The samples were deidentified at the CDC, and FTC levels were quantified via benchmark LC-MS methods. Then, the samples were reanalyzed in the Arroyo laboratory via E-AB measurements, using the signal recovery protocol. Utilizing a modified “delipidation” step, we were able to measure the clinical samples, with an agreement of 74%. b Stratification of samples (N = 21) between presence and absence of FTC based on the LC–MS standard. Error bars represent the standard deviation of the mean. No false-positive measurements resulted from the E-AB measurements.
When we stratified the analyzed samples into confirmed positive/negative distinctions, the plasma recovery method with delipidation achieved 100% agreement in confirmed negative samples, meaning the method produced no false-positive results (Fig. 4b). Of the 9 samples that were confirmed positive, two were false negatives; however, we note that the concentrations in these samples (IDs = 9 and 19 in Table S1) were lower than the E-AB limit of quantification (LOQ) of 1.1 µM (Fig. 4b). Thus, the plasma recovery method is unable to quantify at the lower limits of the LC-MS method, but it is able to produce similar results above the LOQ and report with 100% accuracy on confirmed negative samples.
The dampening of signal and sensitivity in biofluids seen with the FTC sensor can be seen with other E-AB sensors, so we hypothesized the plasma recovery method can be modified and applied to other E-ABs. We chose tobramycin19 and hydroxyquinoline20 E-AB sensors to demonstrate the generalizability of our method. Both sensors show the same pattern of dampening from buffer to plasma21,22,23 that FTC displayed as shown in Fig. 5a, b. The tobramycin sensor has an EC50 in PBS of 190 ± 16 µM, but 996 ± 56 µM in plasma (Fig. 5a). The hydroxyquinoline sensor has an EC50 in PBS of 900 ± 95 µM, but 4.5 ± 1.2 mM in plasma (Fig. 5b). The delipidation modification to the plasma recovery method was utilized for both the tobramycin and hydroxyquinoline sensors, with the goal of showing that the method is consistent and ready to be translated from pooled plasma (i.e., during calibration) to individual samples with inconsistent cholesterol and fat levels. Using the plasma recovery method with delipidation, the tobramycin sensor gave low and inconsistent signal output, even at high concentrations (i.e. 1 mM). We hypothesized that the aminoglycoside was electrostatically attracted to the protein pellet. To test this hypothesis, we added Proteinase K at a dose of 1 mg/mL prior to the addition of thrombin. The addition of this proteinase allowed the recovery of the EC50 from 996 ± 56 µM in plasma to 281 ± 91 µM (Fig. 5c). Hydroxyquinoline did not need the same treatment with proteinase K but, in sharp contrast, the normal delipidation step recovered the sensors’ Ec50 to 1.08 ± 0.59 µM (Fig. 5d). This EC50 is comparable to the dissociation constant, KD, previously reported for the quinine-aptamer pair via isothermal titration calorimetry24. Both FTC and hydroxyquinoline samples did not require additional treatment with Proteinase K, while tobramycin samples did. This difference is likely caused by differences in electrostatic charges between the targets. Both FTC and hydroxyquinoline are neutral at physiological pH, while tobramycin is positively charged. The positive charge of tobramycin likely leads to electrostatic attraction between the target and the protein pellet, thus requiring the addition of Proteinase K to further break up the proteins. Other future charged targets likely need Proteinase K addition to prevent losing target through electrostatic attraction during clotting.

We show data for two additional E-AB sensors using off-the-shelf aptamers against tobramycin (a, b) hydroxyquinoline. In both cases the sensors EC50 appeared better in buffered saline relative to plasma, with EC50 values of 190 µM vs. 996 µM for tobramycin, respectively, and EC50 values of 900 µM vs. 4.5 mM for hydroxyquinoline. The hill equation is fit to n = 8 measurements for each concentration point, with error bars denoting the standard deviation. The implementation of the protein precipitation and filtration protocol achieves either equal or an improvement of EC50 in both cases. c The filtrate curve for tobramycin shows an EC50 of 281 µM. d The filtrate curve for hydroxyquinoline shows an EC50 of 1.08 µM. The hill equation is fit to n = 15 measurements for each concentration point, with error bars denoting the standard deviation for both c, d.
While we observed improvements in the EC50 of both tobramycin and hydroxyquinoline sensors with our protocol, we also observed a significant dampening in sensor gain, in both cases from ~250%, down to 40% and 30%, respectively. At this stage we are not sure why this is the case; we speculate nonspecific interactions with the protein pellet prior to filtration may be conducive to more retention of the molecules, decreasing the effective concentration in the filtrate. Further method development may be necessary for these two targets to improve their retention in solution post filtration. Nevertheless, recovery of the EC50 for the tobramycin and hydroxyquinoline sensors demonstrates the generalizability of our method to other E-ABs.
Our results also indicate that the method can be easily adapted, via delipidation or the addition of proteinases, to address target-specific issues such as lipid interference or protein-bound drug.
To summarize, in this work, we sought to quantify the antiretroviral drug emtricitabine (FTC) directly in plasma using E-AB sensors. However, we observed significant dampening of both sensor sensitivity and signal output relative to analogous measurements conducted in buffered saline. This loss of performance is not unique to the FTC sensor but is a common limitation for “off-the-shelf” aptamers often used in E-AB platforms. Through systematic investigation, we identified serum proteins as the primary contributor to signal dampening, with plasma lipids playing a secondary role. Initial titrations of FTC in plasma revealed a substantial decrease in sensitivity, with the EC50 shifting from 10 µM (buffer) to 80 µM (plasma), accompanied by a marked reduction in sensor signal output from approximately 370% to 90% (Fig. 2a). These observations pointed to serum proteins as the likely source of interference. Subsequent experiments confirmed that protein removal could partially restore sensor performance. This insight motivated the development of a protein-removal strategy to enable accurate quantification of FTC in patient plasma samples (Fig. 2b–d).
Through extensive optimization, we determined that initiating coagulation via thrombin addition9, followed by centrifugation and filtration to remove precipitated proteins, was the most effective approach to mitigate protein-induced dampening without introducing additional interference. Applying this protocol to the FTC sensor more than doubled the sensor signal output, restoring the EC50 to values statistically indistinguishable from those obtained in PBS (Fig. 3b). Variability in lipid content across individual samples posed an additional challenge; however, adjusting the centrifugation temperature from 23 °C to 4 °C enabled effective lipid removal without compromising protein clearance (Fig. S1, Fig. 4a, b).17 This refinement allowed for successful quantification of FTC in patient plasma, achieving 100% accuracy in identifying confirmed negative samples (Fig. 4b). Recognizing that such dampening is not unique to the FTC sensor, we extended the approach to additional E-AB systems. We tested two aptamers previously shown to experience significant signal dampening in plasma: those targeting tobramycin and hydroxyquinoline. Both displayed an order-of-magnitude decrease in EC50 and sensor signal output when transitioned from PBS to plasma (Fig. 5a, b). Application of the plasma recovery method successfully restored EC50 values to within error of their PBS counterparts, or better (Fig. 5c, d).
We identified serum proteins and lipids as key contributors to signal dampening in electrochemical aptamer-based (E-AB) sensors used in biofluids. We developed a simple, generalizable signal recovery method that restores the sensor sensitivity from buffered solutions in plasma by coagulating and removing proteins via thrombin addition and low-temperature centrifugation to additionally remove lipids. Applied to both pooled plasma and individual patient specimens, this approach recovered sensitivity and improved signal consistency, allowing accurate quantification of FTC and other targets, even with “off-the-shelf” aptamers not originally selected for biofluid compatibility.
While our method enables existing aptamers to function more effectively in complex biological matrices, it does not overcome the fundamental limitations of aptamer selection in simple buffers, nor is it compatible with wearable or continuous molecular monitoring due to the required sample processing steps. Specifically, the need for centrifugation and filtration renders the method unsuitable for real-time or in vivo applications. Future aptamer development must incorporate biofluid-mimicking conditions, including serum proteins and lipids, during selection to yield sequences inherently suited for direct sensing in biological environments. As the field advances toward wearable sensors, our method remains limited to in vitro applications. Nonetheless, the plasma recovery strategy presented here offers a practical and flexible solution to improve the performance of sensors made with already reported aptamer sequences for analytical, diagnostic and preclinical applications.
We also note that in the course of this study, we explored heat precipitation as a standalone method for protein removal. While this approach did result in partial recovery of signal and sensitivity, the improvement was insufficient, falling short of the performance observed in buffer conditions. These findings led us to pursue the enzymatic method presented in this study. We also note that we elected not to pursue acid precipitation-based strategies due to concerns about altering the pH, which would interfere with aptamer folding and sensor performance. While pH changes could be neutralized post-treatment using alkaline solutions, we aimed to minimize sample manipulation to avoid excessive dilution. This was particularly important given the expected FTC concentrations (1–10 µM), where maintaining sample concentration was critical for accurate quantification.
Overall, the enzymatic approach reported in this study provided a more effective and tunable method for protein removal while preserving sensor performance and sample integrity.
Methods
Chemicals and materials
6-Mercapto-1-hexanol (MCH, 451088), Human Thrombin (T6884), Tris(2-carboxyethyl)phosphine hydrochloride (TCEP, C4706), Calcium Chloride Dihydrate (CaCl2, C5080), and Magnesium Chloride Hexahydrate (MgCl2, BP214) were purchased from Sigma-Aldrich (St. Louis, MO). Phosphate-buffered saline (1X PBS, 11.9 mM HPO32−; 137 mM NaCl; 2.7 mM KCl; pH = 7.4), sulfuric acid (H2SO4), sodium hydroxide (NaOH), and Recombinant Proteinase K (EO0491) were purchased from Fisher-Scientific (Waltham, MA). Albumin, Bovine, Fraction V (J64655) was purchased from Alfa Aesar (Ward Hill, MA). Cholesteryl Hemisuccinate Tris Salt (CH210) was purchased from Anatrace (Maumee, OH). All aqueous solutions were prepared using deionized water from a Milli-Q Direct purification system, with a resistivity of 18 MΩ. Gold disk electrodes (PN 002314, diameter 1.6 mm), and coiled platinum wire counter electrodes (012961) were purchased from ALS Inc. (Tokyo, Japan). Silver/silver chloride reference electrodes (CHI111) were purchased from CH instruments (Austin, TX). For polishing electrodes, 0.1 µM diamond slurry was purchased from Buehler (Lake Bluff, IL) and cloth pads (MF-1040) were purchased from BASi (West Lafayette, IN). Pooled, deidentified, unfiltered, 3.2% sodium citrate human plasma and serum were purchased from BioIVT (Westbury, NY). Emtricitabine (FTC, TRC-E525000) was purchased from Toronto Research Chemicals, Inc (Toronto, Canada). Tobramycin sulfate (tobramycin, T1598) was purchased from Spectrum Chemical Manufacturing Group (Gardena, CA). Finally, 6-hydroxyquinoline (PN 304484) was purchased from Sigma-Aldrich (St. Louis, MO).
DNA preparation
For the functionalization of gold electrodes, 1 µL ssDNA (100 µM in water) was incubated with 2 µL TCEP solution (10 mM in water) for 1 h to reduce disulfide bonds. Once reduced, the DNA was diluted in PBS to a final concentration of 200 nM (FTC) or 500 nM (tobramycin, hydroxyquinoline). DNA concentration was determined via absorbance at 260 nm using an Implen Nanphotometer NP80. All oligonucleotide sequences used in this study are listed in Table 1.
Sensor preparation
Gold electrodes were polished for ~2 min using a cloth pad with 1 µm diameter alumina slurry. After polishing, the electrodes were cleaned electrochemically via cyclic voltammetry first from −0.3 to −1.6 V (vs Ag|AgCl) in 0.5 M NaOH at a scan rate of 0.5 V/s, and then from 0 to 1.55 V (vs Ag|AgCl) in 0.5 M H2SO4, also at a scan rate of 0.5 V/s. Electrodes for FTC were not electrochemically roughened as they showed better performance under these fabrication conditions. Electrodes prepared for the tobramycin and hydroxyquinoline aptamers were then roughened in 0.5 M H2SO4 via chronoamperometry by pulsing from 0 to 2 V (vs Ag|AgCl) with 320 steps and a pulse width of 0.02 s to increase surface area of the electrode. The cleaned (FTC) and/or roughened (tobramycin/hydroxyquinoline) electrodes were immediately placed in 200 nM or 500 nM solutions of the aptamers, respectively, for 60 minutes. Immediately following aptamer incubation, the electrodes were placed in 1 mM MCH solution in PBS supplemented with 2 mM MgCl2 for 12 h. The sensors were then “pretreated” by 50 consecutive square wave voltammograms at 80 Hz (hydroxyquinoline), 250 Hz (tobramycin), or 600 Hz (FTC), using a 50 mV amplitude and 2 mV step size in all cases, to remove nonspecifically bound aptamer from the electrode surface.
Sample preparation for signal recovery calibration
The target of interest (FTC, tobramycin, or hydroxyquinoline) was dissolved in 100% human plasma and diluted using 100% plasma to prepare 300 µL samples to construct an 8 pt calibration curve ranging from 10 nM to 1 mM target. The samples were there incubated at 37 °C for 30 min in an Eppendorf ThermoMixer F2.0. Thrombin then was added to a final concentration 2 mU/µL, and incubated at 37 °C for 10 min before incubation at 25 °C for 1 hr. In the case of the tobramycin samples, after 25 min incubation at 37 °C, proteinase K was added to a final concentration of 1 mg/mL and incubated another 5 min at 37 °C prior to the thrombin addition. Following incubation, the samples were centrifuged at 16k × g for 45 min using the Eppendorf Centrifuge 5425 R to pellet the coagulated proteins. The supernatant was decanted, excluding the pelleted proteins, and transferred to an Amicon Ultra centrifugal filters (0.5 mL 100 kDa MWCO) and centrifuged at 13.5k × g for 20 min. The filtrate was then transferred to Amicon Ultra centrifugal filters (0.5 mL 50 kDa MWCO) and centrifuged at 13.5k × g for 20 min. The filtrate was then recovered for measurement. Blank samples were prepared with identical protocol in the absence of target.
Random sample preparation
Eight concentrations between 100 nM and 100 µM FTC were generated randomly and prepared using the above method. The samples were then given a letter label to blind the study. The blinded samples were treated in the manner described above.
Electrochemical measurement of signal recovery calibration
CH Instruments Electrochemical Analyzer (CHI 1040 C, Austin, TX) multichannel potentiostats and associated software were used for all electrochemical measurements. A three-electrode cell configuration consisting of gold working electrodes, a coiled platinum wire counter electrode, and an Ag|AgCl reference electrode was used. All square wave voltammetry measurements used a voltage window from −0.1 to −0.5 V, an amplitude of 25 mV, and a step of 1 mV with quiet time of 1 s. Each sample was scanned at the lower “off” frequency, and the higher “on” frequency to measure change in both signals in accordance with the change in concentration. The frequencies chosen for each aptamer were based off the frequencies on the frequency map where in the presence, or absence, of target there is no overlap between the two currents, and there is increased current above the other. The FTC aptamer was scanned at 8 and 600 Hz5 (Fig. S5); the tobramycin aptamer was scanned at 80 and 250 Hz (Fig. S6); the hydroxyquinoline aptamer was scanned at 5 and 80 Hz (Fig. S7), respectively.
The sensors were scanned once using cyclic voltammetry prior to all measurements, and the electrodes were pretreated 5 times in blank filtrate at the “on” frequency to establish a stable background. Each sample was measured first by scanning 200 µL blank filtrate to establish the background, then 150 µL of blank was removed and replaced with 150 µL sample filtrate and scanned four more times. Thus, the concentration of target was diluted 1/4, but there was no plasma dilution throughout.
Clinical samples
Peripheral blood was collected from HIV-negative male participants in two clinical studies registered at clinicaltrials.gov and conducted at the Emory Hope Clinic in Atlanta, Georgia25,26. (Both trials were funded by the US Centers for Disease Control and Prevention (CDC) and approved by Emory University and CDC Institutional Review Boards. All study participants gave written informed consent, and the trials conform to the US Federal Policy for the Protection of Human Subjects. In one study, 40 male participants provided 108 blood specimens after receiving a single oral dose formulation containing 200 mg emtricitabine (FTC), 10 mg tenofovir alafenamide (TAF), 150 mg elvitegravir (EVG) and 150 mg cobicistat (COBI) as well as a single 800 mg dose of darunavir (DRV) (NCT03472963). In the second study, 31 male participants provided 54 blood specimens after receiving two doses of a single formulation containing 200 mg FTC, 10 mg TAF, 150 mg EVG and 150 mg COBI given 24 h apart (NCT03976752). Peripheral blood specimens were collected in sodium citrate cell preparation tubes (CPT) (Becton Dickinson, Franklin Lakes, New Jersey, USA). Plasma aliquots were collected from CPT following centrifugation. Concentrations of FTC were measured in plasma specimens using high-performance liquid chromatography-tandem mass spectrometry (HPLC-MS/MS) (Sciex, Foster City, CA, Shimadzu Scientific Instruments, Durham, NC) as previously described25,26.
Data analysis
To process the files generated during the continuous voltametric interrogation, we used a Python-based custom script previously reported by our group (SACMES)27. SACMES allows for the rapid extraction of capacitive currents from voltammograms, thus enabling batch analysis of the thousands of files generated during measurements. Through nonlinear regression analysis, generation of Hill equations (left(y=base+frac{max -base}{(1+{left(frac{xhalf}{x}right)}^{rate})}right)) to fit data was performed using Igor Pro 8 (WaveMetrics, Inc). Because the tobramycin curve in plasma and the tobramycin and hydroxyquinoline recovery method curves do not display asymptotic behavior on the upper end, the maximum signal was held to below that of the PBS curve in order to fit the data with the Hill equation.
Data availability
All raw and processed data included in this manuscript is freely accessible via the Johns Hopkins Research Data Repository (https://archive.data.jhu.edu). The data can be located by searching for the manuscript title or via the DOI address: https://doi.org/10.7281/T1SWD6OL.
References
-
Xiao, Y., Lubin, A. A., Heeger, A. J. & Plaxco, K. W. Label-free electronic detection of thrombin in blood serum by using an aptamer-based sensor. Angew. Chem. Int. Ed. Engl. 44, 5456–5459 (2005).
-
Bao, J., Krylova, S. M., Reinstein, O., Johnson, P. E. & Krylov, S. N. Label-free solution-based kinetic study of aptamer-small molecule interactions by kinetic capillary electrophoresis with UV detection revealing how kinetics control equilibrium. Anal. Chem. 83, 8387–8390 (2011).
-
Datta-Mannan, A., Witcher, D. R., Tang, Y., Watkins, J. & Wroblewski, V. J. Monoclonal antibody clearance. Impact of modulating the interaction of IgG with the neonatal Fc receptor. J. Biol. Chem. 282, 1709–1717 (2007).
-
Szeitner, Z., Andras, J., Gyurcsanyi, R. E. & Meszaros, T. Is less more? Lessons from aptamer selection strategies. J. Pharm. Biomed. Anal. 101, 58–65 (2014).
-
Li, J. et al. Monitoring HIV antiretroviral therapy via aptamer-based measurements in preclinical animal models, in human plasma. Adv. Sens. Res. 4, 2400191 (2025).
-
Tuerk, C. & Gold, L. Systematic evolution of ligands by exponential enrichment: RNA ligands to bacteriophage T4 DNA polymerase. Science 249, 505–510 (1990).
-
Ellington, A. D. & Szostak, J. W. In vitro selection of RNA molecules that bind specific ligands. Nature 346, 818–822 (1990).
-
Pham, J. D. et al. On the blood components contributing to the drift of electrochemical aptamer-based biosensors. ACS Sens. https://doi.org/10.1021/acssensors.5c01267 (2025).
-
Johnstone, A. P. & Thorpe, R. Immunochemistry in Practice 2nd Repr. edn, (Blackwell Scientific Publications, 1988).
-
Dickinson, L. et al. Plasma tenofovir, emtricitabine, and rilpivirine and intracellular tenofovir diphosphate and emtricitabine triphosphate pharmacokinetics following drug intake cessation. Antimicrob. Agents Chemother. 59, 6080–6086 (2015).
-
Sciences, G. Emtriva (emtricitabine) Capsule Label, https://www.accessdata.fda.gov/drugsatfda_docs/label/2012/021500s019lbl.pdf (2011).
-
Busher, J. T. In Clinical Methods: The History, Physical, and Laboratory Examinations (eds Walker, H. K., Hall, W. D. & Hurst, J. W.) (Butterworth Publishers, 1990).
-
Mishra, V. & Heath, R. J. Structural and biochemical features of human serum albumin essential for eukaryotic cell culture. Int. J. Mol. Sci. 22. https://doi.org/10.3390/ijms22168411 (2021).
-
Carter, D. C. et al. Three-dimensional structure of human serum albumin. Science 244, 1195–1198 (1989).
-
Tomasi, T. B. Jr. Human gamma globulin. Blood 25, 382–403 (1965).
-
Marder, V. J., Shulman, N. R. & Carroll, W. R. High molecular weight derivatives of human fibrinogen produced by plasmin: I. Physicochemical and immunological characterization. J Biol Chem 244, 2111–2119 (1969).
-
Li, N. et al. Sequential precipitation and delipidation enables efficient enrichment of low-molecular weight proteins and peptides from human plasma. J. Proteome Res. 19, 3340–3351 (2020).
-
Prevention, U. S. C. f. D. C. a. Reference Tool to Determine Hemolysis Status, https://www.cdc.gov/vector-borne-diseases/media/pdfs/Hemolysis_Palette_Reference_Tool-P.pdf (2024).
-
Arroyo-Curras, N. et al. Real-time measurement of small molecules directly in awake, ambulatory animals. Proc. Natl. Acad. Sci. USA 114, 645–650 (2017).
-
Reinstein, O. et al. Quinine binding by the cocaine-binding aptamer. Thermodynamic and hydrodynamic analysis of high-affinity binding of an off-target ligand. Biochemistry 52, 8652–8662 (2013).
-
Pellitero, M. A., Curtis, S. D. & Arroyo-Curras, N. Interrogation of electrochemical aptamer-based sensors via peak-to-peak separation in cyclic voltammetry improves the temporal stability and batch-to-batch variability in biological fluids. ACS Sens. 6, 1199–1207 (2021).
-
Arroyo-Curras, N. et al. Subsecond-resolved molecular measurements in the living body using chronoamperometrically interrogated aptamer-based sensors. ACS Sens. 3, 360–366 (2018).
-
Stojanovic, M. N., de Prada, P. & Landry, D. W. Aptamer-based folding fluorescent sensor for cocaine. J. Am. Chem. Soc. 123, 4928–4931 (2001).
-
Datta, M., Kaiyum, Y. A., Johnson, P. E. & Liu, J. An ultrahigh affinity DNA aptamer for quinine and its intrinsic fluorescence based label-free detection. Chemistry 31, e202403435 (2025).
-
Haaland, R. E. et al. Pharmacology of boosted and unboosted integrase strand transfer inhibitors for two-dose event-driven HIV prevention regimens among men. J. Antimicrob. Chemother. 78, 497–503 (2023).
-
Massud, I. et al. Single oral dose for HIV pre or post-exposure prophylaxis: user desirability and biological efficacy in macaques. EBioMedicine 58, 102894 (2020).
-
Curtis, S. D. et al. Open source software for the real-time control, processing, and visualization of high-volume electrochemical data. Anal. Chem. 91, 12321–12328 (2019).
Acknowledgements
The authors thank Richard Haaland, Jeff Fountain, Michele Daly, Eric Edwards and Chuong Dinh (Division of HIV Prevention, Centers for Disease Control and Prevention); Colleen Kelley and Christopher Conway-Washington (Emory Hope Clinic) for access to the clinical samples used in the study. The authors also thank the Air Force Office of Scientific Research through award FA9550-20-1-0117.
Ethics declarations
Competing interests
N.A.-C. has filed a patent application related to the emtricitabine aptamer sequence reported in this study, as well as to its application to therapeutic drug monitoring and monitoring of adherence to therapy. E.D. declares no competing interests.
Additional information
Publisher’s note Springer Nature remains neutral with regard to jurisdictional claims in published maps and institutional affiliations.
Supplementary information
Rights and permissions
Open Access This article is licensed under a Creative Commons Attribution-NonCommercial-NoDerivatives 4.0 International License, which permits any non-commercial use, sharing, distribution and reproduction in any medium or format, as long as you give appropriate credit to the original author(s) and the source, provide a link to the Creative Commons licence, and indicate if you modified the licensed material. You do not have permission under this licence to share adapted material derived from this article or parts of it. The images or other third party material in this article are included in the article’s Creative Commons licence, unless indicated otherwise in a credit line to the material. If material is not included in the article’s Creative Commons licence and your intended use is not permitted by statutory regulation or exceeds the permitted use, you will need to obtain permission directly from the copyright holder. To view a copy of this licence, visit http://creativecommons.org/licenses/by-nc-nd/4.0/.
About this article

Cite this article
Demek, E., Arroyo-Currás, N. General approach to achieving electrochemical aptamer-based sensor sensitivity of buffer in blood plasma. npj Biosensing 3, 2 (2026). https://doi.org/10.1038/s44328-025-00066-7
-
Received:
-
Accepted:
-
Published:
-
Version of record:
-
DOI: https://doi.org/10.1038/s44328-025-00066-7