Main
Highly reflective molecular crystals that produce diverse optical phenomena in animals1,2,3,4,5,6 were found recently to be widespread in unicellular eukaryotes7, including in superabundant, primary producing microalgae such as dinoflagellates8,9. In marine dinoflagellates, rather than performing optical functions, guanine crystals act as high-capacity nitrogen (N) stores10 that are used to overcome periodic deficiencies in environmental N. When N-starved Amphidinium carterae are fed with ({{rm{NO}}}_{3}^{{-}}) or ({{rm{NH}}}_{4}^{+}), the cells transform excess inorganic N into guanine crystals. When the external N is depleted, the crystals are then used as an organic N reservoir to support cell growth10. Dinoflagellates can also accumulate molecular guanine directly from the medium and metabolize it for growth10. This behavior has important biogeochemical implications as N-heterocycles such guanine are principal constituents of low molecular weight dissolved organic nitrogen (DON)11—an abundant and persistent form of marine reduced N11. Anthropogenic influences have led to increases in DON12, and rationalizing how microalgae metabolize N-heterocycles is crucial to understanding DON cycling in oceans. N storage strategies of dinoflagellates are also vital to their symbiosis with corals, where organic N translocated from dinoflagellates enables coral reefs to thrive in nutrient-deficient waters13,14,15.
Here we show that dinoflagellates can directly uptake, crystallize and proliferate on numerous N-heterocycles, suggesting that the storage of organic N in crystals and the subsequent release of organic N from these crystals is a general strategy for their metabolism of DON. The ability of dinoflagellates to crystallize N-heterocycles rapidly from aqueous solutions is striking given that these sparingly soluble molecules16 require extreme pH values13,17,18,19,20 or organic solvents for recrystallization in vitro21. We demonstrate a proof-of-concept for harnessing microalgae as living factories, repurposing this native crystallization phenomenon for determining the structures of uncharacterized biogenic molecular crystals and synthesizing molecular crystals with tailored morphologies and optical properties.
Results
Direct uptake, crystallization and use of N storage guanine
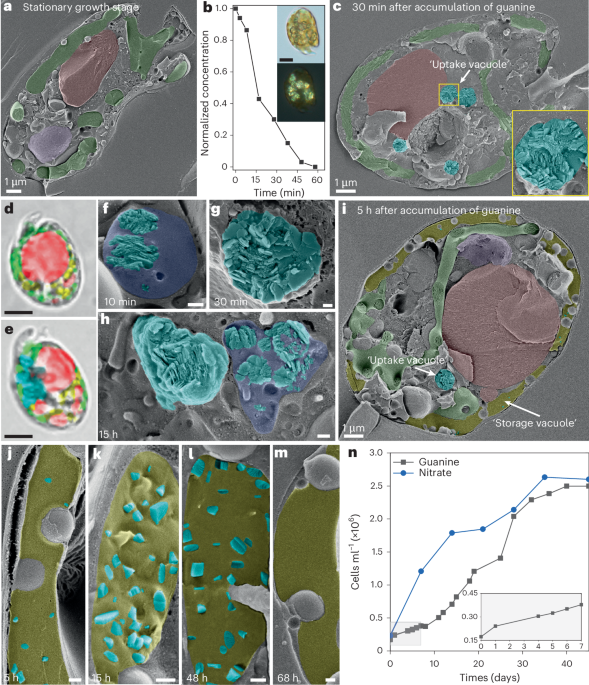
To better characterize the crystal morphologies and organelle ultrastructure used in the guanine uptake and storage cycle, as reported by Mojzes et al.10, we used polarizing optical microscopy and high-resolution cryogenic scanning electron microscopy (cryo-SEM) to image cells in their native, hydrated state. N-starved A. carterae cells (Fig. 1a) (2 × 10⁵ cells ml−1) were transferred to a culture medium containing dissolved guanine (~40 μM) as the sole N source10. We observed that guanine was depleted rapidly from the medium (Fig. 1b, ultraviolet–visible (UV–vis) spectroscopy), concomitantly with the appearance of birefringent (Fig. 1b, polarizing optical microscopy), polycrystalline spheroids (Fig. 1c, cryo-SEM) composed of the β polymorph of guanine (denoted β-guanine) (Fig. 1d,e, Raman microscopy). These polycrystalline spheroids are housed in centrally located, membrane-bound vacuoles (Fig. 1f–i). The vacuoles begin to accumulate crystals just 1–10 min after exposure to exogenous guanine (Fig. 1f), are fully formed after ~1–5 h (Fig. 1g and Supplementary Fig. 1) and begin to disintegrate after 12–48 h (Fig. 1h). Due to the rapid kinetics of this uptake process, observing vacuoles in a state of formation is rare (Fig. 1f). The polycrystalline deposits are made up of disordered stacks of (100) β-guanine plates, indicating that they form in an uncontrolled manner consistent with fast crystallization kinetics. In parallel with the disintegration of the central accumulation vacuoles (Fig. 1h), a new ‘storage vacuole’ expands at the cell periphery (Fig. 1i), where nano-sized guanine crystals22 emerge ~5–48 h after feeding (Fig. 1j–l; pseudocolored yellow). The guanine crystals formed in this vacuole have a more uniform prismatic or lath morphology, indicative of slower crystallization kinetics. These crystals are usually elongated along the π-stacking direction and exhibit a relatively minor (100) crystal face23. This morphology is distinct from guanine crystals in animal optical systems, which typically form as plates, preferentially expressing the highly reflective (100) face1,2. We also note this peripheral storage vacuole contains a solution that is more resistant to etching compared to the surrounding cytoplasm (Supplementary Fig. 2, similar to recent observations by Goodenough et al.24), suggesting it contains a solute with more tightly bound water. After approximately 4–7 days, this storage vacuole also becomes depleted of crystals (Fig. 1l,m), after which cell growth increases exponentially, resulting in a tenfold increase in cell density—similar to growth on nitrates (Fig. 1n).

a, Pseudocolored cryo-SEM image of A. carterae in the stationary growth phase, prior to transfer into guanine-containing medium. b, Normalized concentration of guanine in the medium following feeding. Inset: brightfield (upper) and polarizing (lower) optical images of a cell 30 min after transfer into the guanine-containing growth medium. c, Cryo-SEM image of A. carterae 30 min after transfer into the guanine growth medium. Inset: higher magnification image of an uptake vacuole. d,e, Raman pseudocolored maps of A. carterae in the stationary growth phase (d) and 30 min after transfer into the guanine growth medium (e). Green: plastids; red: neutral lipid; purple: nucleus; cyan: guanine; yellow: starch. f–h, Representative uptake vacuoles 10 min (f), 30 min (g) and 15 h (h) after feeding. i, Cryo-SEM image of a cell 5 h after feeding showing the appearance of a reticulated storage vacuole between the cell wall and the chloroplasts. j–m, Representative pseudocolored cryo-SEM images of storage vacuoles at 5 h (j), 15 h (k), 48 h (l) and 68 h (m) after feeding. Cyan: crystalline guanine; dark blue: uptake vacuole; yellow: storage vacuole. n, Averaged cell growth curves following feeding with nitrate- and guanine-containing medium. Each experimental condition was replicated independently (n = 10). Of these, four replicates were sampled at different timepoints for high-pressure freezing and cryo-SEM imaging; as less than 20 μl are needed for this, the remainder of the culture was monitored for cell growth by UV–vis spectroscopy. White scale bars: 100 nm unless indicated otherwise; black scale bars: 5 μm.
These results show that molecular guanine—a dominant component of marine low molecular weight DON11,25—is accumulated rapidly in an ‘uptake vacuole’, then transported to, and recrystallized within, a storage vacuole where it is used to regulate cell metabolism and growth. The uptake vacuole is reminiscent of ‘metabolic pools’ observed in yeast (Candida utilis26), microalgae (Chlorella fusca27) and diatoms (Phaeodactylum tricornutum28), which use accumulated guanine for nucleic acid synthesis and growth. Within minutes under ambient conditions10, A. caterae cells can accumulate and crystallize large quantities of guanine, despite its extremely low aqueous solubility at neutral pH16, and thus its low concentration in the medium (Fig. 1).
Uptake and growth of dinoflagellates on accumulated N-heterocyclic crystals
To understand whether the direct uptake, crystallization and use of organic N is a general phenomenon, we applied the same methodology used for guanine (Fig. 1b) to other N-rich molecules that are components of DON, including purines, pteridines and pyrimidines11,25 (Table 1). UV–vis spectra showed that most N-heterocycles investigated are depleted from the medium within tens of minutes to days (Fig. 2a), implying that they are also accumulated intracellularly. As observed for guanine (Fig. 1n), the accumulation of N-heterocycles also results in cell growth (Fig. 2b). The depletion rates of compounds from solution (Fig. 2a) do not correlate with percentage N per molecule (Supplementary Fig. 3) but do correlate somewhat with aqueous solubility (Fig. 2c), with more soluble compounds such as cytosine accumulating slowly and only when present at high concentrations (for example, 1 mM; Table 1). The total amount of N in the medium is not correlated with the magnitude of cell growth (Supplementary Figs. 3 and 4). However, the change in the number of cells per mole of N in solution strongly correlates with the aqueous solubility of the compound (Fig. 2d), with sparingly soluble pteridines supporting more cell growth compared to highly soluble compounds, despite their accumulated mass per cell being significantly lower (for example, ~7 pg of leucopterin per cell, compared to ~250 pg of cytosine). This indicates that, once accumulated, the efficiency of N use is inversely proportional to the aqueous solubility of the compound. We note that additional factors beyond N assimilation, such as the metabolic costs associated with uptake of compounds of different solubilities, may influence growth rates. The diversity of molecules accumulated indicates a promiscuous uptake and transport process perhaps involving pinocytosis.

a, Change in N-heterocycle concentration in growth medium over time. b, Number of cells per mole of N in the growth solution as a function of time for each compound. c, Absolute uptake rate (slope of plots in a) as a function of the solubility of each compound. d, Change in the number of cells per mole of N from c as a function of the solubility of each compound. Uptake experiments monitored by UV–vis spectroscopy were repeated independently four times.
Morphologies and chemical compositions of accumulated crystals
To rationalize why the growth of A. carterae may depend on the solubility of the N-heterocycles, we investigated the physical form in which the molecules are accumulated. Polarizing optical microscopy, cryo-SEM, and Raman microscopy show that, similar to guanine, the other N-heterocycles initially accumulate in uptake vacuoles as birefringent crystals composed of the original N-heterocycle present in solution (Fig. 3, Table 1 and Supplementary Figs. 5–15). Each compound is associated with a characteristic solid phase morphology (Fig. 3, columns I and II). For example, cytosine and theobromine form large needle single crystals that traverse the length of the cell (Fig. 3a (columns I and II, Supplementary Fig. 16 and Supplementary Video 1). Leucopterin (Fig. 3b), hypoxanthine (Supplementary Fig. 6), pterin (Supplementary Fig. 12) and other compounds form polycrystalline deposits. Xanthopterin (Fig. 3c) and uric acid (Supplementary Fig. 9) form one-dimensionally periodic spherulites (that is, with liquid crystal ordering29,30; Supplementary Fig. 17) and xanthine forms crystalline spherulites (Fig. 3d). Xanthine spherulites exhibit a ‘Maltese cross’ extinction pattern under polarized light arising from the radial symmetry of the spherulitic structure (Fig. 3d and Supplementary Fig. 18). Several hours to days following uptake, the N-heterocyclic crystals are depleted from the uptake vacuole while guanine crystals simultaneously emerge in the storage vacuole (Table 1, Supplementary Fig. 19 and Supplementary Table 1). This indicates that the accumulated crystals are dissolved, then converted enzymatically to guanine or catabolized and biosynthesized to guanine for storage. These observations indicate that dinoflagellates have evolved a preference to use guanine over other N-heterocycles7,31. A summary of the morphology, chemical composition and crystalline state of each of the accumulated N-heterocycles is presented in Table 1.

Column I. Left: brightfield images of intracellular crystals in the uptake organelle; right: corresponding polarizing optical microscopy images. Column II. Representative cryo-SEM images of the different crystal morphologies (crystals; pseudocolored cyan). Column III. Representative in situ Raman spectra from the intracellular deposits and recrystallized reference compounds. Insets: locations of the crystals (cyan). a, Large single crystals of cytosine monohydrate and theobromine. Inset in column II: cross-section view of the cytosine crystal. b, Polycrystalline deposits formed of needle-like leucopterin and pterin. c, One-dimensional ordered spherulites of xanthopterin and uric acid. d, Crystalline xanthine spherulites. Each experimental condition (that is, N-heterocycle) was replicated independently (n = 4), screening hundreds of cells by optical microscopy. Cryo-SEM was performed for a minimum of two replicates. In Raman experiments, spectra from three to six cells were collected for each experimental condition.
These results show that the formation and dissolution of crystals is a general feature of low molecular weight DON metabolism by dinoflagellates. The dependence of cell growth on the solubility of the accumulated compounds indicates that the metabolic efficiency of the different N-heterocycles may depend on the thermodynamic stability of the crystals. We hypothesize that sparingly soluble crystals act as efficient N stores by facilitating slow release (Supplementary Fig. 20) of sequestered molecules from the uptake vacuole and efficient reprocessing into guanine crystals in the storage vacuole, or more effective transmission of stored crystals to daughter cells during cell division22. Conversely, rapid release of molecules from soluble crystals (for example, cytosine monohydrate) may cause temporary excesses of organic N to be expelled as waste. Although the precise enzymatic and/or biosynthetic pathways for conversion of different N-heterocycles to guanine remain unidentified, the persistence of guanine as the final storage crystal suggests a conserved metabolic funneling mechanism analogous to purine salvage pathways.
Harnessing dinoflagellates as cellular factories for molecular crystals
We were motivated to explore whether the native crystallization behavior of dinoflagellates (Fig. 3 and Supplementary Figs. 5–15) could be harnessed as a ‘tool’ for the synthesis or investigation of functional molecular materials.
Crystal structure determination of difficult-to-crystallize compounds
Leucopterin is a high refractive index (RI) solid used by butterflies and other insects to produce brilliant white scattering32. However, the crystal structure of the biogenic material is still unknown and structure determination of synthetic leucopterin was enabled only recently by a complex chemical synthesis involving extreme heat treatments and strong acid and base32. Here, polycrystalline leucopterin aggregates (Fig. 4a) were extracted from dinoflagellates and the crystal structure was determined from three-dimensional electron diffraction (3D ED) data (Supplementary Figs. 21, 32 and 33 and Supplementary Text; Methods). This revealed a monoclinic (P2/c) leucopterin hemihydrate structure (Fig. 4a)—also found for the synthetic crystals32—in which the planar leucopterin molecules form one-dimensional H-bonded chains with water molecules (located on a twofold axis) H-bonded to the periphery of these chains. Neighboring leucopterin chains running in essentially perpendicular directions are connected by H-bonding to form a criss-cross arrangement (Fig. 4a). Broadening of the vibrational Raman band at 1,378 cm−1 and the merging of low-frequency bands is consistent with a hydrate structure (Fig. 3b, column III).

a, Top left: TEM image of extracted leucopterin spherulites composed of needle-like crystals. Right: crystal structure of leucopterin hemihydrate showing the H-bonding arrangement involving leucopterin chains and water molecules viewed along the b-axis. Bottom left: ‘criss-cross’ arrangement of H-bonded chains viewed along the c-axis. b, Top left: TEM image of extracted xanthine spherulites. Right: a single H-bonded sheet in the crystal structure of biogenic xanthine. Bottom left: crystal structure of biogenic xanthine crystals viewed along the b-axis. c, Brightfield (BF) and polarized (Pol) optical microscopy images of intracellular xanthine spherulites in the absence and presence of cerulenin. d, TEM images of extracted guanine spheroids show the effect of cerulenin on the size, polydispersity and morphology of the spheroids. e, Diameter of biogenic guanine spheroids and xanthine spherulites as a function of the concentration of the compound in the growth medium after 1 h of accumulation in the presence and absence of cerulenin. f, FDTD simulated reflectance spectra of particle assemblies with 65% filling fraction, 25% polydispersity, in an air medium as a function of particle size. The isotropic and birefringent particles represent the experimentally obtained guanine and xanthine particles, respectively. Each experimental condition (that is, N-heterocycle, cerulenin) was replicated independently (n = 4) screening hundreds of cells by optical microscopy; ~100 extracted spheroids and spherulites were examined by TEM.
Biogenic xanthine crystals serve as a reflective material in the mirrored eyes of certain insects33,34 and form renal stones in humans and bladder stones in other mammals35. The crystal structure of biogenic xanthine remained elusive due to the minute quantities of available biogenic crystals and their sensitivity under electron beam illumination34. In A. carterae, xanthine assembles into polycrystalline birefringent spherulites (Figs. 3d and 4b) that precluded crystal structure determination by 3D ED. However, A. carterae could be induced to form sufficiently large quantities of xanthine crystals to record a high-resolution powder X-ray diffraction (PXRD) pattern for a polycrystalline sample of the extracted crystals (Supplementary Fig. 23). Profile fitting and unit cell refinement (Supplementary Fig. 22) showed that the biogenic xanthine crystals have the same monoclinic crystal structure as synthetic xanthine crystals35,36 (Fig. 4b and Supplementary Figs. 22 and 23), which is based on stacking of planar H-bonded sheets parallel to the ((10bar{1})) plane (Supplementary Text; Methods). We note that during the review of this paper another paper was published on the crystal structure of biogenic xanthine in insects (jumping bristletails)37. The structure is different from the one we found here.
Biosynthesis of molecular crystals with tailored morphologies
Due to their high refractive indices, biogenic molecular crystals are highly promising biocompatible alternatives to toxic inorganic optical materials38,29. One exceptional example is crystalline isoxanthopterin nanospheres, which generate visual and coloration effects in crustaceans29,39,40,41. The nanospheres are composed of concentric lamellae of crystal plates whose high RI face (n = 1.96) is aligned tangentially to the particle surface, creating a highly birefringent spherulite with enhanced optical scattering efficiency29,40,42. Alus et al. used a multistep emulsion-based method to generate synthetic (core-shell) guanine mimics of these spherulites, which produced particles too large, and with shells too thin, to scatter light efficiently in the visible range17. In general, synthetic strategies for controlling the morphological and optical properties of bioinspired molecular crystals17,18,19,21 require extreme pH and/or organic solvents and typically lack precise control over crystal properties displayed by organisms43,44. Recently, guanine crystals were synthesized in vitro by an enzymatic reaction at physiological pH, but the method still lacks control over crystal morphology45.
Here we found that the properties of birefringent spherulites, naturally formed by A. carterae (Fig. 3d) can be manipulated effectively in vivo. The size of xanthine spherulites in A. carterae (Fig. 3d) can be controlled simply by changing the concentration of xanthine in the growth medium, the accumulation time (Supplementary Fig. 24), or by the addition of cerulenin—a fatty acid/ketosynthase inhibitor46 (Fig. 4c,d and Supplementary Fig. 25). Cerulenin probably influences spherulite size by perturbing the synthesis of lipids required for the formation of the membrane-bound uptake vacuoles. The same strategies were used to control the size and morphologies of polycrystalline guanine spheroids (Fig. 4d,e and Supplementary Fig. 26). Shorter accumulation times and lower concentrations of xanthine/guanine decrease the particle size, and incubation with cerulenin transforms irregular-shaped ellipsoids into uniform spherical particles with smaller sizes and lower polydispersity (Fig. 4c,d and Supplementary Figs. 24 and 25). The ability to assemble birefringent spherulites with defined dimensions offers a biological route to visible-range reflectors synthesized in aqueous media.
Optical properties of cell-derived spherulites and spheres
Next, we explored how the scattering properties of dinoflagellate-derived xanthine spherulites and guanine spheres may be tuned by controlling their size. ED patterns of xanthine spherulites (Supplementary Fig. 18) show that the π-stacking axis of the crystals is oriented radially to the particle surface, whereas the perpendicular H-bonding plane is oriented tangentially. Density functional theory (DFT) was used to compute the average refractive indices parallel and perpendicular to the H-bonded plane of xanthine crystals, giving values of nt = 2.06 and nr = 1.45, respectively, displaying an extreme birefringence (Δn = 0.61)47. In contrast, polycrystalline guanine spheres are optically isotropic, with an effective RI of n = 1.72 (the average of the in- and out-of-plane refractive indices of guanine, nbc = 1.83, na = 1.46)48. To investigate the optical scattering properties of single particles, we performed calculations using Mie theory and computations using the finite-difference time-domain (FDTD) method49,50, incorporating the refractive indices, sizes and birefringence of the particles above (Supplementary Fig. 27). As expected, the scattering resonance peak of both birefringent and isotropic particles redshifts from ~400 nm to the infrared as the size increases from 300 to 1,300 nm (ref. 41) (Supplementary Fig. 27). To elucidate the optical properties of particle assemblies (for example, thin film behavior), we used molecular dynamics (MD) simulations to generate random assemblies of particles (with sizes and polydispersities similar to those obtained experimentally) and computed the reflectance properties using FDTD29,41 (Fig. 4e). Simulations show that disordered assemblies of such particles generate intense broad-band (white) reflectance across the visible and that particle size has a stronger effect on reflectance intensity in birefringent assemblies (Fig. 4e). The reflectance of the birefringent assemblies is 20–30% higher than the isotropic assemblies in the visible range (Supplementary Fig. 28), due to the high tangential RI of the birefringent particles (nt = 2.06)40. In the near infrared (>700 nm), isotropic assemblies show a broad-band reflection across the entire simulated region (Fig. 4f). In contrast, for small particle sizes <400 nm, birefringent assemblies show a sharp decrease in reflectance at longer wavelengths (Fig. 4f), indicating that birefringent assemblies may be applied as band filters, delivering strong reflectance in the visible while achieving maximum transmittance in the infrared.
Discussion
The results presented highlight the use of dinoflagellates for the biosynthesis of reflective, birefringent nanospheres analogous to those discovered recently in shrimp29,41. The optical anisotropy of these particles increases dramatically their scattering efficiency at high packing densities, making them ideal replacements for inorganic scattering materials29,40. The ability to control particle size also paves the way for downstream processing of nanospheres into broad-band or narrow-band (for example, with filtering) reflective assemblies with tunable reflectance across the visible and infrared. We anticipate that the biosynthetic approach shown here at the laboratory scale may be scaled up using photobioreactor methods for A. carterae51. For translation toward practical production of molecular crystals, two key steps will require further optimization: first, the generalization of crystal extraction protocols for different crystal types and, second, the development of methods for the formation of crystal assemblies into photonic superstructures. In the present study, the most effective way of controlling spherulite and sphere size was by inhibition of lipid synthesis using cerulenin; future work will explore additional chemical and genetic perturbations that influence vacuole size and acidity, guanine transport and guanine biosynthesis. A limitation of the current study is that the molecular mechanisms underlying N-heterocycle transport and crystallization have not been fully resolved. These processes will be investigated in future work, including in other microalgae model species. In addition, the origins of the distinct crystal morphologies formed by different N-heterocycles remain largely unexplored here. We hypothesize that differences in local supersaturation (within the uptake vacuole) play a central role, and this will be examined in future studies through direct comparison with in vitro crystallization under controlled conditions.
This study establishes that the formation and dissolution of N-heterocyclic crystals is a general strategy for the metabolism of low molecular weight DON by dinoflagellates, potentially explaining their ability to survive in nitrate/ammonium-depleted waters11,52. The ability to ‘induce’ crystallization in dinoflagellates offers an innovative route towards many optically functional molecular crystals from aqueous solutions—a feat yet to be achieved in vitro. The flexibility of this system, demonstrated by diversity of crystal compositions and morphologies, enables the optical properties of crystalline materials to be tuned with high control. This system may also be applied for the bioremediation of toxic organic contaminants in aquatic environments (for example, melamine) and the synthesis of N-rich pharmaceutical crystals (for example, fluorocytosine) (Supplementary Fig. 29).
Methods
Cultivation of A. carterae
A. carterae from the National Center for Marine Algae and Microbiota (CCMP1314) were cultivated using f/2 medium. The cultivation regime was 14 h light/10 h dark illumination. The irradiance was 40 μmol (photons) m−2 s−1 generated by a white-light emitting diode. The f/2 growth medium was prepared with the following dry salts per liter: 400 mM NaCl, 10 mM KCl, 9 mM CaCl2·2H2O, 20 mM MgCl2·6H2O, 20 mM MgSO4·7H2O and 1.85 mM KBr. The following nutrients were first dissolved separately and then added in final concentrations of 88.3 × 10⁻⁵ M NaNO3, 3.62 × 10⁻⁵ M NaH2PO4·H2O, 1.06 × 10⁻⁴ M Na2SiO3·9H2O, 2 × 10⁻⁴ M H3BO3, 9.89 × 10⁻⁹ M Selene, 1.03 mM Tris (hydroxymethyl). The following trace metals (made separately): 1.18 × 10⁻⁵ M FeCl3·6H2O, 1.51 × 10⁻⁵ M Na2EDTA·2H2O, 3.93 × 10⁻⁸ M CuSO4·5H2O, 2.60 × 10⁻⁸ M Na2MoO4·2H2O, 7.65 × 10⁻⁸ M ZnSO4·7H2O, 4.20 × 10⁻⁸ M CoCl2·6H2O and 9.10 × 10⁻⁷ M MnCl2·4H2O. The following vitamins were also added at final concentrations of 2.96 × 10⁻⁷ M thiamine HCl (vitamin B1), 2.56 × 10⁻⁹ M biotin (vitamin H) and 4.61 × 10⁻¹⁰ M cyanocobalamin (vitamin B12). Finally, 20 ml of NaHCO3 2 mM was filtered (0.22 μm) directly into the prepared medium. Suspension culture flasks (250 ml) were used with a filter screw cap (CELLSTAR).
Intracellular uptake of different N-heterocycles in A. carterae
For uptake experiments (n = 4 for each compound), the nitrate in the growth medium was replaced with one of the N-heterocyclic compounds (purines, pyrimidines or pteridines) at final concentrations of 40 μM for guanine, hypoxanthine, xanthine, uric acid, guanosine and melamine; 6 μM for pterin, isoxanthopterin, xanthopterin and leucopterin; 0.1 mM for theobromine and 1–20 mM for cytosine and 5-fluorocytosine. To remove any undissolved particles from the growth media, the solutions were placed in an ultrasonic bath and heated to 40–50 °C for 20–30 min. The solutions were then allowed to cool to room temperature for a few hours and passed through a 0.22-μm filter. The concentration of cells was kept constant at 2 × 10⁵ ml−1 and the experiments were carried out in 50-ml suspension culture flasks with a filter screw cap (CELLSTAR) filled with 20 ml of the prepared medium. A UV–vis spectrophotometer (Evolution 220, Thermo Fisher Scientific) was used to measure absorbance of the growth medium with the different nitrogenous compounds in the 230–350 nm range to monitor uptake. Hundreds of cells were screened in every experiment and, in all reported cases, over 90% of the cells grew crystals (Supplementary Fig. 30) as described in the main text. Accumulation of birefringent deposits in live A. carterae cells was monitored using a polarized light microscope (Zeiss AX10) equipped with a Zeiss Axiocam 705 color camera using transmission and polarization modes with ×5, ×10, ×20 and ×50 air objectives and a ×100 oil immersion objective.
The mass of the accumulated compound per cell can be calculated as the mass of the dissolved compound divided by the number of cells. For example, for 20 ml of growth medium with a concentration of 40 μM guanine, the mass of guanine is mguanine = 1.21 × 10⁻⁴ g. This value divided by the number of cells in the flask, 2 × 10⁵ cells, equates to ~30 pg of guanine per cell. Mojzes et al. showed that A. carterae cells could accumulate as much as 150 pg of guanine. The accumulated mass depends on the concentration of guanine or other N-heterocycle and number of cells per milliliter10.
Monitoring culture growth
To quantify the cell density of the cultures, the number of A. carterae cells was correlated to the absorbance of the chloroplasts. A UV–vis spectrophotometer (Evolution 220, Thermo Fisher Scientific) was used to measure absorbance of the culture at the 600–700 nm range. The number of cells was counted using a Brand Bürker Counting Chamber (Fisher Scientific) with the Zeiss AX10 microscope equipped with a Zeiss Axiocam 705 color camera and ×10 objective. We found the intensity of the absorbance at 673 nm was correlated with the number of cells according to the following equation: log(cells ml−1) = (log(A673 nm) + 6.05) / 0.92, similar to the correlation found by Hotos et al.53.
Extraction of accumulated N-heterocyclic crystals for imaging and structural analysis
Once a culture had sufficient time to accumulate crystalline deposits, the microalgae were collected by centrifugation. After centrifugation at 10,000g for 5 min at 4 °C, the supernatant was discarded, and the cell pellet was washed with double distilled water (DDW) to remove salts originating from the growth medium and begin cell lysis. The number and volume of DDW washes (generally two to three) may change according to the solubility of the crystalline material and the observed impurities present in the final samples (as viewed by transmission electron microscopy (TEM)). To prevent enzymatic activity that may damage the crystalline inclusions, 1 µl 100× protease inhibitor was added to 5 ml of washed cells. Cell lysis was completed by probe sonication on ice (40% amplitude, 10 s on/12 s off cycle for 2 min ‘on’ time). The lysate was purified using a differential centrifugation at 10,000g for 3 min at 4 °C. The pellet was suspended in ca. 150–200 µl DDW and incubated for 3 h with 200 µl with α-amylase from Bacillus sp., at 75 mg ml−1 (Sigma Aldrich, Cat. no. 9000-90-2) at room temperature to digest the starch granules produced by the cells. Following another centrifugation and resuspension, the sample was loaded on a sucrose gradient. The sucrose gradient was composed of three 300-µl density layers: 60, 40, 20 w/w% sucrose solutions. Gradient centrifugation was carried out at 2,000g for 30 min at 4 °C and the resulting pellet was mostly the pure crystalline deposits. Improved separation of the crystals from the starch granules was achieved using a second sucrose gradient, composed of three 300-µl density layers: 65, 60, 30 w/w% sucrose solutions. Gradient centrifugation was carried out at 800g for 40 min at 4 °C and resulted in distinct separation of starch granules (60% layer) from the crystals (bottom of 65 w/w% layer). The resulting pellet was mostly the pure crystalline deposits. Finally, one to two washes with ca. 150–200 µL DDW were performed with centrifugation at 20,000g for 3 min at 4 °C between every wash. This pelleted the extracted crystalline deposits. In general, wherever possible the protocol was performed on ice with chilled DDW, whereas the enzyme incubation was conducted at room temperature.
A Tecnai T12 G2 TWIN TEM operating at 120 kV was used for the imaging of the extracted deposits. Images and ED patterns were recorded using a Gatan 794 MultiScan CCD camera. ED was analyzed using Gatan Digital Micrograph software (GMS v.1.4.5) within the DIFPack module. Images and ED patterns were recorded with consideration of potential beam damage to the sample, thus appropriate illumination conditions (spot size) were used to avoid it.
Control of guanine and xanthine spherulite sizes using cerulenin
A stock solution of cerulenin (Sigma Aldrich, Cat. no. 17397-89-6) in dimethylsulfoxide at a concentration of 40 mg ml−1 was prepared and stored at −20 °C. In 50-ml suspension culture flasks, stationary stage cells at a concentration of 2 × 10⁵ ml−1 were incubated for 1 h with 60 μM of cerulenin in a f/2 medium without a nitrogen source. The cells were then gently pelleted by centrifugation at 4,000g for 2 min at room temperature and the f/2 medium was replaced with one containing guanine or xanthine as a nitrogen source at concentrations between 5 and 40 μM and 60 μM of cerulenin. The cells were then allowed to accumulate crystals for times between 15 min and 240 min (Supplementary Fig. 24). For optical microscopy, the accumulation was stopped by a second medium replacement to a medium not containing the nitrogen source. Accumulated spherulites were then extracted according to the protocol above.
Cryo-SEM—sample preparation and imaging
A concentrated pellet of A. carterae cells (centrifuged 800g, 3 min) was sandwiched between two aluminum disks (25 μm thick) and cryo-immobilized in a high-pressure freezing device (EM ICE, Leica). The frozen samples were then mounted on a holder under liquid nitrogen in a specialized loading station (EM VCM, Leica) and transferred under cryogenic conditions (EM VCT500, Leica) to a sample preparation freeze fracture device (EM ACE900, Leica). There, samples are held under vacuum at a temperature of −120 °C. Samples are fractured by hitting the top disc carrier with a tungsten knife at a speed of 150 mm s−1, exposing a clean fracture plane that can be imaged. The samples were then etched for 6 min at −110 °C to uncover additional structural details of the sample by controlled evaporation of water. Finally, the samples were coated with 3 nm of PtC. Samples were imaged using a HRSEM Gemini 300 SEM (Zeiss with SmartSEM software) by secondary electron in-lens detector while maintaining an operating temperature of −120 °C.
Raman microscopy—measurements and analysis
Depending on the cell density, the cells contained in 200–600 µl of culture medium were collected by a gentle centrifugation (3,000g, 30 s). The volume of the supernatant was reduced to approximately 15 µl and the pellet was resuspended by gentle shaking. A 5 μl aliquot of the concentrated cell suspension was mixed with 5 μl of 1% low-melting agarose dissolved in artificial seawater, homogenized gently and spread onto a quartz microscope slide, covered with a quartz coverslip (diameter: 20 mm; thickness: 0.18 µm) and sealed with CoverGrip (Biotium). Immobilization of cells before Raman mapping using low-melting agarose was necessary due to the ability of A. carterae to actively move using their flagella. Raman mapping of the cells was performed using a confocal Raman microscope (WITec alpha300 RSA, Oxford Instruments–WITec) equipped with a ×60 water-immersion objective UPlanSApo, numerical aperture 1.2 (Olympus). For Raman excitation, 532 nm and 830 nm lasers with powers of 20 mW and 40 mW at the focal plane, respectively, were used. Raman mapping was performed with a scanning step of 200 nm in both directions and integration time of 100 ms per voxel.
Before measurements with 532 nm excitation, the autofluorescence of the photosynthetic apparatus was removed by a low-power wide-area photobleaching applying the procedure described previously10,54. Excitation at 532 nm allowed high-quality Raman spectra not only of crystalline inclusions, but also of other biomolecules present in cells, for example, lipid droplets, starch grains, mitochondria and cell walls. However, this excitation was not suitable for monitoring pteridines exhibiting strong and persistent autofluorescence. In addition, we observed that crystals of more soluble substances (for example, cytosine or uric acid) often dissolved gradually when excited at 532 nm, probably due to slight local heating by the excitation beam. To avoid problems with any autofluorescence and thermally induced crystal dissolution during longer mapping, we used 830 nm excitation. This excitation allowed us to obtain consistent Raman spectra of all studied compounds within the cells without observable cell photobleaching. In cases where it was possible to use both 532 and 830 nm excitations, the results led to the same conclusions. On average, 10–15 cells from each cell culture were measured in at least three independent replicates to ensure that conclusions regarding the occurrence of crystalline structures under given conditions were sufficiently statistically significant. Reference spectra of all pure compounds were obtained from commercial powders deposited directly on a quartz microscope slide or from microcrystals formed by evaporation from their solutions in deionized water. The reference spectra were obtained with the same excitation and detection conditions used for measuring the cells. In such a case, dry objective ×50 EC Epiplan-Neofluar, numerical aperture 0.55 (Zeiss) was used.
Data were analyzed using WITec Project SIX Plus v.6.2 software (Oxford Instruments–WITec) by implementing the following steps: advanced cosmic ray removal, background subtraction, cropping of the spectral edges affected by detector margins and spectral demixing with the True Component Analysis tool (Oxford Instruments–WITec). Raman chemical maps were constructed from the spatial distribution of the demixed spectral components and typical spectra of the compounds within cells were compared with the references.
Structure determination of biogenic leucopterin and xanthine crystals with 3D ED and PXRD
For extracted biogenic leucopterin crystals, 3D ED data were recorded at room temperature on an ELDICO ED-1 electron diffractometer. The device was equipped with a LaB6 source operating at an acceleration voltage of 160 kV (λ = 0.02851 Å). For the data collection and initial data assessment, the software Eldix was used. Crystals were mapped and centered in scanning TEM imaging mode using a single diode brightfield detector and 3D ED data were collected in diffraction mode (parallel beam, beam size of approximately 800 nm) with a hybrid-pixel detector (Dectris QUADRO). 3D ED data collection was performed under continuous rotation with an angular step of 0.5° per frame and an exposure time of 0.5 s per frame. The electron dose was 0.01 el Å−2 s−1 and each measurement lasted 120 s per crystal for a rotation range from −60° to +60°.
For PXRD, extracted samples of biogenic leucopterin crystals and biogenic xanthine crystals were compacted into 0.3-mm diameter borosilicate glass capillaries. PXRD data were recorded on the Materials Science/PXRD beamline at the SESAME synchrotron using radiation with wavelength 0.82491 Å. For each measurement, the sample was placed at a distance of 740.4 mm from a Pilatus 300 K area detector of 172 μm pixel size. The area detector covered 6.4° and was used to collect PXRD data from 2θ = 4.3° to 28° for xanthine and from 2θ = 7.3° to 31° for leucopterin (four frames) with an exposure time collected per detector frame of 1,800 s to 2,000 s, with 7 s between frames. The PXRD data were recorded in transmission mode at room temperature. A NIST (640 f) Si standard was used to calibrate the instrument, and the lattice parameter of Si was used to determine the exact wavelength during the measurements. The detector was set to collect a diffraction image every 6°, and the collected images were then processed to extract the merged diffraction pattern through an Image J scripting mode. Crystal structure determination of biogenic leucopterin was based on a multi-technique strategy combining analysis of 3D ED and powder XRD data, augmented by periodic DFT-D calculations. Accurate unit cell parameters were determined by profile fitting of powder XRD data using the Le Bail technique in the program GSAS. Structure solution from 3D-ED data was carried out using the direct-space genetic-algorithm technique in the program EAGER, followed by structure refinement from 3D-ED data using SHELX55. Structure validation included periodic DFT-D geometry optimization of the refined structure using CASTEP56, which led to only minor atomic displacements. Structural analysis of biogenic xanthine focused on powder XRD data recorded at ambient temperature, which was observed to match the powder XRD pattern corresponding to the known crystal structure of synthetic xanthine35. Accurate unit cell parameters for the biogenic sample determined from powder XRD data by profile fitting (using the Le Bail technique) are in close quantitative agreement with those reported (at ambient temperature) for synthetic xanthine35, supporting the conclusion that the biogenic and synthetic materials represent the same crystalline phase of xanthine with the same crystal structure. Additional details of the analysis are discussed in Supplementary Text.
Single-crystal XRD of synthetic and biogenic cytosine crystals
Biogenic cytosine crystals
A single-crystal XRD experiment was conducted on a sample of A. carterae cells 24 h after transfer to a growth medium containing cytosine as the sole nitrogen source. The algae were concentrated by centrifugation (3,500 rpm, 3 min) in an Eppendorf tube, and a small droplet of the concentrated sample was mounted onto a CrystalCap ALS HT cryo-loop for data collection at 100 K. Data were collected using a Rigaku XtaLAB Synergy-S single-crystal X-ray diffractometer equipped with a HyPix-Arc 100° detector and a standard Cu Kα X-ray radiation source (λ = 1.5148 Å). Data analysis was carried out using the CrysAlis PRO software package (v.1.171.43.134a, released 2024). This setup enabled the identification of diffraction spots from internal crystalline structures formed within the algae. It is worth noting that extensive efforts were made to characterize the internal crystal formed within the algae using various complementary techniques, but only the single-crystal XRD method at 100 K yielded reliable results.
Synthetic cytosine crystals
Single crystals of cytosine monohydrate were grown from a saturated solution of cytosine in DDW left uncovered overnight. A colorless crystal with the shape of a rectangular plate (0.531 × 0.226 × 0.084 mm3) of C4H7N3O2 was mounted on a CrystalCap ALS HT cryo-loop mount for data collection at 293 K on a Rigaku XtalLAB Synergy-S single-crystal X-ray diffractometer, which includes an HyPix-Arc 100° detector and a standard detector and a standard Mo Kα x-ray radiation source (λ = 0.71073 Å). Unit cell dimensions, space group assignment, data reduction and finalization were done using the CrysAlis PRO software package (v.1.171.43.134a, released 2024). A total of 6,366 reflections were collected, of which 1,931 were used after merging by SHELXL55 according to the crystal class and based on Friedel pair equivalency for structure solution. Gaussian correction was done using a multifaceted crystal model and empirical absorption correction was done using spherical harmonics (SCALE3 ABSPACK—an Oxford Diffraction program v.1.0.4; Oxford Diffraction Ltd., 2005). The structure was solved in the monoclinic P21/c space group (no. 14) by SHELXT using intrinsic phasing and refined by SHELXL using a full-matrix least-squares technique.
Calculation of the refractive index for the crystal structure of xanthine
DFT calculations were performed using v.24 of the CASTEP software56. The XRD crystal structure was used as the starting point for a geometry optimization, allowing all unit cell and internal coordinates to vary. The PBE exchange-correlation functional57 with Tkatchenko−Scheffler dispersion corrections58 was employed together with Vanderbilt Ultrasoft pseudopotentials59 in CASTEP’s on-the-fly generated implementation. Calculations used a 700 eV plane wave cutoff energy and the Brillouin Zone was sampled at a density of 0.05 Å−1. The dielectric function and hence the RI was obtained in a single-particle formulation. The electronic states were obtained from DFT using the parameters described above. The OptaDOS code47 was used to calculate the dielectric function. The calculations were carefully checked to ensure converge with Brillouin zone sampling and the number of unoccupied states. The dielectric function was obtained in the direction perpendicular to the molecular plane and as an average within the molecular plane.
MD and FDTD
MD simulations were carried out using HOOMD-blue (v.2.9.4)60 with the Langevin integrator (kT = 0.05) and polydisperse 12–0 softcore pair-potential using the PolydisperseMD v.2.9 plugin61. Particle sizes di were sampled randomly from a log-normal distribution, with mean
$${mu }_{2}=log left({mu }_{1}^{2}/sqrt{{mu }_{1}^{2}+{s}_{1}^{2}}right)$$
and
$${sigma }_{2}^{2}=log left(1+{sigma }_{1}^{2}/{{rm{mu }}}_{1}^{2}right)$$
where µ1 and s1 are the mean particle diameter and polydispersity. The di values outside range (100 nm, 1,300 nm) were rounded to the nearest boundary to avoid the chance of extreme particle sizes. Simulations were initiated with random placement of particles in a 20 × 20 × 20 μm3 box with periodic boundary conditions, and relaxed with Gaussian softcore repulsive potential, then squeezed to a final 5 × 5 × 5 μm3 volume during 7.5 × 10⁵ time steps under the 12–0 pair-potential. Particle coordinates and diameters were then imported to Lumerical FDTD (Ansys), v.2024-R1.3 and the optical properties were set to either constant n or spatially varying spherically symmetric RI with diagonal permittivity tensor
$$epsilon =left(begin{array}{rcl}{n}_{t}^{2} & 0 & 0\ 0 & {n}_{t}^{2} & 0\ 0 & 0 & {n}_{r}^{2}end{array}right)$$
for isotropic and birefringent particles, respectively, where n, nt and nr are the averaged, tangential and radial RI. In the FDTD simulation setup, periodic boundary conditions in the x- and y-directions, a plane wave source and a reflectance monitor above particles in the z-direction were used to obtain reflectance values comparable to an integrating sphere measurement (Supplementary Fig. 31). A filling fraction of 65% was chosen to represent packed extracted particles in air. The recorded reflectance was integrated in Lumerical over the 5 × 5 μm2 monitor area and normalized with respect to the source power. The slow optical axis (tangential direction) was oriented parallel to the particle surface, consistent with the radial π-stacking determined by ED.
Reporting summary
Further information on research design is available in the Nature Portfolio Reporting Summary linked to this article.
Data availability
All the data generated for this work are available in the manuscript and supporting information. Code used for carrying out the simulations can be accessed from Zenodo62. CSD deposition number for leucopterin hemihydrate determined in this work is 2446747. Microscopy images are presented as acquired with the addition of pseudocoloring only for readability purposes, uncolored images are available upon request.
References
-
Gur, D., Palmer, B. A., Weiner, S. & Addadi, L. Light manipulation by guanine crystals in organisms: biogenic scatterers, mirrors, multilayer reflectors and photonic crystals. Adv. Funct. Mater. 27, 1603514 (2017).
-
Palmer, B. A., Gur, D., Weiner, S., Addadi, L. & Oron, D. The organic crystalline materials of vision: structure–function considerations from the nanometer to the millimeter scale. Adv. Mater. 30, 1800006 (2018).
-
Wagner, A., Wen, Q., Pinsk, N. & Palmer, B. A. Functional molecular crystals in biology. Isr. J. Chem. 61, 668–678 (2021).
-
Addadi, L., Kronik, L., Leiserowitz, L., Oron, D. & Weiner, S. Organic crystals and optical functions in biology: knowns and unknowns. Adv. Mater. 36, 2408060 (2024).
-
Teyssier, J., Saenko, S. V., Van Der Marel, D. & Milinkovitch, M. C. Photonic crystals cause active colour change in chameleons. Nat. Commun. 6, 6368 (2015).
-
Palmer, B. A. et al. The image-forming mirror in the eye of the scallop. Science 358, 1172–1175 (2017).
-
Pilátová, J., Pánek, T., Oborník, M., Čepička, I. & Mojzeš, P. Revisiting biocrystallization: purine crystalline inclusions are widespread in eukaryotes. ISME J. 16, 2290–2294 (2022).
-
Bar-On, Y. M. & Milo, R. The global mass and average rate of rubisco. Proc. Natl Acad. Sci. USA 116, 4738–4743 (2019).
-
Falkowski, P. The power of phytoplankton. Nature 483, S17–S20 (2012).
-
Mojzeš, P. et al. Guanine, a high-capacity and rapid-turnover nitrogen reserve in microalgal cells. Proc. Natl Acad. Sci. USA 117, 32722–32730 (2020).
-
Broek, T. A. B. et al. Dominant heterocyclic composition of dissolved organic nitrogen in the ocean: a new paradigm for cycling and persistence. Proc. Natl Acad. Sci. USA 120, e2305763120 (2023).
-
Hutchins, D. A. & Capone, D. G. The marine nitrogen cycle: new developments and global change. Nat. Rev. Microbiol. 20, 401–414 (2022).
-
Davy, S. K., Allemand, D. & Weis, V. M. Cell biology of cnidarian–dinoflagellate symbiosis. Microbiol. Mol. Biol. Rev. 76, 229–261 (2012).
-
Wiedenmann, J. et al. Reef-building corals farm and feed on their photosynthetic symbionts. Nature 620, 1018–1024 (2023).
-
LaJeunesse, T. C. et al. Systematic revision of symbiodiniaceae highlights the antiquity and diversity of coral endosymbionts. Curr. Biol. 28, 2570–2580 (2018).
-
Yalkowsky, S. H., He, Y. & Jain, P. Handbook of Aqueous Solubility Data (CRC Press, 2010).
-
Alus, L. et al. Bio-inspired crystalline core-shell guanine spherulites. Adv. Mater. 36, 202308832 (2024).
-
Wittig, N. K., Christensen, T. E. K., Grünewald, T. A. & Birkedal, H. Vase-like β-polymorph guanine crystal aggregates formed at the air-water interface. ACS Mater. Lett. 2, 446–452 (2020).
-
Wagner, A. et al. Rationalizing the influence of small-molecule dopants on guanine crystal morphology. Chem. Mater. 36, 8910–8919 (2024).
-
Gur, D. et al. Guanine crystallization in aqueous solutions enables control over crystal size and polymorphism. Cryst. Growth Des. 16, 4975–4980 (2016).
-
Chen, F., Guo, D., Gao, J. & Ma, Y. Bioinspired crystallization of guanine. J. Phys. Chem. Lett. 12, 11695–11702 (2021).
-
Jantschke, A. et al. Anhydrous β-guanine crystals in a marine dinoflagellate: structure and suggested function. J. Struct. Biol. 207, 12–20 (2019).
-
Indri, S. S. et al. Guanine crystallization by particle attachment. J. Am. Chem. Soc. 147, 19139–19147 (2025).
-
Goodenough, U., Roth, R. & Lee, J. H. Guanine storage vacuoles sequester guanine crystals and serve as nitrogen reserves in Chlamydomonas reinhardtii. Proc. Natl Acad. Sci. USA 122, e2522352122 (2025).
-
Antia, N. J., Harrison, P. J. & Oliveira, L. The role of dissolved organic nitrogen in phytoplankton nutrition, cell biology and ecology. Phycologia 30, 1–89 (1991).
-
Cowie, D. B. & Bolton, E. T. The use of metabolic pools of purine compounds for nucleic acid synthesis in yeast. Biochim. Biophys. Acta 25, 292–298 (1957).
-
Pettersen, R. & Knutsen, G. Uptake of guanine by synchronized Chlorella fusca. Arch. Microbiol. 96, 233–246 (1974).
-
Shah, N. & Syrett, P. J. Uptake of guanine by the diatom, Phaeodactylum tricornutum. J. Phycol. 18, 579–587 (1982).
-
Lemcoff, T. et al. Brilliant whiteness in shrimp from ultra-thin layers of birefringent nanospheres. Nat. Photonics 17, 485–493 (2023).
-
Barzilay, Y. et al. Specialized molecular pathways drive the formation of light-scattering assemblies in leucophores. Proc. Natl Acad. Sci. USA 122, e2424979122 (2025).
-
Heal, K. R. et al. Marine community metabolomes carry fingerprints of phytoplankton community composition. mSystems 6, e01334–20 (2021).
-
Bravetti, F. et al. Leucopterin, the white pigment in butterfly wings: structural analysis by PDF fit, FIDEL fit, Rietveld refinement, solid-state NMR and DFT-D. IUCrJ 10, 448–463 (2023).
-
Böhm, A. & Pass, G. The ocelli of Archaeognatha (Hexapoda): functional morphology, pigment migration and chemical nature of the reflective tapetum. J. Exp. Biol. 219, 3039–3048 (2016).
-
Friedman, O. et al. Structural organization of xanthine crystals in the median ocellus of a member of the ancestral insect group Archaeognatha. J. Struct. Biol. 214, 107834 (2022).
-
Hughes, C. E. et al. Solid-state structure of xanthine determined by a combination of 3D electron diffraction, powder X-ray diffraction, and DFT-D calculations. Cryst. Growth Des. 25, 895–902 (2025).
-
Leung, H. W. et al. Revealing the crystal structure of the purine base xanthine with three-dimensional (3D) electron diffraction. Cryst. Growth Des. 25, 1293–1298 (2025).
-
Ifliand, M. et al. Discovering the crystal structure of biogenic xanthine crystals. Cryst. Growth Des. 25, 7524–7536 (2025).
-
Niazov-Elkan, A. et al. Surface-guided crystallization of xanthine derivatives for optical metamaterial applications. Adv. Mater. 36, e2306996 (2024).
-
Palmer, B. A. et al. Optically functional isoxanthopterin crystals in the mirrored eyes of decapod crustaceans. Proc. Natl Acad. Sci. USA 115, 2299–2304 (2018).
-
Palmer, B. A. et al. A highly reflective biogenic photonic material from core-shell birefringent nanoparticles. Nat. Nanotechnol. 15, 138–144 (2020).
-
Shavit, K. et al. A tunable reflector enabling crustaceans to see but not be seen. Science 379, 695–700 (2023).
-
Yallapragada, V. J. & Oron, D. Optical properties of spherulite opals. Opt. Lett. 44, 5860–5863 (2019).
-
Deis, R. et al. Genetic control over biogenic crystal morphogenesis in zebrafish. Nat. Chem. Biol. 21, 383–392 (2025).
-
Pinsk, N. et al. Biogenic guanine crystals are solid solutions of guanine and other purine metabolites. J. Am. Chem. Soc. 144, 5180–5189 (2022).
-
Tah Roy, B. et al. Guanine crystal formation at physiological pH. Cryst. Growth Des. 25, 4316–4324 (2025).
-
Haq, S. et al. Investigating a multi-domain polyketide synthase in Amphidinium carterae. Mar. Drugs 21, 425 (2023).
-
Morris, A. J., Nicholls, R. J., Pickard, C. J. & Yates, J. R. OptaDOS: a tool for obtaining density of states, core-level and optical spectra from electronic structure codes. Comput. Phys. Commun. 185, 1477–1485 (2014).
-
Greenstein, L. M. Nacreous pigments and their properties. Proc. Sci. Sect. Toilet Goods Assoc. 45, 20–26 (1966).
-
McCoy, D. E., Shneidman, A. V., Davis, A. L. & Aizenberg, J. Finite-difference time-domain (FDTD) optical simulations: a primer for the life sciences and bio-inspired engineering. Micron 151, 103160 (2021).
-
Yee, K. S. Numerical solution of initial boundary value problems involving Maxwell’s equations in isotropic media. IEEE Trans. Antenna Propagation 3, 302–307 (1966).
-
Fuentes-Grünewald, C., Bayliss, C., Fonlut, F. & Chapuli, E. Long-term dinoflagellate culture performance in a commercial photobioreactor: Amphidinium carterae case. Bioresour. Technol. 218, 533–540 (2016).
-
Caron, D. A. Mixotrophy stirs up our understanding of marine food webs. Proc. Natl Acad. Sci. USA 113, 2806–2808 (2016).
-
Hotos, G. N., Avramidou, D. & Bekiari, V. Calibration curves of culture density assessed by spectrophotometer for three microalgae (Nephroselmis sp., Amphidinium carterae and Phormidium sp.). Eur. J. Biol. Biotechnol. 1, 132 (2020).
-
Moudříková, Š, Nedbal, L., Solovchenko, A. & Mojzeš, P. Raman microscopy shows that nitrogen-rich cellular inclusions in microalgae are microcrystalline guanine. Algal Res. 23, 216–222 (2017).
-
Sheldrick, G. M. SHELXT—integrated space-group and crystal-structure determination. Acta Crystallogr. A 71, 3–8 (2015).
-
Clark, S. J. et al. First principles methods using CASTEP. Z. Kristallogr. 220, 567–570 (2005).
-
Perdew, J. P., Burke, K. & Ernzerhof, M. Generalized gradient approximation made simple. Phys. Rev. Lett. 77, 3865 (1996).
-
Tkatchenko, A. & Scheffler, M. Accurate molecular van der Waals interactions from ground-state electron density and free-atom reference data. Phys. Rev. Lett. 102, 073005 (2009).
-
Vanderbilt, D. Soft self-consistent pseudopotentials in a generalized eigenvalue formalism. Phys. Rev. B 41, 7892–7895 (1990).
-
Anderson, J. A., Glaser, J. & Glotzer, S. C. HOOMD-blue: A Python package for high-performance molecular dynamics and hard particle Monte Carlo simulations. Comput. Mater. Sci. 173, 109363 (2020).
-
Hasyim, M. PolydisperseMD. GitHub https://github.com/mandadapu-group/polydisperse-md/tree/polymd-hoomd-v2.9 (2022).
-
Wagner, A. et al. Data and code for “Harnessing microalgae for the biosynthesis of molecular crystals”. Zenodo https://doi.org/10.5281/zenodo.18340693 (2026).
Acknowledgements
We acknowledge M. Abdellatief and the SESAME synchrotron, Jordan, for provision of synchrotron time at the ID09-MS/XPD beamline; L. Samperisi from Eldico Scientific AG for 3D ED measurements; N. Yehuda for her advice on microalgae cultivation; and the computational resources provided by the Aalto Science-IT project. B.A.P. is the Nahum Guzik Presidential Recruit and recipient of the 2019 Azrieli Faculty Fellowship. A.W. is a recipient of an Azrieli Graduate Student Fellowship 2022/23. ERC Starting Grant (grant no. 852948, ‘CRYSTAL-EYES’), HFSP grant (grant no. RGP0037/2022) and ISF grant (grant no. 1565/22) were awarded to B.A.P. An Academy of Finland grant (no. 347789) was awarded to J.S.H. A Czech Science Foundation (grant no. 21-26115S) was awarded to P.M.
Ethics declarations
Competing interests
The authors declare no competing interests.
Peer review
Peer review information
Nature Biotechnology thanks the anonymous reviewers for their contribution to the peer review of this work.
Additional information
Publisher’s note Springer Nature remains neutral with regard to jurisdictional claims in published maps and institutional affiliations.
Supplementary information
Supplementary Information
Supplementary Text, Figs. 1–33, Tables 1–2 and References.
Reporting Summary
Supplementary Video 1
Bright field and polarized optical microscopy of A. cartarae 15 h following transfer into cytosine containing medium in real time taken with a ×100 oil immersion objective. It is possible to observe the large cytosine monohydrate crystals inside the cells as they actively swim.
Rights and permissions
Open Access This article is licensed under a Creative Commons Attribution 4.0 International License, which permits use, sharing, adaptation, distribution and reproduction in any medium or format, as long as you give appropriate credit to the original author(s) and the source, provide a link to the Creative Commons licence, and indicate if changes were made. The images or other third party material in this article are included in the article’s Creative Commons licence, unless indicated otherwise in a credit line to the material. If material is not included in the article’s Creative Commons licence and your intended use is not permitted by statutory regulation or exceeds the permitted use, you will need to obtain permission directly from the copyright holder. To view a copy of this licence, visit http://creativecommons.org/licenses/by/4.0/.
About this article

Cite this article
Wagner, A., Margalit, N., Fishman, Y. et al. Harnessing microalgae for the biosynthesis of molecular crystals. Nat Biotechnol (2026). https://doi.org/10.1038/s41587-026-03006-6
-
Received:
-
Accepted:
-
Published:
-
Version of record:
-
DOI: https://doi.org/10.1038/s41587-026-03006-6